Embed Size (px)
Citation preview
THE JOURNAL OF FINANCE • VOL. LIX, NO. 2 • APRIL 2004
The Information Content of ShareRepurchase Programs
GUSTAVO GRULLON and RONI MICHAELY∗
ABSTRACT
Contrary to the implications of many payout theories, we find that announcementsof open-market share repurchase programs are not followed by an increase in operat-ing performance. However, we find that repurchasing firms experience a significantreduction in systematic risk and cost of capital relative to non-repurchasing firms.Further, consistent with the free cash-flow hypothesis, we find that the market reac-tion to share repurchase announcements is more positive among those firms that aremore likely to overinvest. Finally, we find evidence to indicate that investors under-react to repurchase announcements because they initially underestimate the declinein cost of capital.
IN RECENT YEARS OPEN-MARKET share repurchase programs have become an impor-tant payout method for many U.S. firms. According to data from COMPUSTAT,between 1984 and 2000 corporations spent approximately 26 percent of theirtotal annual earnings on repurchases. Over 90 percent of these repurchaseswere open-market repurchase programs. Also, in 1999 and 2000, for the firsttime in history, industrial corporations spent more money on share repurchasesthan they did on dividends. Our objective in this paper is to better understandthe economic motivations behind the decision to repurchase shares.
Two major reasons for repurchasing shares are analyzed in the theoreticalliterature. The first is that management uses open-market share repurchasesto signal better prospects (Bhattacharya (1979), Miller and Rock (1985), andVermaelen (1984)).1 These papers suggest that repurchases can be used as acostly signal about future cash flows when markets are incomplete. As demon-strated by these papers, the repurchase decision can reveal information about
∗Grullon is from Rice University and Michaely is from Cornell University and IDC. We wouldlike to thank David Ikenberry; George Kanatas; Rick Ruback; Cliff Stephens; Michael Weisbach;Bill Weld; and seminar participants at Cornell University, Dartmouth College, Harvard BusinessSchool, Rice University, the SEC, University of Michigan, University of Missouri-Columbia, Uni-versity of North Carolina, University of Pennsylvania, the University of Utah, and the 1999 AFAMeetings for many useful comments and suggestions. Special thanks to Rick Green (the editor)and to an anonymous referee for many valuable comments and suggestions. The authors grate-fully acknowledge the contributions of I/B/E/S International, Inc. for providing earnings per shareforecast data, available through the Institutional Brokers Estimate System. Any errors are ourown.
1 See also Ofer and Thakor (1987), Constantinides and Grundy (1989), Hausch and Seward(1993), and Persons (1997).
651
652 The Journal of Finance
future earnings and profitability to the market. This idea that repurchases (anddividends) have information content is a given in corporate finance.
The second rationale behind the decision to repurchase is that share buy-backs can be used to reduce the amount of free cash flow at management’sdisposal. According to this explanation, firms repurchase their shares to miti-gate potential over-investment by management (Jensen (1986)). This free cash-flow hypothesis implies that firms that have been experiencing a reduction ingrowth opportunities and in return on assets (ROA) will be more likely to payout cash in the form of repurchases.
Our findings indicate that the cash-flow-signaling hypothesis cannot explainwhy firms repurchase their shares. The signaling hypothesis predicts that fu-ture earnings (and other profitability measures) should improve after sharerepurchase announcements. It also predicts that the information conveyed inthe repurchase should also have an impact on the market’s expectations of fu-ture profitability. We find no evidence that repurchasing firms experience animprovement in future profitability relative to their peer firms. In fact, someof the performance measures indicate that repurchasing firms underperformtheir peers. We also find that analysts revise their expectations downward afterthe announcement of a share repurchase program. Our findings regarding re-purchasing firms’ operating performance are also corroborated by Jagannathanand Stephens (2003), who examine open-market share repurchase announce-ments over the period 1991 to 1995 and find that earnings fall in the years afterthese events.2
Our empirical findings do provide support for Jensen’s (1986) free cash-flowhypothesis. We find that repurchasing firms reduce their current level of capitalexpenditures and research and development (R&D) expenses. Furthermore, wefind that the level of cash reserves on their balance sheets significantly declines.Finally, we find that the market reaction to share repurchase announcements isstronger among those firms that are more likely to overinvest. These findings,combined with the evidence on profitability, indicate that, as implied by thefree cash-flow hypothesis, firms increase their cash payouts in response to adeterioration in their investment opportunity set.
When are agency problems of free cash flow likely to arise? We suggest thatrepurchases may be associated with a firm’s transition from a higher growthphase to a lower growth phase. As firms become more mature, their invest-ment opportunity set becomes smaller. These firms have fewer options to grow,and their assets in place play a bigger role in determining their value, whichleads to a decline in systematic risk (see Berk, Green, and Naik (1999) fora thorough development of this idea). This transition manifests itself in a de-cline in risk, and by implication, in a decline in the cost of capital. The declining
2 Using a sample of 185 open-market share repurchases during the period 1978 to 1986, Bartov(1991) reports mixed results on the relation between earnings changes and repurchases. He findsthat relative to control firms, repurchasing firms experience an improvement in profitability inyear 0 (year of the event) and year 2, but experience a decline in profitability in year 1. Perhapsthose mixed results can be attributed to the small sample size used in this study.
The Information Content of Share Repurchase Programs 653
reinvestment rate also generates free cash flows, thus increasing the likelihoodof overinvestment by management. Indeed, at such a time it is more likely thatmanagers give out cash under the pressure of shareholders. Thus repurchasesmay be associated with a reduction in risk and may convey that managers willreduce their firms’ capital expenditures in response to the reduction in invest-ment opportunities.
The evidence corroborates the free cash-flow hypothesis along these dimen-sions. In examining the 6-year period around the repurchase announcement,we find that repurchasing firms experience a significant reduction in system-atic risk relative to non-repurchasing firms. The changes in systematic risktranslate to an economically significant decline in risk premium of 1.5 percenta year. Moreover, we also find that those firms experiencing a larger decline inrisk also experience a larger decline in capital expenditures and R&D expenses,consistent with the impact of a transition to a lower growth stage.
But then a question remains: if investment opportunities decline after sharerepurchase announcements, why would the market react positively to suchevents? Clearly, a reduction in investment opportunity set is not good news.Jensen (1986) explains the positive market reaction to such events by alludingto the notion that the market is already aware of the reduction in profitable in-vestments, and it reacts positively to share repurchase announcements becausethese events reduce the amount of free cash flows at management’s disposal.Thus, the news (about the repurchase in this case) is about the reduction inagency costs. Second, as argued in Grullon, Michaely, and Swaminathan (2002),it is quite possible that the market, at least to some degree, is more aware ofthe decline in profitability than of the decline in risk that is associated withthe decline in investments. The repurchase announcement makes the marketmore aware of both the decline in agency costs and the decline in risk.3 The evi-dence in this paper seems to support both explanations. While we find that themarket reaction to share repurchases is stronger among those firms that aremore likely to overinvest, we also find that this market reaction is negativelyrelated to the change in the cost of capital.
Our results, combined with the findings in the prior literature, enable us tocompare the changes in firms’ characteristics around open-market repurchaseswith the changes in characteristics around other payout events such as divi-dends and repurchase tender offers. This comparison can shed light on whetherfirms use those forms of payout under the same circumstances, and whetherthey are motivated, at least to some extent, by similar factors.
This analysis indicates strong similarities between firms that increase divi-dends and those that use open-market share repurchases: both types of firmsdo not experience an increase in profitability, and at times, even see a de-crease in profitability (e.g., Penman (1983), DeAngelo, DeAngelo, and Skinner(1996), and Benartzi, Michaely, and Thaler (1997)). Just like the evidence ondividend-increasing firms, we find that repurchasing firms experience an
3 This notion is consistent with Lintner’s (1956) and Brav et al. (2003) findings that managersincrease payout when they feel that the firm’s cash flows are less risky.
654 The Journal of Finance
abnormal decline in risk and cost of capital (Boehme and Sorescu (2002) andGrullon, Michaely, and Swaminathan (2002)).
Finally, although the initial reaction to dividend increases is positive (e.g.,Asquith and Mullins (1983) and Kalay and Loewenstein (1986)), empiricalresearch shows that the market reaction to these events is incomplete (e.g.,Charest (1978), Benartzi, Michaely, and Thaler (1997), and Boehme and Sorescu(2002)), and that prices continue to drift in the same direction, as they do in thecase of open-market repurchases (e.g., Ikenberry, Lakonishok, and Vermaelen(1995, 2000)). This evidence suggests that, at least to some extent, similar fac-tors motivate firms to repurchase shares in the open market and to increasedividends.
Comparing our results to the earlier literature on tender offers reveals thatthe similarities in firms’ characteristics are not as striking as they are to thecase of dividend increases. Vermaelen (1984) and Dann, Masulis, and Mayers(1991) document a significant increase in earnings per share (EPS) in the yearsfollowing fixed-price repurchases.4 Dann, Masulis, and Mayers and Hertzeland Jain (1991) find that the post-repurchase betas are lower than the pre-repurchase betas, but that the changes are small. Using daily data for 122fixed-price tender offers, Denis and Kadlec (1994) report that after account-ing for nonsynchronous data problems and changes in trading volume, post-repurchase betas are similar to pre-repurchase betas. Taken together, it is morelikely that firms’ motives for fixed price repurchases are different from the mo-tives that dominate open-market repurchases and dividend increases decisions.For example, Bagwell (1991) suggests that tender offers may be used as a mech-anism to counter a takeover threat.
Finally, we also investigate the relation between the change in the cost ofcapital and the long-term drift observed after share repurchase announcements(see Ikenberry, Lakonishok, and Vermaelen (1995, 2000)). We find that thelong-term drift is positively associated with future changes in profitability andnegatively associated with future changes in risk and the cost of capital. Thus,in the long run, stock prices of repurchasing firms increase with declining risk.This finding may suggest that prices impound the change in the cost of capitalonly gradually and that the risk changes associated with repurchases couldalso provide a partial explanation for the long-term drift in stock prices. Thisevidence provides an additional link between dividend-increasing firms andrepurchasing firms: Charest (1978) and Benartzi, Michaely, and Thaler (1997)note a modest price drift following dividend increases, which can be partiallyexplained by a reduction in the risk profile of the dividend-increasing firms.Thus, for both dividend-increasing firms and repurchasing firms, the evidencesuggests that the market underestimates the risk changes: The post-repurchasedrift is greater for firms with a larger decline in the cost of capital.
This paper proceeds as follows. Section I presents the implications of the sig-naling and the free cash-flow hypothesis. Section II describes the data sources
4 Nohel and Tarhan (1998) argue that the improvement in earnings after fixed-price tender offerscan be attributed to low-growth firms that sold unproductive assets.
The Information Content of Share Repurchase Programs 655
we use in this study and presents several summary statistics. In Section IIIwe present our findings on the operating performance of repurchasing firmsand the revision in analysts’ earnings forecasts around share repurchase an-nouncements. In Section IV we analyze the relation between repurchases andchanges in investment opportunities and cost of capital. Section V concludes.
I. The Information/Signaling Hypothesis, the Free Cash-FlowHypotheses and Their Implications
A. The Information/Signaling Hypothesis
Miller and Modigliani (1961) suggest that when markets are incomplete,firms can convey information about future cash flows through changes in pay-out policy. Indeed, as demonstrated by Miller and Rock (1985), through thesources and uses of funds identity, the net payout decision could reveal infor-mation about current earnings to the market. Building on the notion of asym-metric information, Bhattacharya (1979), Miller and Rock (1985), Vermaelen(1981), and others theorize that payout decisions are not actions that just hap-pen to have information content. Rather, these decisions are explicit signalsabout future earnings, sent intentionally and at some cost by the managers ofthe firm to their stockholders.5
The information/signaling hypothesis has three immediate implications: (1)repurchase announcements should be accompanied by positive price changes;(2) repurchase announcements should be followed (though not necessarily im-mediately) by positive news about profitability or cash flows; and (3) repur-chase announcements should be immediately followed by positive changes inthe market’s expectation about future profitability.
Many studies show that repurchases are associated with a positive stock pricereaction (e.g., Ikenberry, Lakonishok, and Vermaelen (1995)). Thus, the firstimplication is not the focus of this paper. Instead, we examine the implicationof a positive association between repurchases and future changes in earningsor profitability. To perform this, we examine several measures of operatingperformance over the 3 years following the repurchase announcement. Finally,using IBES data, we test the third implication by examining the changes inanalysts’ EPS forecasts around the repurchase announcement.
B. The Free Cash-Flow Hypothesis
Agency theory suggests that firms with free cash flows in excess of its in-vestment opportunities are likely to spend them on value-destroying projectsthat reduce the firm’s value. As a partial solution to this problem, Grossmanand Hart (1982), Easterbrook (1984), and Jensen (1986) argue that if equity-holders can minimize the cash that management controls, then it will be much
5 Several costs associated with repurchases and dividend payments have been proposed.Bhattacharya’s (1979) model takes the cost of issuing new shares as the cost of the signal. Millerand Rock’s (1985) model assumes that the signaling cost is the forgone investment.
656 The Journal of Finance
harder for management to engage in (unmonitored) spending sprees (e.g., in-vest in negative NPV projects). One way to take excess cash from the firm isincreasing the level of payout.
Thus, share repurchases and other payout methods are an integral feature ofthe process a firm undergoes as it moves from a growth phase to a more maturephase. Typically, in a growth phase, a firm has many positive NPV projectsavailable, high capital expenditures, low free cash flows, and high earningsgrowth. At some point, the firm’s growth slows down (e.g., competitors enter theindustry), and its economic profit declines. In this phase, capital expendituresdecline, and the firm generates larger amounts of free cash flows. As Berk,Green, and Naik (1999) show, when a firm has fewer options to grow and assetsin place play a bigger role in determining its value, the firm’s systematic riskdeclines.6
Along with the reduction in the firm’s risk profile, the firm’s return on invest-ment (return on equity or ROA) declines and so do its economic profits. All elseequal, a decline in the return on investment should reduce the earnings growthrate of the firm. As the investment opportunities decline, the need for resourcesto undertake new investments should also decline. This decline in investmentswould in turn lead to an increase in the firm’s free cash flows. The potential formanagement to overinvest is higher when a firm is going through this changein its life cycle, and hence the incentive for an increase in payout. Therefore,repurchases may be associated with a reduction in investment opportunitiesand risk. At the same time, the decision to repurchase shares may convey in-formation about management commitment to reduce capital expenditures inresponse to the reduction in investment opportunities.
In summary, the free cash-flow hypothesis predicts the following.
(1) Firms that repurchase their shares should experience a decline in theirprofitability.
(2) Firms that repurchase their shares should need less cash for investments.Therefore, the growth in capital expenditures and the need for cash re-serves should decline.
(3) Firms that repurchase their shares should experience a decline in theirsystematic risk. Therefore, their cost of capital should also decline.
6 For ease of exposition, let us assume that the CAPM beta is a good proxy of the firm’s systematicrisk and that the firm is an all-equity firm. Then, the firm’s equity beta is a weighted average ofthe beta of its assets in place and the beta of its growth options where the weights are based on therelative values of assets in place and growth options. Since most growth options have call optioncharacteristics, it follows that the growth option beta cannot be less than the beta of the underlyingassets. As the firm matures, and the number of growth options in its portfolio decreases, the weightput on the growth option beta will also decline. This shift will result in a decline in its overall beta.If accompanied by a decline in the riskiness of the firm’s assets in place, the firm’s beta will declineeven further. The decline in the assets’ beta can happen if the assets underlying the growth optionsbecome progressively less risky as the time-to-maturity of the growth options decreases. In sum,this suggests that as a firm goes though this process it is likely to face investment opportunitiesthat are less risky.
The Information Content of Share Repurchase Programs 657
(4) The market reaction to share repurchase announcements should bestronger among those firms that are more likely to overinvest. FollowingLie (2000), we examine whether firms with high cash levels and fewinvestment opportunities (proxied by Tobin’s Q) experience a strongermarket reaction around share repurchase announcements than do otherfirms.
II. Data and Sample Selection
We collect data on open-market share repurchase programs from two sources.The main sample comes from announcements reported in the Securities DataCorporation’s U. S. Mergers and Acquisitions database. This database containsthe most comprehensive sample of open-market share repurchase programsavailable, and covers most of the share repurchase programs announced after1984. We supplement this sample with announcements of open-market sharerepurchase programs reported in the Wall Street Journal Index for1980 through 1984. We include the 1980 through 1984 period in our samplebecause it allows us to compare the results in this paper with the resultsin earlier studies, and to check for robustness across data sources and timeperiods.
Our sample includes regulated firms (e.g., financial institutions and utilities).We include regulated firms because they represent a large proportion—nearly34 percent—of the total sample. One possible explanation for this phenomenonis that many financial institutions have generated large amounts of excess cashover the last decade. According to industry reports, several factors have con-tributed to this accumulation of excess cash in the financial sector. First, therelative stability of interest rates during the last decade has helped financial in-stitutions to generate record profits. Second, the deregulation of the financialsystem has forced many institutions to become more efficient. Third, invest-ment opportunities for financial institutions are not growing at the same rateas capital. However, we note that our results are similar for regulated firmsand nonregulated firms.
Our final sample satisfies the following criteria.
(1) Each firm is present on COMPUSTAT (Full-coverage, Primary, Secondary,Tertiary, and Research Files) at the beginning of the year in which theopen-market share repurchase program is announced (year –1).
(2) Information on common stock returns is available on the Center for Re-search in Securities Prices (CRSP) files.
(3) The announcement of the share repurchase program does not coincidewith the announcement of a dividend change. The purpose of this ex-clusion is to avoid confounding effects. (However, the inclusion of theseevents in the sample does not change any of our results.)
(4) The firm does not cut its dividends during the year of the announcementof the share repurchase program. The purpose of this exclusion is to
658 The Journal of Finance
ensure that firms are not just substituting share repurchases for divi-dends (Grullon and Michaely (2002)).7
(5) The firm discloses the number (or the percentage) of shares sought duringthe duration of the share repurchase program. If the firm announces onlythe number of shares sought, then we calculate the percentage of sharessought by using the number of shares outstanding at the time the firmannounces the share repurchase program.
(6) The announcement of the open-market share repurchase program is notmade during the last quarter of 1987. Following Ikenberry, Lakonishok,and Vermaelen (1995), we exclude this period from the sample becauseat this time, many corporations were initiating open-market share re-purchase programs to stabilize their stock prices after the market crashof October 1987. Furthermore, many companies did not announce thenumber of shares authorized for repurchase during this period.
These selection criteria create a sample of 4,443 open-market share repur-chase announcements for the period 1980 to 1997.8
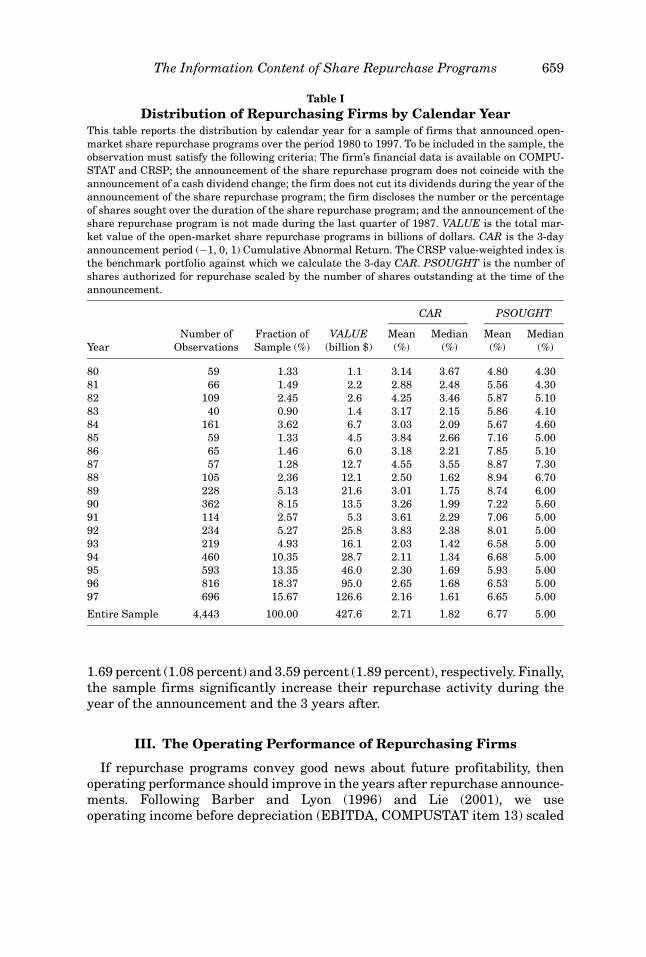
Table I reports the distribution of repurchasing firms by calendar year. Giventhe overall trend in repurchase activity, we are not surprised to find thatmost of the observations (approximately 79 percent) are concentrated in the1990s. The average (median) market reaction around open-market share re-purchases is 2.71 percent (1.82 percent), a finding that is consistent with pre-vious empirical evidence (e.g., Vermaelen (1981), Comment and Jarrell (1991),and Ikenberry, Lakonishok, and Vermaelen (1995)).9 These positive price ef-fects confirm the notion that open-market share repurchases convey some typeor types of good information to the market. Table I also shows that the aver-age (median) proportion of shares sought by the corporation is 6.77 percent(5.00 percent).10
Summary statistics (not reported in a table) show that repurchasing firmsare large. The firms in our sample are concentrated in the top three CRSPsize deciles. The average (median) book value of assets of the sample firmsis $4,528.9 ($354.8) million and the average (median) market-to-book ratio ofrepurchasing firms is equal to 1.53 (1.20). This average market-to-book ratio issimilar to the one reported in Grullon, Michaely, and Swaminathan (2002) fordividend-increasing firms and in Fenn and Liang (2001) for a sample of S&P1500 firms. The average (median) dividend and repurchase yields are equal to
7 To further ensure that our findings are not driven by firms substituting repurchases for divi-dends, we also examine the total payout (dividends plus repurchases) of the firms in our sample.There is a substantial increase in the total payout level during year 0 (year of the event) and the3 years after the event.
8 We also perform all the empirical analyses using only first announcements. Our results arequalitatively the same.
9 The market reaction or abnormal return is equal to the 3-day (−1, 0, 1) announcement periodcumulative abnormal return (CAR). We use the CRSP value-weighted index as the benchmarkportfolio.
10 The proportion of shares sought by the corporation is equal to the amount of shares authorizedfor repurchase scaled by the number of shares outstanding at the time of the announcement.
The Information Content of Share Repurchase Programs 659
Table IDistribution of Repurchasing Firms by Calendar Year
This table reports the distribution by calendar year for a sample of firms that announced open-market share repurchase programs over the period 1980 to 1997. To be included in the sample, theobservation must satisfy the following criteria: The firm’s financial data is available on COMPU-STAT and CRSP; the announcement of the share repurchase program does not coincide with theannouncement of a cash dividend change; the firm does not cut its dividends during the year of theannouncement of the share repurchase program; the firm discloses the number or the percentageof shares sought over the duration of the share repurchase program; and the announcement of theshare repurchase program is not made during the last quarter of 1987. VALUE is the total mar-ket value of the open-market share repurchase programs in billions of dollars. CAR is the 3-dayannouncement period (−1, 0, 1) Cumulative Abnormal Return. The CRSP value-weighted index isthe benchmark portfolio against which we calculate the 3-day CAR. PSOUGHT is the number ofshares authorized for repurchase scaled by the number of shares outstanding at the time of theannouncement.
CAR PSOUGHT
Number of Fraction of VALUE Mean Median Mean MedianYear Observations Sample (%) (billion $) (%) (%) (%) (%)
80 59 1.33 1.1 3.14 3.67 4.80 4.3081 66 1.49 2.2 2.88 2.48 5.56 4.3082 109 2.45 2.6 4.25 3.46 5.87 5.1083 40 0.90 1.4 3.17 2.15 5.86 4.1084 161 3.62 6.7 3.03 2.09 5.67 4.6085 59 1.33 4.5 3.84 2.66 7.16 5.0086 65 1.46 6.0 3.18 2.21 7.85 5.1087 57 1.28 12.7 4.55 3.55 8.87 7.3088 105 2.36 12.1 2.50 1.62 8.94 6.7089 228 5.13 21.6 3.01 1.75 8.74 6.0090 362 8.15 13.5 3.26 1.99 7.22 5.6091 114 2.57 5.3 3.61 2.29 7.06 5.0092 234 5.27 25.8 3.83 2.38 8.01 5.0093 219 4.93 16.1 2.03 1.42 6.58 5.0094 460 10.35 28.7 2.11 1.34 6.68 5.0095 593 13.35 46.0 2.30 1.69 5.93 5.0096 816 18.37 95.0 2.65 1.68 6.53 5.0097 696 15.67 126.6 2.16 1.61 6.65 5.00
Entire Sample 4,443 100.00 427.6 2.71 1.82 6.77 5.00
1.69 percent (1.08 percent) and 3.59 percent (1.89 percent), respectively. Finally,the sample firms significantly increase their repurchase activity during theyear of the announcement and the 3 years after.
III. The Operating Performance of Repurchasing Firms
If repurchase programs convey good news about future profitability, thenoperating performance should improve in the years after repurchase announce-ments. Following Barber and Lyon (1996) and Lie (2001), we useoperating income before depreciation (EBITDA, COMPUSTAT item 13) scaled
660 The Journal of Finance
by the average of beginning- and ending-period book value of assets (i.e.,EBITDAt
(Book Valuet + Book Valuet−1)/2 ) as our primary measure of operating performance. Anadvantage to using the operating income before depreciation (rather than in-come before extraordinary items) is that this measure is not affected by changesin capital structure. Income before extraordinary items is sensitive to changesin interest payments, but the operating income is not. Another advantageis that operating income before depreciation is not affected by factors such asspecial items and income taxes that usually affect other measures ofearnings.
However, to test the robustness of our results, we also examine the returnon cash-adjusted assets, the return on sales (ROS), and the cash-flow returnon assets (CFROA). We use these measures because they overcome some ofthe potential problems associated with ROA (see Barber and Lyon (1996) for adetailed discussion of this issue). The return on cash-adjusted assets is equalto the operating income before depreciation scaled by the average of beginning-and ending-period book value of cash-adjusted assets. The cash-adjusted assetsare equal to the book value of total assets minus cash and marketable securities(item 1). The ROS is equal to the operating income before depreciation scaledby the average of beginning- and ending-period sales (item 12). The CFROA isequal to the operating cash flow scaled by the average of beginning- and ending-period book value of total assets. Following Barber and Lyon, we define cashflows as the operating income before depreciation (item 13) plus the decrease inreceivables (item 2), the decrease in inventory (item 3), the increase in accountspayable (item 70), the increase in other current liabilities (item 72), and thedecrease in other current assets (item 68).
To examine the postevent performance of repurchasing firms relative to theirpre-event performance, we examine the changes in operating performance. Bar-ber and Lyon (1996) recommend the use of changes instead of levels to exam-ine unexpected or abnormal performance because the test statistics based onchanges are more powerful than those based on levels.11
We estimate abnormal or unexpected changes in operating performance intwo ways. First, we use a benchmark that assumes that the unexpected changein average operating performance is equal to the change in the repurchasingfirm’s operating performance. Second, we define the unexpected change in per-formance as the change in performance for the sample firm minus the changein performance for a matching firm. Following Lie (2001), we choose matchingfirms that closely resemble the sample firms in industry classification, levelof performance in year –1 (OP–1), change in performance in year –1 (�OP–1),and market-to-book ratio in year –1 (M/B–1). Specifically, we identify matchingfirms with the following characteristics: (1) a level of operating performancebetween 80 percent and 120 percent of the sample firm’s level of operating per-formance in year –1; (2) a change in operating performance between 80 percentand 120 percent of the sample firm’s change in operating performance from
11 We also examine changes in growth rates and the results are qualitatively the same.
The Information Content of Share Repurchase Programs 661
year –2 to year –1; and (3) a market-to-book ratio between 80 percent and 120percent of the sample firm’s market-to-book ratio in year –1.12
From this initial sample of matching firms, we select the firm that minimizesthe following function:13
|OP−1, sample firm − OP−1, matching firm i|+ |�OP−1, sample firm − �OP−1, matching firm i|+ |M/B−1, sample firm − M/B−1, matching firm i|. (1)
If we do not find any firms that meet these criteria, we repeat the processfirst for matching firms with the same one-digit SIC code as the sample firms,and then for all firms independently of their SIC code. If we still do not findany matching firms, we choose the matching firm that minimizes equation (1)independently of the filters. Lie (2001) shows that this performance-adjustedbenchmark yields more powerful test statistics than do other benchmarks. Toreduce confounding effects, we only consider matching firms that do not an-nounce a repurchase program during the year of the event and during the 3years after the event.14
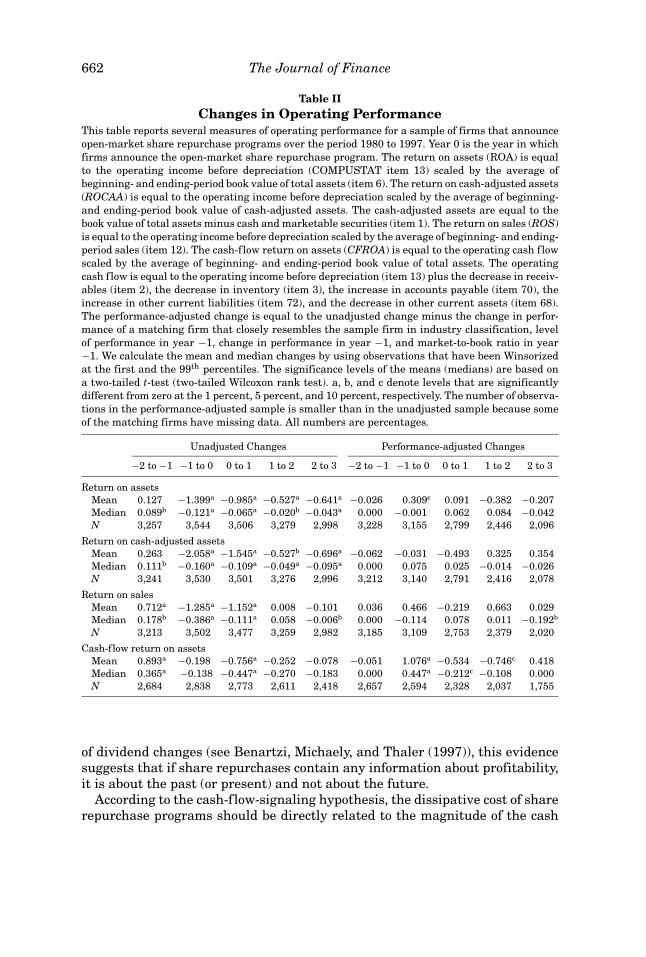
Table II reports the changes in operating performance of repurchasing firms.The columns reporting the unadjusted changes in performance show a signif-icant decline in operating performance during the 3 years (0 to 1, 1 to 2, and2 to 3) following the announcement of the share repurchase program. The evi-dence in Table II also indicates that repurchasing firms experience an increasein operating performance in the year preceding the event (−2 to −1), whichsuggests that firms decide to repurchase shares when they face a reduction inprofitability.
Table II also reports the performance-adjusted changes in operating perfor-mance. We do not find any evidence that the sample firms outperform thematching firms in the 3 years following the announcement of the share repur-chase program. In fact, there is some evidence that the ROS and the CFROA ex-perience abnormal declines (relative to the matching firms) in some of the yearsfollowing the event. Interestingly, we find that the ROA and the CFROA expe-rience an abnormal increase in the year of the announcement. As in the case
12 If we cannot find a firm meeting condition (a), then we search for firms with a level of operatingperformance within ±0.01 of the level of operating performance of the sample firm. If we cannotfind a firm meeting condition (b), then we search for firms with a change in operating performancewithin ±0.01 of the change in operating performance of the sample firm. If we cannot find a firmmeeting condition (c), then we search for firms with a market-to-book ratio within ±0.1 of themarket-to-book ratio of the sample firm.
13 As a robustness check, we employ two alternative minimizing functions: (1) a function thatonly includes the level of performance in year −1 and the change in performance in year −1,and (2) a function similar to equation (1) where the differences in level of performance, change inperformance, and market-to-book ratio are scaled by their standard deviations. Our main resultsare insensitive to these changes.
14 We also use alternative methods to find matching firms (e.g., matching on preannouncementearnings growth rates) and find similar results.
662 The Journal of Finance
Table IIChanges in Operating Performance
This table reports several measures of operating performance for a sample of firms that announceopen-market share repurchase programs over the period 1980 to 1997. Year 0 is the year in whichfirms announce the open-market share repurchase program. The return on assets (ROA) is equalto the operating income before depreciation (COMPUSTAT item 13) scaled by the average ofbeginning- and ending-period book value of total assets (item 6). The return on cash-adjusted assets(ROCAA) is equal to the operating income before depreciation scaled by the average of beginning-and ending-period book value of cash-adjusted assets. The cash-adjusted assets are equal to thebook value of total assets minus cash and marketable securities (item 1). The return on sales (ROS)is equal to the operating income before depreciation scaled by the average of beginning- and ending-period sales (item 12). The cash-flow return on assets (CFROA) is equal to the operating cash flowscaled by the average of beginning- and ending-period book value of total assets. The operatingcash flow is equal to the operating income before depreciation (item 13) plus the decrease in receiv-ables (item 2), the decrease in inventory (item 3), the increase in accounts payable (item 70), theincrease in other current liabilities (item 72), and the decrease in other current assets (item 68).The performance-adjusted change is equal to the unadjusted change minus the change in perfor-mance of a matching firm that closely resembles the sample firm in industry classification, levelof performance in year −1, change in performance in year −1, and market-to-book ratio in year−1. We calculate the mean and median changes by using observations that have been Winsorizedat the first and the 99th percentiles. The significance levels of the means (medians) are based ona two-tailed t-test (two-tailed Wilcoxon rank test). a, b, and c denote levels that are significantlydifferent from zero at the 1 percent, 5 percent, and 10 percent, respectively. The number of observa-tions in the performance-adjusted sample is smaller than in the unadjusted sample because someof the matching firms have missing data. All numbers are percentages.
Unadjusted Changes Performance-adjusted Changes
−2 to −1 −1 to 0 0 to 1 1 to 2 2 to 3 −2 to −1 −1 to 0 0 to 1 1 to 2 2 to 3
Return on assetsMean 0.127 −1.399a −0.985a −0.527a −0.641a −0.026 0.309c 0.091 −0.382 −0.207Median 0.089b −0.121a −0.065a −0.020b −0.043a 0.000 −0.001 0.062 0.084 −0.042N 3,257 3,544 3,506 3,279 2,998 3,228 3,155 2,799 2,446 2,096
Return on cash-adjusted assetsMean 0.263 −2.058a −1.545a −0.527b −0.696a −0.062 −0.031 −0.493 0.325 0.354Median 0.111b −0.160a −0.109a −0.049a −0.095a 0.000 0.075 0.025 −0.014 −0.026N 3,241 3,530 3,501 3,276 2,996 3,212 3,140 2,791 2,416 2,078
Return on salesMean 0.712a −1.285a −1.152a 0.008 −0.101 0.036 0.466 −0.219 0.663 0.029Median 0.178b −0.386a −0.111a 0.058 −0.006b 0.000 −0.114 0.078 0.011 −0.192b
N 3,213 3,502 3,477 3,259 2,982 3,185 3,109 2,753 2,379 2,020
Cash-flow return on assetsMean 0.893a −0.198 −0.756a −0.252 −0.078 −0.051 1.076a −0.534 −0.746c 0.418Median 0.365a −0.138 −0.447a −0.270 −0.183 0.000 0.447a −0.212c −0.108 0.000N 2,684 2,838 2,773 2,611 2,418 2,657 2,594 2,328 2,037 1,755
of dividend changes (see Benartzi, Michaely, and Thaler (1997)), this evidencesuggests that if share repurchases contain any information about profitability,it is about the past (or present) and not about the future.
According to the cash-flow-signaling hypothesis, the dissipative cost of sharerepurchase programs should be directly related to the magnitude of the cash
The Information Content of Share Repurchase Programs 663
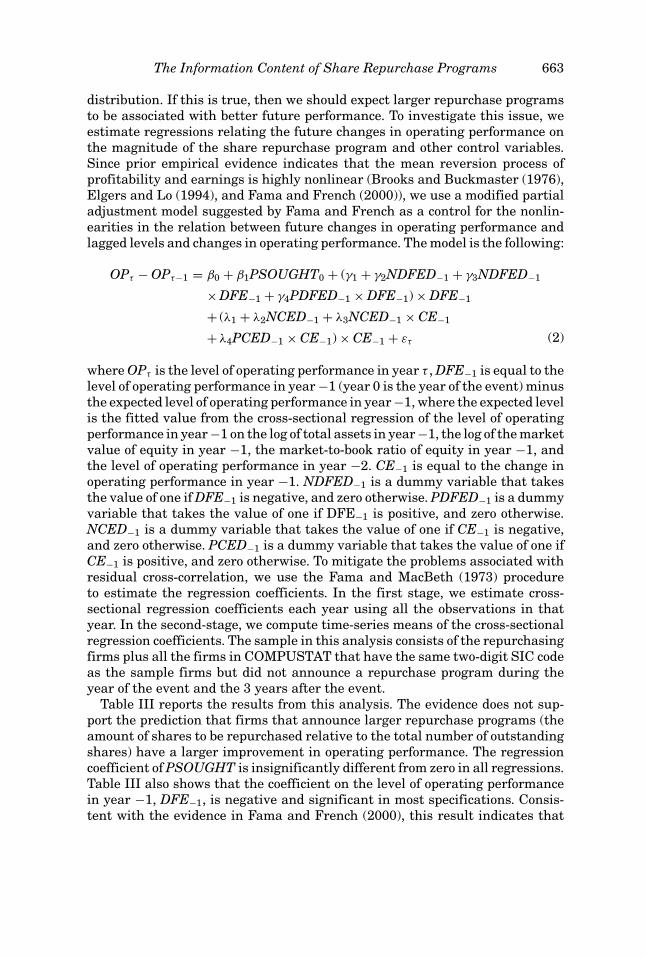
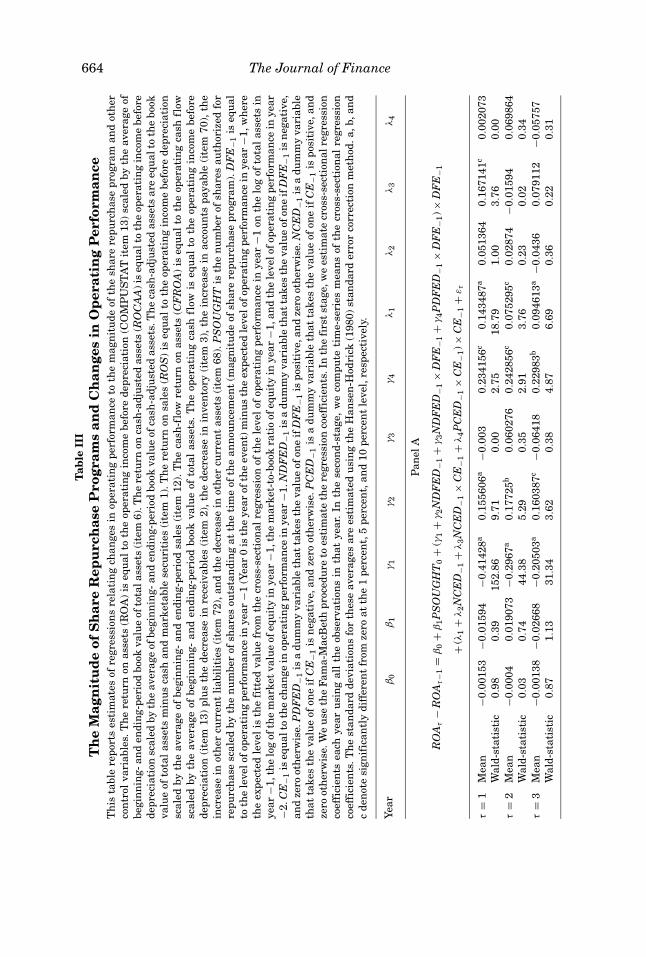
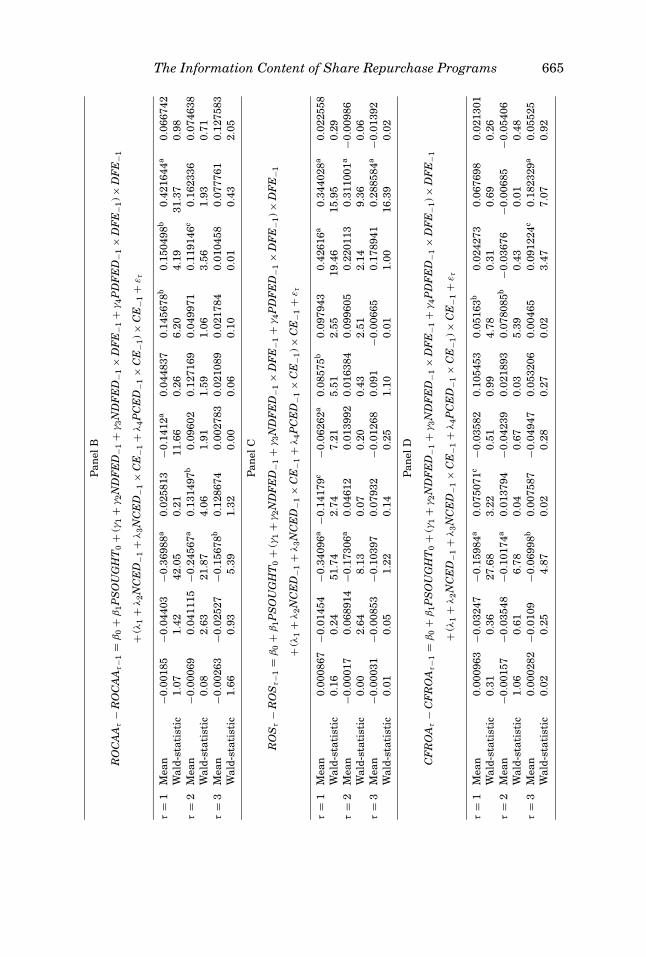
distribution. If this is true, then we should expect larger repurchase programsto be associated with better future performance. To investigate this issue, weestimate regressions relating the future changes in operating performance onthe magnitude of the share repurchase program and other control variables.Since prior empirical evidence indicates that the mean reversion process ofprofitability and earnings is highly nonlinear (Brooks and Buckmaster (1976),Elgers and Lo (1994), and Fama and French (2000)), we use a modified partialadjustment model suggested by Fama and French as a control for the nonlin-earities in the relation between future changes in operating performance andlagged levels and changes in operating performance. The model is the following:
OPτ − OPτ−1 = β0 + β1PSOUGHT0 + (γ1 + γ2NDFED−1 + γ3NDFED−1
× DFE−1 + γ4PDFED−1 × DFE−1) × DFE−1
+ (λ1 + λ2NCED−1 + λ3NCED−1 × CE−1
+ λ4PCED−1 × CE−1) × CE−1 + ετ (2)
where OPτ is the level of operating performance in year τ , DFE−1 is equal to thelevel of operating performance in year −1 (year 0 is the year of the event) minusthe expected level of operating performance in year −1, where the expected levelis the fitted value from the cross-sectional regression of the level of operatingperformance in year −1 on the log of total assets in year −1, the log of the marketvalue of equity in year −1, the market-to-book ratio of equity in year −1, andthe level of operating performance in year −2. CE−1 is equal to the change inoperating performance in year −1. NDFED−1 is a dummy variable that takesthe value of one if DFE−1 is negative, and zero otherwise. PDFED−1 is a dummyvariable that takes the value of one if DFE−1 is positive, and zero otherwise.NCED−1 is a dummy variable that takes the value of one if CE−1 is negative,and zero otherwise. PCED−1 is a dummy variable that takes the value of one ifCE−1 is positive, and zero otherwise. To mitigate the problems associated withresidual cross-correlation, we use the Fama and MacBeth (1973) procedureto estimate the regression coefficients. In the first stage, we estimate cross-sectional regression coefficients each year using all the observations in thatyear. In the second-stage, we compute time-series means of the cross-sectionalregression coefficients. The sample in this analysis consists of the repurchasingfirms plus all the firms in COMPUSTAT that have the same two-digit SIC codeas the sample firms but did not announce a repurchase program during theyear of the event and the 3 years after the event.
Table III reports the results from this analysis. The evidence does not sup-port the prediction that firms that announce larger repurchase programs (theamount of shares to be repurchased relative to the total number of outstandingshares) have a larger improvement in operating performance. The regressioncoefficient of PSOUGHT is insignificantly different from zero in all regressions.Table III also shows that the coefficient on the level of operating performancein year −1, DFE−1, is negative and significant in most specifications. Consis-tent with the evidence in Fama and French (2000), this result indicates that
664 The Journal of FinanceT
able
III
Th
eM
agn
itu
de
ofS
har
eR
epu
rch
ase
Pro
gram
san
dC
han
ges
inO
per
atin
gP
erfo
rman
ceT
his
tabl
ere
port
ses
tim
ates
ofre
gres
sion
sre
lati
ng
chan
ges
inop
erat
ing
perf
orm
ance
toth
em
agn
itu
deof
the
shar
ere
purc
has
epr
ogra
man
dot
her
con
trol
vari
able
s.T
he
retu
rnon
asse
ts(R
OA
)is
equ
alto
the
oper
atin
gin
com
ebe
fore
depr
ecia
tion
(CO
MP
US
TA
Tit
em13
)sc
aled
byth
eav
erag
eof
begi
nn
ing-
and
endi
ng-
peri
odbo
okva
lue
ofto
tala
sset
s(i
tem
6).T
he
retu
rnon
cash
-adj
ust
edas
sets
(RO
CA
A)i
seq
ual
toth
eop
erat
ing
inco
me
befo
rede
prec
iati
onsc
aled
byth
eav
erag
eof
begi
nn
ing-
and
endi
ng-
peri
odbo
okva
lue
ofca
sh-a
dju
sted
asse
ts.T
he
cash
-adj
ust
edas
sets
are
equ
alto
the
book
valu
eof
tota
las
sets
min
us
cash
and
mar
keta
ble
secu
riti
es(i
tem
1).T
he
retu
rnon
sale
s(R
OS
)is
equ
alto
the
oper
atin
gin
com
ebe
fore
depr
ecia
tion
scal
edby
the
aver
age
ofbe
gin
nin
g-an
den
din
g-pe
riod
sale
s(i
tem
12).
Th
eca
sh-f
low
retu
rnon
asse
ts(C
FR
OA
)is
equ
alto
the
oper
atin
gca
shfl
owsc
aled
byth
eav
erag
eof
begi
nn
ing-
and
endi
ng-
peri
odbo
okva
lue
ofto
tal
asse
ts.
Th
eop
erat
ing
cash
flow
iseq
ual
toth
eop
erat
ing
inco
me
befo
rede
prec
iati
on(i
tem
13)
plu
sth
ede
crea
sein
rece
ivab
les
(ite
m2)
,th
ede
crea
sein
inve
nto
ry(i
tem
3),
the
incr
ease
inac
cou
nts
paya
ble
(ite
m70
),th
ein
crea
sein
oth
ercu
rren
tli
abil
itie
s(i
tem
72),
and
the
decr
ease
inot
her
curr
ent
asse
ts(i
tem
68).
PS
OU
GH
Tis
the
nu
mbe
rof
shar
esau
thor
ized
for
repu
rch
ase
scal
edby
the
nu
mbe
rof
shar
esou
tsta
ndi
ng
atth
eti
me
ofth
ean
nou
nce
men
t(m
agn
itu
deof
shar
ere
purc
has
epr
ogra
m).
DF
E−1
iseq
ual
toth
ele
velo
fope
rati
ng
perf
orm
ance
inye
ar−1
(Yea
r0
isth
eye
arof
the
even
t)m
inu
sth
eex
pect
edle
velo
fope
rati
ng
perf
orm
ance
inye
ar−1
,wh
ere
the
expe
cted
leve
lis
the
fitt
edva
lue
from
the
cros
s-se
ctio
nal
regr
essi
onof
the
leve
lof
oper
atin
gpe
rfor
man
cein
year
−1on
the
log
ofto
tala
sset
sin
year
−1,t
he
log
ofth
em
arke
tva
lue
ofeq
uit
yin
year
−1,t
he
mar
ket-
to-b
ook
rati
oof
equ
ity
inye
ar−1
,an
dth
ele
velo
fope
rati
ng
perf
orm
ance
inye
ar−2
.CE
−1is
equ
alto
the
chan
gein
oper
atin
gpe
rfor
man
cein
year
−1.N
DF
ED
−1is
adu
mm
yva
riab
leth
atta
kes
the
valu
eof
one
ifD
FE
−1is
neg
ativ
e,an
dze
root
her
wis
e.P
DF
ED
−1is
adu
mm
yva
riab
leth
atta
kes
the
valu
eof
one
ifD
FE
−1is
posi
tive
,an
dze
root
her
wis
e.N
CE
D−1
isa
dum
my
vari
able
that
take
sth
eva
lue
ofon
eif
CE
−1is
neg
ativ
e,an
dze
root
her
wis
e.P
CE
D−1
isa
dum
my
vari
able
that
take
sth
eva
lue
ofon
eif
CE
−1is
posi
tive
,an
dze
root
her
wis
e.W
eu
seth
eFa
ma-
Mac
Bet
hpr
oced
ure
toes
tim
ate
the
regr
essi
onco
effi
cien
ts.I
nth
efi
rst
stag
e,w
ees
tim
ate
cros
s-se
ctio
nal
regr
essi
onco
effi
cien
tsea
chye
aru
sin
gal
lth
eob
serv
atio
ns
inth
atye
ar.
Inth
ese
con
d-st
age,
we
com
pute
tim
e-se
ries
mea
ns
ofth
ecr
oss-
sect
ion
alre
gres
sion
coef
fici
ents
.Th
est
anda
rdde
viat
ion
sfo
rth
ese
aver
ages
are
esti
mat
edu
sin
gth
eH
anse
n-H
odri
ck(1
980)
stan
dard
erro
rco
rrec
tion
met
hod
.a,b
,an
dc
den
ote
sign
ific
antl
ydi
ffer
ent
from
zero
atth
e1
perc
ent,
5pe
rcen
t,an
d10
perc
ent
leve
l,re
spec
tive
ly.
Year
β0
β1
γ1
γ2
γ3
γ4
λ1
λ2
λ3
λ4
Pan
elA
RO
Aτ
−R
OA
τ−1
=β
0+
β1P
SO
UG
HT
0+
(γ1
+γ
2N
DF
ED
−1+
γ3N
DF
ED
−1×
DF
E−1
+γ
4P
DF
ED
−1×
DF
E−1
)×D
FE
−1
+(λ
1+
λ2N
CE
D−1
+λ
3N
CE
D−1
×C
E−1
+λ
4P
CE
D−1
×C
E−1
)×C
E−1
+ετ
τ=
1M
ean
−0.0
0153
−0.0
1594
−0.4
1428
a0.
1556
06a
−0.0
030.
2341
56c
0.14
3487
a0.
0513
640.
1671
41c
0.00
2073
Wal
d-st
atis
tic
0.98
0.39
152.
869.
710.
002.
7518
.79
1.00
3.76
0.00
τ=
2M
ean
−0.0
004
0.01
9073
−0.2
967a
0.17
725b
0.06
0276
0.24
2856
c0.
0752
95c
0.02
874
−0.0
1594
0.06
9864
Wal
d-st
atis
tic
0.03
0.74
44.3
85.
290.
352.
913.
760.
230.
020.
34τ
=3
Mea
n−0
.001
38−0
.026
68−0
.205
03a
0.16
0387
c−0
.064
180.
2298
3b0.
0946
13a
−0.0
436
0.07
9112
−0.0
5757
Wal
d-st
atis
tic
0.87
1.13
31.3
43.
620.
384.
876.
690.
360.
220.
31
The Information Content of Share Repurchase Programs 665
Pan
elB
RO
CA
Aτ
−R
OC
AA
τ−1
=β
0+
β1P
SO
UG
HT
0+
(γ1
+γ
2N
DF
ED
−1+
γ3N
DF
ED
−1×
DF
E−1
+γ
4P
DF
ED
−1×
DF
E−1
)×D
FE
−1
+(λ
1+
λ2N
CE
D−1
+λ
3N
CE
D−1
×C
E−1
+λ
4P
CE
D−1
×C
E−1
)×C
E−1
+ετ
τ=
1M
ean
−0.0
0185
−0.0
4403
−0.3
6988
a0.
0258
13−0
.141
2a0.
0448
370.
1456
78b
0.15
0498
b0.
4216
44a
0.06
6742
Wal
d-st
atis
tic
1.07
1.42
42.0
50.
2111
.66
0.26
6.20
4.19
31.3
70.
98τ
=2
Mea
n−0
.000
690.
0411
15−0
.245
67a
0.13
1497
b0.
0960
20.
1271
690.
0499
710.
1191
46c
0.16
2336
0.07
4638
Wal
d-st
atis
tic
0.08
2.63
21.8
74.
061.
911.
591.
063.
561.
930.
71τ
=3
Mea
n−0
.002
63−0
.025
27−0
.156
78b
0.12
8674
0.00
2783
0.02
1089
0.02
1784
0.01
0458
0.07
7761
0.12
7583
Wal
d-st
atis
tic
1.66
0.93
5.39
1.32
0.00
0.06
0.10
0.01
0.43
2.05
Pan
elC
RO
Sτ
−R
OS
τ−1
=β
0+
β1P
SO
UG
HT
0+
(γ1
+γ
2N
DF
ED
−1+
γ3N
DF
ED
−1×
DF
E−1
+γ
4P
DF
ED
−1×
DF
E−1
)×D
FE
−1
+(λ
1+
λ2N
CE
D−1
+λ
3N
CE
D−1
×C
E−1
+λ
4P
CE
D−1
×C
E−1
)×C
E−1
+ετ
τ=
1M
ean
0.00
0867
−0.0
1454
−0.3
4096
a−0
.141
79c
−0.0
6262
a0.
0857
5b0.
0979
430.
4261
6a0.
3440
28a
0.02
2558
Wal
d-st
atis
tic
0.16
0.24
51.7
42.
747.
215.
512.
5519
.46
15.9
50.
29τ
=2
Mea
n−0
.000
170.
0689
14−0
.173
06a
0.04
612
0.01
3992
0.01
6384
0.09
9605
0.22
0113
0.31
1001
a−0
.009
86W
ald-
stat
isti
c0.
002.
648.
130.
070.
200.
432.
512.
149.
360.
06τ
=3
Mea
n−0
.000
31−0
.008
53−0
.103
970.
0793
2−0
.012
680.
091
−0.0
0665
0.17
8941
0.28
8584
a−0
.013
92W
ald-
stat
isti
c0.
010.
051.
220.
140.
251.
100.
011.
0016
.39
0.02
Pan
elD
CF
RO
Aτ
−C
FR
OA
τ−1
=β
0+
β1P
SO
UG
HT
0+
(γ1
+γ
2N
DF
ED
−1+
γ3N
DF
ED
−1×
DF
E−1
+γ
4P
DF
ED
−1×
DF
E−1
)×D
FE
−1
+(λ
1+
λ2N
CE
D−1
+λ
3N
CE
D−1
×C
E−1
+λ
4P
CE
D−1
×C
E−1
)×C
E−1
+ετ
τ=
1M
ean
0.00
0963
−0.0
3247
−0.1
5984
a0.
0750
71c
−0.0
3582
0.10
5453
0.05
163b
0.02
4273
0.06
7698
0.02
1301
Wal
d-st
atis
tic
0.31
0.36
27.6
83.
220.
510.
994.
780.
310.
690.
26τ
=2
Mea
n−0
.001
57−0
.035
48−0
.101
74a
0.01
3794
−0.0
4239
0.02
1893
0.07
8085
b−0
.036
76−0
.006
85−0
.054
06W
ald-
stat
isti
c1.
060.
616.
780.
040.
670.
035.
390.
430.
010.
48τ
=3
Mea
n0.
0002
82−0
.010
9−0
.069
98b
0.00
7587
−0.0
4947
0.05
3206
0.00
465
0.09
1224
c0.
1823
29a
0.05
525
Wal
d-st
atis
tic
0.02
0.25
4.87
0.02
0.28
0.27
0.02
3.47
7.07
0.92
666 The Journal of Finance
profitability tends to mean revert. Further, the evidence in Table III indicatesthat the behavior of profitability is highly nonlinear. In some of the specifica-tions, the nonlinear independent variables are more important than the linearindependent variables. We also repeat this analysis substituting the marketreaction surrounding the share repurchase announcement for PSOUGHT, andthe results are qualitatively the same. These findings suggest that share repur-chase announcements do not contain positive information content about eitherabnormal future earnings or operating performance beyond that provided byother factors.
In addition to the adjusted and unadjusted changes in operating cash flows,we also use changes in analysts’ forecasts of future EPS around the event. Thereare at least two advantages in expanding our analysis by using this measure.First, revisions in forecasts can be used as another measure of unexpectedchanges in earnings. Second, if payout policy, and in particular repurchasepolicy, is being used as a signal, then the revision in analysts’ forecasts can beused as another indication on whether the signal was received by the market.That is, we can see if the signal changed expectations in the right direction.
We examine the changes in annual EPS forecasts from month t − 1 to t.Following Brous and Kini (1993), we define the unexpected revision in the EPSforecast (�EFt) in month t as
�EFt = [MEFt − E(�EFt)]/PRICE. (3)
In this equation, MEFt is the median change in analysts’ earnings forecastfrom month t − 1 to t. E[�EFt] is the average change in analysts’ earningsforecasts during all the months for which earnings forecasts are available onIBES, excluding the period −6 to +6. Month 0 is the month in which the firmannounces the open-market share repurchase program. PRICE is the stockprice at the beginning of the year in which the open-market share repurchaseprogram is announced. We use PRICE as a deflator of the forecast error.
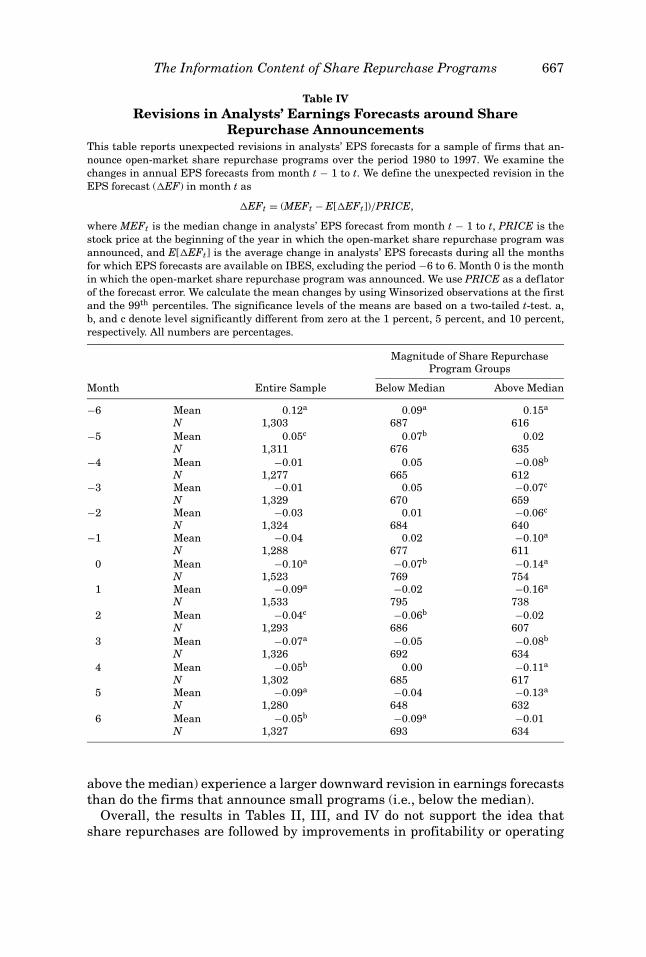
Table IV reports the unexpected changes in analysts’ earnings forecastsaround share repurchase announcements. The evidence indicates that ana-lysts revise their earnings forecasts downward during the month of the sharerepurchase announcement, a finding that is contrary to the predictions of thecash-flow-signaling hypothesis. The mean change in analysts’ earnings fore-casts during the month of the announcement is equal to −0.10 percent. Thischange is statistically different from zero at the 1 percent significance level.15
Table IV also shows that firms that announce large repurchase programs (i.e.,
15 To ensure that our results are not driven by changes in capital structure, we replicate theanalysis in Table IV excluding those firms that increase their leverage (debt-to-assets ratio) duringthe year of the announcement (year 0). Consistent with the results in Table IV, we find that analystsrevise their earnings forecasts downward during the month of the share repurchase announcement.We also replicate this analysis excluding those firms that increase their leverage during year 1,and the results are qualitatively the same. These results suggest that the reduction in analysts’earnings forecasts documented in Table IV is not caused by an increase in the use of leverage. (Itshould be mentioned that this robustness test rests on the assumption that analysts can forecastwith reasonable accuracy which firms will increase leverage.)
The Information Content of Share Repurchase Programs 667
Table IVRevisions in Analysts’ Earnings Forecasts around Share
Repurchase AnnouncementsThis table reports unexpected revisions in analysts’ EPS forecasts for a sample of firms that an-nounce open-market share repurchase programs over the period 1980 to 1997. We examine thechanges in annual EPS forecasts from month t − 1 to t. We define the unexpected revision in theEPS forecast (�EF) in month t as
�EFt = (MEFt − E[�EFt])/PRICE,
where MEFt is the median change in analysts’ EPS forecast from month t − 1 to t, PRICE is thestock price at the beginning of the year in which the open-market share repurchase program wasannounced, and E[�EFt] is the average change in analysts’ EPS forecasts during all the monthsfor which EPS forecasts are available on IBES, excluding the period −6 to 6. Month 0 is the monthin which the open-market share repurchase program was announced. We use PRICE as a deflatorof the forecast error. We calculate the mean changes by using Winsorized observations at the firstand the 99th percentiles. The significance levels of the means are based on a two-tailed t-test. a,b, and c denote level significantly different from zero at the 1 percent, 5 percent, and 10 percent,respectively. All numbers are percentages.
Magnitude of Share RepurchaseProgram Groups
Month Entire Sample Below Median Above Median
−6 Mean 0.12a 0.09a 0.15a
N 1,303 687 616−5 Mean 0.05c 0.07b 0.02
N 1,311 676 635−4 Mean −0.01 0.05 −0.08b
N 1,277 665 612−3 Mean −0.01 0.05 −0.07c
N 1,329 670 659−2 Mean −0.03 0.01 −0.06c
N 1,324 684 640−1 Mean −0.04 0.02 −0.10a
N 1,288 677 6110 Mean −0.10a −0.07b −0.14a
N 1,523 769 7541 Mean −0.09a −0.02 −0.16a
N 1,533 795 7382 Mean −0.04c −0.06b −0.02
N 1,293 686 6073 Mean −0.07a −0.05 −0.08b
N 1,326 692 6344 Mean −0.05b 0.00 −0.11a
N 1,302 685 6175 Mean −0.09a −0.04 −0.13a
N 1,280 648 6326 Mean −0.05b −0.09a −0.01
N 1,327 693 634
above the median) experience a larger downward revision in earnings forecaststhan do the firms that announce small programs (i.e., below the median).
Overall, the results in Tables II, III, and IV do not support the idea thatshare repurchases are followed by improvements in profitability or operating
668 The Journal of Finance
performance. Nor does the evidence suggest that the market revises its expec-tation of earnings upward following repurchase announcements.
IV. Repurchases, Changes in Investment OpportunitySet, and Cost of Capital
A. Changes in Capital Expenditures, Research and Development Expenses,and Cash Reserves
The analysis in the previous section indicates that earnings and profitabilitydo not increase in the years after open-market repurchase announcements. Infact, some of our measures even show a decrease in earnings and profitability.This evidence does not support the predictions of the information/signalinghypothesis. However, despite the fact that profitability decreases in the 3 yearsafter the repurchase announcement, it is possible that a repurchasing firm isattempting to convey information about the good investments it is undertaking(and the cash flows from those investments that will occur in the distant future).In this scenario, the firm increases its capital expenditure and R&D expenses,and at the same time signals its good prospects through a repurchase program.If that is the case, we should find an increase in capital expenditure and R&Din the years after the repurchase is announced.
Another explanation for the positive market reaction around share repur-chase announcements is that repurchase programs mitigate the agency costsassociated with the possible overinvestment of free cash flows (free cash-flowhypothesis) (Easterbrook (1984) and Jensen (1986)). Thus, share repurchaseannouncements also convey information to the market. However, the informa-tion that the announcement reveals is not about the firm’s prospects (which arealready known to the market), but about managers’ commitment to reduce thepotential agency costs of free cash flow.16 The free cash-flow hypothesis sug-gests that corporations should pay out cash to their shareholders when agencyconflicts are more likely to induce managers to overinvest. Firms should in-crease their payout when they experience a contraction in their investmentopportunity set and an increase in their free cash flows. Therefore, one pre-diction of the free cash-flow hypothesis is that capital expenditures and cashreserves will decline following repurchases. As the investment opportunitiesshrink, more cash will be paid out to shareholders. Thus, the good news is thelower likelihood of overinvestment.
We therefore examine changes in capital expenditures and R&D (capital ex-penditures (COMPUSTAT item 128) plus R&D expenses (item 46)) and cashreserves (cash and short-term investments (item 1)) relative to the average ofbeginning- and ending-period book value of total assets. We use two benchmarksto measure abnormal changes in capital expenditures and R&D(INVESTMENTS) and cash reserves (CASH). First, we use a benchmark that
16 Recent studies by Nohel and Tarhan (1998) and Lie (2000) find empirical evidence supportingthe predictions of this hypothesis during the announcement of fixed-price tender offers.
The Information Content of Share Repurchase Programs 669
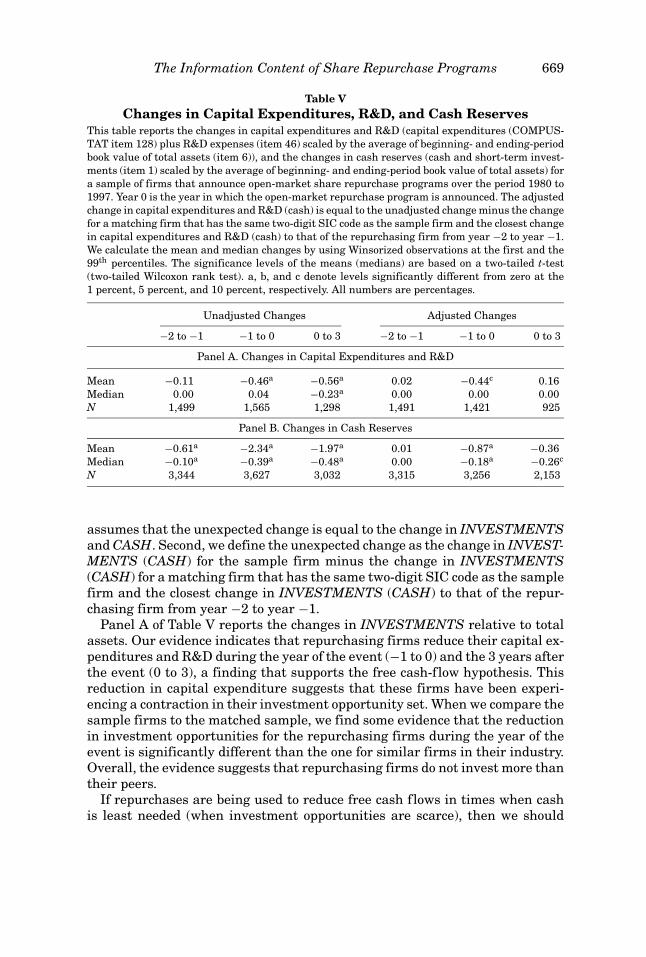
Table VChanges in Capital Expenditures, R&D, and Cash Reserves
This table reports the changes in capital expenditures and R&D (capital expenditures (COMPUS-TAT item 128) plus R&D expenses (item 46) scaled by the average of beginning- and ending-periodbook value of total assets (item 6)), and the changes in cash reserves (cash and short-term invest-ments (item 1) scaled by the average of beginning- and ending-period book value of total assets) fora sample of firms that announce open-market share repurchase programs over the period 1980 to1997. Year 0 is the year in which the open-market repurchase program is announced. The adjustedchange in capital expenditures and R&D (cash) is equal to the unadjusted change minus the changefor a matching firm that has the same two-digit SIC code as the sample firm and the closest changein capital expenditures and R&D (cash) to that of the repurchasing firm from year −2 to year −1.We calculate the mean and median changes by using Winsorized observations at the first and the99th percentiles. The significance levels of the means (medians) are based on a two-tailed t-test(two-tailed Wilcoxon rank test). a, b, and c denote levels significantly different from zero at the1 percent, 5 percent, and 10 percent, respectively. All numbers are percentages.
Unadjusted Changes Adjusted Changes
−2 to −1 −1 to 0 0 to 3 −2 to −1 −1 to 0 0 to 3
Panel A. Changes in Capital Expenditures and R&D
Mean −0.11 −0.46a −0.56a 0.02 −0.44c 0.16Median 0.00 0.04 −0.23a 0.00 0.00 0.00N 1,499 1,565 1,298 1,491 1,421 925
Panel B. Changes in Cash Reserves
Mean −0.61a −2.34a −1.97a 0.01 −0.87a −0.36Median −0.10a −0.39a −0.48a 0.00 −0.18a −0.26c
N 3,344 3,627 3,032 3,315 3,256 2,153
assumes that the unexpected change is equal to the change in INVESTMENTSand CASH. Second, we define the unexpected change as the change in INVEST-MENTS (CASH) for the sample firm minus the change in INVESTMENTS(CASH) for a matching firm that has the same two-digit SIC code as the samplefirm and the closest change in INVESTMENTS (CASH) to that of the repur-chasing firm from year −2 to year −1.
Panel A of Table V reports the changes in INVESTMENTS relative to totalassets. Our evidence indicates that repurchasing firms reduce their capital ex-penditures and R&D during the year of the event (−1 to 0) and the 3 years afterthe event (0 to 3), a finding that supports the free cash-flow hypothesis. Thisreduction in capital expenditure suggests that these firms have been experi-encing a contraction in their investment opportunity set. When we compare thesample firms to the matched sample, we find some evidence that the reductionin investment opportunities for the repurchasing firms during the year of theevent is significantly different than the one for similar firms in their industry.Overall, the evidence suggests that repurchasing firms do not invest more thantheir peers.
If repurchases are being used to reduce free cash flows in times when cashis least needed (when investment opportunities are scarce), then we should
670 The Journal of Finance
also observe a reduction in financial slack. Therefore, we examine the changesin cash reserves of these firms. The results, reported in Panel B of Table V,show that repurchasing firms significantly reduce their cash reserves over the3 years following these announcements, supporting the idea that repurchasingfirms face a shrinking investment opportunity set. Even after controlling forpre-event changes in CASH and industry effects, the changes in CASH arenegative and statistically significant during the year of, and during the 3 yearsafter, the event. This evidence supports the predictions of the free cash-flowhypothesis that suggest that firms repurchase shares or increase dividends toreduce excess cash.
B. Risk Changes
The evidence appears to indicate that corporations repurchase shares whenpositive NPV projects are scarcer than they were in the past for these firms.This finding might explain why firms’ profitability declines after this signifi-cant increase in payout. If a firm experiences a contraction in its investmentopportunity set, then it may also experience a decline in risk and in its cost ofcapital. (The growth options of the firm are likely to be riskier than the assetsin place. Hence, when the value of growth opportunities represents a lowerportion of the firm’s value, the overall risk of the firm declines). This potentialchange in the cost of capital is important because it is another piece of relevantinformation that affects valuation.
We measure changes in the systematic risk of equity based on the marketmodel and the Fama and French (1993) three-factor model. We let “t∗” be themonth of the repurchase announcement. Then for each firm announcing a re-purchase, we estimate the following monthly regressions for months t∗ − 36 tot∗ + 36 (73 monthly observations) around the repurchase announcement:
rit − rft = α−i + α�i Dt + b−i(rmt − rft) + b�i Dt(rmt − rft) + et , (4)
and
rit − rft = α−i + α�i Dt + b−i(rmt − rft) + b�i Dt(rmt − r f t)
+ s−iSMBt + s�i DtSMBt + h−iHMLt + h�i DtHMLt + et , (5)
where rit is the monthly return on stock i, rft is the monthly return on 1-monthU.S. Treasury bills, and rmt is the monthly return on the NYSE/AMEX/Nasdaqvalue-weighted index. SMBt is the difference between the monthly return ona portfolio of small firms and the monthly return on a portfolio of large firms.HMLt is the difference between the monthly return on a portfolio of high book-to-market stocks and the monthly return on a portfolio of low book-to-marketstocks. Dt is a dummy variable that is equal to one if t ≥ t∗, where t∗ is themonth in which the share repurchase program is announced. We use a windowof 73 months (−36 to +36) to estimate the parameters of the regression model.
The Information Content of Share Repurchase Programs 671
By calculating an adjusted measure of risk, we also control for any systematictrend or evolution in the risk factors that might generally happen to firms withsimilar characteristics. This adjusted measure is equal to the estimated factorloading for the sample firm minus the estimated factor loading for a matchingfirm. We select a matching firm by screening the COMPUSTAT database for allnonrepurchasing firms with a market value of equity between 80 percent and120 percent of the market value of the sample firm at the end of year −1; and abook-to-market ratio between 80 percent and 120 percent of the book-to-marketratio of the sample firm at the end of year −1. Then, the firm with the closeststock return during the 3 years prior to the share repurchase announcement(to control for any momentum effects) is selected as the control firm.
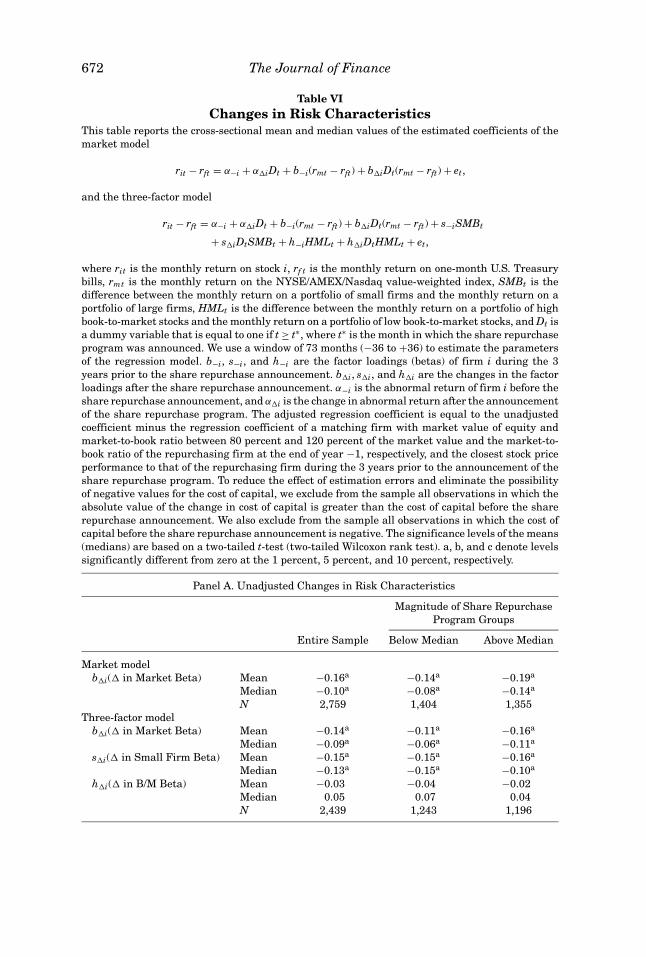
Panel A of Table VI reports the estimated coefficients of equations (4) and(5). The results suggest that after the announcement of a repurchase program,repurchasing firms experience a significant decline in their factor loadings.For the market model, the unadjusted average (median) change in marketbeta is equal to −0.16 (−0.10).17 For the three-factor model, the unadjustedaverage (median) estimated changes in market beta, SMB beta, and book-to-market beta are equal to −0.14 (−0.09), −0.15 (−0.13), and −0.03 (0.05), re-spectively. These findings suggest that repurchasing firms decide to repurchasetheir shares just around the time they experience a decline in systematic risk.
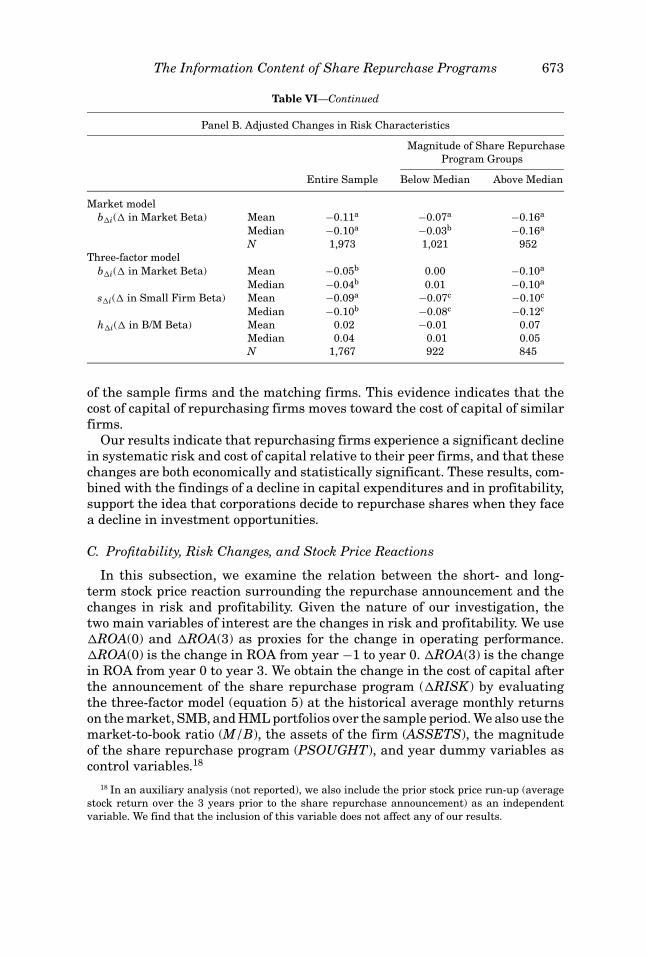
Panel B of Table VI presents the adjusted measures of risk. The panel showsthat the adjusted changes in the market beta and SMB beta are negative andsignificantly different from zero. The change in the SMB beta suggests thatafter a repurchase announcement, firms behave more like large firms and lesslike small firms, consistent with the idea that firms increase their payouts whenthey move from a growth phase to a more mature phase. As indicated in bothPanels, the reduction in risk is stronger for firms that repurchase more shares.
To assess the effect of the changes in factor loadings on the cost of capi-tal, Table VII reports the cost capital before and after the share repurchaseannouncement. The cost of capital is estimated using the market model or thethree-factor model and historical average monthly returns on the market, SMB,and HML portfolios over the sample period. The average (median) cost of cap-ital declines from 15.75 percent (15.28 percent) before the announcement to14.43 percent (14.03 percent) after the announcement when we use the marketmodel (Panel A). For the three-factor model, Panel B shows that the average(median) cost of capital declines from 18.01 percent (16.94 percent) before theannouncement to 16.53 percent (16.04 percent) after the announcement. Thesechanges in the cost of capital are significantly different from zero at the 1 per-cent confidence level. The adjusted measures of cost of capital are reported inPanels C and D. These panels show that before the announcement of the sharerepurchase program the cost of capital of the sample firms was significantlyhigher than the cost of capital of the matching firms. However, notice that afterthe announcement, there is no significant difference between the cost of capital
17 Using a different methodological approach, Lie (2003) also finds that repurchasing firms ex-perience a decline in beta relative to nonrepurchasing firms.
672 The Journal of Finance
Table VIChanges in Risk Characteristics
This table reports the cross-sectional mean and median values of the estimated coefficients of themarket model
rit − rft = α−i + α�iDt + b−i(rmt − rft) + b�iDt(rmt − rft) + et,
and the three-factor model
rit − rft = α−i + α�iDt + b−i(rmt − rft) + b�iDt(rmt − rft) + s−iSMBt
+ s�iDtSMBt + h−iHMLt + h�iDtHMLt + et,
where rit is the monthly return on stock i, rf t is the monthly return on one-month U.S. Treasurybills, rmt is the monthly return on the NYSE/AMEX/Nasdaq value-weighted index, SMBt is thedifference between the monthly return on a portfolio of small firms and the monthly return on aportfolio of large firms, HMLt is the difference between the monthly return on a portfolio of highbook-to-market stocks and the monthly return on a portfolio of low book-to-market stocks, and Dt isa dummy variable that is equal to one if t ≥ t∗, where t∗ is the month in which the share repurchaseprogram was announced. We use a window of 73 months (−36 to +36) to estimate the parametersof the regression model. b−i, s−i, and h−i are the factor loadings (betas) of firm i during the 3years prior to the share repurchase announcement. b�i, s�i, and h�i are the changes in the factorloadings after the share repurchase announcement. α−i is the abnormal return of firm i before theshare repurchase announcement, and α�i is the change in abnormal return after the announcementof the share repurchase program. The adjusted regression coefficient is equal to the unadjustedcoefficient minus the regression coefficient of a matching firm with market value of equity andmarket-to-book ratio between 80 percent and 120 percent of the market value and the market-to-book ratio of the repurchasing firm at the end of year −1, respectively, and the closest stock priceperformance to that of the repurchasing firm during the 3 years prior to the announcement of theshare repurchase program. To reduce the effect of estimation errors and eliminate the possibilityof negative values for the cost of capital, we exclude from the sample all observations in which theabsolute value of the change in cost of capital is greater than the cost of capital before the sharerepurchase announcement. We also exclude from the sample all observations in which the cost ofcapital before the share repurchase announcement is negative. The significance levels of the means(medians) are based on a two-tailed t-test (two-tailed Wilcoxon rank test). a, b, and c denote levelssignificantly different from zero at the 1 percent, 5 percent, and 10 percent, respectively.
Panel A. Unadjusted Changes in Risk Characteristics
Magnitude of Share RepurchaseProgram Groups
Entire Sample Below Median Above Median
Market modelb�i(� in Market Beta) Mean −0.16a −0.14a −0.19a
Median −0.10a −0.08a −0.14a
N 2,759 1,404 1,355Three-factor model
b�i(� in Market Beta) Mean −0.14a −0.11a −0.16a
Median −0.09a −0.06a −0.11a
s�i(� in Small Firm Beta) Mean −0.15a −0.15a −0.16a
Median −0.13a −0.15a −0.10a
h�i(� in B/M Beta) Mean −0.03 −0.04 −0.02Median 0.05 0.07 0.04N 2,439 1,243 1,196
The Information Content of Share Repurchase Programs 673
Table VI—Continued
Panel B. Adjusted Changes in Risk Characteristics
Magnitude of Share RepurchaseProgram Groups
Entire Sample Below Median Above Median
Market modelb�i(� in Market Beta) Mean −0.11a −0.07a −0.16a
Median −0.10a −0.03b −0.16a
N 1,973 1,021 952Three-factor model
b�i(� in Market Beta) Mean −0.05b 0.00 −0.10a
Median −0.04b 0.01 −0.10a
s�i(� in Small Firm Beta) Mean −0.09a −0.07c −0.10c
Median −0.10b −0.08c −0.12c
h�i(� in B/M Beta) Mean 0.02 −0.01 0.07Median 0.04 0.01 0.05N 1,767 922 845
of the sample firms and the matching firms. This evidence indicates that thecost of capital of repurchasing firms moves toward the cost of capital of similarfirms.
Our results indicate that repurchasing firms experience a significant declinein systematic risk and cost of capital relative to their peer firms, and that thesechanges are both economically and statistically significant. These results, com-bined with the findings of a decline in capital expenditures and in profitability,support the idea that corporations decide to repurchase shares when they facea decline in investment opportunities.
C. Profitability, Risk Changes, and Stock Price Reactions
In this subsection, we examine the relation between the short- and long-term stock price reaction surrounding the repurchase announcement and thechanges in risk and profitability. Given the nature of our investigation, thetwo main variables of interest are the changes in risk and profitability. We use�ROA(0) and �ROA(3) as proxies for the change in operating performance.�ROA(0) is the change in ROA from year −1 to year 0. �ROA(3) is the changein ROA from year 0 to year 3. We obtain the change in the cost of capital afterthe announcement of the share repurchase program (�RISK) by evaluatingthe three-factor model (equation 5) at the historical average monthly returnson the market, SMB, and HML portfolios over the sample period. We also use themarket-to-book ratio (M/B), the assets of the firm (ASSETS), the magnitudeof the share repurchase program (PSOUGHT), and year dummy variables ascontrol variables.18
18 In an auxiliary analysis (not reported), we also include the prior stock price run-up (averagestock return over the 3 years prior to the share repurchase announcement) as an independentvariable. We find that the inclusion of this variable does not affect any of our results.
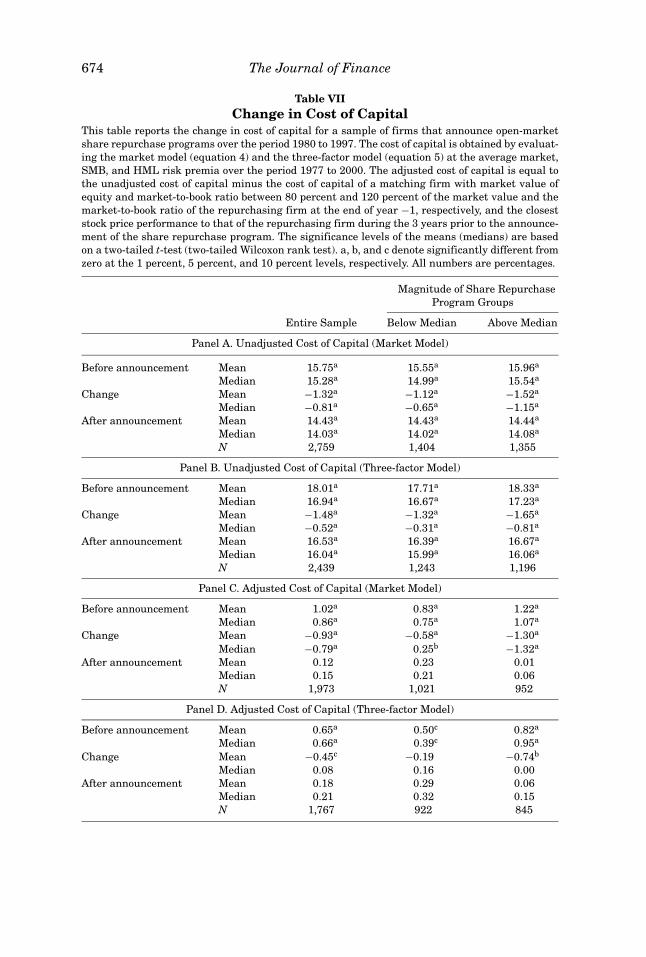
674 The Journal of Finance
Table VIIChange in Cost of Capital
This table reports the change in cost of capital for a sample of firms that announce open-marketshare repurchase programs over the period 1980 to 1997. The cost of capital is obtained by evaluat-ing the market model (equation 4) and the three-factor model (equation 5) at the average market,SMB, and HML risk premia over the period 1977 to 2000. The adjusted cost of capital is equal tothe unadjusted cost of capital minus the cost of capital of a matching firm with market value ofequity and market-to-book ratio between 80 percent and 120 percent of the market value and themarket-to-book ratio of the repurchasing firm at the end of year −1, respectively, and the closeststock price performance to that of the repurchasing firm during the 3 years prior to the announce-ment of the share repurchase program. The significance levels of the means (medians) are basedon a two-tailed t-test (two-tailed Wilcoxon rank test). a, b, and c denote significantly different fromzero at the 1 percent, 5 percent, and 10 percent levels, respectively. All numbers are percentages.
Magnitude of Share RepurchaseProgram Groups
Entire Sample Below Median Above Median
Panel A. Unadjusted Cost of Capital (Market Model)
Before announcement Mean 15.75a 15.55a 15.96a
Median 15.28a 14.99a 15.54a
Change Mean −1.32a −1.12a −1.52a
Median −0.81a −0.65a −1.15a
After announcement Mean 14.43a 14.43a 14.44a
Median 14.03a 14.02a 14.08a
N 2,759 1,404 1,355
Panel B. Unadjusted Cost of Capital (Three-factor Model)
Before announcement Mean 18.01a 17.71a 18.33a
Median 16.94a 16.67a 17.23a
Change Mean −1.48a −1.32a −1.65a
Median −0.52a −0.31a −0.81a
After announcement Mean 16.53a 16.39a 16.67a
Median 16.04a 15.99a 16.06a
N 2,439 1,243 1,196
Panel C. Adjusted Cost of Capital (Market Model)
Before announcement Mean 1.02a 0.83a 1.22a
Median 0.86a 0.75a 1.07a
Change Mean −0.93a −0.58a −1.30a
Median −0.79a 0.25b −1.32a
After announcement Mean 0.12 0.23 0.01Median 0.15 0.21 0.06N 1,973 1,021 952
Panel D. Adjusted Cost of Capital (Three-factor Model)
Before announcement Mean 0.65a 0.50c 0.82a
Median 0.66a 0.39c 0.95a
Change Mean −0.45c −0.19 −0.74b
Median 0.08 0.16 0.00After announcement Mean 0.18 0.29 0.06
Median 0.21 0.32 0.15N 1,767 922 845
The Information Content of Share Repurchase Programs 675
To investigate the predictions of the free cash-flow hypothesis, we examinewhether firms with high cash levels and few investment opportunities (proxiedby Tobin’s Q) experience a stronger market reaction around share repurchaseannouncements than do other firms. Following Lie (2000), we include in ourregressions the level of cash and short-term investments relative to the bookvalue of total assets (CASH) and an interaction variable that is equal to thevalue of CASH if the market-to-book ratio is less than 1, and 0 otherwise. Thefree cash-flow hypothesis implies that the coefficients of these two variablesshould be positive.
Table VIII reports the results from this analysis. The dependent variable iseither the immediate market reaction to the repurchase announcement (CAR,which is calculated as the 3-day announcement period return minus the CRSPvalue-weighted index return during those 3 days) or the 3-year abnormal returnafter the announcement (DRIFT). We calculate the DRIFT by using the postan-nouncement alpha obtained from estimating the three-factor market model(equation 5).
The first column in Table VIII shows that the initial market response to therepurchase announcement (CAR) has no relation to the changes in profitability.The coefficients of �ROA(0) and �ROA(3) are insignificantly different fromzero. However, the negative and significant coefficient of the change in thecost of capital, �RISK, implies that the market reacts more positively to firmswith a larger decline in systematic risk. This evidence seems to indicate thatinvestors have been aware of the (negative) earnings news even prior to therepurchase announcement, but less so about the risk reduction as they seem tobe more affected by the news about risk than by the news about earnings.
We also find that the initial market response to the repurchase announcementis positively related to the level of cash in the firm. More importantly, we findthat the relation between the market reaction and the level of cash is strongeramong those firms with low M/B. Consistent with the predictions of the freecash-flow hypothesis, these results suggest that the market reaction to sharerepurchase announcements is stronger among those firms that are more likelyto overinvest.
The postannouncement long-run price drift (column 2, Table VIII) is nega-tively related to the change in the cost of capital. Thus, the larger the reductionin the cost of capital, the larger the drift. This evidence, combined with theimpact of risk on the initial market reaction (column 1, Table VIII), suggeststhat investors do not fully account for the positive impact of the risk changes inthe years after the repurchase announcement. The price drift is also positivelyrelated to the current and future change in profitability, which indicates thatmore profitable firms experience a more pronounced drift.
Finally, if the reduction in risk is indeed the result of contracting invest-ment opportunities, we expect to find that firms that experience the largestreduction in investments would also experience the largest reduction in risk.Table IX reports the results from this analysis. The dependent variable is thechange in the firm’s cost of capital (�RISK). The independent variable is thefirm’s change in INVESTMENTS (CAPEX plus R&D) from year 0 to year 3. We
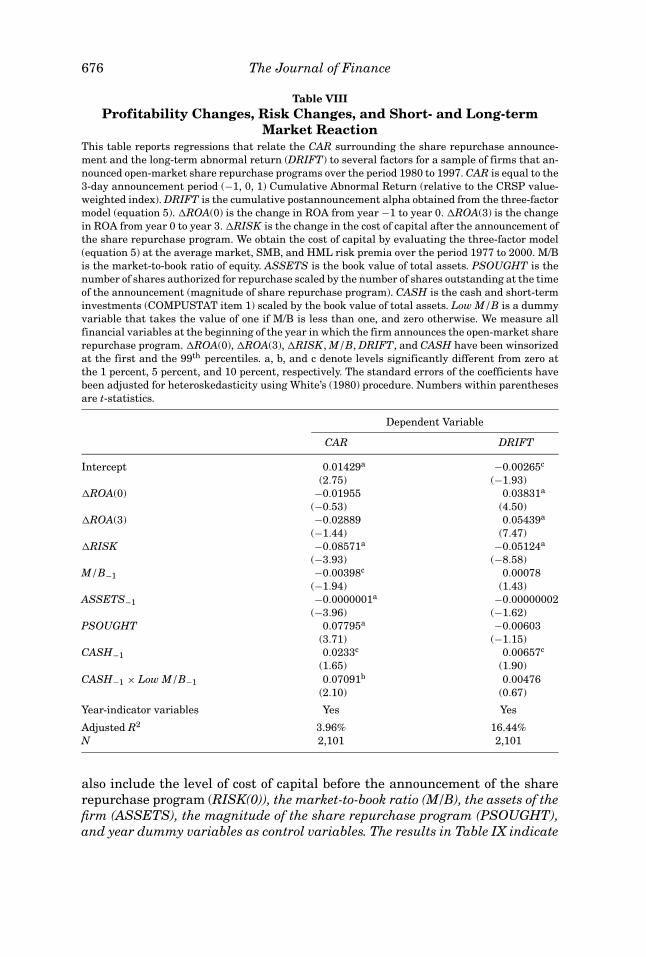
676 The Journal of Finance
Table VIIIProfitability Changes, Risk Changes, and Short- and Long-term
Market ReactionThis table reports regressions that relate the CAR surrounding the share repurchase announce-ment and the long-term abnormal return (DRIFT) to several factors for a sample of firms that an-nounced open-market share repurchase programs over the period 1980 to 1997. CAR is equal to the3-day announcement period (−1, 0, 1) Cumulative Abnormal Return (relative to the CRSP value-weighted index). DRIFT is the cumulative postannouncement alpha obtained from the three-factormodel (equation 5). �ROA(0) is the change in ROA from year −1 to year 0. �ROA(3) is the changein ROA from year 0 to year 3. �RISK is the change in the cost of capital after the announcement ofthe share repurchase program. We obtain the cost of capital by evaluating the three-factor model(equation 5) at the average market, SMB, and HML risk premia over the period 1977 to 2000. M/Bis the market-to-book ratio of equity. ASSETS is the book value of total assets. PSOUGHT is thenumber of shares authorized for repurchase scaled by the number of shares outstanding at the timeof the announcement (magnitude of share repurchase program). CASH is the cash and short-terminvestments (COMPUSTAT item 1) scaled by the book value of total assets. Low M/B is a dummyvariable that takes the value of one if M/B is less than one, and zero otherwise. We measure allfinancial variables at the beginning of the year in which the firm announces the open-market sharerepurchase program. �ROA(0), �ROA(3), �RISK, M/B, DRIFT, and CASH have been winsorizedat the first and the 99th percentiles. a, b, and c denote levels significantly different from zero atthe 1 percent, 5 percent, and 10 percent, respectively. The standard errors of the coefficients havebeen adjusted for heteroskedasticity using White’s (1980) procedure. Numbers within parenthesesare t-statistics.
Dependent Variable
CAR DRIFT
Intercept 0.01429a −0.00265c
(2.75) (−1.93)�ROA(0) −0.01955 0.03831a
(−0.53) (4.50)�ROA(3) −0.02889 0.05439a
(−1.44) (7.47)�RISK −0.08571a −0.05124a
(−3.93) (−8.58)M/B−1 −0.00398c 0.00078
(−1.94) (1.43)ASSETS−1 −0.0000001a −0.00000002
(−3.96) (−1.62)PSOUGHT 0.07795a −0.00603
(3.71) (−1.15)CASH−1 0.0233c 0.00657c
(1.65) (1.90)CASH−1 × Low M/B−1 0.07091b 0.00476
(2.10) (0.67)
Year-indicator variables Yes Yes
Adjusted R2 3.96% 16.44%N 2,101 2,101
also include the level of cost of capital before the announcement of the sharerepurchase program (RISK(0)), the market-to-book ratio (M/B), the assets of thefirm (ASSETS), the magnitude of the share repurchase program (PSOUGHT),and year dummy variables as control variables. The results in Table IX indicate
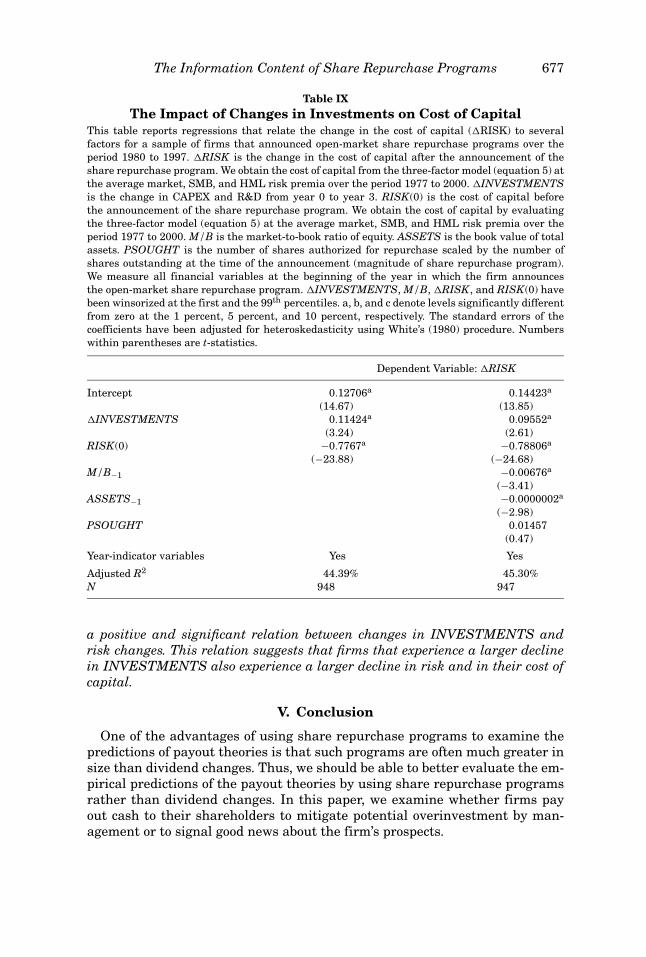
The Information Content of Share Repurchase Programs 677
Table IXThe Impact of Changes in Investments on Cost of Capital
This table reports regressions that relate the change in the cost of capital (�RISK) to severalfactors for a sample of firms that announced open-market share repurchase programs over theperiod 1980 to 1997. �RISK is the change in the cost of capital after the announcement of theshare repurchase program. We obtain the cost of capital from the three-factor model (equation 5) atthe average market, SMB, and HML risk premia over the period 1977 to 2000. �INVESTMENTSis the change in CAPEX and R&D from year 0 to year 3. RISK(0) is the cost of capital beforethe announcement of the share repurchase program. We obtain the cost of capital by evaluatingthe three-factor model (equation 5) at the average market, SMB, and HML risk premia over theperiod 1977 to 2000. M/B is the market-to-book ratio of equity. ASSETS is the book value of totalassets. PSOUGHT is the number of shares authorized for repurchase scaled by the number ofshares outstanding at the time of the announcement (magnitude of share repurchase program).We measure all financial variables at the beginning of the year in which the firm announcesthe open-market share repurchase program. �INVESTMENTS, M/B, �RISK, and RISK(0) havebeen winsorized at the first and the 99th percentiles. a, b, and c denote levels significantly differentfrom zero at the 1 percent, 5 percent, and 10 percent, respectively. The standard errors of thecoefficients have been adjusted for heteroskedasticity using White’s (1980) procedure. Numberswithin parentheses are t-statistics.
Dependent Variable: �RISK
Intercept 0.12706a 0.14423a
(14.67) (13.85)�INVESTMENTS 0.11424a 0.09552a
(3.24) (2.61)RISK(0) −0.7767a −0.78806a
(−23.88) (−24.68)M/B−1 −0.00676a
(−3.41)ASSETS−1 −0.0000002a
(−2.98)PSOUGHT 0.01457
(0.47)
Year-indicator variables Yes Yes
Adjusted R2 44.39% 45.30%N 948 947
a positive and significant relation between changes in INVESTMENTS andrisk changes. This relation suggests that firms that experience a larger declinein INVESTMENTS also experience a larger decline in risk and in their cost ofcapital.
V. Conclusion
One of the advantages of using share repurchase programs to examine thepredictions of payout theories is that such programs are often much greater insize than dividend changes. Thus, we should be able to better evaluate the em-pirical predictions of the payout theories by using share repurchase programsrather than dividend changes. In this paper, we examine whether firms payout cash to their shareholders to mitigate potential overinvestment by man-agement or to signal good news about the firm’s prospects.
678 The Journal of Finance
We perform a systematic investigation to uncover whether the informationcontent of repurchases is about growth in future earnings (and other profitabil-ity measures), or whether it is related to a reduction in agency conflicts. Wecannot find any evidence that repurchasing firms experience a growth in prof-itability. If anything, the evidence indicates that profitability declines in theyears after the repurchase. We also find that repurchasing firms decrease theirinvestments. This finding precludes the possibility that earnings are likely torecover in the long run.
Our evidence suggests that the reduction in free cash flows and systematicrisk are sources of the positive market reaction to the repurchase announce-ment. We also find that the market reaction to share repurchase announce-ments is stronger among those firms that are more likely to overinvest. Thus,when agency conflicts of overinvestment are likely to arise, these firms increasetheir payout to shareholders in the form of repurchases. The potential reductionin agency costs and the information about the reduction in the cost of capitalcould explain why the market views these acts positively.
Overall, when we combine our results with the evidence concerning dividend-increasing firms, it appears that repurchases and dividends are motivated bysimilar factors. When future investment opportunities are contracting, an in-crease in cash payouts conveys important information about management com-mitment to reduce the agency costs of free cash flow when those costs are poten-tially more pronounced. An increase in cash payouts also conveys informationabout changes in the risk profile and the cost of capital of the firm.
REFERENCESAsquith, Paul, and David W. Mullins, Jr., 1983, The impact of initiating dividend payments on
shareholders’ wealth, Journal of Business 56, 77–96.Bagwell, Laurie S., 1991, Share repurchase and takeover deterrence, Rand Journal of Economics
22, 72–88.Barber, Brad M., and John D. Lyon, 1996, Detecting abnormal operating performance: The empir-
ical power and specification of tests-statistics, Journal of Financial Economics 41, 359–399.Bartov, Eli, 1991, Open-market stock repurchase as signals for earnings and risk changes, Journal
of Accounting and Economics 14, 275–294.Benartzi, Shlomo, Roni Michaely, and Richard H. Thaler, 1997, Do changes in dividends signal the
future or the past? Journal of Finance 52, 1007–1034.Berk, Jonathan B., Richard C. Green, and Vasant Naik, 1999, Optimal investment, growth options,
and security returns, Journal of Finance 54, 1553–1607.Bhattacharya, Sudipto, 1979, Imperfect information, dividend policy, and “the bird in the hand”
fallacy, Bell Journal of Economics 10, 259–270.Boehme, Rodney, and Sorin M. Sorescu, 2002, The long-run performance following dividend initi-
ations and resumptions: Underreaction or product of chance? Journal of Finance 57, 871–900.Brav, Alon, John R. Graham, Campbell R. Harvey, and Roni Michaely, 2003, Payout policy in the
21st century, Working paper, Duke University.Brooks, LeRoy D., and Dale A. Buckmaster, 1976, Further evidence on the time series properties
of accounting income, Journal of Finance 31, 1359–1373.Brous, Peter A., and Omesh Kini, 1993, A reexamination of analysts earnings forecasts for takeover
targets, Journal of Financial Economics 33, 201–225.Charest, Guy, 1978, Dividend information, stock returns and market efficiency—II, Journal of
Financial Economics 6, 297–330.
The Information Content of Share Repurchase Programs 679
Comment, Robert, and Gregg A. Jarrell, 1991, The relative signaling power of Dutch auction andfixed-price self-tender offers and open market share repurchases, Journal of Finance 46, 1243–1271.
Constantinides, George M., and Bruce D. Grundy, 1989, Optimal investment with stock repurchaseand financing as signals, Review of Financial Studies 2, 445–465.
Dann, Larry Y., Ronald W. Masulis, and David Mayers, 1991, Repurchase tender offers and earninginformation, Journal of Accounting and Economics 14, 217–251.
DeAngelo, Harry, Linda DeAngelo, and Douglas J. Skinner, 1996, Reversal of fortune: Dividendsignaling and the disappearance of sustained earnings growth, Journal of Financial Economics40, 341–371.
Denis, David J., and Gregory B. Kadlec, 1994, Corporate events, trading activity, and the estimationof systematic risk: Evidence from equity offerings and share repurchases, Journal of Finance49, 1787–1811.
Easterbrook, Frank H., 1984, Two agency-cost explanations of dividends, American EconomicReview 74, 650–659.
Elgers, Pieter T., and May H. Lo, 1994, Reductions in analysts’ annual earnings forecast errorsusing information in prior earnings and security returns, Journal of Accounting Research 32,290–303.
Fama, Eugene F., and Kenneth R. French, 1993, Common risk factors in the returns on stocks andbonds, Journal of Financial Economics 33, 3–56.
Fama, Eugene F., and Kenneth R. French, 2000, Forecasting profitability and earnings, Journal ofBusiness 73, 161–175.
Fama, Eugene F., and James D. MacBeth, 1973, Risk, return and equilibrium: Empirical tests,Journal of Political Economy 81, 607–636.
Fenn, George W., and Nellie Liang, 2001, Corporate payout policy and managerial stock incentives,Journal of Financial Economics 60, 45–72.
Grossman, Sanford J., and Oliver D. Hart, 1982, Corporate financial structure and managerialincentives, in John J. McCall, ed.: The Economics of Information and Uncertainty (Universityof Chicago Press, Chicago, IL).
Grullon, Gustavo, and Roni Michaely, 2002, Dividends, share repurchases and the substitutionhypothesis, Journal of Finance 57, 1649–1684.
Grullon, Gustavo, Roni Michaely, and Bhaskaran Swaminathan, 2002, Are dividend changes a signof firm maturity? Journal of Business 75, 387–424.
Hansen, Lars P., and Robert J. Hodrick, 1980, Forward exchange rates as optimal predic-tors of future spot rates: An econometric analysis, Journal of Political Economy 88, 829–853.
Hausch, Donald B., and James K. Seward, 1993, Signaling with dividends and share repurchases: Achoice between deterministic and stochastic cash disbursements, Review of Financial Studies6, 121–154.
Hertzel, Michael, and Prem C. Jain, 1991, Earnings and risk changes around stock repurchasetender offers, Journal of Accounting and Economics 14, 253–274.
Ikenberry, David, Josef Lakonishok, and Theo Vermaelen, 1995, Market underreaction to openmarket share repurchases, Journal of Financial Economics 39, 181–208.
Ikenberry, David, Josef Lakonishok, and Theo Vermaelen, 2000, Stock repurchases in Canada:Performance and strategic trading, Journal of Finance 55, 2373–2397.
Jagannathan, Murali, and Clifford P. Stephens, 2003, Motives for multiple open-market repurchaseprograms, Financial Management 32, 71–91.
Jensen, Michael C., 1986, Agency costs of free cash flow, corporate finance, and takeovers, AmericanEconomic Review 76, 323–329.
Kalay, Avner, and Uri Loewenstein, 1986, The informational content of the timing of dividendannouncements, Journal of Financial Economics 16, 373–388.
Lie, Erik, 2000, Excess funds and agency problems: An empirical study of incremental cash dis-bursements, Review of Financial Studies 13, 219–247.
Lie, Erik, 2001, Detecting abnormal operating performance: Revisited, Financial Management 30,77–91.
680 The Journal of Finance
Lie, Erik, 2003, Financial flexibility, performance, and the corporate payout choice, Journal ofBusiness, forthcoming.
Lintner, John, 1956, Distribution of incomes of corporations among dividends, retained earnings,and taxes, American Economic Review 46, 97–113.
Miller, Merton H., and Franco Modigliani, 1961, Dividend policy, growth and the valuation ofshares, Journal of Business 34, 411–433.
Miller, Merton H., and Kevin Rock, 1985, Dividend policy under asymmetric information, Journalof Finance 40, 1031–1051.
Nohel, Tom, and Vefa Tarhan, 1998, Share repurchases and firm performance: New evidence onthe agency costs of free cash flow, Journal of Financial Economics 49, 187–222.
Ofer, Aharon R., and Anjan V. Thakor, 1987, A theory of stock price responses to alternativecorporate cash disbursements methods: Stock repurchase and dividends, Journal of Finance42, 365–394.
Penman, Stephen H., 1983, The predictive content of earnings forecasts and dividends, Journal ofFinance 38, 1181–1199.
Persons, John C., 1997, Heterogeneous shareholders and signaling with share repurchases, Journalof Corporate Finance 3, 221–249.
Vermaelen, Theo, 1981, Common stock repurchases and market signaling: An empirical study,Journal of Financial Economics 9, 139–183.
Vermaelen, Theo, 1984, Repurchase tender offers, signaling and managerial incentives, Journal ofFinancial and Quantitative Analysis 19, 163–181.
White, Hall, 1980, A heteroskedasticity-consistent covariance matrix estimator and a direct testfor heteroskedasticity, Econometrica 48, 817–838.


![Share Buybacks .pptx [Read-Only] · 7/24/2018 · ACCELERATED SHARE REPURCHASES. What Is an ASR? • An accelerated share repurchase, or ASR, is a structured, privately negotiated](https://img.pdfslide.net/doc/110x75/5e9628b0c9bb40443513bbcc/share-buybacks-pptx-read-only-7242018-accelerated-share-repurchases-what.jpg)