Embed Size (px)
Citation preview
1
Kelly Thambimuthu,Chairman,
IEA Greenhouse Gas R&D Programmeand
Chief Executive officerCentre for Low Emission Technology,
Queensland, Australia.
The innovation challenge of carbon capture and storage technologies
Presentation to 2nd CEEM Annual Conference, UNSW, Sydney, 26 October 2006
Outline of this presentation• Climate change and energy – the
challenges• Energy technology pathways to reduce
emissions - role of CO2 capture and storage (CCS) technologies
• Status, cost and the global economic potential of CCS
• Challenges and opportunities for CCS• Conclusionwww.clet.net
2
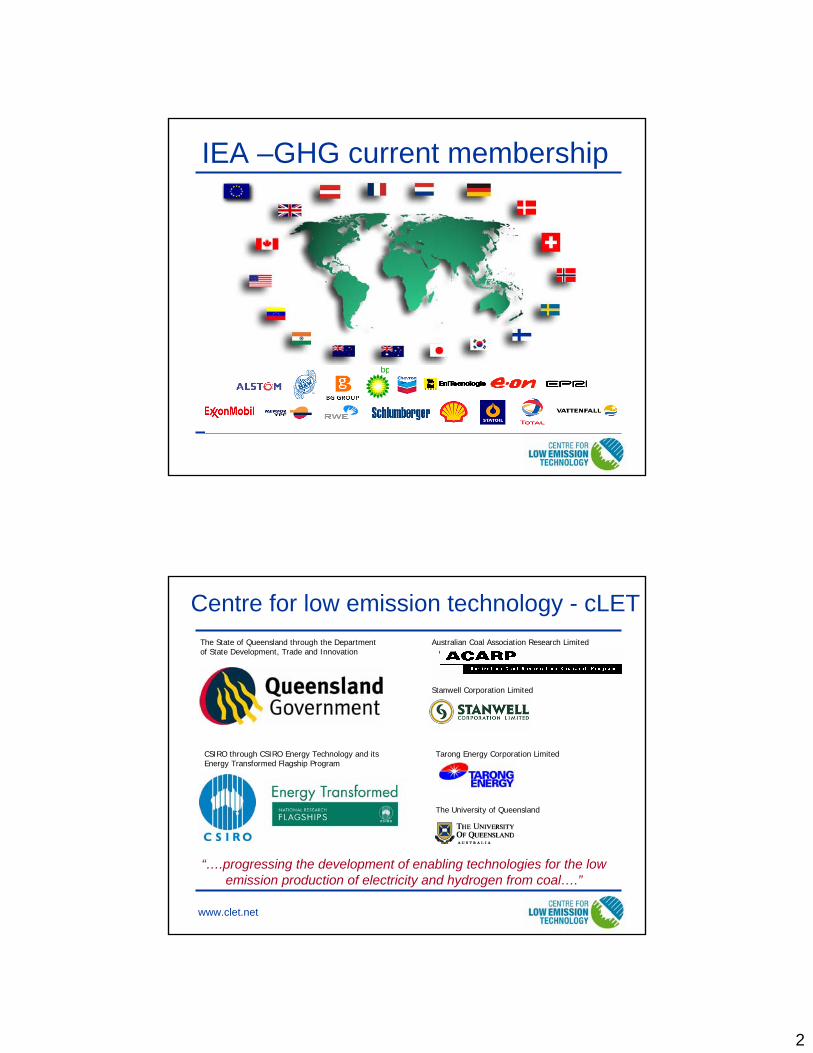
IEA –GHG current membership
Centre for low emission technology - cLET
“….progressing the development of enabling technologies for the low emission production of electricity and hydrogen from coal….”
The State of Queensland through the Department of State Development, Trade and Innovation
CSIRO through CSIRO Energy Technology and its Energy Transformed Flagship Program
Australian Coal Association Research Limited
Tarong Energy Corporation Limited
The University of Queensland
Stanwell Corporation Limited
www.clet.net

3
IPCC projections of CO2 emissions
-5.0
0.0
5.0
10.0
15.0
20.0
1990 2015 2040 2065 2090 2115 2140 2165 2190 2215 2240 2265 2290
Pre-industrial concentrations in the atmosphere 275 ppmToday’s concentration in the atmosphere ~380 ppmA 550 ppm stabilisation scenario would require the removal of over 100 years of the current energy related CO2 emissions into the atmosphere
Business as usual
750 ppm
550 ppm
350 ppm
Em
issi
ons
in b
illio
n to
nnes
of C
/y
Source IPCC TAR
The main influences on CO2 emissions
CO2 = Emissions . Energy . GDP . PopulationEnergy GDP Popn.
Technology Energy use Wealthwww.clet.net
4
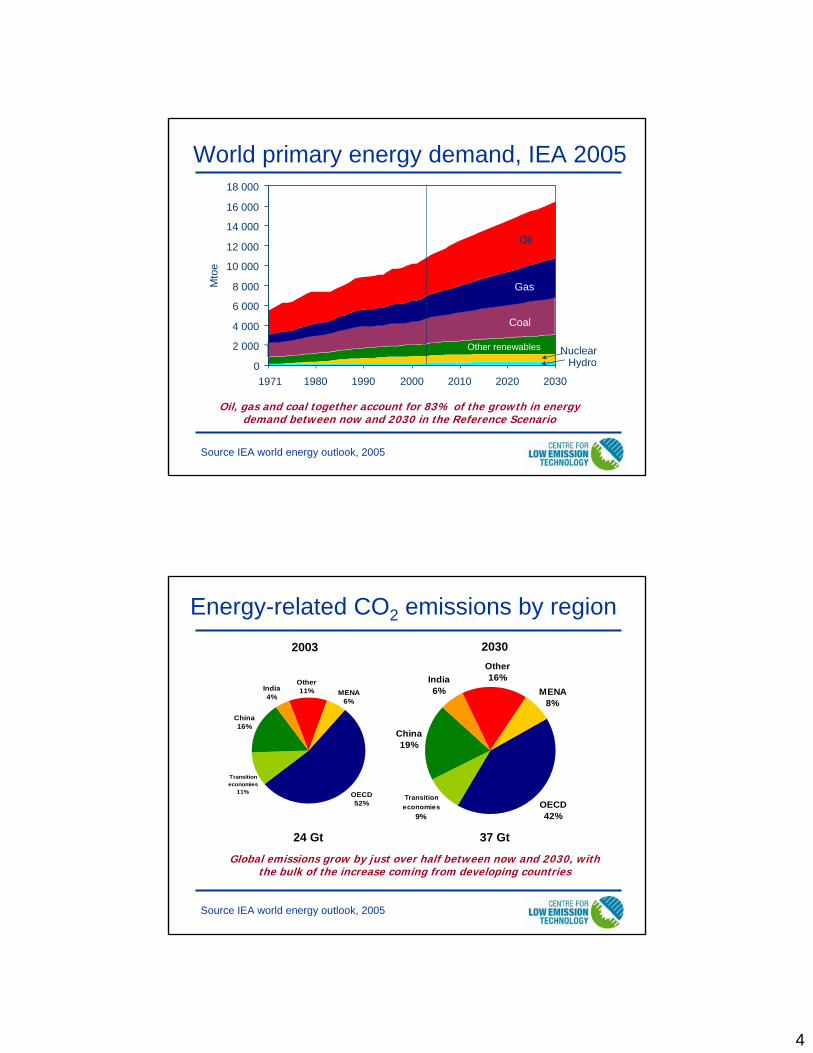
World primary energy demand, IEA 2005
Oil, gas and coal together account for 83% of the growth in energy demand between now and 2030 in the Reference Scenario
Coal
Oil
Gas
Other renewables NuclearHydro0
2 000
4 000
6 000
8 000
10 000
12 000
14 000
16 000
18 000
1970 1980 1990 2000 2010 2020 2030
Mto
e
1971
Source IEA world energy outlook, 2005
Energy-related CO2 emissions by region
Global emissions grow by just over half between now and 2030, with the bulk of the increase coming from developing countries
OECD52%
China16%
India4%
Other11% MENA
6%
Transition economies
11%
OECD42%
China19%
India6%
Other16%
Transition economies
9%
MENA8%
24 Gt
20302003
37 Gt
Source IEA world energy outlook, 2005
5
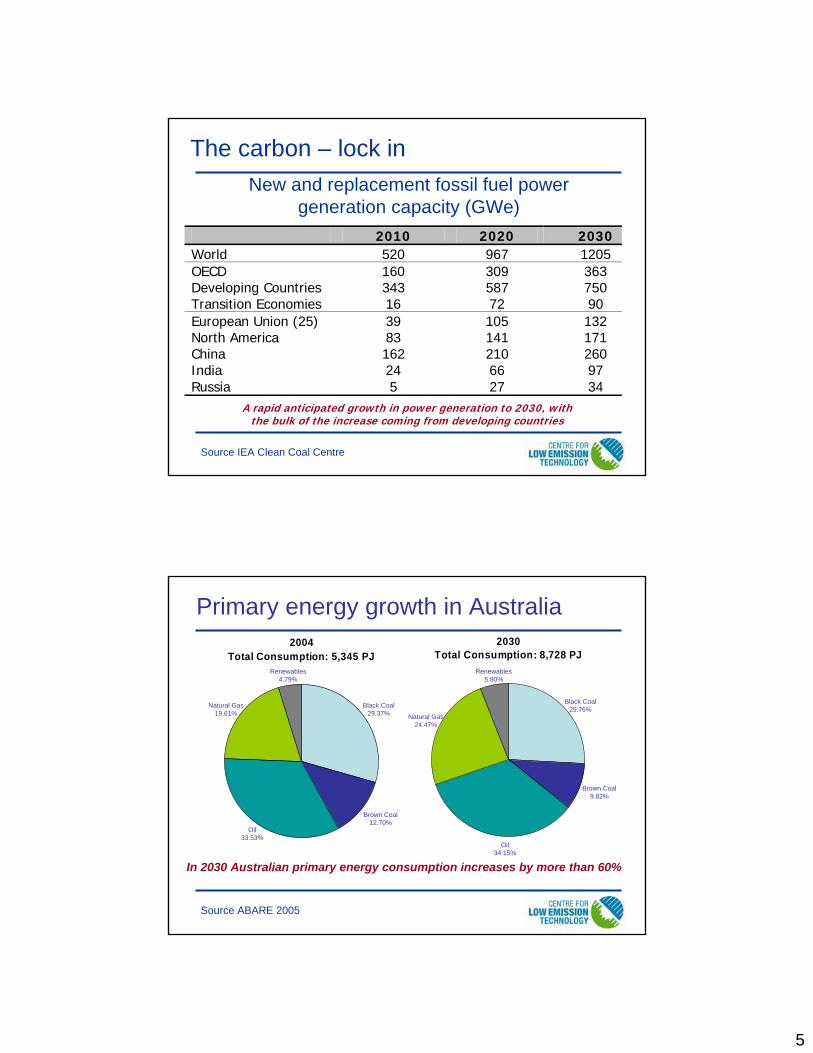
New and replacement fossil fuel power generation capacity (GWe)
2010 2020 2030 World 520 967 1205 OECD 160 309 363 Developing Countries 343 587 750 Transition Economies 16 72 90 European Union (25) 39 105 132 North America 83 141 171 China 162 210 260 India 24 66 97 Russia 5 27 34
The carbon – lock in
A rapid anticipated growth in power generation to 2030, with the bulk of the increase coming from developing countries
Source IEA Clean Coal Centre
Primary energy growth in Australia
Source ABARE 2005
2004Total Consumption: 5,345 PJ
2030Total Consumption: 8,728 PJ
In 2030 Australian primary energy consumption increases by more than 60%
Renewables4.79%
Natural Gas19.61%
Oil33.53%
Brown Coal12.70%
Black Coal29.37%
Renewables5.80%
Black Coal25.76%
Brown Coal9.82%
Oil34.15%
Natural Gas24.47%

6
Options to reduce CO2 emissions
• Reducing energy use– Energy conservation– Improving efficiency of production and end use
• Increasing the use of alternative energy technologies– Renewables: wind, solar, hydro, biomass, geothermal– Nuclear
• New lower emission fossil fuel technologies– Clean coal with carbon capture and storage (CCS)– Natural gas with carbon capture and storage
www.clet.net
Carbon Neutral Energy
Fossil Fuels
H2 Economy (?),De-carbonised electricity (?)
CO2 capture& storage
Nuclear fission& Fusion ?
Conservation, efficiencyand lower carbon fuels
Renewables
2003 to 2030 >50% increase; 85% fossil fuel, 10% renewables, 5% nuclear
The options in a carbon constrained future
www.clet.net

7
The pathway for CO2 capture & storage (CCS)
Fossil fuelsCO2 capture
UtilisationStorage
•Spent oil/gas fields•Saline reservoirs
“Greener”Fossil Fuels(Enhanced oil andcoal seam methane recovery) SINK
SOURCE
Energy, Electricity or H2(with zeroing emissions)
www.clet.net
The vision for low emissions technology
With CO2 capture & storage, will this be a bridge to our energy future?
Coal
or Coal
Source: Adapted from Olav Karstaad, Statoil
8
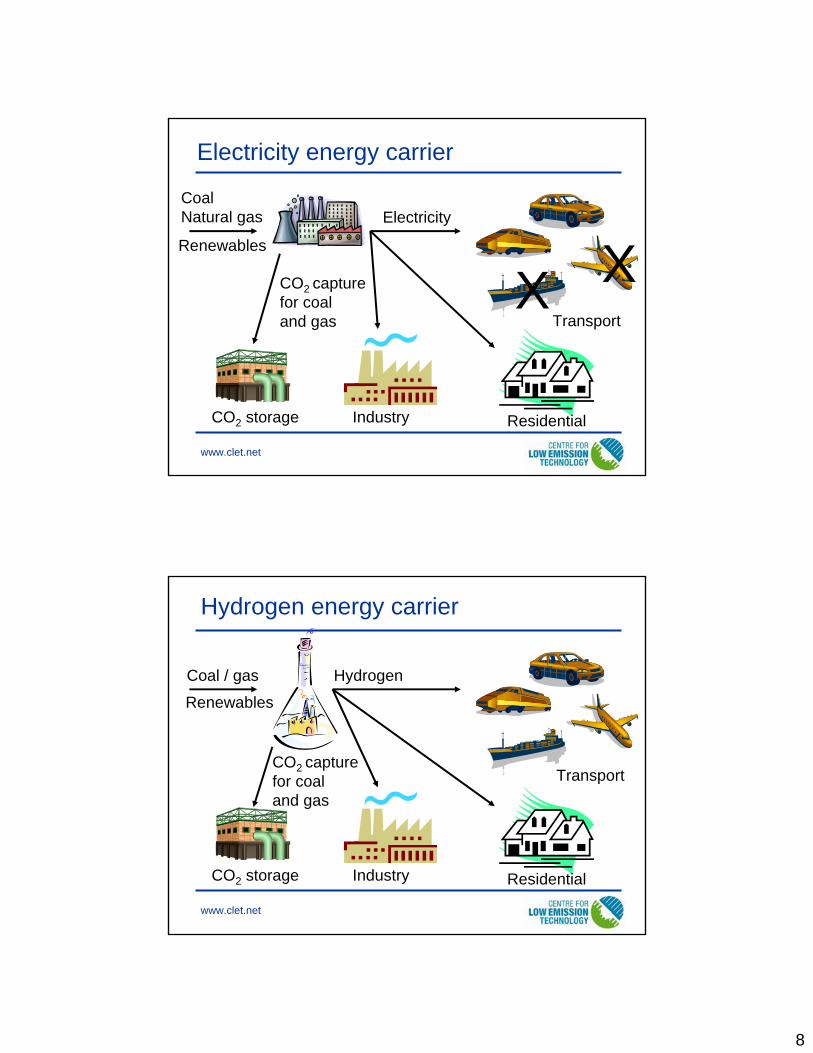
Electricity energy carrier
CO2 storage
CoalNatural gas Electricity
Industry Residential
Transport
CO2 capturefor coal and gas
X XRenewables
www.clet.net
Hydrogen energy carrier
CO2 storage
Coal / gas Hydrogen
Industry Residential
TransportCO2 capturefor coal and gas
Renewables
www.clet.net
9
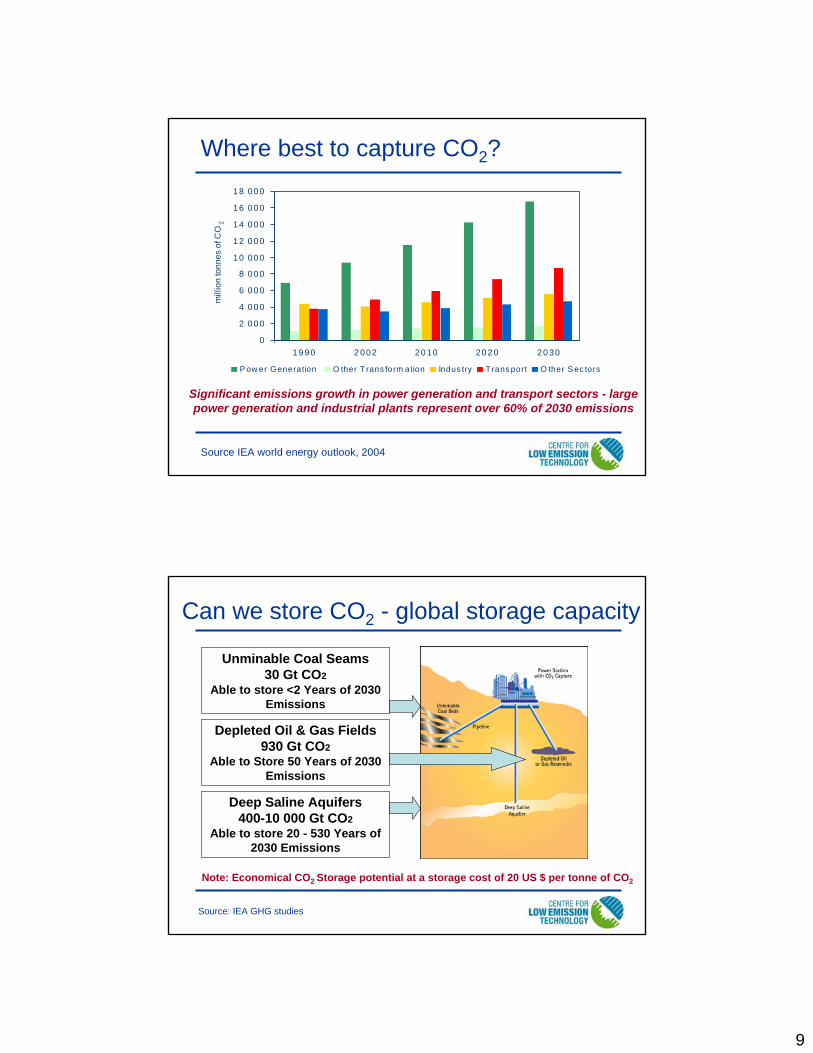
Where best to capture CO2?
0
2 00 0
4 00 0
6 00 0
8 00 0
10 00 0
12 00 0
14 00 0
16 00 0
18 00 0
1 9 90 2 002 20 10 20 2 0 20 30
mill
ion
tonn
es o
f CO
2
P ow er Generation O ther Trans form ation Indus try T rans port O ther S ec tors
Significant emissions growth in power generation and transport sectors - large power generation and industrial plants represent over 60% of 2030 emissions
Source IEA world energy outlook, 2004
Can we store CO2 - global storage capacity
Note: Economical CO2 Storage potential at a storage cost of 20 US $ per tonne of CO2
Deep Saline Aquifers400-10 000 Gt CO2
Able to store 20 - 530 Years of 2030 Emissions
Depleted Oil & Gas Fields930 Gt CO2
Able to Store 50 Years of 2030Emissions
Unminable Coal Seams30 Gt CO2
Able to store <2 Years of 2030Emissions
Source: IEA GHG studies
10
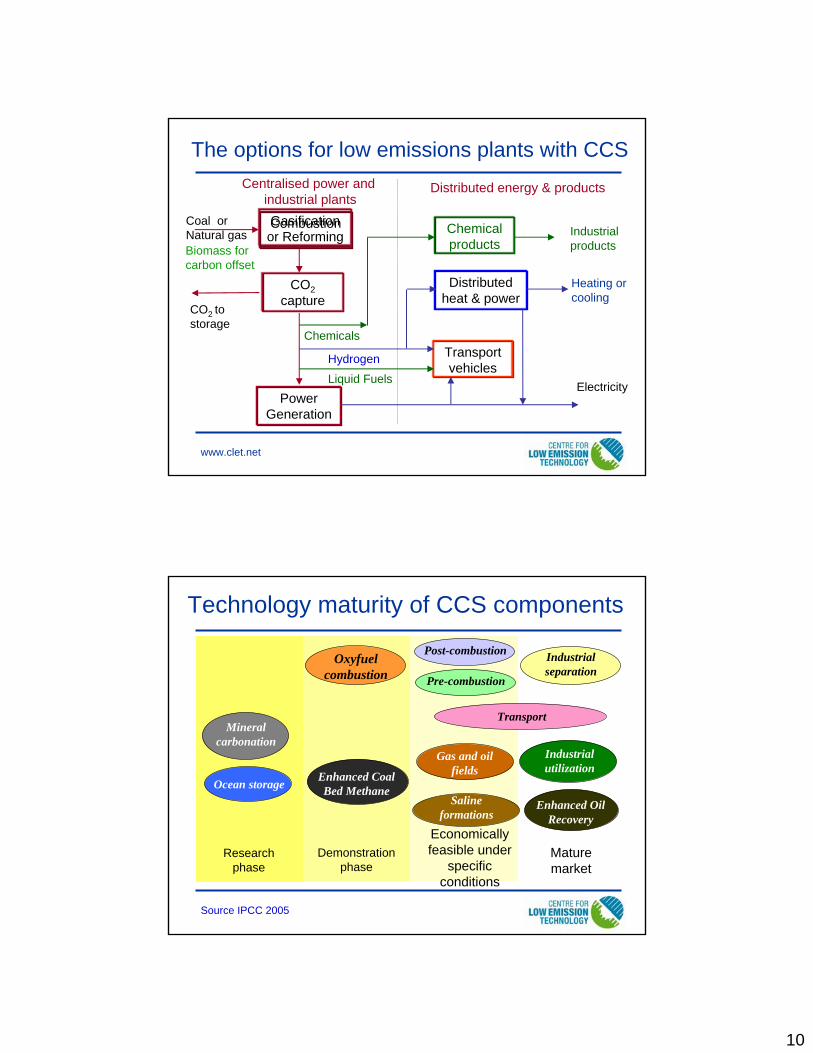
The options for low emissions plants with CCSCentralised power and
industrial plantsDistributed energy & products
Heating or cooling
Coal or Natural gas
Gasification or Reforming
Distributed heat & power
Transport vehicles
Power Generation
Hydrogen
Electricity
CO2 to storage
CO2capture
Liquid Fuels
Chemicals
Chemical products
Industrial products
www.clet.net
Combustion
Biomass for carbon offset
Technology maturity of CCS components
Research phase
Demonstrationphase
Economicallyfeasible under
specificconditions
Maturemarket
Ocean storage
Mineralcarbonation
Industrialutilization
Enhanced CoalBed Methane
Saline formations
Gas and oilfields
Enhanced OilRecovery
Transport
Post-combustion
Pre-combustion
Oxyfuelcombustion
Industrialseparation
Source IPCC 2005

11
Technology maturity - capture in power plants• Power generation with post combustion capture
– SC/USC pulverised coal and NGCC power plants are reliable and proven– Scale up of solvent capture units/integration with power cycle is unproven.
• Power generation with pre-combustion capture– IGCC for coal (1 GWe) is near commercial and proving reliability, better
experience with 3 GWe of IGCC capacity on oil and petcoke. No experience to date with reforming/POX/ATR based natural gas power plants
– Solvent capture units for CO2 available at scale, integration and power block hydrogen utilisation issues
• Power generation with oxyfuel combustion– No proven experience of operation of pulverised coal power plants in an
oxyfuel combustion mode – the issue is “confidence building”– Large scale ASU’s for O2 production proven and reliable.– Some development issues with tail end CO2 purification– CO2 or hybrid turbines do not exist for oxyfuel combined cycles
The cost of CO2 capture and storage
www.clet.net
(-14)-49(-7)-319-4419-68Cost of CO2 avoided with EOR US$/t
0-290-2314-5619-40% increase in cost of electricity or hydrogen with capture and EOR
3-7514-5330-7138-91Cost of CO2 avoided with geosequestration, US$/t
17-4434-4946-9038-54% increase in cost of electricity or hydrogen with capture and geosequestration
Hydrogen Plant
IGCCPulverisedcoal
Natural gas CC

12
Power generation efficiency with capture today
0
10
20
30
40
50
60
Post-comb
IGCCslurry
IGCC dry
Oxyfuel Post-comb
Oxyfuel
Without capture With capture
Efficiency, % LHV
Natural gasCoal
Source: IEA GHG studies
Increase in electricity costs
0
10
20
30
40
50
60
70
80
90
Post-comb
IGCCslurry
IGCC dry Oxyfuel Post-comb
Oxyfuel
Fuel Capital Electricity
Increase in costs due to capture, %
Natural gasCoal
Assumptions: 10% DCF, Coal $1.5/GJ, Gas $3/GJ; Relative to same base plant without capture
Source: IEA GHG studies
13
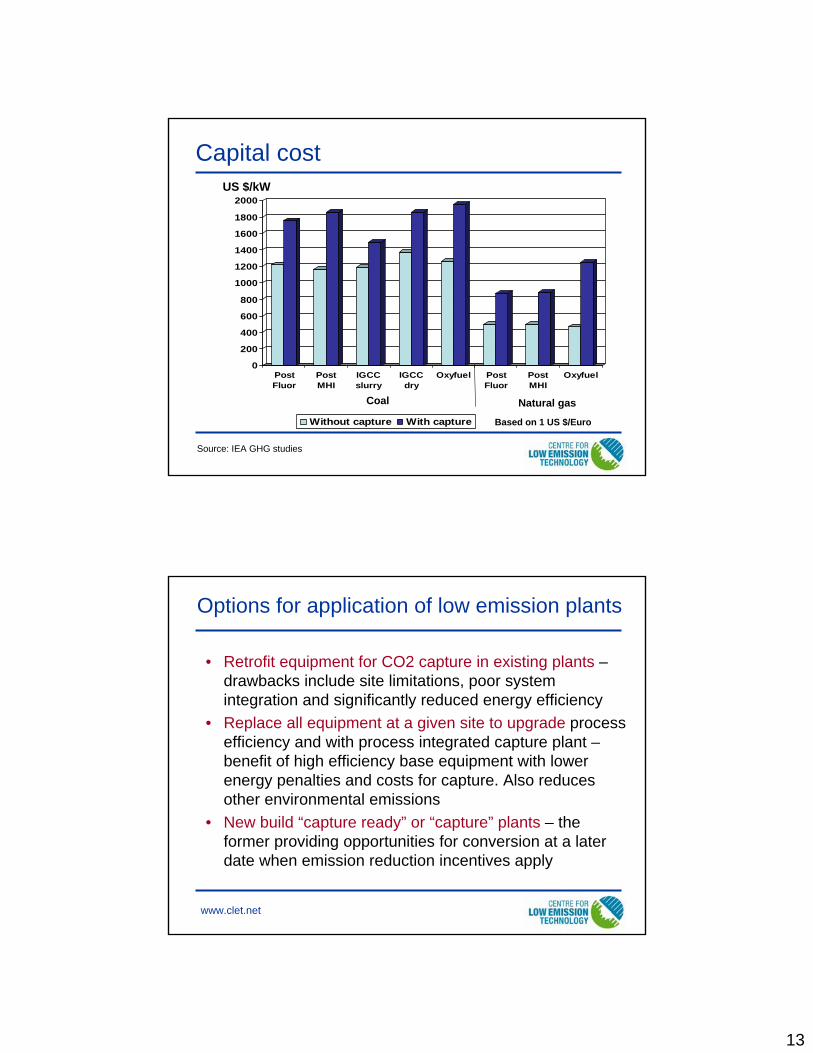
0
200
400
600
800
1000
1200
1400
1600
1800
2000
PostFluor
PostMHI
IGCCslurry
IGCCdry
Oxyfuel PostFluor
PostMHI
Oxyfuel
Without capture With capture
Capital cost
Source: IEA GHG studies
US $/kW
Coal Natural gas
Based on 1 US $/Euro
Options for application of low emission plants
• Retrofit equipment for CO2 capture in existing plants –drawbacks include site limitations, poor system integration and significantly reduced energy efficiency
• Replace all equipment at a given site to upgrade process efficiency and with process integrated capture plant –benefit of high efficiency base equipment with lower energy penalties and costs for capture. Also reduces other environmental emissions
• New build “capture ready” or “capture” plants – the former providing opportunities for conversion at a later date when emission reduction incentives apply
www.clet.net

14
The global economic potential of CCS
• Capacity to remove 220 - 2,200 GtCO2 cumulatively up to 2100, depending on the baseline scenario stabilisation level (450 - 750 ppmv) cost assumptions
• 15 to 55% of the cumulative mitigation effort worldwide until 2100
• Substantial application above CO2 abatement cost of25-30 US$/tCO2
• Cost reduction of climate change stabilisation: 30% or more
• Most scenario studies: role of CCS increases over the course of the century
Source IPCC 2005
Path to improved low emission coal-fired, IGCC2015 on
IGCCcommercial
scaledemos
~38-44 %LHV
Now 2005-10 2010-15Increasing efficiency, lower emissions, lower costs
Early full scale IGCC with CO2 capture
~32-35 %LHV
Advanced IGCClow emission plantsvarious technologies
multi-products~42 - 44 %LHV
Beyond 2020;stationary fuel cells
(IGFC)50 – 58 %LHV?
NOx activities:reduce emissions
CO2 capture activities:physical scrubbing demo
CO2 capture activities:Gas separation & reactor
membranesNew Oxygen production
plants commercial
Dry cleaning options:Particulates, Sulphur,
Nitrogen, trace elements
Commercial non-CO2Capture IGCC plants
An example of technology improvements that can reduce costs by at least 20- 30% or more over the next decade
HydrogenTurbines
15
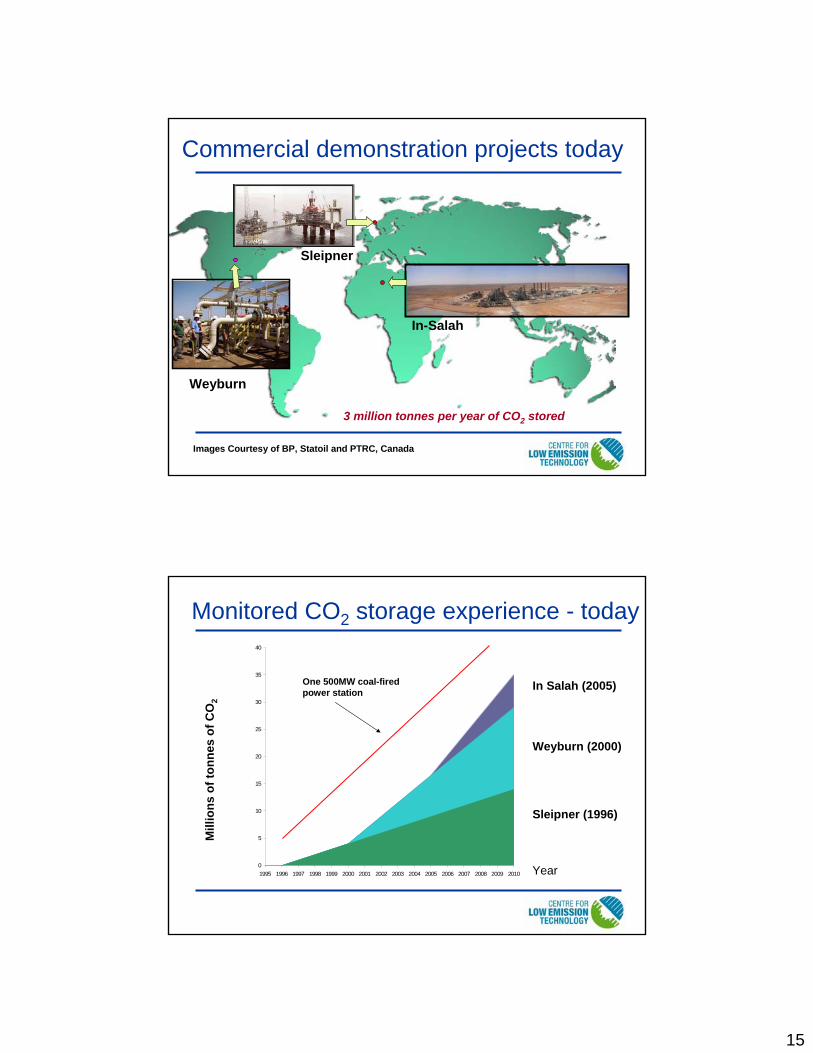
Sleipner
Weyburn
In-Salah
Commercial demonstration projects today
Images Courtesy of BP, Statoil and PTRC, Canada
3 million tonnes per year of CO2 stored
Monitored CO2 storage experience - today
0
5
10
15
20
25
30
35
40
1995 1996 1997 1998 1999 2000 2001 2002 2003 2004 2005 2006 2007 2008 2009 2010 Year
Mill
ions
of t
onne
s of
CO
2
Sleipner (1996)
Weyburn (2000)
In Salah (2005)One 500MW coal-fired power station
16
Other planned commercial-scale projects
• Statoil, Snøhvit, Norway (start-up 2006/7)• Gorgon, Australia (planned start 2008-2010)• BP, Miller-Peterhead – DF1, Scotland (operation
start 2009)• BP, Carson - DF2, California (operation start
2009)• Statoil and Shell, Draugen, Norway (operation
start 2010)Total anticipated CO2 storage arising from these projects is an
additional 12.5 million tonnes per year
www.clet.net
Proposals for coal based power plant demos
• Zerogen, Stanwell, Australia (proposed)• SaskPower, Canada (operation start 2012)• Hypogen/Dynamis, European Union (operation
start after 2012)• FutureGen, USA (operation start 2012)• RWE
– Germany - IGCC– UK – post-combustion / oxyfuel
• E.ON, UK
www.clet.net

17
Challenges – pipelines and source/sinks• CO2 pipeline transmission is well but not widely established• There are significant investment and infrastructure
development issues to be addressed – also in need of source/sink matching
• However: Large CO2 pipelines have been in use since the 1970sCO2 supplied for enhanced oil recovery (mostly natural)About 4000 km of pipeline in use todayMost pipelines are in the USA (Texas/New Mexico)Individual pipeline capacities up to 20 Mt/yGood source/sink matching in some regions e.g. USA
Example - Source/sink matching
North America• Top 500 sources emit 3.3
Gt CO2/y• Sources overlay storage
formations• 3.1 Gt CO2/y can be stored
in formations within 150km of each source
• Some areas may already have existing pipelines/wells
Not always the case in several regions of the world
18
Challenges - legal and regulatory
• Rules and standardsCurrent regulatory practises relevant to CCSExperience in related industries
Natural gas storage/ Acid Gas injection/ EOROther underground injection control programs
• Permitting/Licensing issues • Long term liability• Environmental Impact Assessment• Monitoring requirements• Remediation practices
Challenges - public awareness• Acceptance of CCS as a GHG mitigation option
– A solution amongst a balanced portfolio of energy technology options – “not a silver bullet”
• Potential for deep reduction in emissions whilst meeting energy demand– Allows orderly transformation of existing energy
technology infrastructure– Address the safety and security of storage
• Vision as a “bridge” to a new energy technology future– Seeds the development of a decarbonised electricity
and hydrogen energy infrastructure– With prospects for greater integration with renewables

19
Thank You
More information can be found at:www.ieagreen.org.uk
www.co2captureandstorage.info