Embed Size (px)
Citation preview

The Innovation Imperative in Manufacturing
How the United States Can Restore Its Edge

The Boston Consulting Group (BCG) is a global management consulting fi rm and the world’s leading advisor on business strategy. We partner with clients in all sectors and regions to identify their highest-value oppor-tunities, address their most critical chal-lenges, and transform their businesses. Our customized approach combines deep in sight into the dynamics of companies and mar-kets with close collaboration at all levels of the client organization. This ensures that our clients achieve sustainable compet itive advantage, build more capable organiza-tions, and secure lasting results. Founded in 1963, BCG is a private company with 66 offi ces in 38 countries. For more informa-tion, please visit www.bcg.com.
The National Association of Manufacturers’ mission is to advocate on behalf of its members to enhance the competitiveness of manufacturers by shaping a legislative and regulatory environment conducive to U.S. economic growth and to increase under-standing among policymakers, the media, and the general public about the vital role of manufacturing in America’s economic and national security for today and in the future.
The Manufacturing Institute is a nonparti-san organization focused on delivering lead-ing-edge information and services to the nation’s manufacturers through its National Center for the American Workforce and its National Center for Manufacturing Research and Innovation. The Institute’s mission in-cludes designing and implementing human capital strategies for manufacturers and ad-vancing the innovation capacity of manu-facturers operating in a worldwide market. The Manufacturing Institute is a 501(c)(3) arm of the National Association of Manu-facturers.
The Innovation Imperative in Manufacturing
How the United States Can Restore Its Edge
bcg.com
James P. Andrew
Emily Stover DeRocco
Andrew Taylor
March 2009

© The Boston Consulting Group, Inc. 2009. All rights reserved.
For information or permission to reprint, please contact BCG at:E-mail: [email protected]: +1 617 850 3901, attention BCG/PermissionsMail: BCG/Permissions The Boston Consulting Group, Inc. One Beacon Street Boston, MA 02108 USA

T I I M
Contents
Note to the Reader 5
Introduction 6
What Is Innovation? 8
Which Countries and States Are the Most Innovative? 9
What Drives Innovation Success? 14Idea Generation 14Structured Processes 16Leadership 16Skilled Workers 18
The Role of Government 19Boosting Company Payback on Innovation 19Supporting Innovation Activities 19Improving the Environment for Innovation 21Promoting Industry Clusters 22
An Agenda for Action 24
Appendix: International Rankings 25
For Further Reading 28

T B C G

T I I M
Note to the Reader
“Nothing is more important than in-novation. The minute we stop inno-vating, we die.” This remark, made by one of the manufacturing compa-ny executives we interviewed for this report, mirrors our own opinion and the urgency of our fi ndings. In these challenging economic times, business innovation is more than ever a criti-cal strategic imperative.
This report assesses the state of inno-vation in the United States; describes the most eff ective tools for promot-ing innovation, according to the re-spondents to our innovation assess-ment survey; and explores how stakeholders—company executives and policymakers alike—can take practical steps to move toward the shared goal of encouraging and sus-taining innovation. We hope this re-port helps to enhance the state of manufacturing innovation in the United States.
About the AuthorsJames P. Andrew is a senior partner and managing director in the Chica-go offi ce of The Boston Consulting Group and the leader of BCG’s global innovation activities. Emily Stover DeRocco is president of The Manufacturing Institute and a senior vice president of the National Associ-ation of Manufacturers. Andrew Taylor is a partner and managing di-rector in BCG’s Chicago offi ce.
AcknowledgmentsThe authors would like to thank the members of the National Association of Manufacturers (NAM) who partici-pated in our innovation assessment survey and, in particular, those who took the time to participate in our in-depth executive interviews. We would also like to thank the mem-bers of The Manufacturing Insti-tute’s board of directors and Innova-tion Committee, whom we consulted on the approach used in our research and on the weight assigned to the various elements of our Internation-al Innovation Index, as well as the NAM policy vice presidents who assisted in developing the correct measurement targets.
The authors would like to acknowl-edge the contribution of Paul Gor-don, a senior partner and managing director in BCG’s Chicago offi ce and the leader of the Industrial Goods practice in the Americas. We would also like to thank Kelsey Arneson, Joern Kallmeyer, Jonathan Mayer, Jennifer McNelly, Erin Miller, Xavier Mosquet, and Mike Pykosz for their contributions to researching and writing this report, and Gary Calla-han, Martha Craumer, Angela DiBat-tista, Gina Goldstein, and Sharon Slodki for their contributions to its editing, design, and production.
For Further ContactIf you would like to discuss this re-port, please contact one of the au-thors. For additional information on BCG’s innovation activities, visit the Web site of the BCG Innovation Insti-tute (http://innovation.bcg.com) or contact James P. Andrew.
James P. AndrewBCG Chicago+1 312 993 [email protected]
Emily Stover DeRoccoThe Manufacturing InstituteNational Association of ManufacturersWashington, DC+1 202 637 [email protected]
Andrew TaylorBCG Chicago+1 312 993 [email protected]

T B C G
Introduction
More than ever before, business innova-tion is a strategic imperative. A critical driver of growth, competitiveness, and shareholder value, innovation is cited by senior executives around the world
as integral to their companies’ success. And innovation benefi ts countries as well. In those with thriving indus-tries, people have higher incomes, a better quality of life, and a higher standard of living than in less robust nations.
In today’s global economy, the need to stay one step ahead of the competition is even more urgent—especial-ly for industries in the United States. The emergence of challengers from rapidly developing economies such as India, China, Brazil, and Eastern Europe has transformed the playing fi eld.1 With high-quality inexpensive products fl ooding the market from every corner of the globe, com-peting on cost alone is a losing battle for most U.S.-based manufacturers. According to a recent study, the United States has aggregate structural costs that are 17.6 percent higher than those of its nine largest trading partners, put-ting U.S. companies at a signifi cant disadvantage.2 This imbalance puts the 13.8 million manufacturing jobs in the United States at risk as production increasingly threat-ens to move off shore.3 The current economic downturn makes circumstances even more dire.
To stay in the game, companies in the United States must diff erentiate themselves through innovation: new prod-ucts and services, new ways of working, new ways of go-ing to market. And government—at both the national and the local level—must support these eff orts through eff ective policies. Now is the time for companies and countries alike to focus on strengthening their competi-tive position. Only those nations that continue to invest
in innovation and its enablers, such as a highly skilled and talented work force, will stay competitive in the long run.
With this in mind, BCG, NAM, and The Manufacturing Institute sought to assess the current state of innovation at U.S. companies and how the United States ranks as an innovation leader relative to other countries. What fac-tors make companies successful at innovation? And what role does government policy play in supporting innova-tion? To fi nd the answers, we conducted a detailed inno-vation assessment with three components:
A survey of NAM corporate members across all industries, ◊ representing a wide range of company sizes. The survey focused on three areas: the use of innovation tools and processes, innovation results, and the impact of public policy. We received 1,032 responses, 78 percent from high-level executives—most in general management or business development and strategy.
A series of one-hour follow-up interviews with 30 senior ◊ executives to identify common concerns, best practices, and ways to improve the innovation climate. The questions focused on two main issues: approaches to and experi-ences with innovation and how the United States ranks as a center of innovation.
1. See The 2008 BCG 100 New Global Challengers: How Top Companies from Rapidly Developing Economies Are Changing the World, BCG re-port, December 2007.
2. Jeremy A. Leonard, The Tide Is Turning: An Update on Structural Cost Pressures Facing U.S. Manufacturers, National Association of Manufacturers and The Manufacturing Institute, November 2008.
3. U.S. Bureau of Labor Statistics, http://data.bls.gov/PDQ/servlet/SurveyOutputServlet?series_id=CES3000000001&data_tool=XGtable.

T I I M
A comparison of the “innovation friendliness” of 110 ◊ countries and all 50 U.S. states on the basis of their gov-ernment policies and performance. Using these data, we developed the International Innovation Index, which includes more countries than other previous such com-pilations, and the fi rst National Innovation Index, which addresses both innovation inputs and outputs.
Not surprisingly, we found that innovation drives the relative success of companies and countries alike. Coun-tries with the most innovative companies and industries tend to have a larger gross domestic product per capita than those that are less forward-looking. Because of this strong link between innovation and growth, many gov-ernments are committing resources to support innova-tion. China and India, for instance, have both declared innovation to be a strategic national priority and have dedicated signifi cant resources to meet their goals in sci-ence and technology. China has developed a 15-year plan for science and technology, and India is increasing invest-ment in research and development by an average rate of 40 percent per year.4 By comparison, our interviews sug-gest that the United States may be falling short in its com-mitment to innovation and in its innovation perfor-mance.
The survey and analyses on which this report is based diff er from previous research in addressing both the busi-
ness outcomes of innovation and government’s ability to encourage and support innovation through public policy. The interdependence of government and business, and the mutual need for success in this critical area, came into sharp focus as we analyzed our fi ndings. In this report, we will outline the actions that companies can take to become more innovative, and parallel steps that govern-ments can take to support those eff orts.
To understand the drivers and enablers of innovation, we used metrics that capture a wide array of innovation re-sults. We evaluated those metrics by assigning weights to each of their component elements on the basis of a poll of expert practitioners and executives. We also collected data, including innovation-specifi c measures and broader economic and social measures, from third-party research sources, including the World Bank, Unesco, and the World Economic Forum. We then ranked countries and grouped states according to their index scores. Finally, by adding interview data to our survey data, we gained a deeper understanding of the state of innovation within compa-nies and of how executives view the innovation climate globally.
4. “China’s 15-Year Science and Technology Plan,” Physics Today, December 2006; “India and China Wise Up to Innovation,” BusinessWeek, January 30, 2007.

T B C G
Once narrowly defi ned as simply the devel-opment of new products, innovation is now understood to apply to all aspects of a business. One executive we interviewed summed up this evolving defi nition: “We’ve
expanded our thinking on innovation. We used to focus on new-product development, but now we see that prod-ucts are only one aspect. We look upstream and down-stream for other applications, including the business mod-el, enterprise structure, value chain, proprietary processes, channels, service, brand, and customer experience.”
In accordance with this broader defi nition, our innova-tion assessment took into account two types of innova-tion output:
Tangible Outcomes. ◊ New products, knowledge, formulas, designs, and expertise that are easily quantifi ed and can be legally protected through patents or other intel-lectual-property vehicles.
Intangible Outcomes.◊ New processes or ways of doing business that lead to a competitive advantage, such as a new companywide production process that results in higher quality and greater productivity. Intangible out-comes aren’t themselves easily quantifi ed but can have a major impact on quantifi able results, such as overall business performance. They generally cannot be le-gally protected.
What Is Innovation?
T I I M
Which Countries and States Are the Most Innovative?
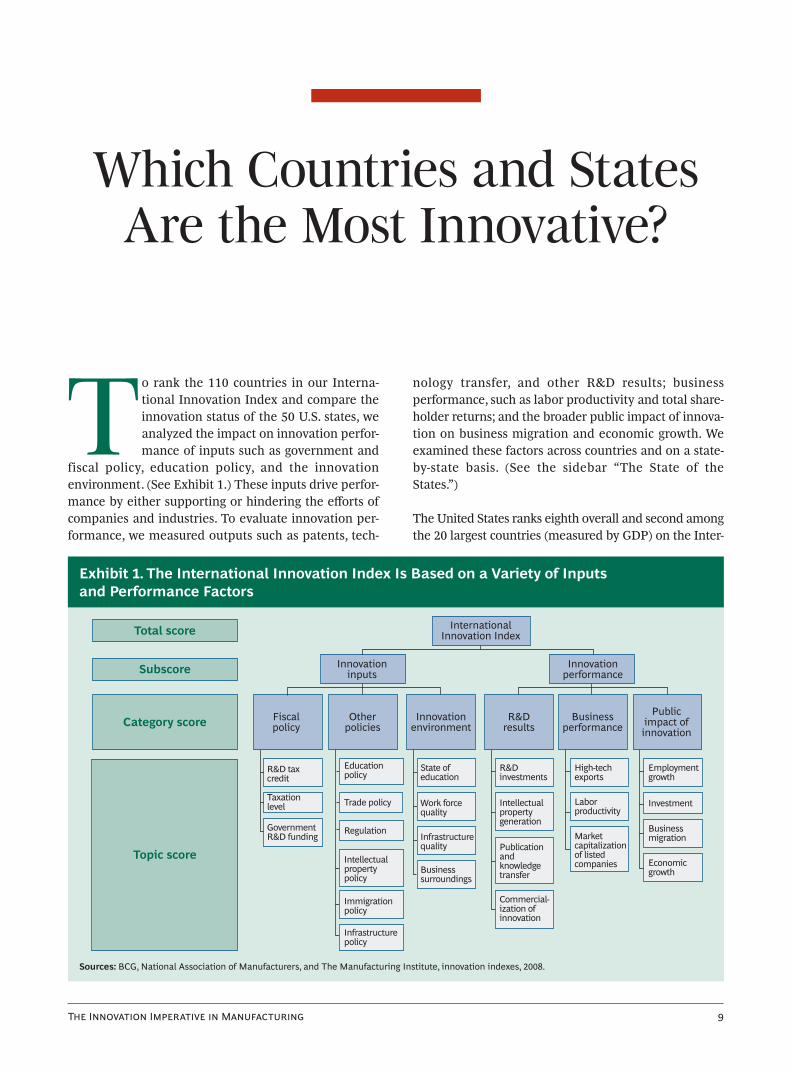
T o rank the 110 countries in our Interna-tional Innovation Index and compare the innovation status of the 50 U.S. states, we analyzed the impact on innovation perfor-mance of inputs such as government and
fiscal policy, education policy, and the innovation environment. (See Exhibit 1.) These inputs drive perfor-mance by either supporting or hindering the eff orts of companies and industries. To evaluate innovation per-formance, we measured outputs such as patents, tech-
nology transfer, and other R&D results; business performance, such as labor productivity and total share-holder returns; and the broader public impact of innova-tion on business migration and economic growth. We examined these factors across countries and on a state-by-state basis. (See the sidebar “The State of the States.”)
The United States ranks eighth overall and second among the 20 largest countries (measured by GDP) on the Inter-
Category score
Total score
Subscore
Topic score
InternationalInnovation Index
Innovationinputs
Innovationperformance
R&Dresults
Businessperformance
Otherpolicies
Innovationenvironment
Fiscalpolicy
Publicimpact ofinnovation
R&D taxcredit
Taxationlevel
GovernmentR&D funding
Intellectualpropertypolicy
Trade policy
Regulation
Educationpolicy
Immigrationpolicy
Infrastructurepolicy
Work forcequality
State ofeducation
Infrastructurequality
Businesssurroundings
R&Dinvestments
Intellectualpropertygeneration
Publicationandknowledgetransfer
Commercial-ization ofinnovation
High-techexports
Laborproductivity
Market capitalizationof listedcompanies
Investment
Employmentgrowth
Businessmigration
Economicgrowth
Exhibit 1. The International Innovation Index Is Based on a Variety of Inputs and Performance Factors
Sources: BCG, National Association of Manufacturers, and The Manufacturing Institute, innovation indexes, 2008.

T B C G
national Innovation Index. (See Exhibit 2 and the Appen-dix.) Although still a top-tier player, it has fallen behind such countries as Singapore, South Korea, and Switzer-land as an innovator. The United States is disadvantaged in several key areas, including work force quality and eco-nomic, immigration, and infrastructure policies. (See the section “The Role of Government” for a discussion of some of these issues.)
The executives we interviewed believe that the United States is losing its distinc-tion as an innovation leader and may be underinvesting in its future. The com-ments we heard included the following:
“I am concerned that the state of manufacturing and ◊ education in the U.S. is taking away the innovative spirit and diminishing the entrepreneurial sense that has long been the country’s greatest strength.”
“The U.S. lacks uniqueness; innovation is now found ◊ everywhere, not exclusively or even prominently in the U.S.”
“The U.S. has moved into a situation of parity with the ◊ rest of the world.”
“It’s like sports: athletes get old and new players step ◊ up to the plate.”
“The U.S. is becoming a victim of its ◊ own success; people are content with their standard of living and less motivated to improve their situation.”
Despite these concerns, the United States is still perceived as having valuable and unique attributes. In our interviews, we consistently heard comments such as
the following:
“The U.S. has a culture that encourages innovation. We ◊ don’t punish those who have tried and failed; instead we look at it as a learning experience.”
“The U.S. attracts global talent, and that melting pot of ◊ ideas makes for a great climate for innovation.”
Sources: BCG, National Association of Manufacturers, and The Manufacturing Institute, innovation indexes, 2008.Note: Countries in the large-country ranking are the top 20 countries in the world by GDP. Because of rounding, two or more countries may appear to have the same overall score. For the purposes of these rankings, Hong Kong is considered a national entity.
Ranking Country Score
1 Singapore 2.45 2 South Korea 2.26 3 Switzerland 2.23 4 Iceland 2.17 5 Ireland 1.88 6 Hong Kong 1.88 7 Finland 1.87 8 United States 1.80 9 Japan 1.79 10 Sweden 1.64 11 Denmark 1.60 12 Netherlands 1.55 13 Luxembourg 1.54 14 Canada 1.42 15 United Kingdom 1.42 16 Israel 1.36 17 Austria 1.15 18 Norway 1.14 19 Germany 1.12 20 France 1.12
Overall ranking Large-country ranking
Ranking Country Score
1 South Korea 2.26 2 United States 1.80 3 Japan 1.79 4 Sweden 1.64 5 Netherlands 1.55 6 Canada 1.42 7 United Kingdom 1.42 8 Germany 1.12 9 France 1.12 10 Australia 1.02 11 Spain 0.93 12 Belgium 0.86 13 China 0.73 14 Italy 0.21 15 India 0.06 16 Russia –0.09 17 Mexico –0.16 18 Turkey –0.21 19 Indonesia –0.57 20 Brazil –0.59
Exhibit 2. Other Countries Have Surpassed the United States in Innovation
The United States
is losing its
distinction as an
innovation leader.

T I I M
“U.S. tech capabilities are very high and will sustain ◊ successful innovation in the near term.”
“American universities are among the top in the world ◊ for education and research.”
“Everyone wants to study and teach in the U.S.” ◊
Because of these strengths, companies value the United States as a center for basic research—now and in the future. “We are invested in maintaining the U.S. as our hub of innovation,” said one executive. Another noted, “While manufacturing will go to low-cost countries, in-novation centers will stay in the U.S.”
Although the United States still has great appeal as an innovation center, some companies are in fact moving selected innovation eff orts elsewhere—o en set-ting up R&D centers abroad to capitalize on leading-edge talent and lower-cost scientists and engineers or to
better meet local market needs. An executive at one large company explained, “We have created research centers internationally—for example, in Singapore—to be closer to our international customers, who are becoming more and more important.” Indeed, compa-nies are expanding their global footprint—a refl ection of the changing nature of business. “Thought leaders in many industries are no longer predominantly based in the U.S.,” observed one executive we interviewed. “To maintain the current trend, we need to create a global network.”
In fact, innovation is becoming a two-way street. Just as it is following customers abroad, innovation is also in-creasingly being imported into the United States. “Our labs in Asia are starting to come up with ideas that not only apply to their local customers but also are useful back here in the U.S.,” noted one U.S.-based executive. “We are no longer solely an exporter of innovation but also an importer.”

T B C G
The 50 U.S. states are quite similar to one another in their innovation performance, especially when compared with the 110 countries on the International Innovation Index, which vary considerably. This similarity stems from two factors. First, federal policies, such as those re-lating to immigration, trade restrictions, and intellectual property protection, are the same across all the states. Federal corporate taxes and R&D spending dwarf state taxes and spending, further reducing state-to-state diff er-ences. (See the exhibit “State-Level Fiscal Policy Is a Relatively Insignifi cant Factor.”) Second, a single “Ameri-can culture” pervades the country’s overall business cli-mate, overriding many diff erences among regions, indus-tries, and ethnic groups.
In light of this similarity, instead of compiling an abso-lute ranking—which might have distorted the impor-tance of the relatively small differences that do exist—we grouped the states into clusters on the basis of their innovation inputs and tangible and intangible performance outcomes. (See the exhibit “The States’ Innovation Performance Falls into Five Clusters.”) We used the same methodology as we did for the interna-tional index, drawing on the advice of experts as
well as on third-party and government data, to develop the metrics and assign weights to each element. After computing the input and performance scores for each state, we plotted the results to develop the clusters shown.
As on the International Innovation Index, the single big-gest driver of success on the National Innovation Index is the innovation environment. Thus California, Connecti-cut, Massachusetts, and other states with available ven-ture capital and a more skilled work force (likely resulting from a very strong education system) do well. And since work force quality is the key component of an environ-ment conducive to innovation, the ability to attract, train, and retain science and engineering graduates with ad-vanced degrees is critical. Fiscal policy plays an important but lesser role, in part because of the relatively minor im-pact of state policy. (This underscores the importance of a strong and consistent federal agenda. State governments may fi nd it in their best interests to work together to pro-mote federal legislation that supports innovation.)
Two unexpected fi ndings emerged from the national as-sessment. First, some states with “less attractive” busi-
The State of the States
1191
Stateagencies
Business
$billions
R&D funding, by source
0
53
220
Federal
$billions
Corporate tax revenues
State and local(all 50 states)
250
200
150
100
50
0
250
200
150
100
50
Academicinstitutions
Privatenonprofits
100
223
Federaland other
government
State-Level Fiscal Policy Is a Relatively Insignificant Factor
Sources: U.S. Census Bureau; U.S. Government Printing Office; Unesco Institute for Statistics.Note: All funds were allocated in fiscal year 2006.

T I I M
ness climates—such as California, New York, Connecti-cut, and Massachusetts—scored well on the index. One reason may be that the most important factor in evaluating the attractiveness of a state’s business cli-mate—the structural cost burden (including taxes and other costs of doing business)—was of secondary impor-tance to the National Innovation Index, which focuses on factors that specifi cally aff ect innovation. It may also be that the most innovation-friendly states can “aff ord” to have weaker business climates. Places such as Califor-nia’s Silicon Valley and the area around Boston have giv-en rise to such a critical mass of innovation that compa-nies are unlikely to move away merely because costs are lower elsewhere. Still, a higher cost structure may pre-vent new centers of innovation from arising—a negative long-term eff ect.
The second unexpected fi nding was the high score achieved by Delaware, a state not typically considered a center of innovation. This may be attributed to the ef-fect of secondary, intangible measures of innovation, such as the number of businesses that incorporate there or migrate to the state, and their total shareholder returns. However, Delaware also ranks high on the quality of its work force and education—key drivers of inno-vation.
States either reaping the rewards of past policies or achieving high efficiency at converting inputs into performance:
States succeeding at both inputs and performance:
◊ Idaho◊ Montana◊ Oregon◊ Texas
◊ California◊ Connecticut◊ Delaware◊ Massachusetts◊ New York◊ Washington
States at or near the mean in both inputs and performance:
◊ Alabama◊ Arizona◊ Colorado◊ Georgia◊ Illinois ◊ Indiana◊ Iowa ◊ Kansas
◊ Louisiana ◊ Maryland◊ Minnesota◊ Nebraska◊ Nevada ◊ North Carolina◊ North Dakota ◊ Oklahoma
◊ Pennsylvania◊ South
Carolina◊ Tennessee◊ Utah◊ Virginia◊ Wisconsin◊ Wyoming
States facing significant challenges in promoting and achieving innovation:
States struggling to translate positive inputs into performance:
◊ Alaska◊ Florida◊ Kentucky◊ Maine◊ Michigan◊ Mississippi
◊ Missouri◊ New
Hampshire ◊ New Mexico◊ South Dakota◊ West Virginia
◊ Arkansas◊ Hawaii◊ New Jersey◊ Ohio◊ Rhode Island◊ Vermont
Innovation performance
Above average
Below average
Below average Above averageInnovation inputs
The States’ Innovation Performance Falls into Five Clusters
Sources: BCG, National Association of Manufacturers, and The Manufacturing Institute, innovation indexes, 2008.

T B C G
W hile most U.S. companies understand the importance of innovation, few are satisfi ed with their innovation performance, and most see room for major improvement in their innova-
tion processes. In an ongoing executive innovation survey conducted by The Boston Consulting Group and Business-Week magazine, fewer than half of the most recent re-spondents said they were satisfi ed with the fi nancial re-turn on their innovation investments. (See Exhibit 3.) But companies dissatisfi ed with their innovation performance can take specifi c steps to improve it. In the course of our assessment, four key success factors emerged: idea gen-eration, structured processes, leadership, and skilled workers. By understanding these factors, companies can develop the tools they need to become more innovative, and governments can more eff ectively help the business-es within their borders succeed.
Idea Generation
Good ideas matter. Generating and developing ideas are the fi rst step toward better innovation performance, and companies deemed “excellent” in this area use a variety of tools. (See Exhibit 4.) Those cited most o en include making a bigger investment in idea generation (this is especially relevant to larger companies with more re-sources); developing a deep understanding of customers; increasing management focus; and establishing a com-pany culture that supports innovation.
Outside sources of ideas are important to innovation. For example, working closely with customers can help gener-ate new ideas while deepening existing relationships. Said one executive, “We help customers by identifying needs and solving them. This o en means that we create
a custom solution just for them, which in turn expands our own capabilities and expertise.” Another explained, “Saying yes to customer requests drives innovation. We endure a trial by fi re when we commit to something we don’t actually have yet.” Customer-driven innovation can lead to higher-margin products. It also adds customer value, which can make it easier to compete with low-cost producers.
One executive we interviewed described how his com-pany improved its deicing salt products a er a local mu-nicipality complained about damage caused by salt to roads, vehicle windshields and paint, and the environ-ment. The company researched a variety of ways to change the product and ultimately discovered that coat-ing the salt with an organic compound caused less harm to the environment and prevented the salt from bounc-ing on the road, which is what damages vehicles. Coated-salt products now account for a growing percentage of sales in the United States and the United Kingdom. “It’s actually a better product,” noted the executive. “Not only does it solve the customer’s problems, it deices better than traditional rock salt.”
Suppliers are another valuable, effi cient, and cost-eff ec-tive source of new ideas. As one auto manufacturer said, “We drive innovation through the supply chain. Seventy to eighty percent of our innovation value comes from suppliers in some way.” Another executive claimed, “Many of our key suppliers are also small, creating a peer relationship that encourages collaboration.” Partnerships with suppliers can also diff use risk and lighten the capital investment needed for development.
Sometimes partnering with a supplier can be a cost-eff ec-tive and relatively low-risk way to improve a product. One
What Drives Innovation Success?

T I I M
Exhibit 3. Only 43 Percent of Companies Are Satisfied with Their Innovation Performance
Sources: Innovation 2008 BusinessWeek/BCG survey; Innovation 2007 BusinessWeek/BCG survey; Innovation 2006 BusinessWeek/BCG survey.Note: “Not sure” was not offered as an option in 2006. Because of rounding, not all totals equal 100.
2008
43
31
26
2007
46
29
26
2006
52
48
Are you satisfied with the financial return on your investments in innovation?
Percentage of respondents
Yes Not sure No
0
25
50
75
100
Percentage of respondents
72
66
53
44
31
28
25
6
37
71
53
47
19
17
33
8
0 20 40 60 80
Increasing investmentin idea generation
Developing deepcustomer understanding
Increasing managementfocus
Establishing conducivecompany culture
Effectively using outsidesources of ideas
Partnering with suppliersfor new ideas
Dedicating additionalresources
Providing incentivesfor innovation
Small and midsize companies
Primary drivers of excellence in generating high-quality ideas
Large companies
Exhibit 4. Top Innovators Generate Ideas by Using a Wide Range of Tools
Sources: BCG, National Association of Manufacturers, and The Manufacturing Institute, innovation indexes, 2008.Note: Respondents were from companies deemed “excellent” at generating and developing ideas.

T B C G
executive told us about a supplier that had an idea for a new way to incorporate its component into the compa-ny’s product. By working closely together, the two came up with a new technology that the supplier allowed the company to patent in the United States as a sign of good-will. “By partnering with our supplier, we cut down our own R&D time and expenses,” noted the executive.
Structured Processes
The most innovative U.S. companies in our study are those that excel at generating and benefi ting from new ideas. In addition, they have a greater appreciation for the value of processes and execute at a higher level than unsuccessful companies. (See Exhibit 5.) They design structured, standardized processes for generating ideas, developing them, and bringing them to market, and they believe that process discipline is integral to their success. Respondents from top-performing companies consistent-ly made statements such as the following: “We have a very disciplined, deliberate, and consistent process-ori-ented approach to innovation” and “Our rigorous innova-tion approach is well known.”
But small and large companies can diff er in the rigor of their approach. The inherent complexity of large organi-
zations demands a stricter approach to innovation. Small companies o en manage innovation eff orts less formally because there are fewer projects to track and fewer re-sources to allocate, and leaders can have a bigger impact. Moreover, smaller companies tend to place less value on portfolio management and rapid idea development, per-haps because they tend to have fewer projects under way at any given time. Still, most successful companies—even small ones—have good processes and recognize the im-portance of discipline to those processes.
While structured processes have traditionally been con-sidered the enemy of creativity, the most innovative com-panies strike a balance between discipline and freewheel-ing creativity so that neither overwhelms the other. “We aren’t overly prescriptive,” said one executive. “We pro-vide project managers with the tools they need to meet objectives, then let them fi gure out how to do it.” Added another, “Structural buildup as companies age can slow things down, reduce spirit, and stifl e innovation. It’s im-portant not to let that happen.”
Leadership
Strong, focused leadership is a diff erentiating factor in U.S. companies that are top innovators, and the execu-
76
44
60
60
71
41
15
23
18
26
0 20 40 60 80
Innovative companies Less innovative companies
Developingquality ideas
Managinga portfolio of ideas
Ensuring rapiddevelopment of ideas
Communicating innovations to salespeople
Marketing innovationsto customers
Respondents who said the process was very important (%)
65
25
40
32
29
3
5
0 20 40 60 80
0
0
0
Respondents who said their executionof the process was excellent (%)
Importance of innovation processes Skill at executing innovation processes
Exhibit 5. Top Innovators Have a Greater Appreciation for Innovation Processes and Execute Them More Skillfully
Sources: BCG, National Association of Manufacturers, and The Manufacturing Institute, innovation indexes, 2008.

T I I M
tives we interviewed emphasized its importance. Leaders must develop disciplined, well-structured innovation processes, hold management accountable for outcomes, and create a company culture that embraces and encour-ages innovative thinking. Specifi c approaches to leader-ship include benchmarking, setting an example, and demonstrating real interest in innovation. As one execu-tive explained, “Most people don’t wake up thinking, ‘How am I going to innovate today?’ It’s a leader’s job to get them thinking that way.”
Vocal support of innovation by leadership helps build an innovative culture. Our respondents felt strongly about the importance of this factor. One of them observed, “You need to be serious about creating a good culture that en-courages excitement, success, problem solving, question-ing, and the celebration of success. You cannot just pay lip service to the idea.” Another executive promotes an in-novative culture by actively showing his interest in inno-vation: “I encourage innovation by walking around and talking to people who have been noted for good ideas—it demonstrates that you are interested in innovation and it motivates the employees.”
Sometimes small companies have an advantage. As one executive explained, “It’s easier to encourage a culture of
innovation in a small company like ours, since everyone interacts with leaders and engineers. We make a point of listening to everybody.” Executives also reported that es-tablishing an innovative culture was a challenge, given how hard it is to fi nd the right mix of creative, enthusias-tic, and achievement-oriented people.
Encouraging management to focus on innovation eff orts is crucial. Leaders do this in several ways. First, they make sure that innovation objectives are aligned with business objectives. Then they make tools available, build knowl-edge and expertise, and use performance metrics to track progress.
It is also the role of leadership to establish and maintain the discipline that leads to better innovation perfor-mance. To this end, the companies that excel use a num-ber of best practices, such as developing well-defi ned processes, setting clear fi nancial hurdles, and assigning unambiguous management responsibility for outcomes. (See Exhibit 6.) Regular meetings and updates ensure that innovation teams keep their eyes on the ball. Suc-cessful companies also use proven product-development approaches. As one respondent noted, “All incoming ideas are pushed through a portfolio management funnel to be evaluated strategically.”
95
68
53
42
11
72
39
67
50
11
0 20 40 60 80 100
Well-definedprocesses
Clear financialhurdles
Unambiguous management
responsibilities
Organizationaligned around
processes
Large companies Small and midsize companiesPercentage of respondents
Primary drivers of excellence in a disciplined approach to innovation
Incentives tiedto correct use
of processes
Exhibit 6. Establishing Processes, Financial Hurdles, and Responsibilities Leads to Discipline in Innovation
Sources: BCG, National Association of Manufacturers, and The Manufacturing Institute, innovation indexes, 2008.Note: Respondents were from companies deemed “excellent” at taking a disciplined approach.

T B C G
Skilled Workers
According to our 1,000-plus respondents, a skilled, edu-cated work force is the single most critical element of innovation success—and the hardest to acquire. The truth of this claim is supported by both of our innovation in-dexes, which indicate that a large number of researchers with advanced degrees, particularly in sci-ence or engineering, is the greatest predic-tor of success. Put simply, innovation re-quires capable and skilled people. (See the section “The Role of Government” for more on this topic.)
U.S. executives ranked the difficulty of fi nding high-quality talent among their top “pain points,” citing a lack of skilled workers at both the engineering and the basic-skills level. One problem is that U.S. students are not being encouraged to pursue science and technology-related fi elds. An executive described the challenge: “We off er scholarship programs to the children of our employees. At a dinner honoring this year’s recipi-ents, only one planned to go into engineering. The others said their parents—our employees and engineers—told them not to pursue the fi eld.”
Even attracting foreign talent, including people educated in the United States, is an issue. Said one executive, “The U.S. is the only country in the world where it is easier to get citizenship as a laborer than as a PhD.” Although the United States remains a center of higher education, many of its most talented graduates are forced to go elsewhere because they are not U.S. citizens. Janet Napolitano, the new secretary of homeland security and then governor of Arizona, summarized the situation in a February 2007 address to the National Press Club: “We need scientists and engineers.... A er a successful background check, I believe that every one of them should have a green card stapled to their diplomas.”
Adding to the problem is the negative perception of tech-nical training and education among U.S. students today. “We treat those pursuing technical careers as second-class citizens,” said one respondent. “We have a program
in my city called the Career Development Center, or CDC, for those pursuing technical careers. The kids call it ‘Come Dumb Children.’ If you don’t think technical education results in viable careers, take a look at your next plumb-ing bill.”
All of these problems weaken the work force—and the ability of the United States to innovate. The executives we spoke to believe that many of them stem from a decline in the country’s education system, and many had strong opinions in this area. One respon-dent observed, “We’ve been building workarounds because employees can’t do basic math. We’d rather have smart people thinking on their feet, but we’ve had to
automate.” Another said, “I even need fl oor employees. You would be shocked at how many I see who can’t read and write.” One executive summed up the problem: “The quality of our schools is slipping because they are not accountable to any real quality standards.”
This education defi cit creates a talent defi cit. The execu-tives we surveyed and interviewed reported having diffi -culties fi nding and keeping capable employees. The fol-lowing comments were typical: “The average engineer’s tenure is under one year.” “I’ve had an ad up for an entry-level engineering job for three to four months. Even in this economy, I’ve had no qualifi ed hits.” “As school bud-gets are cut, they o en eliminate classes like shop, so stu-dents don’t realize that this type of work is an option for them. They think that if they aren’t good at book-based academics, then they’ll just drop out. They don’t realize there is a need for those skills.” And fi nally, “Too many poets, not enough engineers.”
Manufacturing itself may have a tarnished reputation in the United States, making it hard to attract good talent. “Americans associate manufacturing with the auto in-dustry and its current strife,” explained one executive. Said another, “No one wants to work in a factory. People think it’s dirty and backbreaking manual labor. I own a factory; it’s sparkling clean and every employee has a computer.”
The education
deficit creates a
talent deficit in
the United States.

T I I M
The Role of Government
Our research suggests that governments—both national and local, in the United States and around the world—can sup-port companies in three major ways: by boosting their payback on innovation, by
supporting their innovation activities, and, most impor-tant, by improving the innovation environment. In addi-tion, governments can play a role by encouraging the development of industry clusters, which can improve the innovation environment.
Boosting Company Payback on Innovation
Innovation is necessary for long-term survival but can be unprofi table in the short term—a major challenge for companies and one that fi scal policies can address. Gov-ernments can help improve innovation profi tability by lowering companies’ costs or increasing their revenues.
R&D tax credits are among the most common ways to lower innovation costs. Our analysis showed a strong positive relationship between R&D tax programs, GDP, and performance on the International Innovation Index. Of the top 20 developed economies by GDP, 19 have R&D tax-relief programs. Interestingly, the size of the credit seems to have little impact—primarily because innova-tion is such a business necessity that companies rarely change their innovation activities on the basis of the availability of tax credits. (See Exhibit 7.) As one execu-tive explained, “While helpful, R&D tax credits are not a deciding factor in investment decisions. They are a ‘thank you’ instead of a motivator.”
Not that tax credits are unimportant. In fact, they are highly appreciated. In our survey, executives at both large
and small companies ranked R&D tax credits as their pre-ferred form of government support. More important than size is their dependability. According to our respondents, the inconsistency of tax credits in the United States di-minishes their value because they can’t be counted on and planned for. “It’s like a guillotine hanging over our neck every year,” remarked one executive. “Will they give them to us or won’t they?” Added another, “Technologies take time to develop, and it’s very diffi cult to plan when business policy is likely to change multiple times during the course of a [multiyear] project.” Given how long the innovation process can take, consistent and ongoing gov-ernment support and policies are important.
In addition to lowering costs through tax credits, govern-ments can help boost company profi tability by support-ing revenue streams. Most countries have policies to reg-ister and protect intellectual property. The risk of losing the rights to an invention or product because of a lack of policy or poor enforcement is a top issue for business executives and can lead to loss of revenues. As a result, companies operating in countries where intellectual property protection is limited are likely to conduct their innovation activities elsewhere.
Supporting Innovation Activities
Many countries, and many U.S. states as well, choose to engage directly in research activities, primarily through government grants or government-funded laboratories and research centers. These activities can lead to in-creased innovation performance. (See Exhibit 8.)
But the impact of direct funding on innovation is limited when the available funds are not substantial or when government support is dwarfed by other sources of fund-

T B C G
There is a positive relationship between R&D taxcredits and innovation performance...
...but the size of the tax credit hasminimal impact on performance
Innovation performance
R&D tax credit
Innovation performance
R&D tax credit
0
1
2
3
–1
0
1
2
3
1 2 3
–1
–2
1.0 1.5 2.0 2.50.5
–2 –1 0
0.0
Exhibit 7. Tax Credits Matter, but Their Size Has Little Impact on Innovation Performance
Sources: BCG, National Association of Manufacturers, and The Manufacturing Institute, innovation indexes, 2008.Note: Scale is a weighted cumulative distance from the mean.
4
3
2
1
0
–1
–2–1 0 1 2 3
Effect of government funding of R&D on innovation performance
Performance
Funding
Exhibit 8. Government Investments in R&D Help Drive Innovation Performance
Sources: BCG, National Association of Manufacturers, and The Manufacturing Institute, innovation indexes, 2008.Note: Scale is a weighted cumulative distance from the mean.

T I I M
ing. For example, small countries and individual U.S. states face a signifi cant challenge in achieving critical mass in R&D funding. In the United States, total state funding of R&D amounts to less than 0.3 percent of the total pool of funds earmarked for R&D, making state in-vestments of minimal importance.
Especially when funds are limited, governments at all levels may fi nd it advantageous to engage in partner-ships with businesses, nonprofi ts, or educational institu-tions to increase the scale of their support for innovation and achieve greater results. The challenge is to profi t from these partnerships by commercializing the results.
Many of the U.S. executives we surveyed reported some diffi culty capitalizing on these relationships. As one ex-ecutive put it, “The government needs to be much more thoughtful about how government, universities, and companies collaborate on joint research projects. It needs to get away from the schizophrenic mentality, be more effi cient, and improve project management to pro-duce better results.”
Improving the Environment for Innovation
Work force quality is the primary indicator of innovation success. (See Exhibit 9.) It is therefore not surprising that one of the top concerns of business executives is fi nding high-quality talent. Governments can take many actions to improve work force quality, including but not limited to investing in education and eff ectively addressing im-migration issues.
While education and work-force-development reforms can take many years to have an impact, some reforms yield results much more quickly. For example, better integration of academic and technical education in secondary schools can ensure that graduates are ready for work or college. When academic and technical programs are aligned with industry needs and standards, students gain recognized credentials and companies gain skilled workers.
Countries and states can also improve the business climate by lowering the structural costs related to fi scal
–2
–1
0
1
2
3
–2 –1 1 2 3
Performance
–2
–1
0
1
2
3
–2 –1 1 2 3
Performance
Effect of a high-quality work force oncountries’ innovation performance
Effect of a high-quality work force onstates’ innovation performance
Work forcequality
0 0
Work forcequality
Exhibit 9. Work Force Quality Is Highly Correlated with Innovation Performance
Sources: BCG, National Association of Manufacturers, and The Manufacturing Institute, innovation indexes, 2008.Note: Scale is a weighted cumulative distance from the mean.

T B C G
policy, regulation, and energy. Although our assessment did not directly address these factors, they have a major impact on the decisions that executives—particularly in manufacturing—make about production locations. And because so much innovation occurs on the shop fl oor rather than in the R&D lab, maintaining a manu-facturing presence is critical for countries and states alike.
Promoting Industry Clusters
Governments can also support innovation by encourag-ing the development of industry clusters. Clusters are groups of related, interdependent companies within the same industry that are concentrated in a geographic area. By attracting or establishing groups of manufacturers in specifi c industries, national governments can help drive innovation performance and sharply improve their coun-try’s economy.
This approach can be particularly eff ective for smaller countries—some of which rank high on the International Innovation Index because of the presence of industry clusters—and is likely to enhance innovation in individu-al states as well. But it is less useful in large countries, where any one cluster is too small on a relative basis—at least initially—to have a real impact. And since clusters account for only a small percentage of overall output, they’re o en overshadowed by other drivers, such as work force quality, education, and fi scal policy.
Although small countries can bet on specifi c industries to kick-start innovation (and growth in general), targeted cluster development is not without risk. Concentrated economies, no matter how successful they are for a time, ultimately rise and fall on the results of a limited number of industries. It is a high-risk, high-reward policy. (See the sidebar “A Tale of Two Countries: Lessons from Singa-pore and Iceland.”)
The contrasting experiences of Singapore and Iceland il-lustrate some of the risks and rewards of a policy-driven cluster strategy. Although strong industry clusters can cre-ate an excellent climate for innovation, they can also have a downside. Singapore’s story shows how industry diversi-fi cation can decrease vulnerability to widespread econom-ic failure; Iceland’s shows the risks of a cluster strategy that is very successful—but only for a time.
SingaporeA small island nation with virtually no natural resources, Singapore became a major trading port and industrial center under British rule. The country’s government is largely controlled by the People’s Action Party (PAP), which has won every election since independence in 1965, when Singapore offi cially became a parliamentary repub-lic. PAP leader Lee Yuan Kew, who was prime minister from 1959 to 1990, is largely credited with establishing Singapore’s economic infrastructure.
The government’s fi rst business mission was to transform Singapore into a manufacturing center. By creating a very attractive, low-risk innovation environment, it hoped to at-tract foreign manufacturers and their employees. Business-friendly policies have included freedom from licensing fees for multinational corporations with plants in Singapore; tax breaks for expansion projects; tax exemptions on inter-
est from loans; workers’ rights and benefi ts such as sick days, unemployment insurance, and technical training; and an end to discriminatory hiring and fi ring practices.
At the same time, Singapore has made investments in lo-cal infrastructure, cut transportation costs, and focused on developing the work force. To attract skilled workers, the government publicly adopted a pro-immigration stance, with expedited work-visa processes for foreign pro-fessionals, executives, shareholders, and potential entre-preneurs, and no visitor-visa requirements for citizens of many countries.
The government has taken other actions that make Singa-pore an attractive place for companies to innovate. For instance, it allows stem-cell research, spends lavishly to attract the best scientists to government labs (from both within the country and abroad), and encourages universi-ties to produce the science and engineering graduates that those companies require.
All these eff orts have created fertile conditions for innova-tion, which began to take off as clusters of manufacturing plants in diff erent industries generated new ideas. In the 1970s, electronics, automobiles, and petrochemicals were the targeted industries, followed by computers, computer chips, TVs, and VCRs in the 1980s, and semiconductors,
A Tale of Two Countries: Lessons from Singapore and Iceland

T I I M
telecommunications, and pharmaceuticals in the 1990s. Singapore’s current focus is on building up its technology and biotech sectors.
Today, Singapore’s GDP is the fi h largest in the world on a per capita basis. Singapore weathered the Asian fi nan-cial crisis of 1997 better than most Asian countries be-cause the government took quick action to retain invest-ment in the country. Similarly, a government diversifi cation program protected Singapore from the electronics slump of 2000 and 2001, which could have spelled disaster for such a major electronics exporter. Singapore continues to be a very attractive location for the innovation centers of global companies, ensuring that its economic success will persist.
IcelandA small island nation off the coast of northwestern Eu-rope, Iceland was a Danish dependency before becoming an independent republic in 1944. Until the 1990s, fi shing was the country’s largest industry. In 1994, Iceland joined the European Economic Area (EEA), and the government set up business-friendly policies such as allowing free trade with European neighbors, removing major barriers to foreign investment, opening the fi nancial markets, and sharply lowering the income tax, from 50 percent to 18 percent.
In 1991, a group of policies driven by then prime minister Davíð Oddsson set the stage for the development of a fi -nance cluster. These policies, which included market liber-alization, widespread deregulation, privatization of the banking sector, and lower corporate and personal tax rates, led to an infl ux of foreign capital. The high interest rates maintained by the central bank were particularly attrac-tive to the fi nancial sector. Adding to the country’s appeal were a sound environment for innovation, cheap energy, a well-educated work force, and a solid infrastructure.
A er deregulation and admittance to the EEA, Iceland’s banks moved beyond the home market into Europe. Ice-land became an attractive banking option for European consumers, mostly because of consistently high interest rates. Innovative fi nancial products, such as online-only banking outside Iceland, allowed Icelandic banks to keep interest rates high and overhead low while bringing in huge amounts of foreign capital. Another lucrative busi-ness innovation for Iceland’s banks was the off er of loans in foreign currencies, such as the yen or the Swiss franc, in order to leverage favorable foreign-exchange dynamics
and encourage domestic borrowers to take out high-inter-est loans.
In an attempt to better support innovation across other sectors, the government set up the Science and Technol-ogy Policy Council in 2003, reorganized and refocused the national network of research centers, and increased spending on research and training. By 2007, Iceland was among the top 15 countries in the world in patents. It made more R&D credits available to companies, granted R&D subsidies to the most attractive projects, and sup-ported joint medical research with the University of Iceland.
These eff orts undoubtedly encouraged innovation in oth-er industries besides fi nance, but they were not enough to stop the derailment of the economy in the wake of the 2008 credit crisis. From the early 1990s to mid-2008, with strong global fi nancial markets fueling Iceland’s dispro-portionately large fi nancial sector, the so-called Nordic Tiger enjoyed steady economic growth and increasing prosperity. But the crisis exposed the risks inherent in Ice-land’s lack of diversifi cation when the country’s GDP col-lapsed along with the banking industry. Iceland’s three largest banks failed, and most of the industry was nation-alized. Because bank holdings and foreign debt now far outstrip GDP, Iceland faces possible bankruptcy, and its woes are spilling over to other countries in Europe.
Given Iceland’s current problems, why is the country ranked so high on the International Innovation Index? The answer lies mainly in timing. Iceland bet on one sec-tor, and for a time that sector performed very well. Most of the data for the index are from year-end 2007, at the tail of the fi nancial sector’s very successful run. But innova-tion, growth, and profi tability have fallen off sharply since then, and we expect Iceland’s ranking to drop in the next edition of the index, when new data will be available.
Iceland’s experience demonstrates that although the de-velopment of clusters can be an eff ective way for a small country or state to kick-start its economy, a lack of diversi-fi cation leads to greater vulnerability and risk over time.
A Tale of Two Countries: Lessons from Singapore and Iceland (continued)

T B C G
An Agenda for Action
Given the tremendous importance of innova-tion to companies and countries alike, it is critical that they do all they can to encour-age, support, and advance it. And while companies are the main drivers of innova-
tion, national and local governments play a major role in enabling and supporting the innovation activities of the businesses within their borders. Although specifi c policy recommendations are beyond the scope of this report, countries and states can take concrete actions in six areas.
Strengthen the work force. A skilled, educated work force is the most critical element for innovation success, and countries and states with strong education systems do better in the global battle for innovation leadership. The United States has clear shortcomings in this area. In our survey, U.S. executives consistently highlighted a lack of high-quality talent as a major concern.
Lead by example. Vocal and visible support—in the form of R&D funding, tax credits, and policy changes—sends the message that innovation is important. Make innovation a common cause, for the greater good of all. Countries such as South Korea, China, and Singapore, whose governments publicly and actively support innova-tion, are attracting an increasing share of the world’s in-novators and innovation.
Make innovation easier. Governments can make the development and commercialization of ideas easier and more effi cient. Although U.S. universities and govern-ment agencies fund a great deal of innovative science, business executives tell us that gaining access to these resources is very diffi cult. Governments should ask what companies need and how they can help—and listen to the answers.
Maintain a strong manufacturing base. Process and product innovations happen in and around manufactur-ing plants. When factories disappear or move off shore, a major source of innovation goes with them. As one U.S. executive observed, “The media cheer when manufactur-ing leaves my state, but that is so shortsighted. What they don’t realize is that jobs and innovation leave with it.”
Improve the payback. A major frustration for executives is the failure of investments in new ideas to pay off . If com-panies can’t make a profi t, they will either stop investing in innovation or relocate to a state or country where they can make more money. One executive we interviewed stated that “governments need to realize that we have options” when it comes to locating innovation activities and people. Governments can help companies lower costs and boost profi ts by providing strong intellectual-property protection, tax breaks, and skills training, among other policies.
Be consistent. Innovation takes time and careful plan-ning. Companies will innovate more when they can count on government support in both the short and the long term. Because innovation investments can take up to a decade to bear fruit, tax policies and benefi ts must be consistent and reliable over the long haul. Similarly, gov-ernments must stay the course until education and work force policies deliver results.
Action in these areas is in the mutual interest of compa-nies and governments, helping them to serve their con-stituents more eff ectively. It is time for all levels of gov-ernment to make innovation a top priority and to prove their commitment with concrete action. The stakes couldn’t be higher—nothing less than the global com-petitiveness of countries and companies, secure jobs, and a higher quality of life.
T I I M
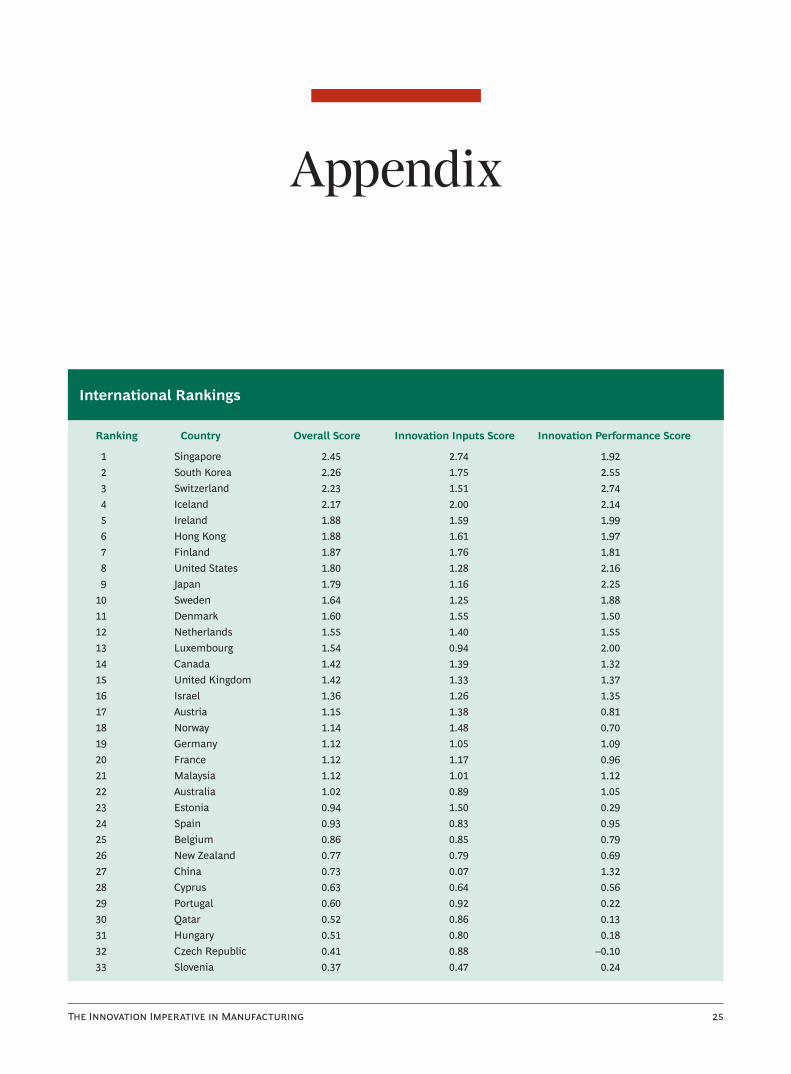
Appendix
International Rankings
Ranking Country Overall Score Innovation Inputs Score Innovation Performance Score
1 Singapore 2.45 2.74 1.92 2 South Korea 2.26 1.75 2.55 3 Switzerland 2.23 1.51 2.74 4 Iceland 2.17 2.00 2.14 5 Ireland 1.88 1.59 1.99 6 Hong Kong 1.88 1.61 1.97 7 Finland 1.87 1.76 1.81 8 United States 1.80 1.28 2.16 9 Japan 1.79 1.16 2.25 10 Sweden 1.64 1.25 1.88 11 Denmark 1.60 1.55 1.50 12 Netherlands 1.55 1.40 1.55 13 Luxembourg 1.54 0.94 2.00 14 Canada 1.42 1.39 1.32 15 United Kingdom 1.42 1.33 1.37 16 Israel 1.36 1.26 1.35 17 Austria 1.15 1.38 0.81 18 Norway 1.14 1.48 0.70 19 Germany 1.12 1.05 1.09 20 France 1.12 1.17 0.96 21 Malaysia 1.12 1.01 1.12 22 Australia 1.02 0.89 1.05 23 Estonia 0.94 1.50 0.29 24 Spain 0.93 0.83 0.95 25 Belgium 0.86 0.85 0.79 26 New Zealand 0.77 0.79 0.69 27 China 0.73 0.07 1.32 28 Cyprus 0.63 0.64 0.56 29 Portugal 0.60 0.92 0.22 30 Qatar 0.52 0.86 0.1331 Hungary 0.51 0.80 0.18 32 Czech Republic 0.41 0.88 –0.1033 Slovenia 0.37 0.47 0.24

T B C G
International Rankings (continued)
Ranking Country Overall Score Innovation Inputs Score Innovation Performance Score
34 South Africa 0.33 0.15 0.47 35 Bahrain 0.27 0.78 –0.2636 Slovak Republic 0.21 0.72 –0.3137 Chile 0.21 0.36 0.04 38 Italy 0.21 0.16 0.24 39 Malta 0.20 –0.21 0.59 40 Lithuania 0.16 0.71 –0.4041 Tunisia 0.14 0.57 –0.3042 Greece 0.12 0.01 0.23 43 Latvia 0.12 0.38 –0.1444 Thailand 0.12 –0.12 0.35 45 Mauritius 0.06 0.48 –0.3646 India 0.06 0.14 –0.0247 Kuwait 0.06 0.46 –0.3548 Croatia –0.03 0.21 –0.2649 Russia –0.09 –0.02 –0.1650 Saudi Arabia –0.12 0.57 –0.7951 Trinidad and Tobago –0.12 –0.42 0.20 52 Poland –0.12 0.22 –0.4453 Bulgaria –0.13 0.23 –0.4854 Philippines –0.15 –0.76 0.48 55 Oman –0.15 0.27 –0.5656 Jordan –0.15 –0.04 –0.2657 Mexico –0.16 0.11 –0.4258 Turkey –0.21 0.15 –0.5559 Lesotho –0.22 –1.01 0.59 60 Kazakhstan –0.23 –0.51 0.0761 Romania –0.29 0.22 –0.7762 Costa Rica –0.39 –0.57 –0.1863 Panama –0.43 –0.48 –0.3464 Ukraine –0.45 –0.13 –0.7365 Egypt –0.47 –0.46 –0.4366 Botswana –0.47 –0.50 –0.4067 Albania –0.49 –0.58 –0.3468 Azerbaijan –0.54 –0.48 –0.5469 Sri Lanka –0.56 –0.61 –0.4670 Morocco –0.57 –0.55 –0.5471 Indonesia –0.57 –0.63 –0.4672 Brazil –0.59 –0.62 –0.5173 Vietnam –0.65 –1.09 –0.1674 Colombia –0.66 –0.95 –0.3075 Armenia –0.66 –0.75 –0.5276 Macedonia –0.68 –0.13 –1.1777 Georgia –0.72 –0.48 –0.8878 Ethiopia –0.75 –1.16 –0.2779 Jamaica –0.75 –0.72 –0.72

T I I M
Ranking Country Overall Score Innovation Inputs Score Innovation Performance Score
80 El Salvador –0.77 –0.59 –0.88 81 Kyrgyz Republic –0.78 –0.54 –0.95 82 Honduras –0.79 –0.64 –0.85 83 Moldova –0.80 –0.24 –1.28 84 Pakistan –0.82 –1.04 –0.51 85 Algeria –0.83 –0.87 –0.70 86 Paraguay –0.89 –0.63 –1.07 87 Mongolia –0.90 –0.71 –1.01 88 Nigeria –0.95 –0.91 –0.90 89 Uruguay –0.95 –0.76 –1.06 90 Uganda –0.96 –1.05 –0.78 91 Burkina Faso –0.97 –1.25 –0.59 92 Argentina –0.97 –0.96 –0.90 93 Tajikistan –0.99 –1.04 –0.86 94 Guatemala –0.99 –0.94 –0.96 95 Kenya –1.01 –0.91 –1.02 96 Bolivia –1.02 –1.08 –0.87 97 Syria –1.03 –0.99 –0.98 98 Nepal –1.05 –1.23 –0.77 99 Senegal –1.06 –1.11 –0.91100 Peru –1.06 –1.18 –0.85101 Namibia –1.07 –1.12 –0.92102 Ecuador –1.11 –1.21 –0.91103 Madagascar –1.16 –1.15 –1.06104 Nicaragua –1.18 –1.22 –1.02105 Zambia –1.28 –1.40 –1.03106 Benin –1.28 –1.55 –0.89107 Cameroon –1.32 –1.77 –0.74108 Venezuela –1.37 –1.50 –1.10109 Burundi –1.54 –1.82 –1.12110 Zimbabwe –1.63 –1.63 –1.48
Note: Because of rounding, two or more countries may appear to have the same overall score. For the purposes of these rankings, Hong Kong is considered a national entity.

T B C G
For Further Reading
The Boston Consulting Group publishes other reports and articles on innovation that may be of interest to senior executives. Recent exam-ples include:
Innovation 2008: Is the Tide Turning?A BCG Senior Management Survey, August 2008
Measuring Innovation 2008: Squandered OpportunitiesA BCG Senior Management Survey, August 2008
Payback: Reaping the Rewards of InnovationJames P. Andrew and Harold L. Sirkin(Boston: Harvard Business School Press, 2006)
The Secret of InnovationBCG Perspectives, December 2006
Spurring Innovation ProductivityOpportunities for Action in Industrial Goods, November 2005

For a complete list of BCG publications and information about how to obtain copies, please visit our Web site at www.bcg.com/publications.
To receive future publications in electronic form about this topic or others, please visit our subscription Web site at www.bcg.com/subscribe.
3/09