Embed Size (px)
Citation preview

THE INQUIRY LEARNING MODEL
AS AN APPROACH TO MATHEMATICS INSTRUCTION
by
Michael C. Brune
A thesis
submitted in partial fulfillment
of the requirements for the degree of
Masters of Science in Mathematics Education
Boise State University
December 2010

©2010
Michael C. Brune
All Rights Reserved

BOISE STATE UNIVERSITY GRADUATE COLLEGE
DEFENSE COMMITTEE AND FINAL READING APPROVALS
of the thesis submitted by
Michael Christopher Brune
Thesis Title: The Inquiry Learning Model as an Approach to Mathematics Instruction
Date of Final Oral Examination: 01 October 2010
The following individuals read and discussed the thesis submitted by student Michael
Christopher Brune, and they also evaluated his presentation and response to questions
during the final oral examination. They found that the student passed the final oral
examination, and that the thesis was satisfactory for a master’s degree and ready for any
final modifications that they explicitly required.
Margaret T. Kinzel, Ph.D. Chair, Supervisory Committee
Mary J. Smith, Ph.D. Member, Supervisory Committee
Laurie O. Cavey, Ph.D. Member, Supervisory Committee
The final reading approval of the thesis was granted by Margaret T. Kinzel, Ph.D., Chair
of the Supervisory Committee. The thesis was approved for the Graduate College by
John R. Pelton, Ph.D., Dean of the Graduate College.

iv
ACKNOWLEDGEMENTS
I would like to thank Dr. Margaret Kinzel for the endless amount of time that she
spent reading and re-reading. I would also like to thank all of my committee members,
Dr. Mary Smith, and Dr. Laurie Cavey, for all of their advice in terms of the written
document, my lesson designs, and throughout my investigation. The inquiry lessons
would not have gone nearly as well without their input and advice. I also must thank my
wife for having the patience to read through the entire document and give me feedback.
Her willingness to put up with me throughout this process was also greatly appreciated. I
owe them all a great deal of gratitude; I would not have been successful without their
guidance and support

v
ABSTRACT
Since current approaches to mathematical instruction fall short of the goals of
NCTM (National Council of Teachers of Mathematics) research was conducted in a small
rural school district in the northwest United States evaluating inquiry based
instruction. To complete the study two high school geometry classes were taught area
formulation using a traditional lecture based approach to instruction. A third geometry
class was taught area formulation utilizing inquiry-based instructional methods. Students
in both groups took both a pre-test and post-test, filled out a questionnaire, and
participated in a project designed to test their applications of mathematical
understanding. Results indicated that inquiry-based instructional methods had a
significant effect on students’ ability to solve decontextualized mathematical problems,
students’ retention of the mathematics, and improved students’ attitudes about the
mathematics in which they were engaged.

vi
TABLE OF CONTENTS
ACKNOWLEDGEMENTS................................................................................................iv
ABSTRACT.........................................................................................................................v
LIST OF TABLES ..........................................................................................................viii
LIST OF FIGURES ...........................................................................................................ix
CHAPTER 1: INTRODUCTION .......................................................................................1
CHAPTER 2: LITERATURE REVIEW ............................................................................5
Current Educational Practice ..................................................................................5
Constructivist Learning Approaches .......................................................................8
Inquiry Learning .........................................................................................9
Implementing Inquiry ...........................................................................................11
Inquiry Lessons and Instruction ................................................................11
The Importance of Community ................................................................13
The Role of Challenge and Proof .............................................................14
Conclusion ............................................................................................................15
CHAPTER 3: METHODOLOGY ...................................................................................16
Participants ...........................................................................................................16
Lesson Design ......................................................................................................17
Lesson Progression ...............................................................................................19
Procedure ..............................................................................................................19

vii
CHAPTER 4: RESULTS .................................................................................................25
Pre-Test ................................................................................................................25
Post-Test ...............................................................................................................26
Questionnaire .......................................................................................................32
Project ...................................................................................................................37
Retention Quiz ......................................................................................................38
CHAPTER 5: DISCUSSION ...........................................................................................40
Observations .........................................................................................................40
Conclusion ............................................................................................................44
Limitations ............................................................................................................45
WORKS CITED ...............................................................................................................47
APPENDIX A ..................................................................................................................49
Inquiry-Based Lessons
APPENDIX B ...................................................................................................................84
Tests and Quizzes
APPENDIX C ...................................................................................................................91
Questionnaire
APPENDIX D ...................................................................................................................94
Project Schematics
APPENDIX E ...................................................................................................................98
Item Analyses

viii
LIST OF TABLES
Table 1: Lesson Progression .............................................................................................19
Table 2: Pre-Test Results ..................................................................................................25
Table 3: Post-Test Results ................................................................................................27
Table 4: Questionnaire Results .........................................................................................33
Table 5: Retention Quiz Results .......................................................................................38
Table E1: Pre-Test Item Analysis .....................................................................................99
Table E2: Post-Test Item Analysis .................................................................................100
Table E3: Retention Quiz Item Analysis ........................................................................101

ix
LIST OF FIGURES
Figure 1: Distribution of Scores for Post-Test...................................................................28
Figure 2: Post-Test Items p=0.01 ......................................................................................28
Figure 3: Post-Test Items p=0.05 ......................................................................................29
Figure 4: Post-Test Items p=0.01.......................................................................................31
Figure 5: Items on which Control Group Outperformed Experimental Group ................32

1
CHAPTER 1: INTRODUCTION
Students often question the validity of the mathematics that they are exposed to in
the classroom and its relationship to their everyday life. Doubt that the mathematics
learned in school is applicable outside of school leads to a logical disconnect between
what is learned in school and what may be needed for a real-life problem. Research into
approaches used by students when confronted with mathematical situations outside of the
classroom indicates that students do not transfer the mathematics used to complete
classroom tasks into applicable knowledge. Instead students frame their attempts to solve
a problem around either the environment or the context of the problem. Since classroom
problems are often decontextualized, giving no real-world context for the students to
consider, and the classroom environment is not replicated by students’ real-world
experiences, students fail to see the relationship between their educational experiences
and real-world mathematical applications. As a result students do not transfer
mathematical knowledge learned in school (Boaler, 1998).
The inability to transfer mathematical learning into situations outside of the
classroom seriously calls into question the goals of our educational practice. If educators
want their students to be mathematically literate and able to use classroom skills in the
world around them, then students must learn how to apply the mathematical skills learned
in the classroom. Current instructional practice, however, is focused on students’ ability
to complete classroom assignments and thereby progress to the next level of mathematics
instruction. Such an approach would be acceptable if students planned to continue

2
learning in classrooms throughout their lives. However, since students will be
progressing into the real-world they will need to develop mathematical skills that they
can utilize throughout their lives.
Investigations into students’ inability to transfer mathematical knowledge reveal
underlying instructional issues. Boaler (1998) has suggested that students in traditional
mathematics classrooms are unable to use the mathematics learned because they don’t
fully understand the mathematics, but simply have learned to repeat specific processes
that underlie certain mathematical actions. Skemp (1976) seems to support this with his
research into the role of instrumental (procedural) understanding in the classroom and
strongly advocates relational approaches. These relational approaches focus on building
conceptual understanding that can be applied in many different environments. Skemp
credits the ability to apply learned mathematics to a more dynamic understanding of
mathematical relationships.
Boaler (2000) also suggests that the context of the classroom environment bears
some of the blame with regard to students’ lack of ability to solve problems framed in a
real-world environment. Her research states that students learn classroom cues and then
base their mathematical actions on how they interpret these cues. Classrooms in this
respect serve as a very specific social environment in which certain behaviors and
practices have been learned and are strictly followed. Along with the cue-based
behavior, students’ exposure to lecture and drill-oriented instruction has developed their
perspective of how mathematics is supposed to be understood and used. Since the same
cues present in a lecture-based classroom are not present in real-life mathematical

3
situations, students fail to perceive the relationship between school-learned mathematics
and areas where mathematics is useful in their real-life experiences (Boaler, 1998, 2000).
Skemp (1976) goes as far as to suggest that two completely different forms of
mathematics are being taught, leading to different types of understanding among
students: instrumental and relational. Skemp emphasizes that the type of understanding a
student achieves affects that student’s ability to use their mathematical knowledge in
different contexts. Obviously, it is desirable that mathematics instruction promote
students’ ability to apply mathematics in a variety of ways and in different contexts.
Educators in the United States are currently falling short of that goal and, for the most
part, continue to teach for instrumental understanding. This problem must be addressed
and non-traditional approaches need to be considered as possible catalysts to relational
understanding.
Open-ended, process-based, mathematical tasks have been shown to promote
more student enjoyment, retention, understanding, and transferability of mathematics
knowledge (Boaler, 1998). Such approaches, however, have not been applied on a large
scale. Current textbook selection seems to reflect a more traditional approach to
mathematics instruction. Although reformed curriculums have been shown to increase
problem-solving ability and conceptual understanding, only about 15% of the current
textbook market is made up of such texts, indicating that they are not widely used
(Schoenfeld, 2007). When problem-solving ability and mathematical aptitude are critical
for student success in the 21st century environment, it is indefensible for educators to
continue promoting practice that does not attend to these abilities.

4
There is unease from teachers when implementing a new methodology into a
classroom that the students will not adequately adapt to their new role. Throughout their
classroom experiences, students develop a sense of acceptable and expected behaviors.
Changing the instructional style will require a shift in their role as a student. This raises
concern as to whether students are equipped to adapt to a new classroom climate and
become the successful problem solvers that society wishes them to be. If they do adapt,
one wonders how long it will take students to properly assume their new role.
Students will also be expected to continue to perform on standardized tests even
though less traditional approaches are being used. Educators fear that less procedural
approaches will inhibit students’ ability to solve decontextualized problems, thereby
handicapping them when they take standardized tests. In an era where high-stakes testing
can mean receiving a diploma as a student, and receiving funding as an institution, these
concerns are worth consideration.
I conducted an investigation of the inquiry-learning model to address some of the
concerns raised when new instructional approaches are taken. It is important to
understand which educational methods are most effective in light of what we expect
students to know, and be able to accomplish in and out of the classroom. In light of these
educational priorities, my research goal was to determine what affects an inquiry-based
instructional approach would have on:
Students’ problem-solving abilities.
Students’ ability to solve traditional decontextualized classroom problems.
Students’ retention of mathematical knowledge.
Students’ attitude towards the mathematics in which they are engaged.

5
CHAPTER 2: LITERATURE REVIEW
Current Educational Practice
In a recent study, Jerry Stonewater (2005) examined 29 teachers’ perceptions of
best educational practices in middle-school mathematics before and after they were
taught using inquiry-based methods throughout a mathematics course designed for
middle-school mathematics teachers. Data were collected using an open-ended essay in
which teachers were asked to address specific elements of what they viewed as the best
practices for teaching mathematics. This essay was administered before and after the
instructional period. The initial responses revealed that 20 of the 29 teachers involved
viewed mathematics education as a process of imparting knowledge to students. What
these teachers perceived as good educational practice consisted mostly of teachers
modeling a specific way to solve a problem, followed by students solving similar
problems using the method presented by the teacher. Best teaching practice was then
defined as reducing problems to a set of steps that the students could follow.
The most common approach to teaching mathematics fits this perception and
involves a review of previously completed homework, followed by a teacher-directed
demonstration the students watch carefully, and concluding with a homework assignment
from the textbook. This model emphasizes mathematics through reproduction of
procedure and memorization (Stonewater, 2005; Goos, 2004) and promotes the view that
knowing mathematics means being able to reproduce the correct answer as judged by the
instructor (Lampert, 1990).

6
The National Council of Teachers of Mathematics (NCTM) does not support such
an approach to mathematics education. In their recent online publication (NCTM, 2009)
of guiding principles in mathematics instruction, the NCTM asserts that students need to
learn mathematics by solving problems that support conceptual understanding. Ideally a
marriage between knowledge, procedure, and conceptual understanding would be the
result of mathematics lessons. In fact, they go as far as to say that reasoning,
communication, problem solving, conceptual understanding, and procedural ability must
be developed simultaneously for a student to be successful at mathematics (NCTM,
2009).
Skemp (1976) bolsters this argument with his discussion of relational versus
instrumental understanding. Instrumental understanding can be considered strictly
procedural understanding, rules without reason. Relational understanding, on the other
hand, is an interrelated conceptual understanding of the mathematics that students learn,
both the how (procedure) and the why for a specific mathematical exercise. It is
reasonable to believe that relational understanding is much more applicable and
transferable for students. Traditional educational practices, however, more closely
resemble practices meant to encourage only instrumental understanding.
McKinney and Frazier (2008) verified this with their survey of high poverty
middle schools designed to gain insight into common educational practices. The study
highlighted that a high percentage of teachers primarily rely on direct instruction even
though their research suggested that such skill and drill approaches don’t adequately
prepare students to use mathematics. They also noted that although hands on tasks are

7
beneficial in building conceptual understanding, only 25% of the classrooms surveyed
used such tasks frequently.
Further evidence that current practice does not meet the ideal goals presented by
the NCTM and Skemp can be found in evaluations of the texts used to teach
mathematics. A recent study of textbooks used in Australia revealed that most texts
presented problems of a low overall procedural complexity. These texts also contained a
low overall number of concept connecting questions, completely overlooking the need for
relational understanding. This lack of challenge, and also the high percentage (25%-
71%) of repetitive questions coincide with teachers’ push for a back-to-basics approach
(Vincent & Stacey, 2008). The same push for a back-to-basics approach was present in
the United States throughout the relatively recent “math wars” and resulted in students
who lack fundamental mathematical skills, limiting their ability to compete
internationally (Cavanagh, 2006).
NCTM pushes for conceptual approaches to instruction to support these
fundamental mathematical skills. The NCTM standards for mathematics have become
widely used as a basis for many state curriculums. However, curriculums designed to
meet these standards take on many different forms. Schoenfeld (2007) comments that
due to the nature of the standards, textbooks can simply contain strict procedure followed
by repetitive practice and still meet individual strands of the standards. Such texts cover
the listed standards, but fail to emphasize problem-solving ability and relational
understanding. Sadly these texts are widely used in states such as California, which
represent large student populations, because they meet state textbook adoption guidelines
(Schoenfeld, 2007).

8
The lack of focus on relational understanding evident in current educational
approaches and textbook selection in the United States is not ideal if the goal is to prepare
students to use the mathematics that they learn in school throughout their lives. New
approaches to instruction must be considered to support students in developing a
relational understanding of mathematics.
Constructivist Learning Approaches
The constructivist approach to learning takes the position that learners build a
construct within their mind to understand their sensory experiences. This construct
serves as a catalyst for students to internalize the relationships that exist in the world
around them. Constructivist learning theories suggest that students develop their own
knowledge through experience and interaction. In a lecture-oriented learning
environment, students will build their own understanding of the material presented during
the instruction based on their experiences. This can create disparity between what the
educator is attempting to teach and what the student actually learns. Simply stated,
constructivist learning theory suggests that knowledge must be developed; it cannot
simply be passed on by the instructor (Saunders, 1992). Constructivist approaches to
learning are more in line with the goals of the NCTM in the sense that they focus on
building students’ conceptual understanding, linking new knowledge to previous
experience.
Constructivist approaches have come under fire from some researchers.
Kirschner, Sweller, and Clark (2006) concluded that constructivist guided approaches
lack proper guidance and as a result overuse students’ working memory while ignoring

9
their long-term memory. They argue that skills and knowledge necessary for future
application cannot be learned without first being added to students’ long-term memories.
Hmelo-Silver, Duncan, and Chinn (2007) argue that Kirschner, Sweller, and Clark
are incorrect in their evaluation of some of these constructivist techniques. They
concluded that inquiry-based instruction and problem-based learning, both considered
constructivist guided approaches, can arguably be considered to be guided forms of
instruction. They also note that between these two methods there is enough similarity that
they are often considered the same approach but were developed through different
educational avenues.
Inquiry Learning
The inquiry learning style establishes itself as different from other constructivist
guided approaches in the sense that it is not a minimally guided learning environment and
that direct instruction can be used in the context of inquiry learning. Proper inquiry
learning requires that teachers carefully scaffold their students as they challenge them
with new mathematical material (Hmelo-Silver et al., 2007). Once students are
challenged, they are expected to engage in creating conjectures, analyzing conjectures,
communicating, working collaboratively, and engaging in mathematical argument
(Stonewater, 2005). This sets inquiry learning squarely within the context supported by
the NCTM and other reform documents (Lampert, 1990).
Research regarding inquiry-learning programs suggests that students can achieve
relational understanding through this approach. Through the use of inquiry-based
instructional methods, students have shown improvements in their ability to apply

10
mathematical knowledge to multiple environments and to solve complex problems.
Students taught using inquiry-based methods have also been shown to transfer their
knowledge better to new tasks, and still maintain the ability to perform well on
standardized tests. In fact, students in a middle school that adopted an inquiry-based
learning model performed better on their standardized tests when compared with those in
the traditional curriculum (Hmelo-Silver et al., 2007). Ismail (2008) noted that when
using the Connected Mathematics Program, which is arguably an inquiry directed text,
her students showed great gains in their problem-solving abilities with no loss in their
procedural abilities. These examples show that inquiry methods offer great opportunities
for enhancing students’ problem-solving and mathematical-reasoning abilities without
sacrificing their procedural knowledge.
Longitudinal studies have also shown that gains made in inquiry-based
classrooms are more likely to last long periods of time, reduce achievement gaps, and
help disadvantaged students find success (Hmelo-Silver et al., 2007). Long term gains
may be related to the fact that students involved in inquiry classrooms report that they
find these classes more enjoyable than other studies in school because of the discussion
and reasoning involved in place of memorization (Goos, 2004). This ability to find
solutions to problems rather than memorize them is often cited as a better way to
understand mathematics and is linked to better retention, because if your memory fails
you, your logic will not. Students with self-reported bad memorization skills tend to
enjoy inquiry instruction over traditional methods (Stonewater, 2005).
Though apprehension exists among educators when considering adoption of a
new approach to instruction, the results of Stonewater’s 2005 study involving 29 middle

11
school mathematics educators needs to be considered. Concluding essays written by the
participants revealed that the teachers’ beliefs about educational practice were shifting.
Of the 20 instructors who initially favored direct instruction, 14 began to show signs that
their perception was changing. After becoming involved in lessons that were taught
using the inquiry approach, teachers began to see that different levels of understanding
could be attained through inquiry-based instruction (Stonewater, 2005). Such research
suggests that though educators lack exposure to the inquiry-learning method, they may
see the value in such methods if they could see them implemented.
Implementing Inquiry
Inquiry Lessons and Instruction
Proper inquiry instruction requires facilitation by the instructor and well-designed
inquiry tasks. Such tasks can be identified as problematic situations that engage the
students in mathematical problems in context (Hodge, 2008). Before tasks are put into
action, they should be evaluated to ensure that they meet a standard of objective-oriented
instruction. Tasks should promote understanding of important mathematical ideas or
ways to solve problems. Tasks should be accessible to all students and support
mathematical thinking. Finally, tasks should relate to other mathematical topics being
learned so that mathematics is not separated into strands, but understood as a web of
connected knowledge that can be applied (Marcus & Fey, 2003).
As inquiry lessons are designed, teachers should consider what students already
know about a topic, what knowledge they want students to gain, a process for getting
there, and an understanding of where this knowledge can be applied (Barell, 2007).
12
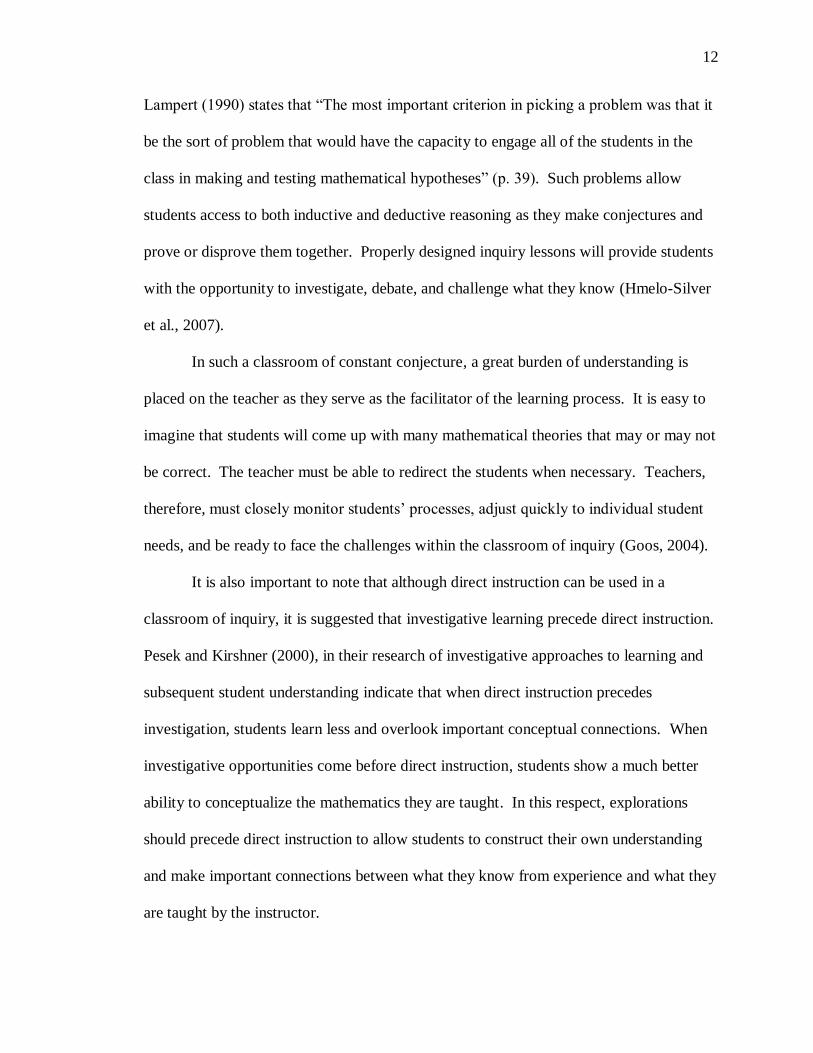
Lampert (1990) states that “The most important criterion in picking a problem was that it
be the sort of problem that would have the capacity to engage all of the students in the
class in making and testing mathematical hypotheses” (p. 39). Such problems allow
students access to both inductive and deductive reasoning as they make conjectures and
prove or disprove them together. Properly designed inquiry lessons will provide students
with the opportunity to investigate, debate, and challenge what they know (Hmelo-Silver
et al., 2007).
In such a classroom of constant conjecture, a great burden of understanding is
placed on the teacher as they serve as the facilitator of the learning process. It is easy to
imagine that students will come up with many mathematical theories that may or may not
be correct. The teacher must be able to redirect the students when necessary. Teachers,
therefore, must closely monitor students’ processes, adjust quickly to individual student
needs, and be ready to face the challenges within the classroom of inquiry (Goos, 2004).
It is also important to note that although direct instruction can be used in a
classroom of inquiry, it is suggested that investigative learning precede direct instruction.
Pesek and Kirshner (2000), in their research of investigative approaches to learning and
subsequent student understanding indicate that when direct instruction precedes
investigation, students learn less and overlook important conceptual connections. When
investigative opportunities come before direct instruction, students show a much better
ability to conceptualize the mathematics they are taught. In this respect, explorations
should precede direct instruction to allow students to construct their own understanding
and make important connections between what they know from experience and what they
are taught by the instructor.

13
The Importance of Community
Central to the concept of inquiry learning is the notion of a mathematical
community. Students are expected to participate in discussion, promote and defend
mathematical ideas, solve unfamiliar problems, and challenge the ideas of their peers
(Goos, 2004; Hodge, 2008). Often students are asked to share their way of doing a
particular task or their reasoning throughout the process. As a result, students begin to
feel as though their processes are as important, if not more so, than the teacher’s thinking
about a problem. Student sharing is directed not only at the teacher, but also at fellow
students, and fellow students have the right to challenge the reasoning of their peers
(Hodge, 2008). Such interaction between peers acts as a scaffold to bring students to
higher levels of understanding. Students who may not have been able to reach a new
plane of understanding on their own do succeed at gaining new and complex
mathematical understanding when working with others (Goos, 2004). When students do
find success in such group-work sessions, they feel a strong sense of accomplishment,
which may motivate them to continue future investigations (Stonewater, 2005). It is
reasonable to assume that the same feeling of accomplishment would not be present if the
teacher had provided the answer or if the solution had been arrived at through strict
procedure.
The role of the teacher as facilitator and guide of the mathematical classroom
community is crucial to the successful implementation of an inquiry approach. The
teacher, as the master of the material, must make the mathematics accessible to the
groups of students who are working through the problems by providing proper guidance
without giving away the solution to the problem at hand (Stonewater, 2005; Goos, 2004).

14
Depending on students’ understanding, the amount of guidance provided by the teacher
fluctuates to meet the needs of the student groups. When groups make mistakes in their
reasoning, these mistakes can be brought before the entire class and can lead to a
discussion facilitated by the instructor to bring to light any misconceptions that may have
been presented. By structuring investigations in such a manner, students will feel
ownership of the mathematics that they are learning (Goos, 2004). By allowing students
to interact with one another, they learn more than they could have if the answer or
process had simply been given to them (Stonewater, 2005).
The Role of Challenge and Proof
To fully realize the benefits of inquiry learning, students must be encouraged to
continually challenge solutions, even those that they find themselves. Questions must be
weighed against logic and reason. No student should be satisfied without being able to
prove that his or her solution is the correct one (Levasseur & Cuoco, 2003). Initially,
these challenges to the information being presented will likely come from the instructor,
but through instructor modeling of proper inquiry behavior students will take on the roles
necessary to be active learners in their environment. Case studies show that students who
have participated in an inquiry environment for some time begin to desire the complete
assurance that comes through proof, even if earlier in their studies they were more
interested in simply completing a task (Goos, 2004). Such benefits of inquiry learning
are encouraging in the face of NCTM guidelines that push for instruction involving
reasoning and proof (NCTM, 2009).

15
Conclusion
Since new direction is needed in mathematics curriculum and instruction,
investigations into the inquiry method seem natural. Data suggest that most students
learn best when given problems to solve and that such problem-based learning improves
retention and ownership of the mathematics (Goos, 2004; Stonewater, 2005; Hmelo-
Silver et al., 2007). Through investigations into this approach of teaching it seems
feasible that one could create a more optimal learning environment for most students.
Few articles are dedicated to the detriments of inquiry instruction; however,
Lampert did indicate that not all students participate in inquiry environments. In
particular, some students may not wish to participate in classroom discussions (1990).
Though there are concerns regarding inquiry-based instructional methods they are not
severe enough that we should ignore the possible benefits of such an approach. In light
of the current state of mathematics education, and the consideration that in current
practice not all students are engaged learners, the inquiry-learning approach should be
investigated. The possible benefits to students and mathematics education in the United
States warrant a movement towards constructivist-based instruction and inquiry-based
learning opportunities.

16
CHAPTER 3: METHODOLOGY
To complete this quasi-experimental study of the effects of inquiry-based learning
on problem-solving ability, I conducted research at a high school serving grades 10-12 in
a low-income rural school district. The high school had an enrollment of 628 students.
Participants
Experimental and control groups were chosen based on pre-established classes.
These classes were determined by student enrollment and administrator and teacher
placement. The experimental group consisted of 27 students, of which 14 were female
and 13 were male. I instructed this class during fifth period, which fell directly before
lunch. Two classes represented the control group; I instructed the control group during
sixth and seventh periods. The control group consisted of 37 students, of which 20 were
female and 17 were male. Student ages ranged from 15-18 years in all three class
periods. The experimental group was made up of 2 seniors, 15 juniors, and 10
sophomores. The control group on the other hand was made up of 3 seniors, 20 juniors,
and 14 sophomores. The overwhelming majority of students were white, with only two
Hispanic students and one African American student involved in the study.
Each class was a regular session geometry class that met for 49 minutes daily and
was made up of students from a variety of educational experiences. Every student must
have completed some form of Algebra 1. Some completed this through a two-year
course, while others completed the more conventional one-year course. Students' prior

17
mathematical path had no bearing on where they were placed, so each class was a mixed-
ability group.
Lesson Design
One of the goals of this study was to teach the same material two different ways:
using traditional, lecture-based instruction with the control group, and inquiry-based
instructional methods with the experimental group. These lessons were to be taught over
the same timeframe. For this reason, I followed the progression through area formulation
dictated by the McDougal Littell Geometry 2007 textbook adopted by the district.
The control group lessons were taught using the traditional approach described by
Stonewater (2005) and Goos (2004). This involved reviewing the homework assignment
from the previous day, followed by a presentation of new material, and concluded with a
homework assignment of 20-30 problems. New material was presented using lecture-
based instruction that included examples of problems that they would see in their
homework, and the formulas required to solve these problems. Parts necessary for
substitution into area formulas were highlighted, and examples included shapes that were
orientated in different ways. These lessons also included dissections of specific area
formulations to inform students of the origins of the formulas taught during the lesson.
Experimental group lessons were inquiry-based and had specific objectives for
each day to keep the experimental group on pace with the control group. Students in the
experimental group solved the same type of area problems but were taught in a very
different manner than the control group. Lessons were specifically designed to meet the
criteria of inquiry-based learning environments and are included in Appendix A. A

18
definition of what inquiry learning entails can be found through the National Research
Council’s National Science Education Standards (1996) and is as follows:
Inquiry is a multifaceted activity that involves making observations; posing
questions; examining books and other sources of information to see what is
already known; planning investigations; reviewing what is already known in light
of experimental evidence; using tools to gather, analyze, and interpret data;
proposing answers, explanations, and predictions; and communicating the results.
Inquiry requires identification of assumptions, use of critical and logical thinking,
and consideration of alternative explanations. (p. 23)
The inquiry methods for instruction used focused student investigations and
encouraged community-based learning through discussion and on-going hands-on tasks.
These tasks supported students as they worked to discover specific mathematical
relationships and understanding.
The inquiry lessons were taught through facilitated group work with the
expectation that students would work with their group members to develop methods for
finding the areas of given figures. As the instructor, I closely monitored the process of
individual groups, and required all participants to give justification for their methods. I
carefully designed the lessons to allow students to move from more simple environments
for formulation into more complex problems that required usage of a developed method
for finding area. As the class progressed into considering more complex shapes, students
were expected to draw on previous explorations to find the areas of these shapes. The
lessons were designed to engage students in developing their own strategies for area
formulation, fitting with basic constructivist learning principles.

19
At the end of each lesson, students were provided a problem set to take home and
complete using their newly developed method. These problem sets were short
(consisting of three to five problems) and only served to solidify developed
understandings.
Lesson Progression
Area topics taught in this unit were taught in the order presented in Table 1.
Table 1: Lesson Progression
Procedure
At the beginning of the study, all members of the control group and the
experimental group took a pre-test. The purpose of the pre-test was to measure students’
prior knowledge about shapes and area-based problems. Prior knowledge should have
included: an ability to use the Pythagorean theorem to find missing side lengths in right
triangles, the ability to use right triangle trigonometry to find unknown measures for sides
in right triangles, a basic understanding of perimeter, and a basic understanding of simple
area formulas. Known formulas should have included square, rectangle, triangle, and
circle area formulas. The pre-test also contained a small number of problems involving
Experimental Group Control Group
1. Area of parallelograms 1. Area and perimeter of rectangles,
squares, and circles
2. Area of triangles 2. Area of triangles and parallelograms
3. Area of trapezoids 3. Area of trapezoids, rhombuses, and kites
4. Area of rhombuses and kites 4. Review of formulas covered so far
5. Perimeter and area of similar figures 5. Perimeter and area of similar figures
6. Circumference and arc-length 6. Circumference and arc-length
7. Areas of circles and sectors 7. Areas of circles and sectors
8. Area of regular polygons 8. Area of regular polygons

20
area formulas that the students had been minimally exposed to, including trapezoids and
parallelograms. Data from the control group was compared with the experimental group
using a t-test. Differences were noted and included in the final comparison of the two
classes.
Once the pre-test was completed, the differing lessons began. I instructed both
the experimental class as well as those classes that represented the control group. I was
careful to maintain a different approach between the two groups, using well-developed
lessons to ensure fidelity to each instructional approach.
The inquiry-based lessons were taught over a two and a half week period.
Students were encouraged to discuss the mathematics and develop methods through this
discourse. Students’ desks were arranged in groups of two or three to encourage group
discussion. I served as a facilitator of the discussion and guided the direction of the
discourse in a way that helped students recognize the meaningful relationships underlying
their mathematical tasks. This included small segments of direct instruction as well as
extended periods monitoring students’ progress as individual groups developed
approaches. I closely monitored individual groups’ progress, aiding them in recognizing
any noticeable misconceptions through question posing. Though direct instruction was
sometimes used, it was never the primary method of instruction, and every class period
began with student investigations and discussions of the mathematics.
Students were expected to defend their mathematical ideas to their groups as well
as to the entire class, to support their abilities to explain mathematical ideas. Students
were not required to take formal notes. Instead, the hands-on materials and handouts that
students received during lessons became their resource for future use. Daily lessons

21
concluded with short take-home assignments to assess the students' developing
understanding of the mathematics.
The control group was taught using the McDougal Littell Geometry 2007 edition
adopted by the selected school district. Their lessons followed those from the selected
text and were supplemented with worksheets that I generally have used in my geometry
classes to highlight specific concepts of area formulation. Students were instructed how
to find the area of a variety of geometric figures and were expected to use those formulas
on a variety of problems, including problems that do not give all necessary information.
All instruction was lecture-based and examples were provided to guide the students in
using the area formulas. Students were also shown the reasoning behind the area
formulations. For example, when students were learning how to find the area of a
triangle, I illustrated for control-group students that a triangle is actually half of a
parallelogram.
Students were expected to participate in the lecture by answering questions and by
taking formal notes, which were assessed for completeness at the end of the unit. To
encourage participation and focus on the instructor throughout the class period, students’
desks were placed in rows facing forward. Once instruction was completed, students
were given an assignment out of the book consisting of 10-20 problems and a small
amount of class time to begin work so that they could ask questions if necessary. Work
not completed during this time should have been taken home by the student for
completion. Students should have felt comfortable with this progression through the
material, as this instructional approach had already been established throughout the
school year.

22
Throughout the course of the study I maintained a journal in which I documented
student behaviors within the control and experimental classrooms, as well as my own
reflections on what went well during the instructional periods. I recorded examples of
student conversations and strategies as they attempted to use the mathematics they were
learning. Through careful observation I hoped to discover if the method of instruction
impacted the students’ willingness to attack difficult problems on their own. I was also
trying to determine if the students in the experimental group adapted and took
responsibility for their learning. When differences developed in their approaches to the
mathematics and problem-solving approaches, then I attempted to generalize these
differences and included them in my observational data. I also tried to find whether the
experimental-group students performed better when confronted with a real-life situation
involving area, observing whether they had a better established ability to convey meaning
and understanding through mathematical discourse than their control-group peers. All of
this information was important in determining the overall success of each educational
approach.
At the end of the two and a half week period, both groups of students were given
a post-test. The post-test contained standard decontextualized mathematical problems
similar to those found on standardized tests and in textbooks. These problems fell into
two categories: problems that had all necessary parts given in the figure, and problems
that needed some parts calculated in the figure before area could be determined. The
post-test also contained a section of problems that required students to apply their
problem-solving abilities. These problems were given in less traditional contexts and
required more than a simple area formula to solve. Such problems required more analysis

23
on the part of the students and a better understanding of the area relationships that exist
among shapes. Students’ post-test scores were compared based on their instructional
approach. A t-test was used to determine differences between group scores on the post-
test. Determining the effectiveness of each approach was partially based on these
findings.
At the end of the study, all students were asked to complete surveys designed to
gain insight into their perspective of the mathematics learned. This included program-
oriented questions developed to measure students’ attitudes towards the instructional
approach as well as questions regarding their feelings towards the usefulness of the
mathematics they had just learned. The survey was designed to gain insight into how
students felt about the mathematics they learned with respect to their future learning and
to real-world situations. A copy of the survey can be found in Appendix C.
After the post-test and the survey, experimental and control-group students
completed a culminating area project. This project involved finding the area of the floor
of a classroom from a dome-shaped high school. For students to effectively complete the
project, they needed to be able to use their problem-solving abilities as well as their
understanding of area to break a complex region into manageable parts. I monitored their
progress as the different groups completed this project. The goal of this culminating
exercise was to determine if the experimental group was better prepared to complete a
real-life situational problem involving area. I monitored all groups for their approaches
to the problem and monitored discourse among students. Any generalizable differences
between the control and experimental students were included in the final evaluation of
the inquiry-based instruction.

24
At the very end of the year, all geometry students were given a retention quiz over
the area unit. This quiz included area problems similar to those on the post-test. Scores
on the retention quiz were collected and analyzed to see if there was any difference in
retention between the two groups. An example of the retention quiz can be found in the
Appendix B.
At the end of the research, responses and test data were collected and analyzed for
trends. Student data were used to answer the research questions posed and to give insight
into how students learn mathematics. The data also gave insight into which instructional
method was most effective in preparing students to use mathematics in their life and to
pass standards-based mathematics exams.

25
CHAPTER 4: RESULTS
Pre-Test
The study began with the completion of a pre-test by all students in both the
control and the experimental groups. Students who did not return consent forms were
excluded from the final analysis. The scores of the control group and experimental group
were compared to obtain a baseline measure of students’ knowledge. The mean score
was found for each group, including the standard deviation. This was followed by a t-test
to evaluate for differences in the scores not attributable to chance. Results can be found
in Table 2.
Table 2: Pre-Test Results
N mean standard
deviation
p-value
Control 33 6.70 3.70 0.151
Experimental 19 8.26 3.78
Clearly the mean score for the experimental group was higher on the pre-test,
though not at a level that could be considered statistically significant with p=0.151. To
gain further insight into the differences in students’ scores on the pre-test, a complete
item analysis was done for each student who completed the pre-test. Results of the item
analysis can be found in Appendix E and the pre-test can be found in Appendix B.

26
A review of the item analysis of the pre-test revealed that the only item that
appeared to have a statistically significant difference in score between the control group
and the experimental group was item 3f. This item involved finding the circumference of
a circle and appeared to reveal that the experimental group had a better memory of the
formula for circumference. Item 3d also revealed a rather large difference in mean
scores. This item involved finding the perimeter of a triangle with an altitude given.
Further testing on individual items revealed that if the only items included in the t-test
were those involving area, items 4a-4g, then the p-value increased to p=0.196. If
problem 4a, the area of a rectangle, was removed from this set, then the p-value for
comparing means increased to p=0.454. This revealed that the students’ overall
understanding of area did not differ in a statistically meaningful way.
Post-Test
After the treatment period the post-test was given. The analysis of the post-test
mean scores for the two groups can be found in Table 3. One significant factor for the
post-test was student absences on the date of the test. Many students from the
experimental and control groups were absent for school related events, and were unable
to make up the test until 3-5 days after the actual test date. These scores were left out of
the final analysis of the post-test since their results would require a higher level of
retention. Retention was examined later in the semester. It seemed more relevant to
include only comparable data, which would be limited to tests taken within a reasonable
timeframe of one another.

27
The post-test results revealed a p-value = 0.0061, which is statistically significant
at the p=0.01 level. This implies that the difference in the mean scores for the two groups
did not happen by chance and can be attributed to the treatment that was given. Since the
experimental group achieved a much higher score, we can conclude that the inquiry based
instruction was beneficial to the students’ performance on the post-test.
Table 3: Post-Test Results
n mean standard
deviation
p-value
Control 31 16.968 8.631 0.0061**
Experimental 17 24.352 8.306
**Statistically significant at the p=0.01 level
A close look at the results in Table 3 reveals a large standard deviation for the
scores of both groups. Two histograms illustrating the scores achieved by each group can
be viewed in Figure 1. Though both histograms can be considered bimodal, a simple
observation of the distribution of scores indicates that most of the experimental-group
students achieved either between the ranges of 15-20, or 25-30, with the largest number
of students achieving scores from 25-30. The same range, 25-30, was only achieved by
two of the control-group students as most of them fell in the range of 15-25 or 5-9. Also,
two students from the experimental group scored in the highest possible range on the test
(35-40), a range none of the control-group students achieved. Only one student from the
experimental group performed below a 15 on the post test compared with 14 students
from the control group. This analysis supports the claim that the experimental group

28
12
5
5
45
5
5
13
12
obtained a better understanding of the mathematical relationships, and overall achieved
higher scores on the post-test.
Figure 1: Distribution of Scores for Post-Test
Again, to further analyze the differences in the scores between the groups, a
complete item analysis for the post-test was conducted. The results of this item analysis
can be found in Appendix E; the post-test can be found in the Appendix B.
The item analysis reveals that the experimental group performed statistically
significantly better at the p=0.01 level on item 1c and item 1f. These problems can be
viewed in Figure 2.
1c. 1f.
Figure 2: Post-Test Items p=0.01
0
2
4
6
8
10
5 10 15 20 25 30 35 40
Nu
mb
er
of
Stu
de
nts
Test Score
Experimental Group
0
2
4
6
8
10
5 10 15 20 25 30 35 40
Nu
mb
er
of
Stu
de
nts
Test Score
Control Group
0 5 10 15 20 25 30 35 40 0 5 10 15 20 25 30 35 40

29
5
4810
6
Regular Hexagon
1412.12
3
Item 1c involves finding the area of a kite. Most students in the experimental
group attacked this problem by dividing the kite into triangles and finding the area of all
involved triangles. Though some of the students in the control group used this method,
most relied heavily on the formula for the area of a kite (
).
Item 1f involves identifying the parallelogram and finding the parts necessary for
area. All important elements are given, but students must demonstrate a strong
understanding of area by reasoning how the area of the parallelogram can be found.
Control-group students more so than experimental-group students had a strong tendency
to multiply 10x12 or 5x13. Since the experimental students did significantly better on
this problem, it leads to the conclusion that inquiry based instruction leads to better visual
understanding of area and an ability to break down shapes.
The experimental group did statistically significantly better at the p=0.05 level on
items 1a, 1e, 1g, and 2a. These problems can be viewed in Figure 3.
1a. 1e.
1g. 2a. Circumference
Figure 3: Post-Test Items p=0.05

30
Though item 1a is a straightforward triangle area problem, item 1e requires a
small amount of analysis followed by the use of the Pythagorean Theorem. This then
becomes a multi-step problem. Many students, more in the control group than in the
experimental group, used the triangle formula improperly by multiplying
.
Students in the experimental group outperformed their peers, suggesting that even though
they were never given the formula directly, they had a better understanding of the parts
necessary for finding the area of a triangle.
Item 1g proved fairly straightforward for the experimental students, as most of
them broke the hexagon into six triangles and found the area using this strategy. Control
group students were handicapped by their dependence on the formula
.
Finally, the difference in score on item 2a is not surprising given that the experimental
students outperformed the control group students in a statistically meaningful way on the
circumference problem on the pre-test.
The experimental group outperformed the control group at a nearly statistically
significant level (p=0.1) on items 1b, 1i, 1j, and 3c. These problems can be viewed in
Figure 4.
Though problem 1b should be fairly straightforward for students utilizing the
formula for the area of a trapezoid, many-control group students under-performed on this
problem. Experimental-group students had a tendency to break the trapezoid into a
rectangle and a triangle to find the area. This requires a better understanding of area and
the nature of space. Item 1i can be considered a strong indicator of problem-solving
ability and visual recognition. Few students were able to grasp that it was necessary to
break the given triangle into two triangles to find the area. The fact that the

31
4
9
14
10
19 20
1410
5
15
21
6
10
experimental-group students performed better on this problem further promotes the idea
that the experimental-group students had developed better problem solving abilities and a
more dynamic understanding of the concept of area.
1b. 1i.
1j. 3c.
Figure 4: Post-Test Items p =0.1
Item 1j is another example that would require analysis of the given shape in order
to find the height of the trapezoid. Again experimental-group students demonstrated
better problem-solving ability by analyzing what was given, and deciding not only what
was needed, but how to find what was needed in order to calculate the area of a difficult
problem. Finally, item 3c further supports this claim by again indicating that the
experimental-group students were more capable of solving multi-step problems, which
required analysis and understanding of the concept of area.
It is also worth noting that the only two problems on which the experimental
group underperformed the control group were item 1h and item 7. These items can be
viewed in Figure 5.

32
The area of KMO is 12cm2. If possible determine the areaof the parallaleogram KONL.
N
K
L
O
M
5
1h. 7.
Figure 5: Items on which Control Group Outperformed Experimental Group
Notably item 1h is a problem that draws reference to the relationship between a
parallelogram and a triangle and the understanding that the area of the triangle is half of
the parallelogram with the same base and height. The fact that the experimental group
did worse on this problem may indicate that they did not grasp the relationship through
the tasks that were given to them. Item 7 is a multi-step problem involving a regular
triangle cut out of the area of a circle. Item 7 was given as a bonus problem for all
students and as a result not all students attempted this problem. Performance on the
problem may be an indication that the control group was slightly better attuned to the
area of a regular triangle, or it may indicate that the experimental group felt less desire to
complete an extra-credit portion of the test.
Questionnaire
At the end of the area unit, a questionnaire was distributed to all students involved
in the study. The questionnaire consisted of eight Likert scale questions that allowed
ranking from 1-5, with one being the lowest and five being the highest. The second half

33
of the questionnaire included six open-ended questions. Responses to these questions
were synthesized to identify common themes. This questionnaire is included in
Appendix C and the results of questions 1 – 8 of the questionnaire are tabulated in
Table 4.
Table 4: Questionnaire Results
Control Group
n = 31
Experimental
Group n = 22
Questions mean standard
deviation
mean standard
deviation
p-value
1. How well did you like this chapter
compared to other chapters we have
covered?
1.968 0.983 3.773 0.922 0.000**
2. How well do you feel you
understand how to find area of
shapes?
2.742 0.930 3.182 1.053 0.114
3. How confident do you feel that if
you had to find area to complete a
project you would be able to do it?
2.645 1.050 3.364 1.049 0.018*
4. How much do you feel you
learned this chapter?
2.807 0.910 3.409 1.008 0.027*
5. How prepared did you feel before
this chapter started to apply what
you knew about area to real world
applications?
1.968 0.752 2.333 0.913 0.121
6. How prepared do you think you
are now to apply what you know
about area to real world
applications?
2.645 0.950 3.500 0.802 0.001**
7. How did your performance in this
chapter (homework and tests)
compare with your performance on
previous chapters?
2.194 1.167 3.000 1.113 0.015*
8. Did you feel that the approach we
took to learning area was beneficial
to your understanding?
2.807 1.195 3.682 1.129 0.010**
* Statistically significant at the p=0.05 level
**Statistically significant at the p=0.01 level

34
Results of the questionnaire indicate that students in the experimental group felt
that they learned more than their control group counterparts and felt more prepared to use
what they learned outside of the classroom. The experimental group indicated that they
had a slightly higher confidence level for applying area before the study began, but felt
even stronger after the study. In fact, the experimental students’ indication that they were
more prepared to apply what they learned during the unit on area outside of the classroom
can be attributed to the difference in approaches at the p=0.01 level, giving a strong
indication that the students felt more prepared to apply their knowledge when instructed
using inquiry-based methods.
The experimental students also indicated that they enjoyed the area unit more than
other units that they had covered throughout the year and felt that the approach was
beneficial to their understanding. The control students, on the other hand, indicated that
they liked the area unit less and were mixed on how beneficial they felt the approach was.
As would be expected, the t-test reveals that this can be attributed to the differences in
approaches at the p =0 .01 level. This should not be surprising considering these are
questions directed at how the students felt about the approach itself.
Responses to open-ended questions on the survey further illuminate the responses
from the Likert scale questions. Question 9 asked the students, “Why did you feel that
the way this chapter was taught was helpful or not helpful?” Multiple control-group
students indicated that remembering the formulas was difficult for them. Some of these
students did not mind the approach and felt that the presentation was good; they simply
could not recall the formulas when they needed to. Other control students indicated that
they prefer to learn through different approaches and that the lecture style did not match

35
with their own learning style. Multiple students also cited the pace of the class as being
too rapid, with inadequate time for examples to grasp the concepts. There was a
comparable amount of positive and negative responses among the control-group students
in response to this question with eleven positive responses, fourteen negative responses,
and four responses that could not be classified as either positive or negative.
Experimental-group students overall seemed positive about the approach, citing
that they learn better in groups and that they enjoyed seeing different ways to solve the
problems. One student commented that he “was able to see different ways to solve
problems, helped find the way that (he) learned.” Others commented that the method was
fun and that the slower pace helped.
Not all experimental group comments were positive however. Some felt that they
should be working individually because everyone has their own pace. Others cited that
their group was continually lost so they didn’t feel that they learned very much.
Question 10 asked the students, “What was the most interesting thing you learned
during this chapter?” An overwhelming number of control-group students made some
reference to the formulas used. Some students did this by stating that a specific formula
was the most interesting thing that they learned, such as “The trapezoid formula and the
fact that there were two bases,” while other students cited the formulas in general, such as
“the formulas for all the shapes to find area.”
The experimental group responses were more varied, with students referencing
things that they learned from the style of instruction, such as, “How easy it is to actually
learn,” and “Working in groups helps me learn more.” Other students cited that they
learned how to find area without formulas, and that “You can break stuff down instead of

36
just following one approach.” Still others referenced individual connections that they
made throughout the unit, such as the connection between circle area and parallelograms
or how they can break complicated figures down to find the area.
Question 11 asked the students, “If you were an educator, how would you change
the way that lessons are taught?” and question 12 followed up with “Why?” Control-
group students varied on their responses to this question, but many students did identify
that they would vary their instructional methods, give more time, and give more hands-on
work. Much of the justification behind this was that students learn in different ways and
need more time to master concepts before moving on.
Experimental-group responses also varied, but many students did seem to like
having more hands-on activities and would continue using similar methods. Others
suggested small changes to the inquiry-based approach, such as changing groups every
day to allow students to gain access to more ideas or giving the formulas first before the
explorations. A few of the experimental students did feel that better explanations would
have helped them; they did not always feel that what they accomplished in their group
was adequate for complete understanding.
Questions 13 and 14 asked students to define area and perimeter, respectively.
Both groups seemed to have an adequate grasp of the two concepts. This was evident as
most students referred to area as the space inside of an object or figure and the perimeter
as the distance or length outside of an object or figure. A few students in both groups
were subject to improper language, such as defining area as the distance inside of an
object or defining perimeter as the space outside an object. Multiple students in the
control group used a definition referring to specific formulas, such as the base times the

37
height of an object, which may convey a misunderstanding of area formulation. A few
experimental students referenced the number of squares inside of an object as area.
Overall, both groups indicated a basic understanding of the two concepts.
Project
At the very end of the area unit and questionnaire, all students were placed in
groups and spent two days working on a culminating area project. Every group was
given a scale drawing of the floor space of a room within a dome-shaped high school and
asked to find the area. Examples of these problems can be found in Appendix D.
The goal of the project was to discern if the experimental students were better
prepared for real-world applications of their learning. Small differences in methods did
come to light, including a willingness of the experimental group to jump in and attempt to
solve the problem, often asking questions like, “does this make sense?” seeking to
validate their own ideas. The control group was much more likely to ask the question,
“How do I do this?” or “Is this right?” These questions indicated that the experimental-
group students had begun to accept that there was a process involved when solving
problems and that there are multiple ways of solving a problem, while control-group
students remained convinced that there was one right method for solving the problem.
Aside from this distinction, however, student-to-student discussions and strategies
between the control and experimental groups did not noticeably vary once all students
became engaged. The experimental group did not display a better aptitude for solving the
difficult problem than did the control group, and many members of both groups made
assumptions without weighing their validity. In fact, only one group found the area of

38
the sector portion of the room in an appropriate fashion. These students were members of
the control group.
This leads to the conclusion that two weeks of inquiry-based instruction did
increase the students’ acceptance of multiple methods for solving problems and their
willingness to jump in and attempt working their own ideas. It did not increase their
efficiency, or the likelihood that they would correctly navigate the difficulties and
misconceptions of a real-world problem involving area.
Retention Quiz
At the end of the semester, four weeks after the culmination of the area project,
students were given a retention quiz over the area unit. It is worth noting that between
the area unit and the end of the semester two units were covered, one on surface area and
one examining volume.
The results of the retention exam can be found in Table 5. It is important to
recognize that the experimental group did significantly better at the p=0.05 level on the
retention exam. This indicates that the inquiry-based treatment of the experimental group
did increase retention among the students involved.
Table 5: Retention Quiz Results
n mean standard
deviation
p-value
Control 30 3.70 2.087 0.010*
Experimental 18 5.278 1.776
* Statistically significant at the p=0.05 level

39
Analysis of the retention exam is continued with a complete item analysis, found
in Appendix E with the complete retention quiz in Appendix B. Results indicate that the
experimental group performed statistically significantly better at the p=0.01 level on item
7, which required students to find the area of a sector with a 90o central angle. The
experimental students performed better at the p=0.05 level on item 1 and item 8. Item 1
required students to use the Pythagorean Theorem to find the length of the missing side
of a triangle and use that length to calculate area. Item 8 consisted of two parallelograms
that were mirror images of one another. Students could use a variety of approaches to
find the combined area of the parallelograms
The experimental students outperformed the control-group students on every item
except item 2, which required students to find the area of a triangle with all necessary
parts given. The small difference in scores between the control and experimental group
on this item can be attributed to most students having the formula for area of a triangle
memorized and possessing basic ability to apply the formula when all necessary parts are
clearly given.

40
CHAPTER 5: DISCUSSION
Observations
While the research was being conducted, I kept a daily journal to track how the
lesson went and if the students experienced any great revelations as a result of the
instruction. Throughout the two-week period, many interesting factors came to light.
It is important within a classroom that students remain on task in order to learn.
Though the experimental group of students met every day in groups, this did not seem to
detract from time on task. One might expect students to be off task when placed in
groups and given more freedom within a classroom, but this was not the case. The
continual movement from task to task and encouragement to discuss the mathematics at
hand kept students interested, and groups continued to work through the problems. The
freedom of exploration seemed to spur groups on in their discussions and explorations.
This is not to imply that groups did not get off task or that I did not take an active role in
reminding students what they should be discussing. However, on-task time for the
experimental students surpassed that of the control-group students.
Students did seem motivated by having a problem to solve and discuss. This
meant something different in the context of the group work than it did in the traditional
homework problems presented to the control groups. Students were engaged and curious
as to where they were going during the inquiry lessons in a way that control-group
students were not. Control students did appear to listen to the lectures and answer
questions, but a far smaller number of students were able to be involved and too many

41
students left the class without becoming involved in the lecture. This leads to concern
regarding what they actually understood.
Not all experimental students were involved however. Throughout the unit there
was one particular student that refused to take part in the discussion and would become
obstinate when approached. The student did not attempt to complete group assignments
and disengaged herself from other group members. Working with the student was
frustrating and unrewarding. Throughout the unit, I was unable to reach this student and
as a result the student’s learning was minimal.
Other students engaged in similar behavior at times, waiting for one member of
the group to lead the rest to the discovery. Complete group involvement was hard to
come by in this regard. Many groups learned to rely on one strong member for their
progress through assigned tasks.
Although control group lessons did present why specific formulas are used, this
information was not deemed important by many students, and their subsequent student-
to-student discussions often revolved around what the formula was and what should be
plugged in where. For the experimental group, questions more often revolved around
how and why a certain method worked. Since students were not given explicit formulas,
they were not inclined to ask about them; instead the individual students attempted to
understand a method. This method seeking required more thought, more conversation,
and a higher level of understanding. Students were not always ready to answer such
questions regarding their methods, and even for the experimental group it often became
explanations about multiplying this by that without justification. Constant monitoring did
catch many of these instances and I questioned these students until they could defend

42
their method. In one such instance, the student became openly irritated by the constant
questioning, but when she eventually conveyed her understanding in a meaningful way,
she seemed to be proud of the argument that she had constructed. Since students were
often required to present their findings and defend the methods of their group, students
slowly adapted to asking the questions to discover why a specific approach did or didn’t
work.
The idea of proof is central to the goal of inquiry-based learning. Although
students did get closer to proof by discussion, they never fully engaged in one another’s
ideas. This could be the result of instructional shortcomings, or a reflection of the short
amount of time students were given to adapt to the inquiry-learning style. Even when
two students had different yet valid ideas, the students’ arguments failed to be proof
oriented as students reacted to frustration in their attempts to defend their ideas. Group
dynamics played a large role as some students were not interested in others’ ideas,
especially if they felt they had the correct answer already. This kept students from
engaging in discussion about the validity of a response simply due to the fact that their
process was not the same.
Two lessons especially illuminated what effective inquiry instruction looks like.
The first was the lesson on area and perimeter of similar figures. When given the group
worksheet, students did not begin by discussing, but by trying to fill in answers. Small,
quickly discerned items did not seem to spur the students to communicate. Also, in this
lesson, students’ mistakes and improper assumptions led to an inability to draw the
conclusion that the ratio of the areas is the ratio of the scale factor squared in similar
figures. Students did not come up with this in their groups and I played a large part in

43
clearing up their lack of understanding. As a result, the experimental-group students
never seemed to fully grasp the connection. Scaffolding and the ability of the student to
draw and defend their own valid conclusions is central to inquiry-based lessons. If the
lesson fails to allow students to do this, then it is unlikely that they would be able to
progress mathematically.
The second illuminating lesson involved finding the area of regular polygons.
Students have always seemed to struggle with this complex area formula. However, the
experimental-group students jumped in. By the end of the two-day lesson, every group
was able to find the area of a regular polygon given a side length and defend the method
they used for finding that area. The connections students had drawn differed from those
traditionally drawn during lessons on regular polygons, and as a result the experimental
students displayed a much better understanding of how to find areas of those figures than
the control-group students did, even though the control-group students had a simple and
concise formula for that area. This lesson illustrated the importance of the connections
the students had drawn. Since the students made their own conclusions, and had their
own arguments, their method was remembered. This is further backed by the results of
the retention quiz.
Students also had a tendency to remember what they had come up with on their
own. Due to the approach we took to learning area of a circle involving a formula
derived from parallelograms built from sectors of the circle, one student always
calculated area of a circle using the product of half the circumference and radius. Even
though this student had been exposed to the more concise πr2, they remembered the
formula that they had derived through experience.

44
It is important to admit that misconceptions among the experimental group were
common throughout the lessons. Though I attempted to discuss with each group their
misconceptions and clarify them, often there was not enough time to clear up all of the
misconceptions. As a result, I was concerned throughout the implementation that the
students may not have been adequately grasping the material. The results of the study
indicate that even though there were many misconceptions along the way, students
developed a better understanding of area than their peers who were taught in the
traditional fashion. This leads to the conclusion that the control-group students suffered
from at least as many misconceptions as the experimental-group students. The difference
then lay in the fact that the experimental-group students were constantly discussing their
understanding, thus bringing these misconceptions to light. Mathematics instructors may
be more likely to engage in correcting these misconceptions because they see them as
being developed by the students. This research reflects that even when students are
taught explicitly, their understanding is not without its misconceptions. Educators may
often overlook these misconceptions because they know that the students have been
instructed in how the mathematics should be done. Students will still develop their own
understanding based on their interpretations of the information presented; an
understanding that is imperfect and subject to the students’ misconceptions is often
developed.
Conclusion
The likelihood that misconceptions come to light, paired with the idea that
students will clarify their own understanding through interaction with the material,

45
creates a learning environment that is superior, and better enjoyed by the students, than
the traditional classroom. Students involved in the inquiry-based lessons exhibited better
retention, a better ability to problem solve, and better performance on decontextualized
mathematical problems than their peers who were taught in the traditional fashion. They
did not, however, display a better ability at proof or greater aptitude in a real-life area
problem situation.
These results validate many of the claims of the inquiry-based instructional style.
To maintain quality education for our students and to help them build a relational
understanding of the mathematics teachers should incorporate inquiry-based instructional
methods into their classrooms. Fear of change and concern about high stakes testing
should not inhibit change within classrooms as these fears are shown to be baseless by
the results of this research. Implementation of inquiry-based instructional methods
should be encouraged by administrators and embraced by educators in an effort to
continually improve public education in the United States.
Limitations
After the conclusion of the study, it became apparent that more research would
lead to a better understanding of the impacts of inquiry-based instruction. Changes to
elements of this study would bring about better understanding of the impacts of inquiry-
based instruction. It is impossible to predict the full impact of such changes without
further research.
One limitation was the timeframe over which the study was implemented. It
would be worthwhile to extend this study throughout the course of an entire year,

46
introducing students to inquiry-based learning at the very beginning and continuing in
this format. Such an experiment may lead to greater acceptance of the approach by the
students and thus involve a greater number of them in the thinking process. Along the
way, students may learn better what mathematical discourse looks like and be better
prepared to communicate mathematically. Such an extension of the study would give
greater insight into the benefits of inquiry-based instruction in terms of retention,
problem-solving ability, development of mathematical discourse, and transferability of
learned mathematics.
The retention element of this study was also limited by timeframe. There was
only a four-week period between the end of the inquiry-based lessons and the end of the
semester. This did not allow for long term testing of retention. A longitudinal test for
retention would lead to greater insight into whether the gains due to the inquiry-based
methods are lasting and could include extended studies of students’ real-world
application of the mathematics.
As the sole instructor of the inquiry-based lessons and the designer of the lessons
used in this study, the results cannot be disconnected from my classroom or my
implementation. Further research should include implementations guided and created by
others to determine the true benefits of inquiry learning and elements of successful
inquiry lessons.

47
WORKS CITED
Barell, J. (2007). Problem based learning and inquiry approach. New Delhi: Sage
Publications India Pvt. Ltd.
Boaler, J. (1998). Open and closed mathematics: student experiences and understanding.
Journal for Research in Mathematics Education, 29 (1), 41-62.
Boaler, J. (2000). Exploring Situated Insights Into Research and Learning. Journal for
Research in Mathematics Education, 31 (1), 113-119.
Cavanagh, S. (2006). Big cities credit conceptual math for higher scores. Education
Week, 25 (18), 1-15.
Goos, M. (2004). Learning mathematics in a classroom community of inquiry. Journal
for Research in Mathematics Education, 35 (4), 258-291.
Hmelo-Silver, C. E., Duncan, R. G., & Chinn, C. A. (2007). Scaffolding and achievement
in problem-based and inquiry learning: a response to Kirschner, Sweller, and
Clark(2006). Educational Psychologist, 42 (2), 99-107.
Hodge, L. (2008). Student roles and mathematical competence in two contrasting
elementary classes. Mathematics Education Research Journal, 20 (1), 32-50.
Ismail, J. (2008). The effects of a reform curriculum on students' problem solving
abilities. (Unpublished master’s thesis). Boise State University, Boise, ID.
Kirschner, P. A., Sweller, J., & Clark, R. E. (2006). Why minimal guidance during
instruction does not work: an analysis of the failure of constructavist, discovery,
problem based, experiential, and inquiry based teaching. Educational
Psychologist, 41 (2), 75-86.
Lampert, M. (1990). When the problem is not the question and the solution is not the
answer: mathematical knowing and teaching. American Educational Research
Journal, 27 (1), 29-63.

48
Levasseur, K., & Cuoco, A. (2003). Mathematical habits of mind. In H. L. Schoen,
Teaching mathematics through problem solving (pp. 27-37). Reston: The National
Council of Teachers of Mathematics Inc.
Marcus, R., & Fey, J. T. (2003). Selecting quality tasks for problem-based teaching. In H.
L. Schoen, Teaching mathematics through problem solving (pp. 55-67). Reston:
The National Council of Teachers of Mathematics, Inc.
McKinney, S., & Frazier, W. (2008). Embracing the principles and standards for school
mathematics: an inquiry into the pedagogical and instructional practices of
mathematics teachers in high-poverty middle schools. Clearing House, 201-209.
National Research Council. (1996). National science education standards. Washington
DC: National Academy Press.
NCTM. (2009, June). Guiding principles for mathematics curriculum and assessment.
Retrieved 10 14, 2009, from National Council for Teachers of Mathematics:
http://www.nctm.org/standards/content.aspx?id=23273
Pesek, D. D., & Kirshner, D. (2000). Interference of instrumental instrucion in
subsequent relational learning. Journal for Research in Mathematics Education,
31 (5), 524-540.
Saunders, W. L. (1992). The constructavist perspective: implications and teaching
strategies for science. School Science and Mathematics, 92 (3), 136-141.
Schoenfeld, A. H. (2007). Problem solving in the United States, 1970-2008: research and
theory, practice and politics. ZDM Mathematics Education (39), 537-551.
Skemp, R. R. (1976). Relational understanding and instrumental understanding.
Mathematics Teaching, 77, 20-26.
Stonewater, J. K. (2005). Inquiry teaching and learning: teh best math class study. School
Science and Mathematics, 105 (1), 36-48.
Vincent, J., & Stacey, K. (2008). Do mathematics textbooks cultivate shallow teaching?
Applying the TIMSS video study criteria to australian eight-grade mathematics
textbooks. Mathematics Education Research Journal, 20 (1), 81-106.

49
APPENDIX A
Inquiry-Based Lessons

50
The Slant company has hired a local architect to design abuilding that is slanted to one side. Above you can see asketch of his plan. The builder needs to know the area ofone side of the building to begin putting together a list ofnecessary materials. What is the area of this slantedface of the building?
115ft
65ft
Lesson 1 Parallelograms
Objectives:
1. SWBAT find the area of rectangles, squares, and parallelograms using grid paper
drawings.
2. SWBAT develop a method for finding the area of parallelograms.
3. SWBAT use developed formula to find area of parallelograms.
Procedures:
1. Present students with building problem which requires finding the area of
parallelograms.
2. Distribute grid paper containing rectangles, squares, and parallelograms. Ask
students to find the area of all the figures on the paper in their groups.
3. Once students have found the area of all the figures, ask them to formalize how
they are finding the area of figures of different types and compare their answers
and method with one other group.
4. Groups should then flip over the distributed grid paper drawings, and find
parallelograms with lengths provided on the reverse side. Students should begin
finding the area of these figures.
5. Give students the opportunity to discuss their methods for finding the area of the
parallelograms in front of the class. If time permits allow students to discuss their
methods, and demonstrate how they work.
6. Distribute a short problem set for students to take home and practice finding area
of parallelograms, rectangles, and squares.

51
3
410
6
3
5
12
7.5
14
9 4
12

52
5
10
6
20
108
12
5
132
12
Area of Parallelograms Homework Name_________________________
Find the area of each parallelogram.
1. 2.
3. 4.
5. 6.

53
Lesson 2 Triangles
Objectives:
1. SWBAT find the area of triangles with and without right angles using grid paper,
and matching triangle cut outs.
2. SWBAT Develop a method for finding area of a triangle.
3. SWBAT use their developed method to find the area of triangles not on grid
paper, including triangles with missing base or height that can be calculated using
Pythagorean Theorem, or right triangle trigonometry.
4. SWBAT break complex shapes into recognizable forms to find their area.
Procedures:
1. Distribute grid paper with constructed triangles to every student, also distribute
cut out copies of the same triangles to each group. Ask the students to find the
area of each triangle in the set.
2. Once students complete gridded triangles, ask them to flip the paper over and
continue by finding the area of triangles with base and height given, but no grid to
guide them. Some of these triangles will require the use of Pythagorean theorem
and right triangle trigonometry.
3. Have groups discuss their method for finding area, and define in their groups why
the formula hb 2
1 works for finding the area of a triangle. Each group will be
responsible for writing down, and turning in a short justification for why this
formula works before leaving the classroom.
4. If time permits have students rotate groups, and verify their justification for why
the formula hb 2
1 works with members of a different group.
5. Distribute take home assignment as students leave the classroom.

54
68
10
7
24
26
85
16
6
8
4.23.5
10
6 510 6
84

55
4
12
9
15
7.5
46
20
25
2
410
Area of a Triangle Homework Name_________________________
Find the area of each figure
1. 2.
3. 4.
5.

56
Lesson 3 Trapezoids
Objectives:
1. SWBAT find the area of trapezoids using grid paper.
2. SWBAT develop a method for finding the area of any trapezoid.
3. SWBAT find the area of any trapezoid using given parts.
4. SWBAT explain their method for finding the area of trapezoids to their peers.
Procedures:
Day 1:
1. Present students with the floor plan of a room that has a bay window and
ask how many 3ft x 3ft tiles it would take to tile the floor.
2. Hand out, one to each student, grid paper constructions of trapezoids, and
instruct them to find the area of these figures in their groups. To help
complete this task, also distribute packets of the same trapezoids cut out so
that students can put them together in different ways.
3. Once students have discovered the area of each gridded trapezoid, instruct
them to turn over the grid paper, and find the area of the non-gridded
trapezoids on the reverse side using what they discovered while working
with the grid paper.
Day 2:
4. Give each group two identical large trapezoid with measurements written
on them. These trapezoids need to be large enough to allow students to
see them from across the room if necessary. Many of the handed out
trapezoids should require the use of Pythagorean Theorem to find the
height.. Instruct the students to find the area of their groups trapezoid, and
to be prepared to explain how they found that area.
5. If students complete this task, they should continue working on the
gridded, and non-gridded trapezoids from the previous day.
6. Have students present the area they found for the large trapezoid, and
justify their method for finding the area of the trapezoid.
7. Distribute short problem set involving finding area of trapezoids to be
completed by the next class period.

57
F
E
D
C
BA
15
12
58
18
1313
5
17
10
2 136
13
17
2 17
8
1018
24
513

58
6
9
5
3 26
1417
15
2 4126
16
5 5
18
12
15
10
Area of a Trapazoid Homework Name_________________________
Find the area of each figure
1. 2.
3. 4.
5. Find the area of the shaded region if the area of the trapezoid is 75u2:

59
Lesson 4 Kites and Rhombuses
Objectives:
1. SWBAT find the area of kites and rhombuses on grid paper.
2. SWBAT break kites and rhombuses into triangles which will allow them to find
area of figures off of grid paper.
3. SWBAT use their developed method to find the area of any kite or rhombus.
4. SWBAT defend their method for finding the area of kites and rhombuses.
Procedures:
1. Hand out figures not on grid paper, and ask students to find the area of all the
figures using known formulas.
2. Once students complete the above task, they should move on to gridded kites and
rhombuses. Instruct students to not only find the area using the methods that they
used for the non-gridded figures, but to verify their solution by counting the
square units in each figure.
3. Randomly select one representative from each group and ask them to explain to
the class how their method for finding area. Entire class should be engaged in
debating whether presented methods are valid or flawed.
4. Hand out to groups a second set of problems which require the use of the
Pythagorean Theorem and have them find the area of these figures.
5. Distribute homework assignment as the students leave.

60
105
3
3
8
15
10
8
6
10
5
5
62
4

61
5
13
34
34
13
5 16
10
10
10
10
1616
113
7
113
Set 2

62
124
10
2 10
2 10 2 10
2 10
4
10
6
Kite and Rhombus Homework Name_________________________
Find the area of each figure.
1.
2. 3.

63
Lesson 5 Area and Perimeter of Similar Figures
Objectives:
1. SWBAT identify the ratio of side lengths of figures, as well as the ratio of
perimeters. Students will understand that these ratios are the same.
2. SWBAT identify the ratios of areas of figures, and identify the relationship
between ratios of areas and ratios of sides.
3. SWBAT use the relationships that exist between similar figures to solve
problems.
Procedures:
1. Hand out group worksheet (one per group) and have students fill in the blanks and
answer all questions.
2. Give a short review lesson on solving and setting up proportions involving similar
figures.
3. Distribute one set of problems to each student; allow groups to work through
these problems using what they have discovered about similar figures.
4. Have each group record the answer that they got to each of the 4 problems on the
board.(ongoing)
5. If time permits ask groups to defend their responses to the problems. If
differences exist among groups, utilize the difference as a catalyst to discussion.
6. Distribute short problem sets for students to complete for the following day
involving similar figures.

64
BA
BA
BA
Group Work
Verify every set of figures is similar, identify the scale factor (A to B), find the perimeter
of each figure, the area of each figure, the ratio of the perimeters (A to B), and the ratio of
the areas (A to B).
(Be sure to reduce all ratios to simplest form)
As you find all ratios, see if you can identify any patterns.
Scale Factor______________
Perimeter of A____________
Perimeter of B ___________
Area of A _______________
Area of B________________
Ratio of perimeters ________
Ratio of Areas____________
Scale Factor______________
Perimeter of A____________
Perimeter of B ___________
Area of A _______________
Area of B________________
Ratio of perimeters ________
Ratio of Areas____________
Scale Factor______________
Perimeter of A____________
Perimeter of B ___________
Area of A _______________
Area of B________________
Ratio of perimeters ________

65
BA
B
A
Ratio of Areas____________
Scale Factor______________
Perimeter of A____________
Perimeter of B ___________
Area of A _______________
Area of B________________
Ratio of perimeters ________
Ratio of Areas____________
Scale Factor______________
Perimeter of A____________
Perimeter of B ___________
Area of A _______________
Area of B________________
Ratio of perimeters ________
Ratio of Areas____________
Formalize any patterns that you noticed
a. Between the scale factor and the ratio of perimeters.
b. Between the scale factor and the ratio of the areas.
c. In your groups, discuss why these relationships exist. Formalize why on a
separate sheet of paper to be turned in. (one per group)

66
B
A
Scale Factor A
B=
Ratior of Areas A
B=
Find the area of Figure A, andthen find the area of Figure B(remember, they are similar)
6
1 3
3
2
2
Perimeter B =Area B =
B
A
912
Perimeter A = 36 uArea A = 96 u2
5
4
Perimeter of A =
Area of A =
Perimeter of B =
Area of B =
Scale Factor A:B =
Ratio of Perimeters A:B =
Ratio of Areas A:B =
B
A
3
5
10
4
Length of side x =
BA
Ratio of Areas A
B=
Ratio of Perimeters A
B=
x
1.7
Perimeter B =
Perimeter A = 8.5
Area A = 5
Area B = 45
Find the listed information for each set of figures. For each given pair figure A is similar
to figure B.
Find the listed information for each set of figures. For each given pair figure A is similar
to figure B.

67
6m
4m
B
A
B
A
Similar Figures Homework Name_________________________
1. You are given two similar rectangles. The scale factor of rectangle A to rectangle
B is 5:2.
a. If the perimeter of rectangle A is 30 in. What is the perimeter of rectangle
B?
b. If the area of rectangle A is 100 in2 what is the area of rectangle B?
2. The figures below are similar.
a. The perimeter of figure A is 12m, what is the perimeter of figure B?
b. The area of figure A is 30m2, what is the area of figure B?
3. The figures below are similar. The area of figure A is 54 u2, while the area of
figure B is 6 u2.
a. What is the ratio of one side of figure A, to the same side of figure B?
b. If the perimeter of figure A is 28, what is the perimeter of figure B?

68
30
21
15
4. Write a brief explanation for why the area of a triangle can be found using the
formula hb 2
1. Draw pictures if appropriate.
5. Find the area of the trapezoid below.

69
Lesson 6 Circumference and Arc Length
Objectives:
1. SWBAT understand why circumference can be found using the formula πd or
2πr.
2. SWBAT find the circumference of a circle given radius or diameter.
3. SWBAT develop a method for finding arc-length.
4. SWBAT find arc lengths, and perimeters of figures involving arcs.
Procedures:
1. Provide each group of students with a circular object, and a small paper with
measurement lines equally spaced and marked. Instruct the students to use the
ruler to identify the circumference, and decide how that measurement compares
with the length of the diameter.
2. Select a member from each group and ask them to summarize their findings to the
rest of the class.
3. Decide as a class the most efficient way to find the area of a circle. (Students
should be encouraged to justify why their methods are most efficient.)
4. Distribute problems involving arc lengths to every student, these problems should
increase in difficulty as the students progress through them. Instruct the students
to discuss how the length of the arc relates to the circumference of the circle.
Students should use their understanding of this relationship to formalize how they
could find the arc length, and to complete the provided problems.
5. Have one student from each group rotate to a new group and compare their
methods and solutions to the arc length problems. These groups should then work
together to complete any unfinished problems on the handouts.
6. Students will be given assignments to take home.

70
16
12
3
B
Arc-Length of AB =
10
A
30
Arc-Length BCD =
B
D
C 120
6
Arc-Length BD =
B
D
20 18
Arc-Length BFD =
BD
F
14
15
2
2
15
15
Find thePerimeter of theFigure
Find the circumference of each object:
Arc-Length: (Length of an arc of a circle) Find the length of the requested arc for each
object. Consider how much of the circumference you have.

71
812
Length of AB =
10 B
A
Length of CD =
1225
C
D
60
Rhombus w/ Cut Ends
3
39
9
9
9
16
10
Circumference and Arc-length Homework Name___________________
Find the circumference of each figure.
1. 2.
Find the requested Arc-Length for each figure.
3. 4.
Find the perimeter of each figure.
5. Rectangle, with semicircles attached 6.

72
Lesson 7 Area of Circles
Objectives:
1. SWBAT develop and use a formula for the area of a circle.
2. SWBAT develop and use a formula for area of sectors.
3. SWBAT find the area of shapes involving circles and sectors.
Procedures:
1. Using tiles from a fraction circle, place circle on overhead projector. Using the
largest fractional pieces break the circle apart, and re-arrange the pieces into a
parallelogram like shape. Continue to do this with each smaller set of fractional
circle pieces. Students will be asked to identify what shape we are getting near to
creating.
2. Once students have identified that we have a parallelogram, have them discuss
how to find the area of a parallelogram.
3. Distribute handout that contains a circle broken into pieces, and then rearranged
as a parallelogram. Ask students to identify what the base and the height of the
parallelogram would be based on where those parts come from in the circle in
their groups. (As necessary remind groups of circumference formula = 2πr.)
4. Once groups have discovered where each part comes from in the circle, direct
them to begin discussing what the formula for circle area should be. Allow a
short time for full class discussion.
5. Next direct students to the handout containing sectors of circles and ask them to
find the area. Students should have a method quickly as this exercise is similar to
that in lesson 6. If time is limited this can be accomplished as a class.
6. Have groups work through problems involving area of sectors and circles.
7. Distribute homework assignment as students leave.

73
r
40126
6
6
72
14
80
Area of Shaded Region
12
18
88
Be sure to label parts offigures for clarity, and tojustify why the formula works.
Area of a circle formula:

74
812
170
12
16
12
16
22
8
10
1060
Area of Circles and Sectors Homework Name______________________
1. Find the area of the circle. 2. Find the area of the shaded sector.
3. Find the area the shaded region of each figure.
a. b.
c.

75
Lesson 8 Area of Regular Polygons
Objectives:
1. Students will be able to find the area of a regular polygon with the apothem and
side length given by breaking the polygon into known shapes.
2. SWBAT find central angles of regular polygons, and understand that the apothem
divides them exactly in half.
3. SWBAT find the area of any regular polygon given the length of a side, or
apothem.
Procedures:
Day 1:
1. Hand out 3 different regular polygons with side length and apothem given, to each
group. Each polygon should be at least half of a sheet of printer paper in size.
Instruct students to find the area of each polygon. Every member will be
responsible for one shape.
2. Have students record the area that they found on the board.
3. Lead students into a discussion about responses, have different members defend
their resulting shape.
4. Handout worksheet with regular polygons with marked angles. Have students
complete the worksheet finding the measure of the central angles, and in some
cases, the measure of the angle after the apothem divides it.
5. Have groups justify their methods for finding the angle measures to one another
by moving one member from each group and encouraging discussion.
6. Homework will be assigned and sent home which has the students find the areas
of different regular polygons, and the central angles, and halves of central angles
in regular polygons.
Day 2:
1. Hand out one large polygon to each group, each polygon should be at least half of
a piece of printer paper in size. Allow students to work together to find the area
of their polygon, refreshing what they had discussed the previous day.
2. Randomly select one member from each group and have them present the
resulting area.
3. Give a short lesson reminding students how to use their trig functions to find
missing elements of right triangles.
4. Hand out the gazebo problem to every student and allow groups to work through
the problem.
5. Randomly select one group to collectively defend their solution to the class.
6. Allow other groups to present differing methods, and engage students in
discussion of results for the remainder of the class period.

76
9.248
17.44
12
9.6310

77
x
xx
x
x
x
Area of the triangle = 42 u2
Find the area of the octagon
7
7
3636
8 2
Find the measure of angle x in each figure.
Find the area of each figure.

78
7.477
209.75
15
9.65
18
8.74
12

79
You would like to have a gazebo built in your backyard. A builder givesyou the two options below for the same price. You want the gazebo thatgives you the the largest floorspace for dances. Which gazebo designshould you pick. How much more area do you get by using this design?
16ft12ft
12ft

80
5.774
5 14.5620
x
x
Regular Polygon Homework Name_________________________
1. Find the area of each regular polygon using the given information.
a. b.
2. Find the measure of angle x in each figure.
a. b.

81
The distance around a track is 400 m. What is the area of the infield? (Spaceinside of the track)
100 m
100 m
Review of Area Lesson Plan
Objective:
1. SWBAT use the area formulas that they developed throughout the chapter to
solve problems involving area.
Procedure:
1. Hand out a packet of realistic problems to each group, each problem should be
sized to fill one piece of printer paper with landscape orientation. Allow students
to work through the problems in any order. Groups will be expected to spend the
period moving from problem to problem until the packet is complete.
2. Select groups to present their findings to the given problems based on methods
that are witnessed throughout the class period. Allow time for student discussion.

82
Below is a scale model of a garage we plan to build. The scale factorbetween the model and the garage is 1:7.
I want to know two things about the actual garage.
1. What will the perimeter of the garage be?
2. If the area of the scale model is 7.898 ft2 what is the area of the actualgarage?
3.5ft
1ft
1.8ft
3.5ft
2ft
To the right is a floorplan for aroom with a bay window. Thehomeowner would like to install3ft x 3ft tiles in the floor of theroom. The owner would first liketo find the area of the room andthen determine how many 3ft by3ft tiles she needs to buy.
You are a friend of the owner,and she asks for yourassistance. First find the area,then make a recommendationfor how many tiles she shouldbuy to floor the room.
16ft
16ft
5ft
5ft
20ft14ft

83
The Slant company has hired a local architect to design abuilding that is slanted to one side. Above you can see asketch of his plan. The builder needs to know the area ofone side of the building to begin putting together a list ofnecessary materials. What is the area of this slantedface of the building?
115ft
65ft
1200 ft
1200 ft
A large skyscraper is oriented on a single city block as shown below. The length of each block is 1200 ft
We need to know two things1. The area of the buildings footprint2. The area of the leftover space around the building which will eventually be coved by grass.
If 1 square yard of sod costs $12, how much will it cost to lay sod around the entire building?

84
APPENDIX B
Tests and Quizzes

85
5
13
11
7
12
28
x
15x
50
20
18 5
127
12
9
25
684.8
6
10
Geometry Area Project Pre-Test Name_________________________
1. Find the length of the missing side of each right triangle.
a. b.
2. Find the length of side x in each triangle. Use your trig functions
(sine =
, cosine =
, tangent =
)
a. b.
3. Find the perimeter of each figure.
a. b. c.
d. e. f. Circumference

86
7
143
8 4
85
26
24
20
12
45
4.5
10
10
66
4. Find the area of each figure.
a. b.
c. d.
e. f.
g.

87
4
4
9
14
10
10
65
5
5
13
12
Regular Hexagon
1412.12
The area of KMO is 12cm2. If possible determine the areaof the parallaleogram KONL.
N
K
L
O
M
5
15
2114
10
2019
48
5
5
124
5
Geometry Test Chapter 11 Name_________________________
1. Find the area of each figure.
a. b. c.
d. e. f.
g. h.
i. j.

88
3 606
AB
8
13
7
5
6
10
20
7
7
6 2
6
6
18
18
8
2. Find the circumference, arc-length or perimeter for each figure
a. Circumference b. arc-length of AB c. Perimeter
3. Find the area of the shaded region of each figure
a. b.
c. d.
4. Find the area of the regular polygon, remember your trig functions. (Show all
work)
sine = hypotenuse
opposite
cosine = hypotenuse
adjacent
tangent = adjacent
opposite

89
5
5. If two similar figures have a ratio of perimeters of 6/7 what is the ratio of their
areas?
6. Which is larger, the circumference of the large circle, or the sum of the
circumferences of the smaller circles that share their diameters with the larger
circle?
7. BONUS: Find the area of the shaded region

90
13
128
26
5
20
14
3 8
4
4
18.12
15
4 55
24
6
13
24
5
Area Retention Quiz Name_________________________
Find the area of each figure.
1. 2.
3. 4.
5. 6.
7. 8.

91
APPENDIX C
Questionnaire

92
Questionnaire (do not write your name)
1. Please rate on a scale of 1-5, 1 being the worst and 5 being the best, how well you
liked this chapter compared to other chapters we have covered.
1 2 3 4 5
2. How well do you feel you understand how to find area of shapes? (1 being not
very well, 5 being extremely well)
1 2 3 4 5
3. How confident do you feel that if you had to find area to complete a project you
would be able to do it? (1 = not very confident, 5 = extremely confident)
1 2 3 4 5
4. How much do you feel you learned this chapter? (1 = not very much, 5 = I didn’t
know I could learn so much)
1 2 3 4 5
5. How prepared did you feel before this chapter started to apply what you knew
about area to real world applications? (1 = I couldn’t have done it, 5 = could have
solved any real world area problem)
1 2 3 4 5
6. How prepared do you think you are now to apply what you know about area to
real world applications? (1 = couldn’t do it, 5 = could solve any real world area
problem)
1 2 3 4 5
7. How did your performance in this chapter (homework and tests) compare with
your performance on previous chapters? (1 = I did way worse on this chapter,
5 = I did much better on this chapter)
1 2 3 4 5
8. Did you feel that the approach we took to learning area was beneficial to your
understanding? (1 = no, not at all, 5 = yes, there is no better way)
1 2 3 4 5

93
9. Why did you feel that the way this chapter was taught was helpful or not helpful?
10. What was the most interesting thing you learned during this chapter?
11. If you were an educator, how would you change the way that lessons are taught?
12. Why?
13. Define area in your own words.
14. Define perimeter in your own words.

94
APPENDIX D
Project Schematic

95
46
6"
55
"
52
"
82
"
12
2"
7"
39
9"
Fig
ure
is d
raw
n to
sca
le
Ra
diu
s o
f the
sch
oo
l at th
e th
ird flo
or =
87
0 in
33
2"

96
52
3"
88
"
58
"
51
"
40
"7
"
25
7"
91
"
15
6"
43
3"
Fig
ure
is d
raw
n to
sca
le
Ra
diu
s o
f the
sch
oo
l at th
e th
ird flo
or =
87
0 in

97
43
7"
Fig
ure
is d
raw
n to
sca
le
Ra
diu
s o
f the
sch
oo
l at th
e th
ird flo
or =
87
0 in
30
7"
10
1"
48
"
53
"
44
1"

98
APPENDIX E
Item Analysis

99
Table E1: Pre-Test Item Analysis
Control Group
n = 33
Experimental
Group n =19
Item mean standard
deviation
mean standard
deviation
p-value
1a. 0.848 0.364 0.947 0.229 0.292
1b 0.818 0.391 0.737 0.452 0.499
2a. 0.152 0.364 0.211 0.419 0.597
2b. 0.212 0.415 0.263 0.452 0.681
3a. 0.242 0.435 0.368 0.496 0.344
3b. 0.727 0.452 0.895 0.315 0.161
3c. 0.758 0.435 0.895 0.315 0.235
3d. 0.545 0.506 0.789 0.419 0.081
3e. 0.545 0.506 0.684 0.478 0.336
3f. 0.030 0.174 0.211 0.419 0.034*
4a. 0.515 0.508 0.737 0.452 0.121
4b. 0.485 0.508 0.526 0.513 0.779
4c. 0.061 0.242 0.158 0.375 0.260
4d. 0.303 0.467 0.474 0.513 0.226
4e. 0.182 0.392 0.158 0.375 0.830
4f. 0.030 0.174 0.053 0.229 0.694
4g. 0.242 0.435 0.158 0.375 0.482
* Statistically significant at the p=0.05 level

100
Table E2: Post-Test Item Analysis
Control Group
n = 31
Experimental
Group n= 17
n = 17
Item mean standard
deviation
mean standard
deviation
p-value
1a 0.645 0.486 0.941 0.243 0.02*
1b 0.452 0.506 0.706 0.470 0.095
1c 0.484 0.508 0.882 0.332 0.006**
1d 0.742 0.445 0.824 0.393 0.530
1e 0.323 0.475 0.647 0.493 0.030*
1f 0.097 0.301 0.412 0.507 0.009**
1g 0.387 0.495 0.706 0.470 0.035*
1h 0.161 0.374 0.118 0.332 0.670
1i 0.129 0.341 0.353 0.493 0.070
1j 0.065 0.250 0.235 0.437 0.090
2a 0.323 0.475 0.706 0.470 0.010*
2b 0.226 0.425 0.353 0.493 0.354
2c 0.290 0.461 0.471 0.514 0.220
3a 0.452 0.506 0.588 0.507 0.376
3b 0.387 0.495 0.412 0.507 0.871
3c 0.226 0.425 0.471 0.514 0.083
3d 0.355 0.486 0.471 0.514 0.444
4 0.226 0.425 0.294 0.470 0.610
5 0.387 0.495 0.412 0.507 0.870
6 0.226 0.425 0.235 0.437 0.942
7 0.097 0.301 0.059 0.243 0.657
* Statistically significant at the p=0.05 level
**Statistically significant at the p=0.01 level

101
Table E3: Retention Quiz Item Analysis
* Statistically significant at the p=0.05 level
**Statistically significant at the p=0.01 level
Control Group
n = 30
Experimental
Group n = 18
Item mean standard
deviation
mean standard
deviation
p-value
1 0.400 0.498 0.722 0.461 0.031*
2 0.900 0.305 0.833 0.383 0.509
3 0.633 0.491 0.667 0.485 0.820
4 0.567 0.504 0.722 0.461 0.291
5 0.267 0.449 0.500 0.514 0.106
6 0.433 0.504 0.611 0.502 0.242
7 0.367 0.490 0.833 0.383 0.001**
8 0.133 0.346 0.389 0.502 0.042*