Embed Size (px)
Citation preview
1
*Preliminary Draft, Please do not cite without authors' permission
The institutional and political roots of the electoral rise of the
Euroskeptic parties
Stefano Camatarri ([email protected])
Francesco Zucchini ([email protected])
DEPARTMENT OF SOCIAL AND POLITICAL SCIENCES
Università degli Studi di Milano
Abstract
The last European elections were characterized by a growth in many countries of the percentage of
votes in favor of Euroskeptic parties. However this growth has not been uniform. While for example
the Euroskeptic parties have obtained 30.9% of votes in Italy and 34.4% in the Netherlands, in
Germany they have not exceeded 8% and they were essentially absent in Spain (De Sio et al. 2014).
The macroeconomic conditions have probably played a key role in increasing the dissatisfaction of a
part of the European electorate towards pro-European Union national governments (Kriesi and
Fernandez 2013; Pirro and Kessel 2013). Nevertheless the growth of euroskepticism concerned
countries with very different macroeconomic performance (e.g. UK and Greece) and it was very
modest or absent in countries with high levels of unemployment and low economic growth (e.g. Spain).
In sum on one side the great variance among European countries suggest the importance of the national
contexts in explaining the success of EUSK parties; on the other side national economic conditions do
not seem to be a very promising explanatory factor.
In this paper we investigate about the role played by a country specific factor different from the
economic performance, the heterogeneity of government coalitions in the policy space (Tsebelis 2002).
We argue that in countries characterized by heterogeneous governments in the last years before EP
elections, above all along the pro-anti EU dimension, citizens were more likely to vote for Euroskeptic
parties. We hypothesize also that the interaction between some individual features and the
heterogeneity of the government play an important role in the explanation. We take advantage of the
2014 EES Voter Study and of EuanDI data set to test our hypotheses that are largely confirmed by
several statistical models. An attempt to apply the same models to the abstention shows that at least
during the last EP elections motivations for euroskeptical vote and abstention are quite different.
Introduction
Last European elections have been characterized by an increase of votes for anti-establishment parties,
that are also very critical with European institutions and European policies. At first glance such a
phenomenon does not look like very surprising. The recent economic and financial crisis has severely
affected a considerable part of the European population. The European institutions and many national

2
governments did not seem able to counter unemployment and loss of income. Therefore large sectors of
the electorate could have punished the traditional pro-Europe parties that have been very often also
government parties during the crisis years and just before the EP elections. However a closer
investigation reveals that the country economic performances are not so clearly associated with the
success of the so called euroskeptic parties (from now on EUSK parties). In other terms if the success
of EUSK parties during the last European elections is hardly undeniable, nevertheless in some
countries that experienced a relatively good economic performance these political forces won a very
high percentage of votes (for instance Denmark and Netherlands), while, on the contrary in other
countries that were substantially put under the tutelage of the European institutions and IFM for their
financial and economic conditions, the same type of parties was less successful or even almost a
marginal phenomenon (for instance Portugal and Spain). In Fig.1a and 1b you can contrast the electoral
performance (percent of votes) of EUSK party in each EU country during last EP elections (blue, in
ascending order) according to Maggini, Emanuele and Marino (2014), with the variation of the
employment rate and the median net equivalized income1 between 2009 and 2013. There is no
plausible association.
Fig.1
In sum on one side the great variance among European countries suggest the importance of the national
contexts in explaining the success of EUSK parties; on the other side national economic conditions do
not seem to be a very promising explanatory factor.
1 For a definition see below and at http://ec.europa.eu/eurostat/statistics
explained/index.php/Glossary:Equivalised_disposable_income

3
In this paper we investigate about the role played by a country specific factor different from the
economic performance. We investigate about the role of the heterogeneity of government coalitions in
the policy space. As a scientific investigation about the factors that encouraged a certain political
behavior ( i.e. the vote for euroskeptic parties) must be conducted at individual level in order to prevent
ecological fallacies , we take advantage of the 2014 EES Voter Study. This research consists of a EU
wide survey which was carried jointly with the post-electoral survey commissioned by the European
Parliament (EP). This large data set has been integrated by information about politics and economy of
each European countries during the crisis period (2009-2014, see below). We argue that in countries
characterized by heterogeneous governments in the last years before EP elections, above all along the
pro-anti EU dimension, citizens have been more likely to vote for EUSK parties. We also hypothesize
that the effect of some individual features on the propensity to vote for EUSK parties is in fact
conditioned by the government political heterogeneity. In other terms, our second class of hypotheses is
that the respondents’ subjective perception of personal socio-economic status, self location on left-right
and on pro-anti EU dimensions increasingly affect the probability to vote for EUSK parties more the
government is heterogeneous along the pro-anti EU dimension. And on the other side we hypothesize
that the “positive” effect of an increase of government heterogeneity on the probability to vote for
EUSK party is strengthened when the voter thinks to be at the bottom of the social ladder, places
him/her self on the extreme left of the left –right continuum or he/she refuses any placement and when
he/she reveals non positive attitude towards EU integration. In addition to this, we will also check the
effects of all these possible causal factors on a further dependent variable: non-voting. In fact, as some
previous studies argued, abstainers at the EP elections could be somehow characterized by a “creeping”
Euroskepticism (Hobolt at al. 2008). Our models will try to evaluate such a potential similarity.
In the next section we try to sketch a theoretical account to explain why and how government political
heterogeneity should affect electoral behavior. In the third section we will present the data and the
statistical analysis used to test our hypotheses. In the fourth section we will analyze abstention. Final
section will be dedicated to a discussion of the main results.
A theoretical account
According to a standard issue voting model the voter would compare the party platforms and he/she
would vote for the party that proposes the platform closest to his/her ideal point. Such a naïve and
pretty rough way to represent the not so simple act of voting assumes that all parties are evaluated for

4
their promises and previous government achievements do not matter. In other words the status quo
policy as well as the feasible policy change would not be taken in consideration by the citizens when
they vote.
The limits and lack of realism of this description has been noticed for quite long time. According to
Grofman (1985) a voter could prefer a party that does not have the closest platform to his/her ideal
point if the promised change of the status quo is in the right direction for the voter. The obstacles that
this party will face in implementing its platform are the fundamental ingredient that allows to
seemingly violate the downsian criterion of proximity. If, because of these obstacles, the expected new
status quo does not correspond to the party’s platform but to somehow a more moderate version of this
platform, then the voter could rationally vote for this party instead of voting for another party that
proposes a platform closer to his/her ideal point but on the opposite side with respect to the status quo.
Grofman did not specify the nature of these obstacles but it is not difficult to imagine as obstacles to a
full implementation of party platforms the divided government in US political system and the coalition
governments in European democracies. More recently Kedar (2005) in a similar vein has argued (and
empirically tested) that precisely in countries where policy is often the result of institutionalized
multiparty bargaining , votes are watered down by power sharing. Therefore voters would often
compensate for this watering down by supporting parties whose positions differ from their own and are
more extremist, insofar these parties pull policy in a desired direction. Both scholars hypothesize that
citizens vote to achieve outcomes. While according to Grofman opposition and extremist parties are
made (paradoxically) attractive also for voters who are ideologically closer to the incumbent party by
obstacles that prevent them to fully implement their extremist platform, according to Kedar the same
parties are made attractive, insofar as they pull policy in the desired direction, by obstacles that prevent
an incumbent (government) party to fully keep its electoral promises. Moreover, Kedar specifies the
institutional and political nature of the obstacles. Differently from majoritarian democracies, in the
consensual political systems a winning party has to compromise with other political forces to form a
government and to pass important legislation in parliament. The voter is conscious about the real
working of this type of political systems and will compensate the too moderate effect of a “sincere”
voting by choosing more extremist parties even when he/she is not at all an extremist. Kedar
explanation (and implicitly also the Grofman model) considers the compromise that attenuates the
importance of the policy change as the main effect of a power sharing political system that the voters
perceive. Voters would vote for extremist parties in order to compensate this prospective outcome and
to shift the content of this compromise as near as possible to their ideal point (that is not necessarily

5
very close to extremist party platform). However a such expectation takes the risk to be is misplaced.
Kedar presumes that voters are “prospective” but the theory that they are supposed to adopt in order to
anticipate the policy effect of their vote is wrong. The “compensational mechanism” implies a
description of decision making process of the parliamentary democracies questionable and not very
attuned with the recent and established spatial theories of law making (Cox & McCubbins 2005,
Tsebelis 2002). Unless the vote for extreme party creates the condition for a complete change of
government majority, the increase of consensus for an extremist party does not generate a (relatively)
more radical change and in some circumstances increases the policy stability. In fact power sharing
systems are mostly characterized by gridlock and high level of policy stability. A spatial representation
can help to illustrate why the compensational mechanism is bound to fail according to spatial theories
of law making
Fig.2
Imagine that in a country ( fig.1) at time t0, just before new elections the government is formed by
party L and party R. SQ is the position of the status quo and EL is a leftist opposition party.
Government can enjoy a strong or a weak positive agenda setting power. It has always a gatekeeping
power. Each government party is a veto player and can prevent an unpleasant change. At time t1
elections take place and voter V has to decide which party to vote. If he/she votes for L , the closest
party, then he/she expects that median voter in parliament will be M. If the government agenda setting
power is strong and L and R after the elections form again the new government then SQ will be
changed and the final outcome will be on the line that connect R and M ( as for construction M=SQ-R).
On this line there are all alternatives that are considered by both R and L better than SQ. The precise
point will depend of the relatively strength of the R versus L. If, on the contrary government does not
have strong positive agenda setting power then the final outcome will correspond always to M, namely
the parliamentary median voter’s ideal point. According to the compensational mechanism V could take
in consideration the possibility to vote EL in order to shift the parliamentary median voter’s ideal point
and to win the most preferred policy. However now, if for instance V is the new median voter, L and R
are still the two government parties and government does not enjoy a strong agenda setting power then
SQ will be preserved as the ideal point of V will be much worse for R. However for L SQ is much

6
worse than M , the outcome that he/she expect to receive if he/she voted L . If the government enjoys a
strong agenda setting power then the outcome will be the same outcome of the previous scenario. In
short, the compensational mechanism does not compensate anything ( if we assume strong positive
agenda setting power) or produces an even worse result (if we assume weak positive agenda setting
power) .
We do agree with Kedar that the nature of political system affects the voting behavior. However we do
not think that voters consider consciously the institutional features of their democracy when they vote
in order to figure out the next possible policy outcomes. And if they did it then the compensational
mechanism would be counterproductive. On the contrary we assume that voters evaluate
retrospectively the policy outcomes of the incumbent parties as they were their real electoral platforms
and compare them with the platforms of the opposition parties. We think that these assumptions are
plausible in general and even more plausible when you study the EP elections, given their nature of
second order elections (Hix and Holland 2013) .
Differently from Kedar we do not consider the Lijphart’s type of democracy (consensual versus
majoritarian) where the citizens live as the political country factor that affects the individual voting
decisions. In tune with the main spatial theories of law making we consider the effect of the “spatial”
heterogeneity of the government coalition before the elections. As we have already said we assume, by
following veto players theory (Tsebelis 2002), that if a change of status quo decreases the policy utility
of one government party then this change will be precluded. Therefore when the heterogeneity is high
then there are more status quo policies that cannot be changed (or that can be only marginally
changed). Such a circumstance makes much less credible the electoral promises of the government
parties that are farer from the present status quo policies and encourages voters that otherwise would
have voted for them to choose the opposition extremist parties . A spatial illustration can clarify the
causal mechanism we have in mind.
Imagine that at time t0 a new government is formed. Given the status quo SQ the government at time t1
will decide about the change (or preservation) of SQ. At time t2 the voter V has to vote. In the political
system there are three parties. A rightist party R, a leftist party L and an extreme leftist party EL. L is
the party closest to V and V is moderately leftist. There are three possible scenarios (a, b, c):
a) at time t0 the government is a one party government. At time t1 SQ will be changed. The new status
quo will correspond to the ideal point of the government party. Regardless of which party is in
government (L or R) V at time t2 will vote always for L.
b) at time t0 L and R form an new government. At time t1 the change of SQ is bargained between L and

7
R. V will attribute to L as real platform the outcome of this bargaining. Therefore if the new status quo
is closer to V than the EL’s proposal V will still vote for L, otherwise he/she will vote for EL.
c) at time t0 L and R form a new government. R is more distant from L than in scenario b and the
government is more heterogeneous. At time t1 SQ will be preserved as now any change of SQ is for at
least one government party Pareto inferior. At time t2 V will vote for EL as SQ is much farer than EL
platform.
Fig.3
The three scenarios indicate quite well that any increase of government “heterogeneity” increases also
the propensity of some voters to vote for extremist parties. On one side a growth in government
heterogeneity increases also voter’s radicalization in the voting choice as far as the voter is sufficiently
far from the status quo. On the other side the voter’s perception of the status quo as increasingly far
from his/her ideal point and/or the voter’s political radicalization have different chances to be translated
in an extremist vote according to different level of government heterogeneity. If the voter’s ideal point
shift to L position , voter won’t change his electoral choice in scenario a but he/she will vote for EL in
the scenarios b and c .
We believe that this very simple model can be directly applied to explain the various performances of
EUSK parties during the last European elections. The implications of our model can be summarized in
the three following hypotheses:
8
1) Government heterogeneity in the dimension “EU Integration” affects positively the probability
that voters vote for Euroskeptic parties.
2) An increase of government heterogeneity has a larger and significant effect on the EUSK vote
more the voter is extremist and more he/she dislikes the present status quo.
3) An increase in political (and social) radicalization of voters is more likely to be translated in an
increase of probability to vote EUSK parties when the heterogeneity of governments is high.
Data
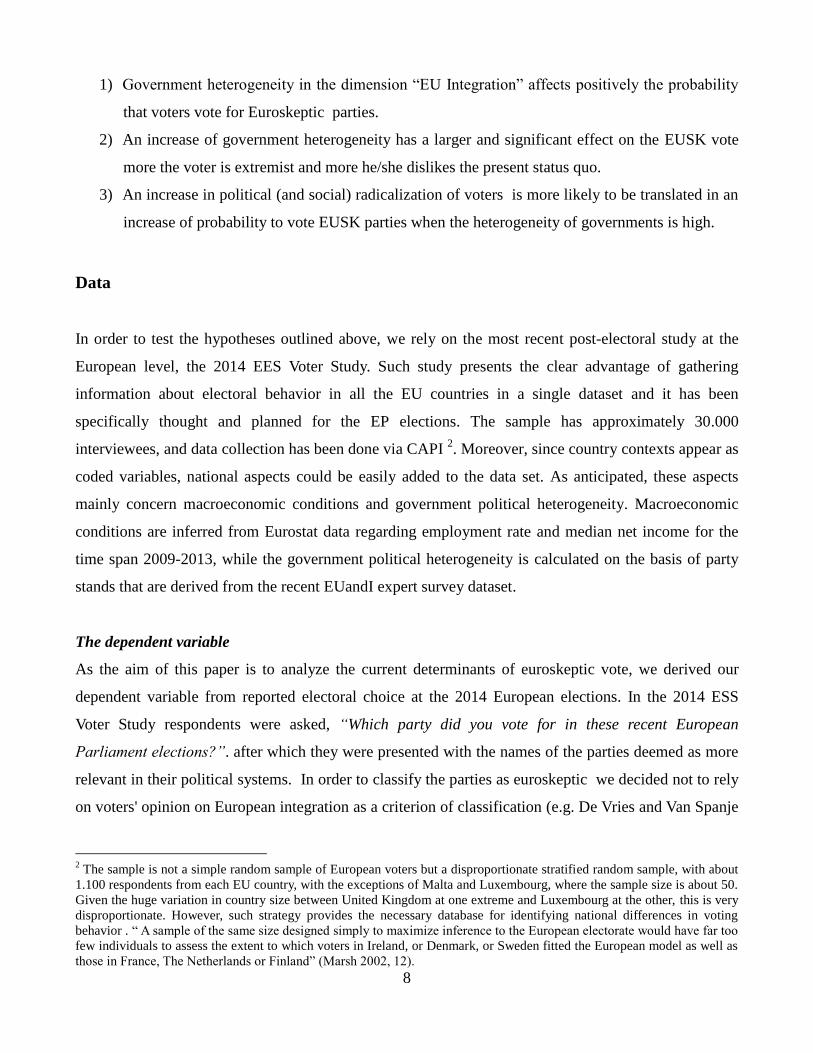
In order to test the hypotheses outlined above, we rely on the most recent post-electoral study at the
European level, the 2014 EES Voter Study. Such study presents the clear advantage of gathering
information about electoral behavior in all the EU countries in a single dataset and it has been
specifically thought and planned for the EP elections. The sample has approximately 30.000
interviewees, and data collection has been done via CAPI 2. Moreover, since country contexts appear as
coded variables, national aspects could be easily added to the data set. As anticipated, these aspects
mainly concern macroeconomic conditions and government political heterogeneity. Macroeconomic
conditions are inferred from Eurostat data regarding employment rate and median net income for the
time span 2009-2013, while the government political heterogeneity is calculated on the basis of party
stands that are derived from the recent EUandI expert survey dataset.
The dependent variable
As the aim of this paper is to analyze the current determinants of euroskeptic vote, we derived our
dependent variable from reported electoral choice at the 2014 European elections. In the 2014 ESS
Voter Study respondents were asked, “Which party did you vote for in these recent European
Parliament elections?”. after which they were presented with the names of the parties deemed as more
relevant in their political systems. In order to classify the parties as euroskeptic we decided not to rely
on voters' opinion on European integration as a criterion of classification (e.g. De Vries and Van Spanje
2 The sample is not a simple random sample of European voters but a disproportionate stratified random sample, with about
1.100 respondents from each EU country, with the exceptions of Malta and Luxembourg, where the sample size is about 50.
Given the huge variation in country size between United Kingdom at one extreme and Luxembourg at the other, this is very
disproportionate. However, such strategy provides the necessary database for identifying national differences in voting
behavior . “ A sample of the same size designed simply to maximize inference to the European electorate would have far too
few individuals to assess the extent to which voters in Ireland, or Denmark, or Sweden fitted the European model as well as
those in France, The Netherlands or Finland” (Marsh 2002, 12).

9
2011), but rather to look at expert judgments. Precisely, we drew inspiration from the categorization by
Maggini, Emanuele and Marino (2014), who stated the euroskeptic nature of 63 parties from 23
European countries starting from the score they obtained on issues related to European integration and
– when available – on the attitudes toward the Euro according to four well-known expert survey
datasets: Benoit and Laver (2006), Chapel Hill (2010), ParlGov (2012) and EUandI (2014).3
Differently from them we referred only to EUandI, the most recent expert survey, as we were interested
to capture also the nature of completely new parties. This provides, in fact, party-positions on 28
Europe-wide issues measured in Likert scales, covering a very large proportion of current policies and
political attitudes in the 28 EU member states.4 Since some of these statements strictly concern
European integration in the format of traditional survey questions such as “European integration is a
good thing”, we could easily try to categorize each party according to its level of agreement on them.
Again following Emanuele, Maggini and Marino (2014), we distinguished between Euro countries and
non Euro countries. Indeed, for parties that belong to Euro countries Euro currency has been the most
important issue to understand their Europhile/Euroskeptic position while for parties that belong to non
Euro countries the crucial question that we have considered was about the European integration. We
assessed party euroskepticism in different ways because while inside the Eurozone a possible exit
strategy from the Euro is perceived as a salient and divisive issue, outside the Eurozone the single
currency would find a widespread opposition by any party. Therefore in Euro countries parties with an
high level of agreement with the sentence “The european single currency is a bad thing” were classified
as euroskeptic as well as , in non Euro countries, parties with a low level of agreement with the
sentence “European integration is a good thing. (i.e. assuming a value higher or lower than the
midpoint of their Likert scales).
Such an operational choice clearly has an impact on the kind of euroskepticism we are going to focus
on. Scholars are used to distinguish between hard and soft euroskepticism. While soft Euroskepticism is
referred to a contingent objection to the EU's current or future planned trajectory and policies, hard
euroskepticism might be defined as a principled opposition to the pillars of the european project
(Szczerbiak and Taggart 2003). Party positions on Euro and, more in general on European integration
help us to identify parties that are “hard” euroskeptic . We do not deny the variety of issues,
motivations and ideological positions that characterizes current euroskeptic parties (e.g. Trieb 2014).
3 To be precise, each of these data sources provides measurements basing on specific response scales. Respectively, we
Benoit and Laver (2006) rely on 0-20 scales, Chapel Hill (2010) on 1-7, 0-10, ParlGov (2012) on 0-10 and finally the
EUandI dataset on 1-5.
4 These 28 Europe-wide statements were developed by the scientific coordinators of EUandI and have been extensively
discussed by numerous experts in the field in order to make them as precise, clear and meaningful as possible.

10
Nevertheless, we believe that focusing only on parties that explicitly refuse European integration fit
very well with our hypotheses. After all the support for these parties can be easily interpreted as a
evidence of voters’ radicalization.
Since defecting EP elections has been sometimes associated to euroskepticism (Hobolt et al. 2009), we
included the related question in our analyses as source for a further dependent variable. In the 2014
ESS Voter Study respondents have been asked,“[…] Did you yourself vote in the recent European
Parliament elections?”. We will contrast the respondents who filled the “I did not vote” answer with all
those that voted for non EUSK parties. Indeed, as we are interested in comparing abstentionism and
euroskeptic voting we have to contrast them with the same alternative type of behavior (vote for EUSK
parties)
Independent and control variables
As we argued in the theoretical section, the main independent variable is the government ideological
heterogeneity. In tune with the spatial theory of voting our measure of heterogeneity is “spatial”. We
considered the party positions of European parties on a series of policy issues according to the Euandi
expert survey. (http://www.eui.eu/Projects/EUDO/euandi/Index.aspx) In order to infer the main
dimensions of the European electoral competitions and to locate the parties on these dimensions, we
performed a polychoric principal component analysis involving all the 28 statements provided by the
EUandI dataset, then extracting two common factors5.
Several scholars have argued about (at least) a two-dimensionality of EU politics over the last decade,
referring on one side to Left – Right ideology, and to European integration on the other (e.g. Hix and
Lord 1997; Marks and Hooghe 2001). Such expectation is confirmed by the results of our factor
analysis. As a matter of fact, the first two extracted factors explain alone about 55% of the total
variance of the variables involved in the analysis. Moreover, these factors seem to represent relatively
well respectively the Left-Right and the European integration dimension. In particular, while the first
one, D1, is correlated with EUandI’s variables concerning economic and social Left-Right and ethical
issues, the second one, D2, is associated with attitudes toward the EU and immigration. On each
5 The use of polychoric correlations is justified by the fact that the variables under analysis consist in ordinally scaled items
(i.e. 0 = strongly disagree, 1= rather disagree 3 = neither agree nor disagree, 4 = rather agree 5 = strongly agree). In truth,
standard factor analysis is often performed also in the presence of ordinal indicators, such as Likert scales. In this cases, the
scores assigned to the ratings are simply treated as if they were continuous. However, this is unsatisfactory as predicted
values for the observed scores can never be exact integers, whereas the scores assigned to the ratings are exact integers
(McDonald, 1999). The introduction of poliychoric correlations help us in dealing with such problem, since they estimate
the linear relationship between two unobserved continuous variables simply starting from observed ordinal data (Flora and
Curran 2004).

11
dimension each party gets a factor score, summarizing its overall position on the whole dimension. In
order to estimate government ideological heterogeneity, we explicitly focused on the scores of those
parties who have been part of a government coalition between (September) 2008 and (April) 2014 in
their country, namely from the official beginning of the financial and economic crisis and the EP
elections. In a first stage, for each dimension, we measured ideological heterogeneity of each
government in each country as the distance among the two parties with the highest and the lowest
factor score in a government coalition. Indeed, the other government parties have been considered as
“absorbed”, since they were located inside the core of the most “extreme” ones (Tsebelis 2002). For
each dimension and each country we consider government coalition ranges as many as the governments
that were in office during the selected period. Then in order to get an overall measure of “spatial”
heterogeneity over time, we calculated the weight in days of each government and computed the
country average coalition range from 2008 to 2014 both in D1 and in D2. The two variables are called
government rangeD1 and government range D2. Not too surprisingly, according to our regression
analyses (see below), the government heterogeneity on dimension D2, namely the dimension most
connected to European integration and immigration, has by far the largest explanatory power.
Therefore we decide to consider only the heterogeneity in this dimension.
The rest of the variables that a priori we suspect to have an explanatory role can be divided into socio-
economic individual variables, political individual variables and contextual (or country) variables.
Among the contextual variables two measures relate respectively to the median equivalised net income
and to the rate of employment. The first measure indicates the median income of an household after the
taxes and after having considered the household composition (in terms of household members’ age)6.
These measures summarize the country economic performances and are politically sensitive indicators.
Both economic measures are considered as absolute value during the year before the election (Median
Net Income 2013 and Employment Rate 2013) and as variation from the beginning of economic crisis
and the year before the EP election (Delta Net Income and Delta Employment Rate). The other country
variable is a dummy variable called “post communist” that is equal to one when the country was in the
past a communist country. As a matter of fact, post-communist environments have been often
associated to limited electoral experiences and low participation (e.g. Schmitt 2004). Since also non-
voting could be interpreted as an alternative way to signal Euroskepticism (Hobolt et al. 2008, see
below), then we expect that in these countries the probability to vote for Euroskeptical parties is low as
the same distaste toward EU is often communicated by the abstention.
6 Using median, rather than mean income, results in a much more accurate picture of the average income of the middle class
since the data will not be skewed by gains and abnormalities in the extreme ends. Median household income is a

12
The individual socio- economic variables can be classified in sociotropic evaluations, egotistical
(pocketbook) evaluations, cognitive features and “objective” socio-demogrphic conditions. As
sociotropic evaluations we have considered predictors concerning retrospective and prospective
economic perceptions. The retrospective question wording is “What do you think about the economy?
Compared to 12 months ago, do you think that the general economic situation in our country is a lot
better, a little better, has stayed the same, a little worse, a lot worse”, while the prospective one reads:
“And over the next 12 months, how do you think the general economic situation in our country will be?
Will it get a lot better, a little better, stay the same, get a little worse or get a lot worse?”. Possible
answers to both questions are ranked in a five-level Likert scale. As egotistical perceptions we
considered the evaluation about the personal income and the social position. The first variable
(Decrease in income) corresponds to the answer (yes or no) to the question “Did you or someone in
your household experience a decrease in income in the last two years ?”, while the second variable
(Social Status) regards individual self-placement on the social ladder, measured on a scale from 1 to 10,
where 1 means ‘the lowest level in society’ and 10 means ‘the highest level in society’.
Several studies found that the level of interest in politics and the level of information affect the voting
choice (e.g. Hobolt, Spoon and Tilley 2008). Therefore we consider as “cognitive” variables a dummy
measure of political information (Political information) that is equal to 1 when the respondent follows
the news at least once a week ( on internet or on TV or in the newspapers), a measure of education
that is equal to 1 when the respondent continued to study after the age of 15 (Education), and a measure
of political interest (Political Interest) that is equal to 1 when the respondent is at least moderately
interested in politics. As socio-demographic variables we take in consideration age, gender , place of
residence and occupational condition. The latter is a dummy variable that is equal to one when the
respondent is a unemployed, manual worker or housekeeper. The place of residence is classified as
“Rural area or village, Small or middle sized town, Large town.
Last but not least we have considered also as very powerful and direct predictors of the vote behavior
some long-standing predispositions to support political parties of different leanings. With reference to
political attitude toward European Union (Attitude toward EU) we focus on the “utilitarian”
dimension of the concept (e.g. Lubbers and Scheepers 2005, 2010). In the 2014 EES questionnaire it is
well represented by the following question:“Generally speaking, do you think that our country’s
membership of the EU is a good thing, a bad thing or neither a good thing nor a bad thing?”.Our
respondent has been considered negatively (or non positively) oriented towards European Union when
he/she does not answer that EU is a good thing. The other variable , Ideology, is the answer to the

13
following questions: “In political matters people talk of “the left” and “the right”. What is your
position? Please use a scale from 0 to 10, where’ 0’ means ‘left’ and ‘10’ means ‘right’. Which number
best describes your position?”. In our analyses this variable has been dichotomized, so to clearly
contrast leftist voters ( respondents who locate themselves between 1 and 3) and voters who refuse to
locate themselves on left-right dimension. - with all other voters. This dummy variable (Left & not
located) has been suggested by a very similar voting behavior of this two seemingly very different
classes of voters.
Empirical analysis
The nature of data we analyze implies that individual observations are not completely independent
from each other, as they are nested into a superior level, the country, to which each respondent belongs.
This inclusion could lead to residuals that are not independent within the same country. If we used
ordinary regressions then the standard errors and the significance of coefficients would be respectively
under and overestimated. In order to make our analyses reliable, we applied multi-level logistic
regression analysis to EES data.
We present two classes of regression models. In the first one we consider all socio-economic individual
variables and country variables. The second class of models includes also the political individual
variables. The country economic variables are taken in consideration alternatively to avoid
collinearity7. The government heterogeneity is considered as the government coalition range in one
dimension (the second dimension, pro-anti EU integration)8.
1) Models without political individual variables
The first two models allow to compare the performance of Lijphart first dimension of consensualism
(Lijphart 2012) with the government spatial heterogeneity when we consider as economic country
variable the rate of employment. As Ljiphart did not classify post-communist countries and Cyprus,
these countries are excluded also from our data set. The other two models include the full data set,
alternatively both measures of country economic performance, and the dummy variable Post
7 As all models fit slightly better by considering the employment rate instead of the median equivalised net income without
any substantial difference in the other variable coefficients ,we did not show models with interaction terms that include
median equivalised net income. They are available on request. 8 We considered also the average of the ranges on both dimensions ( Pro-Anti EU and Left-right) as operationalization of the
government heterogeneity . Almost always the hypothesized causal connections are confirmed even if with lower level of
statistical significance.

14
Communist. Our first hypothesis seems to be not disconfirmed. Differently from the Ljiphart first
dimension of consensualism, the effect of government heterogeneity is always significant and in the
predicted direction. When the average heterogeneity in terms spatial distance between the two most
extreme government parties increase also the propensity to vote EUSK parties increases. Moreover this
effect is also pretty strong.
Tab 1: The determinants of voting for Euroskeptic parties: random-effects logistic regressions
EMPGOVH EMPLJPH EMP INC EMPint.
Coef se coef Se coef se coef Se Coef se
Individual variables
Gender (female = 1) (d10) -0.366*** 0.065 -0.365*** 0.065 -0.400*** 0.059 -0.400*** 0.059 -0.403*** 0.059
Age (d11)
-0.011*** 0.002 -0.011*** 0.002 -0.011*** 0.002 -0.011*** 0.002 -0.011*** 0.002
2.Place of residence (Small
or middle sized town=1) 0.052 0.081 0.052 0.081 0.058 0.073 0.058 0.073 0.057 0.073
3.Place of residence (Large
town=1) 0.123 0.086 0.123 0.086 0.037 0.078 0.036 0.078 0.036 0.078
Decrease in income (Yes=1)
(qpp11)
0.135** 0.069 0.135** 0.069 0.146** 0.063 0.145** 0.063 0.145** 0.063
Occupational status
(Unemployed, manual
worker, housekeeper=1)
0.278*** 0.075 0.279*** 0.075 0.303*** 0.068 0.302*** 0.068 0.306*** 0.068
Retrospective economic
evaluation (1= Lot worse;
5= Lot better) (qpp15)
-0.241*** 0.044 -0.241*** 0.044 -0.221*** 0.040 -0.221*** 0.040 -0.220*** 0.040
Prospective economic
evaluation (1= Lot worse;
5= Lot better) (qpp16)
-0.235*** 0.045 -0.235*** 0.045 -0.249*** 0.041 -0.249*** 0.041 -0.250*** 0.041
Political Information
(at least once a week = 1)
0.007 0.070 0.008 0.070 -0.053 0.065 -0.052 0.065 -0.053 0.065
Political Interest
(at least moderately
interested = 1)
0.067 0.071 0.068 0.071 0.064 0.065 0.063 0.065 0.062 0.065
Social Status (0=low;
10=high) - (d61)
-0.076*** 0.023 -0.075*** 0.023 -0.089*** 0.021 - 0.089*** 0.021 -0.007 0.046
Education
(after age of 15 = 1) -0.116 0.095 -0.112 0.095 -0.014 0.089 -0.012 0.089 -0.021 0.089
Contextual variables
Post-communist country
(Yes=1)
- - - - -1.721** 0.743 -2.232* 1.179 -1.718** 0.748
Delta Employment Rate
(2009-2013)
-0.309** 0.120 -0.318** 0.131 -0.035 0.096 - - -0.035 0.097
Employment Rate (annual 0.156** 0.063 0.216*** 0.071 0.041 0.072 - - 0.041 0.072

15
Sources: EES Voter Study (2014), EUandI dataset (2014) and EUROSTAT data (2008-2013)
Note: Table entries are not standardized coefficients and standard errors from multilevel logistic regression models. Significant at
***p<0.01, **p<0.05, *p<0.1.
Coeteris paribus an increase of one unit of government heterogeneity implies on average an increase of
around 180% of the probability to vote for an EUSK party in EMP model. On the contrary, (in the
models that are applied to the whole data set) , country economic variables do not seem to play a
significant role. Much more important are the individual perceptions, both the sociotropic and
egotistical ones, about the economic trends. Cognitive variables are not ever significant while being
women decreases the probability to vote for an EUSK party by 33% . On the contrary being a manual
worker, a house keeper or unemployed increases the probability by 36% compared to any other type of
job.
According to our second hypothesis an increase of the government “spatial” heterogeneity has a larger
and significant effect on the “euroskeptic” vote more the voter is extremist and more he/she dislikes the
present status quo, while according to our third hypothesis an increase in extremism and dissatisfaction
with the present status quo is more “effective” in countries with an high government heterogeneity . In
the model EMPi we introduce the interaction between the perceived social status and the government
heterogeneity in order to test these hypotheses without resorting to (strictly speaking) political
variables. The new variable is significant and negative. Fig. 4 illustrate respectively (left panel) the
marginal effect of an increase of the government heterogeneity for different perceived positions of the
social status and (right panel) the marginal effect of an increase of the perceived social status on the
probability to vote for EUSK parties at different levels of government heterogeneity increases.
The government heterogeneity does not seem to have a sufficiently significant effect when the
respondent perceives him/her self as belonging to medium-high position in the society (fig.3) and on
the other side an improvement (worsening) of the perceived social status does not affect negatively
average 2013)
Government Range D2 1.071** 0.477 - - 1.042** 0.481 1.132** 0.450 1.322*** 0.505
Delta Net Income (2009-
2013)
- - - - - - 0.000 0.000 - -
Net Income (2013) - - - - - - -0.000 0.000 - -
LjiphartD1 - - -0.022 0.414 - - - - - -
Interactive terms
Social status X Government
Range D2
- - - - - - - - -0.054** 0.027
Constant -12.182*** 4.472 -
15.063*** 5.070 -3.893 4.840 -0.344 1.358 -4.321 4.872
Number of observations 8159 8159 12028 11759 12028
Log likelihood = -3188.3 -3190.710 -3888.750 -3.887.4 -3886.770

16
(positively) the probability to vote for a EUSK party when the government is very homogenous,
namely when the government range is below 1. Therefore both hypotheses seem to be confirmed when
we equate the dissatisfaction with the status quo with the perception of being in the bottom of the social
ladder.
Fig.4 Conditional Marginal Effects using Model EMPi
0
.05
.1.1
5.2
.25
Effe
cts
on P
red
icte
d M
ea
n, F
ixe
d P
ort
ion O
nly
1 2 3 4 5 6 7 8 9 10Lowest/highest level in society (self-placement) - (d61)
Average Marginal Effects of govrange2008D2_sum with 95% CIs
2) Models with political individual variables
The political attitudes of voters are very proximate to the voting behavior. Therefore we expect that
they are strongly correlated with the dependent variable and that the coefficients and statistical
significance of some other antecedent factors get weaker. Moreover the closeness of these long
standing factors with the electoral choice allows in our case to at least partially control for the potential
endogeneity of our statistical tests. One can hypothesize that if in a country there is a stable tradition of
euroskeptic vote then all parties, including government parties, try to locate themselves on position
relatively euroskeptic just to keep consensus. By doing it they somehow increase our measure of
government heterogeneity. Therefore we would find that citizens vote EUSK parties just because they
voted for and are favorably oriented toward EUSK parties. However when we introduce very strong
predictors of vote for EUSK parties then this type of endogeneity is at least partially controlled. In
other terms for instance if there was endogeneity, with the inclusion of the attitude towards EU
integration as control, the variable government heterogeneity should lose almost completely strength
and significance. Actually both an agnostic or hostile orientation towards the EU membership and
having a very leftist (or none) self-placement on the left-right continuum are always strong and
significant predictors of the euroskeptical vote. Answering that European Union is not a good thing for
your country increases the probability to vote for EUSK party by more than 250% with respect to
voters positively oriented toward EU. Citizens who are very leftists or not placed on left-right

17
continuum are 33% more likely to vote for a EUSK party than other voters. Nevertheless almost all
causal relationships we have already identified in the previous models are still significant and strong.
The government heterogeneity on the EU dimension is still a very important explanatory factor.
Coeteris paribus an increase of one unit of government heterogeneity implies an increase of probability
to vote for a EUSK by about 170% in all models without interaction terms (EMP and ICSD). However
the most intriguing aspect of this class of models is precisely the interaction between the individual
political attitudes and the government heterogeneity. According to the spatial theory we illustrated in
the second section we expect that the same change in the political attitudes is translated into different
electoral behaviors according to the level of government spatial heterogeneity (Hyp.3) and that an
increase in the government heterogeneity affects weakly and not significantly the propensity to vote for
EUSK parties when the voter does not have a “radical” attitude (namely when he/she rightist or
centrist) or when he/she is not agnostic or hostile to European Integration (Hyp.2). Both hypotheses are
fully confirmed when we consider as political attitude the self-placement on the continuum left-right.
Tab 2: The determinants of voting for Euroskeptic parties: random-effects logistic regressions
EMP INCD EUR LEFTNOTL
Coef se coef se coef se coef Se
Individual variables
Gender (female = 1) (d10)
-0.476*** 0.063 -0.476*** 0.063 -0.473*** 0.063 -0.486*** 0.063
Age (d11)
-0.011*** 0.002 -0.010*** 0.002 -0.011*** 0.002 -0.010*** 0.002
2.Place of residence
(Small or middle sized town=1)
0.062 0.077 0.062 0.077
0.061 0.077 0.071 0.077
3.Place of residence (Large town=1)
0.085 0.083 0.085 0.083 0.081 0.083 0.098 0.083
Decrease in income (Yes=1) (qpp11)
0.113* 0.066 0.112* 0.066 0.112* 0.066 0.107 0.067
Social Status (0=low; 10=high) (d61) -0.048** 0.022 -0.048** 0.022 -0.049** 0.022 -0.047** 0.022
Occupational status (Unemployed,
manual worker, housekeeper=1)
0.236*** 0.072 0.235*** 0.072
0.237*** 0.072 0.228*** 0.072
Retrospective economic evaluation
(1= Lot worse; 5= Lot better)(qpp15)
-0.174*** 0.043 -0.174*** 0.043 -0.177*** 0.043 -0.170*** 0.043
Prospective economic evaluation
(1= Lot worse; 5= Lot better)(qpp16)
-0.154*** 0.044 -0.153*** 0.044 -0.149*** 0.044 -0.162*** 0.044
Political Information
(at least once a week = 1)
-0.001 0.068 0.001 0.068 -0.004 0.068 0.003 0.068
Education (after age of 15 = 1)
0.147 0.096 0.148 0.096 0.152 0.096 0.153 0.096

18
Sources: EES Voter Study (2014), EUandI dataset (2014) and EUROSTAT data (2008-2013)
Note: Table entries are not standardized coefficients and standard errors from multilevel logistic regression models. Significant at
***p<0.01, **p<0.05, *p<0.1.
The positive effect of an increase of government heterogeneity on the vote for EUSK parties is not
significant when the voter is centrist or rightist (Fig. 5 Left panel). The change in political attitudes of
voters, from being centrist and rightist to being leftist or not self placed, is significantly and positively
connected with the vote for EUSK parties only when the government heterogeneity is higher than 1.3
(right panel).
Less clear cut are the results when we consider the attitude towards EU. The increase of government
heterogeneity affects always “significantly” the probability to vote for EUSK parties , irrespectively
from the existence of a non positive attitude toward EU integration, even if this effect is slightly
stronger when there is this attitude (Fig.6 left panel). Similarly the marginal effect of becoming
agnostic or negative oriented toward EU increases “significantly” almost always the probability to vote
for EUSK party even if this propensity is much higher when the government heterogeneity is high
(Fig.6 right panel).
Political Interest
(at least moderately interested = 1)
-0.034 0.069 -0.034 0.069 -0.040 0.069 -0.028 0.069
Left & Not Located (Yes = 1) 0.274*** 0.067 0.274*** 0.067 0.278*** 0.067 -0.356** 0.153
Attitude toward EU (negative = 1) 1.269*** 0.067 1.268*** 0.067 1.631*** 0.155 1.266*** 0.067
Contextual variables
Post-communist country (Yes=1) -1.702** 0.704 -2.172* 1.117 -1.697** 0.702 -1.684** 0.696
Delta Employment Rate (2009-2013) -0.033 0.093 - - -0.032 0.093 -0.044 0.093
Employment Rate (annual average
2013)
0.045 0.068 - - 0.046 0.068 0.048 0.068
Government Range D2 0.919** 0.453 1.018** 0.424 1.061** 0.455 0.765* 0.448
Net Income 2013
- - -0.000 0.000 - -
- -
Delta Net Income (2009-2013) - - 0.000 0.000 - - - -
Interactive terms
Attitude toward EU X Government
Range D2
- - - - -0.232*** 0.089 - -
Left & Not Located X Government
Range D2
- - - -
- - 0.410*** 0.089
Constant -5.383 4.612 -1.638 1.292 -5.643 4.606 -5.355 4.569
Number of observations 11.397 11.140 11.397 11.397
Log likelihood = -3.523.320 -3.522.020 -3.519.850 -3.512.530

19
Fig.5 Conditional Marginal Effects using Model LEFTNOTL 0
.05
.1.1
5.2
Effects
on P
red
icte
d M
ea
n, F
ixe
d P
ort
ion O
nly
0 1leftnotlocated
Average Marginal Effects of govrange2008D2_sum with 90% CIs
-.0
5
0
.05
.1.1
5
Effects
on P
red
icte
d M
ea
n, F
ixe
d P
ort
ion O
nly
0 .5 1 1.5 2 2.5govrange2008D2_sum
Average Marginal Effects of 1.leftnotlocated with 90% CIs
Fig.6 Conditional Marginal Effects using Model EUR
0
.05
.1.1
5.2
Effects
on P
red
icte
d M
ea
n, F
ixe
d P
ort
ion O
nly
0 1nationeumembership1
Average Marginal Effects of govrange2008D2_sum with 90% CIs
0
.05
.1.1
5.2
.25
Effects
on P
red
icte
d M
ea
n, F
ixe
d P
ort
ion O
nly
0 .5 1 1.5 2 2.5govrange2008D2_sum
Average Marginal Effects of 1.nationeumembership1 with 90% CIs
3) Non-voting at the 2014 EP elections: “silent” euroskepticism or estrangement from politics?
In view of the evidences showed above, one might well ask whether abstention at the last EP elections
has been driven by - more or less - the same causal mechanisms underlying euroskeptic voting. In truth,
previous contributions already argued about a possible overlap in the motivations of these two
behaviors (e.g. Hobolt et. al. 2009). However, at the last 2014 EP elections things could have been
different. These were, in fact, the EU-wide political competition in which more voters than ever cast
their votes for political parties that advocated radical reforms of the EU or campaigned for an exit of
their countries from the EU political system in opposition to their mainstream competitors (Treib

20
2014).9 Within such context, a higher salience of EU related issues (e.g. Trechsel, De Sio and Garzia
2014) could have indeed mobilized most of inherently euroskeptic voters to cast their vote, thus
draining abstention of any political relevance. For this reason we hypothesize euroskeptic voters and
abstainers at the last EP elections to hold at least partially different motivational profiles. In order to
test this last hypothesis we estimated some further statistical models. The first one is aimed at
estimating the net effects of all the variables we have considered so far, while each of the other models
also tests one of the three cross-level interactions already included in the study of euroskeptic vote
choice. The main difference compared to the previous analysis stays in the dependent variable, which is
now aimed at contrasting those who did not vote to all citizens who expressed their preference for a
mainstream party in the EES survey context. As already mentioned, the choice of excluding those who
voted for an EUSK party is due to the nature of the object we want to focus on: not the causes of non-
voting at the last EP elections, but rather the causal mechanisms, i.e. the decision-making logic,
underlying the choice between, on the one side, mainstream parties and, on the other, abstention as an
alternative to euroskeptic party choice. What clearly emerges is the significant effect of some variables
which have not been found as relevant to euroskeptic behavior. I refer in particular to cognitive factors
as level of political information, education and political interest, which exert a negative impact on the
probability of preferring non-voting to support for mainstream parties.
Tab 3: Individual and Contextual effects on “non-voting” at the European elections of 2014 ALLNET INTERpartial INTERfull1 INTERFULL2
Coef se coef se coef se coef Se
Individual variables
Decrease in income (Yes=1) 0.013 0.034 0.017 0.032 0.014 0.035 0.013 0.035
Social status (0=low; 10=high) -0.097*** 0.012 -0.092*** 0.019 -0.097*** 0.012 -0.097*** 0.012
Retrospective economic
evaluation
(1= Lot worse; 5= Lot better)
-0.041* 0.022 -0.072*** 0.020 -0.039* 0.022 -0.042* 0.022
Prospective economic evaluation
(1= Lot worse; 5= Lot better)
-0.058** 0.021 -0.111*** 0.021 -0.058** 0.023 -0.059** 0.023
Occupational status ( Manual
worker, unemployed and
housekeeper =1)
0.157*** 0.037 0.179*** 0.034 0.158*** 0366 0.157*** 0.037
Political Information (at least
once a week = 1)
-0.387*** 0.038 -0.427*** 0.036 -0.385*** 0.038 -0.385*** 0.038
9
For a conceptual and analytic definition of mainstream parties, see Meguid (2005; 2008)

21
Education (prosecuted after age
of 15 = 1) -0.201*** 0.047 -0.227*** 0.044 -0.204*** 0.048 -0.200*** 0.048
Political Interest
(at least moderately interested =
1)
0.945***
0.033
1.084***
0.031
0.944***
0.034
0.944***
0.034
Left & Not Located (Yes = 1) 0.018 0.036 - - 0.020 0.036 -0.077 0.063
Attitude toward EU (negative = 1) 0.651*** 0.034 - - 0.521*** 0.060 0.651*** 0.034
Gender (female = 1) -0.160*** 0.032 -0.111*** 0.031 -0.160*** 0.033 -0.161*** 0.033
Age -0.022*** 0.001 -0.022*** 0.000 -0.022*** 0.001 -0.022*** 0.001
2.Place of residence
(Small or middle sized town=1)
0.013 0.038 0.042 0.236 0.012 0.038 0.013 0.038
3.Place of residence (Large
town=1) 0.025 0.043 0.025 0.519 0.027 0.042 0.027 0.043
Contextual variables
Post-communist country (Yes=1) 1.831*** 0.048 1.750*** 0.487 1.830*** 0.478 1.828*** 0.480
Government Range D2 -0.070 0.193 0.113 0.209 -0.126 0.193 -0.096 0.193
Delta Net Income (2009-2013) -0.000*** .0.000 -0.001*** .0.000 -0.001*** 0.000 0.000*** 0.000
Net Income 2013 0.000*** 0.000 0.000*** 0.000 0.000*** 0.000 0.000*** 0.000
Interactive terms
Social status X Government
Range D2 - - -0.024* 0.013 - - - -
Attitude toward EU X
Government Range D2 - - - 0.112*** 0.042 - -
Dummy for ideology X
Government Range D2 - - - - - 0.087* 0.047
Constant -0.613 0.555 -0.029 0.568 -0.553* 0.554 -0.579 0.557
Number of observations 21857 24448 21857 21857
Log Likelihood -11775.313 -13387.536 -11771.82 -11773.594
Sources: EES Voter Study (2014), EUandI dataset (2014) and EUROSTAT data (2008-2013)
Note: Table entries are not standardized coefficients and standard errors from multilevel logistic regression models. Significant at
***p<0.01, **p<0.05, *p<0.1.
Of course, such tendency is accompanied also by further characteristics. For example, non-voting is
also linked to economic perceptions, and in particular to sociotropic prospective considerations, whose
unitary increase lowers on average the probability of abstention of about 6%. On the contrary, egoistic
considerations, such as having experienced a decrease in income during the last two years, appear as
not significant. In line then with the previous literature on this topic, both being female and older
people decreases the probability to abstain of respectively 15% and 3%. Also living in a post-
communist environment strongly favors non-voting, as we expected. Moreover, holding an agnostic or
negative attitude towards the EU membership of one’s own country increases the probability of
abstaining of about 92%. Especially considering this latter figure, one might well say that the causal
paths driving respectively to euroskeptic vote choice and to abstention are in all the same. And yet,

22
government political heterogeneity alone does not exert any significant effect in the second case. This
could be in truth the sign of an intrinsic diversity of non-voting at the last EP elections. However, a
similar conclusion cannot disregard the cross-level interactions we assessed in the other models. In fact
the coefficient of interactions terms are weaker than in the models we proposed to explain the vote for
EUSK parties. An investigation of the marginal effects on the dependent variable reveals pretty mixed
results.10
On one side, differently from the previous analysis, in no model an increase of the
government heterogeneity affects significantly the probability to abstain, whatever the perception of
social status, the attitude toward EU and the self placement on left-right continuum (Fig. 7, 8, 9, left
panels). On the other side an improvement in the perception of personal social status and the shift from
a positive to a negative or agnostic attitude towards EU integration have an increasing impact on the
probability of abstaining as the level of government political heterogeneity grows up (see Figure 9 and
10 , right panels).
Fig.7 Conditional Marginal Effects using Model INTERpartial
Fig.8 Conditional Marginal Effects using Model INTERfull1
10 For a guidance to the statistical interpretation of conditional hypotheses, see Brambor, Clark and Golder (2006)
-.1
-.05
0
.05
.1
Effe
cts
on P
redi
cted
Mea
n, F
ixed
Por
tion
Onl
y
1 2 3 4 5 6 7 8 9 10Lowest/highest social status (perception)
Average Marginal Effects of Government range D2 with 90% CIs
-.1-.0
5
0
.05
Effe
cts
on P
redi
cted
Mea
n, F
ixed
Por
tion
Onl
y
0 1Anti EU attitude
Average Marginal Effects of Government range D2 with 90% CIs

23
The difference between the lower and the higher conditional marginal effect in the two cases, namely
perception of social status and attitude towards EU is respectively 0,01 and 0,05. Although not large,
their magnitudes are stably significant. In addition, the shape assumed by such effects substantially
overlap those we obtained in the corresponding analysis of euroskeptic vote choice. Are all these
elements sufficient to argue that euroskeptic voters and abstainers rely on the same anti-EU background
at the last EP elections? A further analysis of Left-right orientations can help to answer this question.
Indeed, while having a leftist (or none) self-placement has been found to increase the probability of an
euroskeptic vote choice, in case of abstention we do not find any significant effect of that variable, both
as an individual predictor and as an interaction term (see Model INTERFULL2). A summary
concerning the analysis of the related conditional marginal effects at varying conditions of government
ideological heterogeneity can be found in Fig.9 left panel
Fig.9 Conditional Marginal Effects using INTERFULL2
-.1
-.0
5
0
.05
Effects
on P
red
icte
d M
ea
n, F
ixe
d P
ort
ion O
nly
0 1lef or not located
Average Marginal Effects of Government range D2 with 90% CIs
-.0
4-.
02
0
.02
.04
.06
Effect
s o
n P
red
icte
d M
ea
n, F
ixe
d P
ort
ion O
nly
0 .5 1 1.5 2 2.5
Government ideological heterogeneity
Average Marginal Effects of being leftist or not located with 95% CIs
In sum what in fact clearly emerges from the data is that abstention appears only very partly
characterized by similar motives to those preceding an euroskeptic vote choice. We mention, among
these, negative sociotropic perceptions, perceiving themselves at the bottom of the social ladder and a
certain amount of euroskepticism, presumably stemming from “agnosticism” towards (or perceived
distance of) EU institutions, rather than from a fully structured anti-EU attitude. Nevertheless, two
fundamental aspects make abstainers (at least during last EP elections) clearly distinguishable from
euroskeptic voters. The first is their massive cognitive disengagement, properly signaled by the fact
that non-voting is significantly associated with low levels of education, information and political
interest. The second is that, as just mentioned, the way they solve the dichotomy between "vote for

24
mainstream parties" and "abstention" does not imply any significant role for the traditional ideological
left-right continuum11
. Therefore our initial hypothesis seems to be confirmed. Despite their common
euroskeptic mould, voting for EUSK parties and abstaining are not supported by identical combinations
of causal factors.
Conclusions
The role of the political institutions in affecting the voting choice of mass electorate has been noticed
for quite long time. However even the most recent studies usually miss to take in consideration how the
modern (spatial) theories describe the decision making inside the modern democracies. Such a missing
link precludes the scholars to consider the prediction of these theories as useful element also for an
explanation of the voter behavior of citizens. In this paper we hope to have been able to start filling this
gap. We hypothesized that in European parliamentary democracies an high “spatial” heterogeneity of
the government makes more likely distasteful outcomes for some voters who are not necessarily
extremist but who can prefer “extremist” platforms if stalemate and policy stability or insufficient
compromise prevail. Also when we imagine a voter’s radicalization we have good reasons to think that
the translation of this change of political preferences in a change of voting behavior is not always the
same in all countries but can depend on the constellation of country actors (the government parties)
who are crucial in the decision making processes. If this constellation is conflictual enough to prevent
any change then voter will translate slight radicalization of political preferences in an high
radicalization of the electoral choice.. An European survey conducted after EP elections allowed us to
test these hypotheses with reference to the vote for EUSK parties. The large variety of individual and
contextual variables the survey contains makes quite convincing the confirmation of our hypotheses.
An additional investigation about the abstentionism permits also to exclude a full overlapping between
euroskeptic voter and abstentionist even if some similarities suggest that maybe in some circumstances
one (but whom?) is the descendant of the other.
11
If we substitute the dummy variable left & not located with the variable “not located”, that set citizens who refuse to place
themselves on left-right continuum against all other citizens, the coefficient is positive, very high and significant always but
the model with interaction term. Analyses are available on request.

25
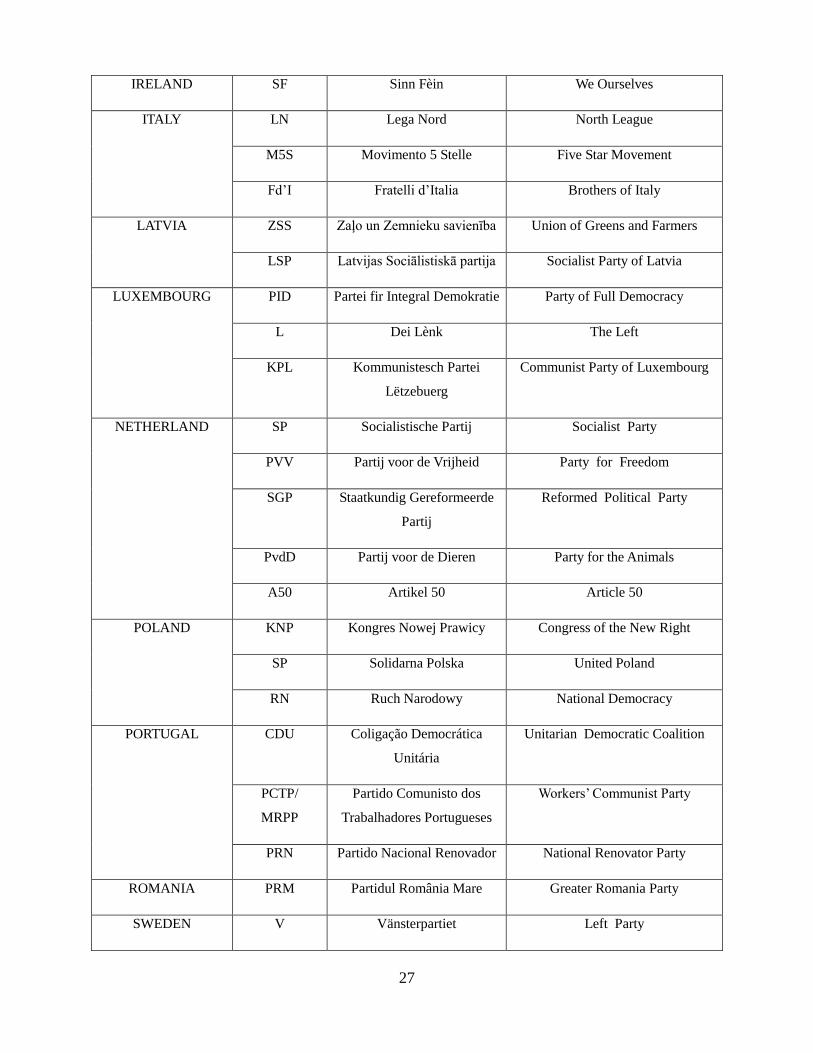
Appendix
LIST OF THE EUROSKEPTIC PARTIES
Country Party Label Party Name (original) Party Name (English)
AUSTRIA FPÖ Freiheitliche Partei
Österreichs
The Freedom Party of Austria
BZÖ Bündnis Zukunft Österreich Alliance for the Future of Austria
EU STOP EU-Austritt, Direkte
Demokratie, Neutralität,
EU – Exit party
REKOS Die Reformkonservativen The Reform Conservatives
BELGIUM VB Vlaams Belang Flemish Interest
BULGARIA NOA Nacionalno Obedinenie
Ataka
National Union Attack
NFSB Natzionalen Front za
Spasenie na Bulgaria
National Front for Salvation of
Bulgaria
CYPRUS AKEL Anorthotikó Kómma
Ergazómenou Laoú
Progressive Party for the Working
People
ELAM Ethniko Laiko Metopo National Popular Front
CZECH REPUBLIC KSCM Komunistická strana Cech a
Moravy
Communist Party of Bohemia and
Moravia 10.98
Svobodni Strana svobodných občanů Party of Free Citizens
DS Dělnická strana sociální
spravedlnosti
Workers' Party of Social Justice
SZR Strana Zdravého Rozumu Party of Common Sense
GERMANY NPD Nationaldemokratische Partei
Deutschlands
National Democratic Party
AfD Alternative für Deutschland Alternative for Germany

26
DENMARK DF Dansk Folkeparti Danish People’s Party
FolkB Folkebevægelsen mod EU People’s Movement Against EU
ESTONIA EIP Eesti Iseseisvuspartei Estonian Independence Party
EKRE Eesti Konservatiivne
Rahvaerakond
Conservative’s People Party
FINLAND PS Persussuomalaiset True Finns
FRANCE LO Liste ouvrière Workers’ struggle
FN Front National National Front
DLR Debout la République Arise the Republic
UK IndEU An independence from
Europe
An independence from Europe
UKIP UK Independence Party UK Independence Party
BNP British National Party British National Party
SF Sinn Fèin We Ourselves
DUP Democratic Unionist Party Democratic Unionist Party
UUP Ulster Unionist Party Ulster Unionist Party
TUV Traditional Unionist Voice Traditionalist Unionist Voice
GREECE AE Anexartitoi Ellines Independent Greeks
EPAM Eniaìo Pallaikò Mètopo United Popular Front
KKE Kommounistikó Kómma
Elládas
Communist Party of Greece
LAOS Laikós Orthódoxos
Synagermós
Popular Orthodox Rally
CA Chrysí Avgí Golden Dawn
HUNGARY JOBBIK Jobbik Magyarországért
Mozgalom
Movement for a Better Hungary
27
IRELAND SF Sinn Fèin We Ourselves
ITALY LN Lega Nord North League
M5S Movimento 5 Stelle Five Star Movement
Fd’I Fratelli d’Italia Brothers of Italy
LATVIA ZSS Zaļo un Zemnieku savienība Union of Greens and Farmers
LSP Latvijas Sociālistiskā partija Socialist Party of Latvia
LUXEMBOURG PID Partei fir Integral Demokratie Party of Full Democracy
L Dei Lènk The Left
KPL Kommunistesch Partei
Lëtzebuerg
Communist Party of Luxembourg
NETHERLAND
SP Socialistische Partij Socialist Party
PVV Partij voor de Vrijheid Party for Freedom
SGP Staatkundig Gereformeerde
Partij
Reformed Political Party
PvdD Partij voor de Dieren Party for the Animals
A50 Artikel 50 Article 50
POLAND KNP Kongres Nowej Prawicy Congress of the New Right
SP Solidarna Polska United Poland
RN Ruch Narodowy National Democracy
PORTUGAL CDU Coligação Democrática
Unitária
Unitarian Democratic Coalition
PCTP/
MRPP
Partido Comunisto dos
Trabalhadores Portugueses
Workers’ Communist Party
PRN Partido Nacional Renovador National Renovator Party
ROMANIA PRM Partidul România Mare Greater Romania Party
SWEDEN V Vänsterpartiet Left Party

28
MP Miljöpartiet de Gröna Environmental Party - the Greens
SD Sverigedemokraterna Sweden Democrats
SLOVAKIA SNS Slovenská národná strana Slovak National Party
SL’S Slovenská ľudová strana Slovak People’s Party
29
Bibliographic references
Auel, K., and Raunio, T. (2014). Debating the State of the Union? Comparing Parliamentary Debates
on EU Issues in Finland, France, Germany and the United Kingdom. The Journal of Legislative
Studies, 20(1), 13–28.
Brambor, T., Clark, W. R., and Golder, M. (2006). Understanding Interaction Models: Improving
Empirical Analyses. Political Analysis, 14(1), 63–82.
De Sio, L., Emanuele, V., and Maggini, N. (2014). The European Parliament elections of 2014. (L. De
Sio, V. Emanuele, and N. Maggini, A C. Di). Roma: CISE.
Emanuele, V., Maggini, N., and Marino, B. (2014). Gaining votes in Europe against Europe? The
electoral performance of anti-EU parties in the 2014 European elections. Paper presented at the
ECPR General Conference 2014, 3-6 Semptember, Glasgow.
Garzia, D., De Sio, L, Trechsel, A., and De Angelis, A. EUandI: Project Description and Datasets
Documentation (January 2015). Robert Shuman Centre for Advanced Studies Research Paper
No. RSCAS 2015/01. Available at SSRN: http://ssrn.com/abstract=2553919
Garzia, D., De Sio, L, and Trechsel, A. (2014). Ist die Zeit reif? 2014 as the first (truly) European
elections. Paper presented at the ECPR General Conference 2014, 3-6 Semptember, Glasgow.
Downs, A. (1957). An Economic Theory of Democracy. New York. Harper.
Flora, D. B., and Curran, P. J. (2004). An Empirical Evaluation of Alternative Methods of Estimation
for Confirmatory Factor Analysis With Ordinal Data. Psychological Methods, 9(4), 466–491.
Forero, C. G., Maydeu-Olivares, A., and Gallardo-Pujol, D. (2009). Factor Analysis with Ordinal
Indicators: A Monte Carlo Study Comparing DWLS and ULS Estimation. Structural Equation
Modeling: A Multidisciplinary Journal, 16(4), 625–641.
Grofman, B. (1985). The Neglected Role of the Status Quo in Models of Issue Voting. The Journal of
Politics, 47(01), 229–237.
Hix, Simon/Høyland, Bjørn (2013). Empowerment of the European Parliament, Annual Review of
Political Science, Vo. 16, No. 1, p. 171-189.
Hix, S. and Lord, C. (1997). Political Parties in the European Union. Basingstoke: Macmillan.
Hobolt, S. B., Spoon, J.-J., and Tilley, J. (2009). A Vote Against Europe? Explaining Defection at the
1999 and 2004 European Parliament Elections. British Journal of Political Science, 39(01), 93–
115.
Hooghe, L., Marks, G., and Wilson, C. J. (2002). Does Left/Right Structure Party Positions on

30
European Integration? Comparative Political Studies, 35(8), 965–989.
Kedar, O. (2005). When Moderate Voters Prefer Extreme Parties: Policy Balancing in Parliamentary
Elections. American Political Science Review, null(02), 185–199.
Klingemann, H.D., and Wessels, B. (2009). How Voters Cope with the Complexity of their Political
Environment: Differentiation of Political Supply, Effectiveness of Electoral Institutions, and the
Calculus of Voting. In The Comparative Study of Electoral Systems, ed. H.D. Klingemann.
Oxford: Oxford University Press.
Lijphart, A. (1999). Patterns of Democracy: Government Forms and Performance in Thirty-Six
Countries. New Haven: Yale University Press.
Lubbers, M., and Scheepers, P. (2005). Political versus Instrumental Euro-scepticism Mapping
Scepticism in European Countries and Regions. European Union Politics, 6(2), 223–242.
Lubbers, M., and Scheepers, P. (2010). Divergent trends of euroscepticism in countries and regions of
the European Union. European Journal of Political Research, 49(6), 787–817.
Marsh, M. (2002). Electoral context. Electoral Studies, 21(2), 207–217.
Meguid, B. M. (2005). Competition Between Unequals: The Role of Mainstream Party Strategy in
Niche Party Success. American Political Science Review, null(03), 347–359.
MZES, H. S. (2005). The European Parliament Elections of June 2004: Still Second-Order? West
European Politics, 28(3), 650–679.
Orriols, L., and Martínez, Á. (2014). The role of the political context in voting indecision. Electoral
Studies, 35, 12–23.
Reif, K., and Schmitt, H. (1980). Nine Second-Order National Elections – A Framework For The Analysis
Of European Election Results. European Journal of Political Research, 8, 3-44.
Spanje, J. van, and Vreese, C. de. (2011). So what’s wrong with the EU? Motivations underlying the
Eurosceptic vote in the 2009 European elections. European Union Politics, 12(3), 405–429.
Taggart, P., and Szczerbiak, A. (2002). Europeanisation, euroscepticism and party systems: Party based
euroscepticism in the candidate states of Central and Eastern Europe. Perspectives on European
Politics and Society, 3(1), 23–41.
Treib, O. (2014). The voter says no, but nobody listens: causes and consequences of the Eurosceptic
vote in the 2014 European elections. Journal of European Public Policy, 21(10), 1541–1554.
Tronconi, F., and Valbruzzi, M. (2014). Punizione o protesta? Il voto ai governi europei. In L’Italia e
l’Europa al bivio delle riforme, eds. M. Valbruzzi, and R. Vignati. Bologna: Istituto Cattaneo.
Tsebelis, G. (2002). Veto Players: How Political Institutions Work. Princeton University Press.