Embed Size (px)
Citation preview
1
THE INSTITUTIONAL CONTEXT OF POVERTY: STATE FRAGILITY AS A
PREDICTOR OF CROSS-NATIONAL VARIATION IN COMMERCIAL
MICROFINANCE LENDING
Joshua K. Ault
Peter B. Gustavson School of Business
University of Victoria
3800 Finnerty Dr
Victoria, BC V8P 5C2
Tel: (250) 472-5349
Andrew Spicer
Moore School of Business
Sonoco International Business Department
University of South Carolina
1705 College Street
Columbia, SC 29208
Tel: (803) 576-9900
Keywords: Business and Poverty, Microfinance, Institutional Hazards, Less-Developed Countries,
State Fragility
Running Title: The Institutional Context of Poverty
We are grateful to Accion International, Tima Bansal, Oana Branzei, the Grameen Foundation,
Andrew Hoffman, Saul Klein, Tatiana Kostova, Ira Lieberman, Thomas Lyon, Dirk Matten, the
Microfinance Information Exchange, Rob Ployhart, Kendall Roth, and seminar participants at the
Academy of Management, the Academy of International Business, Cornell University, The Erb
Institute at the University of Michigan, Harvard Business School, the Ivey PhD Sustainability
Academy at the University of Western Ontario, the Martindale Center at Lehigh University, and
Oxford University for helpful comments and suggestions on this and earlier drafts of the paper.
2
THE INSTITUTIONAL CONTEXT OF POVERTY: STATE FRAGILITY AS A
PREDICTOR OF CROSS-NATIONAL VARIATION IN COMMERCIAL
MICROFINANCE LENDING
Abstract
We examine cross-national variation in the global growth of commercial microfinance from 1998–
2009 as a natural experiment to analyze the role of national institutions in shaping the ability of
commercial enterprises to reach the global poor. Our results demonstrate that a country’s level of
state fragility represents an important institutional context of poverty that explains significant cross-
national variation in the commercial microfinance industry’s ability to grow its client base, control
costs, and attract commercial capital. Moreover, we find that commercial microfinance lenders have
experienced greater difficulty than non-profit lenders in growing their client base in more fragile
state settings. Our results support the proposition that the state shapes both institutional hazards and
opportunities for business-led efforts to combat global poverty.
3
INTRODUCTION
A growing number of management scholars have begun to explore the context of poverty as an
opportunity for both market expansion and positive social impact (Battilana and Dorado, 2010;
Bruton, Khavul, 2010; Khavul, and Chavez, 2011; London and Hart, 2004, 2010; Mair and Marti,
2009; Mair, Marti, and Vantresca, 2012; Ricart et al., 2004; Prahalad, 2005; Seelos and Mair,
2007). This research stream has identified numerous entrepreneurs and organizations that have
developed innovative business models that provide needed goods and services to underserved, low-
income customers. The successes of these individual cases have led political, religious, and business
leaders to call for a more careful examination into the possibility of replicating promising ventures
at a larger scale so that business-led innovation can play a greater role in combating poverty around
the world (Business Call to Action, 2008; Gates, 2008; Pope Benedict XIV, 2009; United Nations,
2009).
Despite these calls for global scale and replication, few studies have explored the degree to
which entrepreneurs are able to transplant proven low-income business models across national
borders. Management researchers have proposed that ‘business models forged in low-income
markets travel well’ (Hart and Christensen, 2002: 52) and that business innovation can penetrate
less-developed countries with ‘significant geographical ambition and reach’ (Prahalad, 2005: 56),
but little empirical work tests these assertions. Some scholars have thus begun to call for additional
research that extends beyond single-country studies to analyze the global opportunities for low-
income business models to reach the poor around the world (Bruton et al., 2011; Karnani, 2007a;
Landrum, 2007; Walsh, Kress, and Beyerchen, 2005; Zahra, et al., 2008).
To address these calls for additional research, we bring an explicit analysis of the state into
the study of business and poverty. Researchers that examine the role of business in alleviating
global poverty often portray business as an effective substitute for the state; commercial
4
organizations are sometimes able to deliver needed goods and services to the poor in locations
where government-led programs to serve the poor have persistently failed (London and Hart, 2010;
Prahalad, 2005). Yet, depicting business solely as a replacement for the state risks overlooking the
complementary nature of the state in economic development; in many instances, the state plays a
powerful role in providing the background rules of the game that facilitate economic activity
(North, 1990). For instance, international business researchers have identified numerous positive,
state functions, such as property rights protection, third-party contract enforcement, policy stability
and the provision of a general rule of law, that reduce the institutional hazards of private investment
and organization (Delios and Beamish, 1999; Delios and Henisz, 2000, 2003; Feinberg and Gupta,
2009; Hermelo and Vassolo, 2010; Meyer, et al., 2009; Slangen and Beugelsdijk, 2010). From this
perspective, the market does not operate independently of the state; instead, the capacities of the
state to provide market-supporting institutions influence the types of risks and opportunities that
private actors face across national settings.
To develop specific hypotheses about the impact of the state on commercial ventures in low-
income markets, we build on an extensive body of research in the field of economic development
that has identified ‘state fragility’ as a meaningful institutional dimension that differentiates
between poor countries and regions (Chauvet and Collier, 2004; Baliamoune-Lutz and McGillivray,
2008; Rice and Patrick, 2008). State fragility is the degree to which ‘state power is unable and/or
unwilling to deliver core functions to the majority of its people: security, protection of property,
basic public services and essential infrastructure’ (Engberg-Pedersen, et al., 2008: 22). We propose
that a country’s level of state fragility represents an important institutional dimension that is likely
to influence the successful replication of low-income business models across developing country
settings. The systemic collapse of the state is likely to generate multiple institutional hazards that
limit the ability of commercial enterprises to capture economic returns when serving the poor in
5
fragile state settings.
We apply the concept of state fragility to an analysis of the global growth of a specific low-
income business model: commercial microfinance. The commercial microfinance industry has
shown proven social benefits in providing small loans to the poor around the world, while at the
same time earning sufficient profits to attract growing interest from multinational banks and
investors (Bruton et al., 2011; Khavul, 2010). The study of the global commercial microfinance
industry therefore provides a natural experiment to study the effects of state fragility in shaping
cross-national variation in the global growth of a low-income business model.
Our analysis of commercial microfinance growth across 106 developing countries from
1998 to 2009 supports our state fragility hypotheses. While we found greater demand for
microfinance in poorer countries, we also found consistent, significant moderating effects of state
fragility on the ability of commercial microfinance lenders to serve that demand, control costs, and
attract capital investment. Moreover, these effects were accentuated for the commercial
microfinance business model; commercial lenders had greater difficulty growing their client base in
more fragile states than did non-profit lenders. Our results suggest that low-income business models
can be replicated in multiple locations around the world, but the potential scope of replication is
likely to be limited by the strength of the state in providing background conditions that support
basic market order and stability.
THE GLOBAL GROWTH OF THE COMMERCIAL MICROFINANCE BUSINESS
MODEL
Microfinance is traditionally defined in terms of the product that it provides: small loans delivered
to low-income entrepreneurs to support business expansion and growth (Robinson, 2001). The
benefits of providing credit to the poor are well documented. Credit allows actors to smooth cash

6
flows, manage risk, cope with economic shocks, and purchase more productive assets. This in turn
fosters entrepreneurship, which has been tied to numerous positive economic and social outcomes.
As typically conceptualized, microfinance is seen as a key source of the credit needed to spur
entrepreneurial development in poor markets (Armendariz de Aghion and Morduch, 2005).
While the product is a central element of microfinance, the provisioning of tiny loans was
not the key innovation of the modern microfinance industry. Small sums can be loaned in numerous
other ways. For instance, loan sharks use coercion and violence as mechanisms for providing credit
to those with little opportunity elsewhere. Pawnbrokers, payday, and title lenders take collateral to
secure small loans. Credit card companies lend as little as a few dollars at a time to anyone with a
clean credit score – whether they are rich or poor.
Given the multiple channels through which small loans can be extended, the microfinance
industry is better defined as an innovation in the business model rather than in the product per se
(London and Hart, 2004). In fact, shifting the focus from the product to the entire business model
has become a central component of research into entrepreneurial innovation to serve the poor
(London and Hart, 2004, 2010; Prahalad, 2005; Ricart et al., 2004; Seelos and Mair, 2007). These
authors point out that basic innovation is needed in product design and packaging when selling to
poor customers. For instance, a series of studies has demonstrated the need for simpler product
offerings, smaller packaging, and limited advertising expenditures when selling to customers with
low purchasing power (Hart and Christensen, 2002; Prahalad, 2005). However, these researchers
note that the challenge to business success in low-income markets extends beyond product redesign
to include a fundamental rethinking of the entire system of creating wealth (Prahalad, 2005).
The management literature often describes microfinance as a prototypical low-income
business model because it illustrates the need to build new methods of product delivery and
governance (London and Hart, 2004; Prahalad, 2005; Ricart et al., 2004; Seelos and Mair, 2007).
7
For instance, to deliver small loans to the poor, microfinance employs a unique transactional
process that is different from those used by traditional banks. While formal banks rely on court
systems and strong bankruptcy laws to facilitate their transactions, microfinance lenders often use
an informal ‘group-lending’ model to ensure repayment. In this approach, borrowers organize into
small groups. While the lender makes loans to each individual, the entire group suffers the
consequences if an individual defaults. Group members, rather than the bank, carefully screen new
applicants, monitor one another’s behavior, and enforce the repayment of the loan. This informal
transactional structure effectively replaces formal contracts; microfinance lenders commonly
achieve repayment rates above 90 percent (Armendariz de Aghion and Morduch, 2005; Bruton et
al., 2011).
The microfinance business model can also be seen as an innovation in formal corporate
governance in the context of the highly informal economies often found in low-income markets. To
cope with the issue of raising capital, many microfinance lenders formally register and adopt formal
governance structures that are typically found in global markets, such as those of joint-stock
corporations or legally recognized non-governmental organizations. The microfinance business
model’s embrace of formal governance structures allows lenders to connect to sources of capital
that extend beyond an individual village or community, thus providing an important source of
competitive advantage over local lenders that have little access to formal funds (International
Network of Alternative Financial Institutions [INAFI], 2006; Mersland, 2008). Microfinance thus
differs strongly from traditional moneylenders or loan sharks, who employ informal methods in all
their operations. The complete informality of traditional moneylenders allows them to avoid formal
registrations, regulations, and taxes; to pay off and bribe political officials to gain preferential
treatment; and to utilize violence and intimidation against competitors and clients alike. Thus, while
microfinance transactions may occur in the informal economy where its clients operate, many
8
authors refer to the microfinance business model as ‘semi-formal’ because the microfinance lender
itself is typically legal, registered, and constrained by formal rules and regulations (Matin, Hulme,
and Rutherford, 2002; Schreiner, 2001; World Bank, 1997).
Two forms of the business model have come to dominate the microfinance industry: the
commercial and the non-profit models (INAFI, 2006; MIX, 2011). The non-profit business model
appeared first. Much of its early development stems from the work of Bangladeshi economist
Muhammad Yunus, who began experimenting with informal group lending in 1976 (Armendariz de
Aghion and Morduch, 2005; Robinson, 2001). Yunus then turned these experiments into a formal
microfinance organization, Grameen Bank, in 1983. By working closely with global NGOs, the
Bangladeshi Central Bank, and the national government, Grameen was soon able to compete with
local loan sharks and grew rapidly throughout Bangladesh (Yunus, 2007). Within a few years,
numerous development organizations had adopted Grameen’s lending methodology, and the model
began to spread internationally (Robinson, 2001).
While the non-profit model achieved moderate global growth in its early days, several
events beginning in the late 1980s and early 1990s led to its more rapid globalization. First, actors
improved their ability to transfer best practices across organizations in different countries. For
instance, a number of organizations established global training centers to teach global best practices
to microfinance managers from around the world, who would then bring this knowledge to their
home countries (Hudon and Vanroose, 2006). Individual microfinance lenders also began to
organize into large global networks to disseminate knowledge, circulate new technologies, and
provide assistance to startups. These include the Microfinance Network (created in 1993), the
International Network of Alternative Financial Institutions (INAFI, created in 1994), and Grameen
Foundation (created in 1997). Finally, the microfinance model achieved a new level of global
awareness when Muhammad Yunus and Grameen Bank received the Nobel Peace Prize in 2006
9
(Yunus, 2007).
A significant development for the global proliferation of microfinance occurred in 1992
when the Latin American NGO, Accion International, introduced the commercial variant of the
microfinance business model. Accion began experimenting with small-scale lending in Brazil in
1973 and adopted a version of the group-lending methodology in 1981 (Otero, 2002). By the 1990s,
demand for Accion’s loans began to outstrip the pool of available donor money. To attract
additional capital, Accion transitioned one of its affiliates in Bolivia, BancoSol, into the world’s
first commercial microfinance lender. By 1995, BancoSol registered an 8.5 percent return on equity,
making it arguably the most profitable bank in Bolivia (Koreen, 1999).
Global development agencies soon realized that microfinance could not only help the poor,
but also earn attractive returns (CGAP, 2006; Mersland and Strøm, 2009; INAFI, 2006). In 1995,
several leading development agencies organized into a consortium, the Consultative Group to Assist
the Poor (CGAP), which actively promoted the new commercial version of the model as a global
industry best practice (CGAP, 2006; INAFI, 2006; Morduch, 2000). At the same time, global
investors began to examine commercial microfinance as a new asset class within a broader portfolio
of possible global investments. Given the relatively stable performance of microfinance in the wake
of financial collapses elsewhere (Gonzalez, 2007), investors realized that microfinance remained
‘largely uncorrelated with returns from most other asset classes, [and] would therefore serve as a
natural hedge for a typical investment bank, insurance company or pension’ (Bystrom, 2008: 2110;
see also Krauss and Walter, 2009). Increasing global capital flows accelerated the growth of the
microfinance model. In the decade between 2000 and 2009, the microfinance industry attracted
almost 80 million new customers (growing from just over 10 million borrowers in 60 countries to
over 90 million borrowers in 106 countries), with the new commercial model accounting for
approximately 60 percent of that growth (MIX, 2011).
10
NATIONAL VARIATION IN THE GLOBAL GROWTH OF COMMERCIAL
MICROFINANCE
Microfinance growth took place through the creation of a new industry in which the business
model, both in its commercial and non-profit manifestations, became highly replicated by a large
number of firms across over 100 developing countries. Given its broad diffusion, we examine cross-
national variation in the global growth of commercial microfinance from 1998-2009 as a natural
experiment to analyze the role of national institutions in shaping the ability of this model to reach
the global poor.
To develop our hypotheses, we first look to a long literature in economic development that
has specifically studied the institutional context of poverty and has concluded that the degree of
‘state fragility’ represents an important institutional measure to include in an analysis of any
programs designed to improve the lives of the poor (Chauvet and Collier, 2004; Baliamoune-Lutz
and McGillivray, 2008; Rice and Patrick, 2008). State fragility research comes from efforts in the
development literature to understand how the world’s least developed countries, such as Somalia
and Sudan, differ not only from industrialized countries but also from developing countries that
seem to be advancing much more rapidly, such as Mexico and China. These researchers have
concluded that no single variable explains the persistence of underdevelopment in many of the
poorest countries of the world; instead, it is the systemic collapse of the state across multiple
domains that defines the primary and often enduring institutional context of poverty in many
national settings (Di John, 2008; Collier, 2009; Marshall and Cole, 2008).
Researchers in this tradition first referred to countries like Somalia and Sudan as failed
states. In these countries, the inability of the government to maintain a monopoly over the use of
violence leads to high levels of conflict and instability in political and economic life, and the lack of
11
basic bureaucratic capacities to effectively implement rules, regulations, or programs leads to a
fundamental disregard for the rule of law and a lack of public services. Given this general
breakdown of government operations in failed states, the poor have little access to basic social
services such as education or medical care, possess few avenues of recourse from the actions of
more powerful actors that may possess uncontested means of violence and intimidation, and suffer
from a dearth of market-supporting policies that promote equal opportunities for economic
advancement and employment (Burnside and Dollar, 2000; Collier, 2007, 2009; Collier and Dollar,
2002). These researchers suggest that individual dimensions of institutional collapse are difficult to
unbundle because they all arise from a single underlying cause: a fundamental inability or
unwillingness of the state to operate in the public interest (Di John, 2008; Marshall and Cole, 2008).
While economic-development researchers first divided less-developed countries into two
categories for empirical analysis – those with ‘failed’ states and those with ‘not failed’ states – they
concluded over time that a binary categorization scheme was problematic. As Baliamoune-Lutz and
McGillavray (2008) note, there is no clear or obvious distinction between the last country labeled
‘not failed’ and the first country labeled ‘failed.’ While Sudan and Nigeria may clearly be failed
states, the status of countries such as Cameroon or Nepal is more ambiguous. A number of these
authors have thus proposed that a more accurate approach would recognize that all states are fragile
to a greater or lesser degree, thereby allowing for a gradual transition from one type to the other.
Researchers thus began to use degrees of ‘fragility,’ rather than a single category of ‘failure,’ to
identify national differences across less-developed countries (Chauvet and Collier, 2004).
The salience of the state fragility measure as a critical institutional context for poverty-
alleviation programs is apparent through its policy applications. Organizations such as the World
Bank, International Development Association (IDA), and Department for International
Development (DFID) use measures of state fragility as an applied tool to help guide aid allocation
12
around the world (Baliamoune-Lutz and McGillivray, 2008). Since fragile countries are just as
poor, if not poorer, than other less-developed countries, these international aid organizations
expected, at first, that the impact of international aid on poverty reduction would be as great, if not
greater, in fragile states. Instead, they have found that, even after controlling for the level of poverty
within a country, high levels of state fragility sharply negate the effects of aid on observable
improvements to the conditions of the poor. Demand alone does not determine the effectiveness of
aid programs; the capacity of the state to absorb that aid and create a hospitable environment for its
investment also matters (Burnside and Dollar, 2000; Collier and Dollar, 2002).
We make a similar distinction between the effects of poverty and those of state fragility
when predicting national variation in the global growth of the commercial microfinance model. We
begin with a baseline hypothesis that national poverty levels are likely to play a strong role in
explaining the national contexts where commercial microfinance will attract a significant number of
borrowers. This argument is based on a simple analysis of the demand for microfinance’s product:
the greater the number of individuals who live in poverty, the greater the need for small loans. Thus,
we expect commercial microfinance to grow in poorer rather than richer countries:
Hypothesis 1: The greater the level of income poverty in a country, the greater the growth in
commercial microfinance borrowers per capita in that country.
We also develop hypotheses about state fragility as an important institutional dimension that
is likely to have an independent effect in shaping the global spread of the commercial microfinance
business model. State fragility research demonstrates that the experience of poverty is not the same
across all countries. Thus, anti-poverty strategies and programs that may work in one country do not
necessarily work with the same effectiveness in more fragile state environments. We make a similar
argument that the commercial microfinance model is likely to fit better in countries with lower
levels of fragility, independent of the number of low-income individuals who live in that country.
Since the state fragility literature has focused more on the impact of state failure on the
13
effectiveness of government-led foreign-aid programs, rather than of commercially-led programs
such as commercial microfinance, we supplement the fragility literature with related institutional
research in international business in developing our hypotheses. International business researchers
have developed the concept of institutional strength and weakness to categorize countries in a
similar manner as state fragility researchers (Delios and Beamish, 1999; Hermelo and Vassolo,
2010; Meyer, et al., 2009). In the international business literature, institutional strength refers to the
capabilities of the state to provide background rules of the game that facilitate private investment
and market development, including property rights protection, contract enforcement, policy
stability, and the general provision of a transparent rule of law. For instance, Meyer et al. (2009: 63)
write, ‘We consider institutional arrangements to be ‘strong’ if they support the voluntary exchange
underpinning an effective market mechanism.’ Delios and Beamish (1999: 917) similarly note that
‘Weaknesses in the institutional environment refer to conditions that undermine property rights and
increase risks in exchange.’ The strength of a country’s formal institutions is related to the state’s
effectiveness in supporting market exchange and organization rather than to the breadth of its
intervention in the marketplace.
From this perspective, formal businesses face greater institutional hazards in countries with
weaker market institutions. These hazards include a higher risk that assets will be expropriated at
less than full market value; that the terms of formal contracts or regulations will be violated or
ignored; that government officials will demand side payments to grant projects or licenses; and that
future conditions will be unpredictable due to unexpected policy and regulatory changes (Feinberg
and Gupta, 2009; Hermelo and Vassolo, 2010; Delios and Henisz, 2000, 2003). These added risks
eventually erode the value of successful strategies and limit the economic performance of formal
organizations in weak institutional environments (Slangen and Beugelsdijk, 2010).
Feinberg and Gupta (2009: 382) observe that although the various types of institutional
14
hazards in international business ‘may appear somewhat distinct, many scholars have argued
that the different types share common drivers, such as a weakly constrained political structure and
an institutional context that lacks credibility. Indeed, empirical studies have consistently
demonstrated extremely high correlations among the various risk types.’ This insight about the
common political drivers of weak market-supporting institutions is particularly relevant to the study
of state fragility. Given the presence of a weakly constrained political structure that possesses little
capacity to implement a credible rule of law, a range of market-supporting institutions are likely to
be quite weak in fragile states. The institutional hazards in fragile states are likely to include not
only the ones frequently mentioned in the international business literature, such as those related to
weak property rights protection and poor contract enforcement, but also those associated with basic
issues of market stability and security. For instance, the breakdown in national security institutions
in fragile states frequently leads to the rise of warlords, mafias, and loan sharks who control markets
in often-illicit goods and services (Di John, 2008), thereby creating additional hazards related to
personal safety and violence in business (Hiatt and Sine, forthcoming).
We propose that the many institutional hazards to the appropriation of profits for private
enterprises in fragile states are likely to have multiple implications for the growth of the commercial
microfinance model. To develop these hypotheses, two important features of the commercial
microfinance model need to be reiterated. First, the commercial microfinance model, unlike the
non-profit model from which it emerged, was developed specifically to pursue a double-bottom line
of both earning a profit and serving the poor. Therefore, the commercial microfinance model must
show that it can consistently earn high profits over the long run if it wishes to attract investors that
view it more as an asset class than a social program for helping the poor (Cull, Demirgüç-Kunt, and
Morduch, 2009; Gonzalez, 2007; Krauss and Walter, 2009). In meeting its profit-oriented
objectives, the commercial microfinance business model is therefore likely to be sensitive to the
15
institutional hazards that arise from the business environments of fragile states.
Second, the commercial microfinance model is a ‘semi-formal’ lending scheme that operates
as a bridge between formal and informal economies (Matin, Hulme, and Rutherford, 2002;
Schreiner, 2001; World Bank, 1997). While the commercial microfinance model looks to informal,
relational norms to solve some of its organizational challenges – such as connecting to customers –
it looks to formal organization to solve others – such as connecting to investors and operating
within the legal system. The microfinance model therefore must not only cover the costs of its
operations, but also the costs associated with formal registration and organization in any country in
which it operates. In comparison, informal moneylenders, who compete with microfinance lenders
in poor economies, typically do not incur these costs of formality and can use almost any means
available, including violence, to gain an advantage. The risks and uncertainties to formal business
organization and governance are likely to be considerably higher in more fragile state settings,
thereby hindering the ability of commercial microfinance organizations to earn significant profits in
these settings.
Based on this institutional argument, we hypothesize both a direct and moderating effect of
state fragility on the growth of commercial microfinance lending across developing country
settings. The direct effect suggests that commercial microfinance will reach more low-income
customers in those less-developed country settings with lower rather than higher state fragility. The
moderating effect retains the strong role for poverty in driving demand for the product of small
loans. While microfinance is likely to grow most extensively in those countries where large
numbers of people need small loans, state fragility is likely to influence the ability of the
microfinance model to address that demand in a commercially viable way. The fit for commercial
microfinance will be greatest in countries where the model can both create and appropriate value,
which will most likely be within poor countries with stronger state systems:
16
Hypothesis 2a: The lower the level of state fragility in a country, the greater the growth in
commercial microfinance borrowers per capita in that country.
Hypothesis 2b: State fragility will moderate the relationship between income poverty and
the growth in commercial microfinance borrowers, such that growth will be greater in poor
countries with less state fragility.
As a second test of the effects of state fragility on the ability of commercial microfinance to
appropriate profit, we now compare the commercial microfinance model to the not-for-profit model.
Researchers across multiple disciplines have debated the effects of commercialization in serving the
poor. While some management scholars suggest that commercialization allows poverty-alleviation
projects to scale up more rapidly than is possible through the non-profit model (London and Hart,
2010; Prahalad, 2005), others argue that the benefits of the commercial model over the non-profit
model may be overstated (Karnani, 2007a, 2007b). A similar debate over the relative merits of
commercialization has also taken place within the microfinance industry itself. Some microfinance
practitioners and researchers have posited that commercialization offers the best possibility of
raising sufficient capital to reach the millions of people that still lack access to the financial system
(Akula, 2011; CGAP, 2006; Robinson, 2001). Others have cautioned that serving the poorest and
most disenfranchised clients is too costly to justify commercial investment; the non-profit approach
should thus remain the industry’s preferred model (Yunus, 2007; INAFI, 2006; for a discussion of
this issue in microfinance, see also Armendariz and Szafarz, 2011; Morduch, 2000).
We apply the institutional contingency perspective developed throughout this paper to
contribute to these debates. We explore the effects of ownership structure on the geographical scope
of the microfinance model, extending the argument that commercial organization better fits the
institutional conditions found in less fragile state contexts. Even if commercial organizations have
strong motivations to serve the global poor no matter where they are located, operating in less
fragile countries is likely to offer them stronger financial rewards with less risk. We therefore
expect that commercial microfinance will tend to gravitate over time to these country settings.
17
Conversely, we expect that the drive to appropriate profit is likely to be less important for non-for-
profit organizations. They will therefore be more likely to persist in serving the poor even if fragile
state conditions raise the financial costs and risks of microfinance in these contexts. Thus, while we
expect that state fragility may negatively affect all forms of microfinance, we propose that it will
disproportionately affect the growth of the commercial business model:
Hypothesis 3: The lower the level of state fragility in a country, the greater the relative
growth in commercial, rather than non-profit, microfinance borrowers.
We now move from an examination of cross-national variance in the growth of the
commercial microfinance model to develop two sets of hypotheses that look specifically at the
underlying mechanisms helping to explain these national differences. First, given weak state
capacity to implement a credible rule of law in fragile states, we expect that costs of formally
operating a commercial microfinance lender are likely to be higher in these settings. De Soto's
(1989: 148) work into the high costs of formal business operations in weak states supports this
proposition. He found that many businesses in Peru were forced to dedicate an inordinate amount of
resources solely to the task of remaining formal, incurring costs associated with paying taxes,
obtaining licenses, filing documents with government offices, and purchasing utilities. As a result,
many firms cut these expenses by moving underground into the informal sector or by remaining
small enough to avoid detection by government officials (De Soto, 1989: 153). This finding has led
to a subsequent wave of empirical research to further identify the added costs of operating in the
formal economy in many less-developed countries (Djankov, et al., 2002; World Bank, 2011).
These findings are consistent with research on institutional hazards in the international business
literature; in many developing countries of the world, the risks to business activity extend to basic
challenges of formal registration and governance, thus raising the costs to formal operations in these
settings.
Following the logic of the previous hypotheses, we propose both a direct and indirect effect
18
of state fragility on the growth of commercial microfinance operating costs. We expect that national
levels of poverty will lead to lower costs per loan because the size of the loan is likely to be
correspondingly lower in poorer countries. However, a country’s level of state fragility is likely to
have an independent effect on these costs. For example, Vikram Akula (2011), founder of India’s
largest commercial microfinance lender, SKS, shares stories of local moneylenders and government
officials demanding extortion and fees, cutting the power, and threatening violence when he
expanded into new locales. These added costs to formal organization and competition are likely to
be higher in more fragile states, thus raising the total operating costs per loan. While microfinance
lenders may be able to avoid some of these costs when they are small and less noticeable, the costs
to formal operations are only likely to become increasingly higher as the firms grow larger and their
presence and impact in the broader industry draws greater attention (De Soto, 1989). Thus, if
microfinance organizations attempt to replicate their business model in fragile states, we expect that
their operating costs will increase as they respond to the adverse institutional conditions found in
these environments, regardless of the basic economic efficiency of the microfinance model itself:
Hypothesis 4a: The greater the level of state fragility in a country, the greater the growth in
commercial microfinance lenders’ operating costs per loan in that country.
Hypothesis 4b: State fragility will moderate the relationship between income poverty and
the growth in operating costs per loan, such that operating costs will be greater in poor
countries with more state fragility.
A second mechanism likely to drive slower growth of commercial microfinance in fragile
states stems from the negative impact of state fragility on commercial investment into a country’s
microfinance industry. As noted previously, an important advantage of commercial microfinance
over informal moneylenders in many low-income countries is microfinance’s ability to access low-
cost capital in global financial markets. Yet, commercial investors, who tend to appreciate
microfinance more for its advantages as an asset class than for its ability to help the poor
(Callaghan, et al., 2007; Krauss and Walter, 2009), are unlikely to put their money into
19
microfinance industries operating in countries of high state fragility, where returns become more
uncertain and risky. An executive with Morgan Stanley’s Microfinance Institutions Group
(interviewed for this study) articulated this logic succinctly:
‘Why would someone take time and energy to invest in microfinance bonds when you can
buy securities on Bloomberg in two seconds? In order to attract investors, we have to
operate in countries with developed capital markets that are attractive for international
investors; and you need rule of law. That is why we are primarily interested in BRICs
(Brazil, Russia, India, and China). We will do some in the second tier – Mexico, Peru,
Malaysia, and a few Middle-Eastern countries – but that is it. We have looked at Kenya, but
that country is so risky that we would have to really justify the presence. It comes down to
this, if we issue a microfinance bond in Brazil, it will be oversubscribed. If we issue a bond
in Sri Lanka, there will be very little interest.’
This investor notes that capable governments and market-based investment are highly
complementary; the strength of the state matters in attracting commercial capital in less-developed
countries. An important advantage of microfinance over informal moneylenders is thus unlikely to
materialize in fragile states.
As in our previous hypotheses, we expect both a direct and a moderating effect of state
fragility on the levels of commercial investment into a country’s microfinance industry. The direct
effect suggests that investors are unlikely to invest in fragile locations, since uncertainty and risk
will be higher. The moderating effect suggests that investors are likely to expect both a strong
market potential for an innovation and a sound business case for serving that market when making
investment decisions. Commercial investors will thus be more interested in countries where poverty
creates strong demand for small loans and a capable state system allows lenders to pay high returns
with less risk. This leads to the following two hypotheses:
Hypothesis 5a: The lower the level of state fragility in a country, the greater the commercial
funding for the microfinance business model in that country.
Hypothesis 5b: State fragility will moderate the relationship between income poverty and
the level of commercial investment into the microfinance industry, such that investment
levels will be greater in poor countries with less state fragility.
20
METHODS
Data and samples
All microfinance data came from the Microfinance Information Exchange (MIX, 2011). MIX is
frequently cited as the industry’s most reliable and comprehensive data source (Gonzalez and
Rosenberg, 2006; Khavul, 2010). The sample for our tests of hypotheses 1 through 4 was the 106
developing countries included in the MIX dataset, ‘Trends for Microfinance Institutions.’ Our
longitudinal analysis covered the years 1998 to 2009, giving us 1,272 country-year observations.1
The data to test hypotheses 5a and 5b came from the MIX dataset, ‘Funding Structure,’
which provides information on capital flows from global markets to 890 microfinance lenders in 49
less-developed countries (MIX, 2011). MIX only started reporting funding data in 2007 (MIX,
2011). Given the small number of years included in the data set, we were unable to test the capital
investment hypothesis through a longitudinal model (Beck, 2001: 274). We thus tested the
hypothesis in cross-sectional data for the most recent year available (2009).
Dependent variables
For hypotheses 1 through 2b, the dependent variable was the number of borrows registered to all
commercial microfinance lenders in a particular country divided by the total population of that
country. Because this created a very small number, we multiplied the result by 1,000. The
dependent variable was thus the number of microfinance borrowers per thousand citizens,
calculated for each country every year from 1998–2009.
For hypothesis 3, our dependent variable was the proportion of all microfinance borrowers
in a particular country that are registered to for-profit lenders, calculated for each country every year
1 The sample includes only those countries that had at least one active lender registered with MIX. This excludes almost
all developed countries; microfinance lenders from the richest countries of the world have yet to reach significant scale
to register with this database service.
21
from 1998-2009. To create this measure we took the total number of borrowers registered to for-
profit microfinance lenders in a country and divided that figure by the sum of all microfinance
borrowers in that country (those registered to both for-profit and non-profit lenders). Because the
resulting variable was a proportion, and thus bounded by one and zero, we followed Long’s (1997)
recommendation to use a logit transformation of the variable ( , where P is the proportion
of for-profit borrowers to total borrowers). For hypothesis 4a and 4b, our dependent variable was
the total operating costs a commercial microfinance lender incurs to make a single loan. According
to MIX, operating costs include: all personnel expenses (including salary and benefits),
administrative expenses, depreciation and amortization, bank charges, insurance costs, and other
expenses incurred to run the organization. MIX provides the median value of these costs per loan
for each country each year, which we incorporated into our analysis. For hypotheses 5a and 5b, our
dependent variable was the log of total capital invested into each country’s microfinance sector that
came from ‘commercial’ funders. We defined ‘commercial’ funders as any organizations that MIX
labels ‘financial institutions’ or ‘funds’ (as opposed to ‘development finance institutions,’ or
‘governments’).
Independent variables
Income Poverty. We used the log of per capita gross national income (GNI) in constant 2000 U.S.
dollars for this measure. We chose GNI because it is the primary criterion the World Bank uses to
classify countries into income groups and determine aid allocation (World Bank, 2010). For
convenience in interpreting the results, we took the inverse of this measure so that a higher number
would be associated with greater income poverty.
State Fragility. We operationalized state fragility using Kaufmann, Kraay, and Mastruzzi’s
lnP
1- P
æ
è ç
ö
ø ÷

22
(2009) ‘Worldwide Governance Indicators’ database. We used this measure because it has gone
through the most rigorous tests for reliability and validity of the measures commonly used to
capture similar concepts of state capability (Langbein and Knack, 2010). The governance index
captures six individual dimensions of state capability: Voice and Accountability, Political Stability,
Government Effectiveness, Regulatory Quality, Rule of Law, and Control of Corruption. For our
analysis, we combined the six dimensions into a single measure of state fragility. In a factor
analysis of the Kaufmann measures, Langbein and Knack (2010) found the presence of one
multidimensional factor, rather than six independent measures. Slangen and Beugelsdijk (2010)
similarly found high correlations among the individual dimensions of the Kaufmann data and thus
averaged their scores into a single composite measure. These findings are consistent with the
fragility literature, which suggests that the simultaneous breakdown of multiple institutional factors
in a country stems from a single cause: the failure of the state to act in the public interest
(Baliamoune-Lutz and McGillivray, 2008; Rice and Patrick, 2008). In this index, a higher score
indicates a stronger state. For convenience in interpreting the results, we took the inverse of the
measure so that a higher number would be associated with a more fragile state.
From 1998 to 2009, the state fragility variable was, on average, correlated with itself at 0.99
from one year to the next. This finding was consistent with our theory, which posits that pre-
existing, time-invariant levels of state fragility found in a country will influence microfinance
growth. We thus took the average measure of state fragility for each country across the time period
of our study.2
We examined the possibility that the interaction between poverty and state fragility might
lead to multicollinearity using variance inflation factors (VIF). Kutner, Nashtsheim, Neter, and Li
(2005) suggest that VIFs greater than 10 indicate the possibility of multicollinearity. Our tests found
2 See Acemoglu and Johnson (2005) for a similar strategy of averaging relatively time-invariant institutional measures
across the years of the study. We also used the temporal average of each measure for our control variables.
23
VIFs above this threshold. We thus followed Kutner et al.’s (2005) recommendation to mean-center
our variables when including them in the interaction term.
Control variables
Our first control was for international aid flows, which we took from the World Bank’s ‘World
Development Indicators’ (WDI) dataset (net official aid received, constant 2008 U.S. $; World
Bank, 2010). Microfinance is often presented as an alternative to international aid (Yunus, 2007).
Its growth may thus be influenced by the presence or absence of aid money in a particular location.
Next, we included two measures to control for the potential size of the market. Some authors
suggest that large countries may provide greater economies of scale than small countries (Collier,
2006, 2007; Prahalad, 2005). We thus included measures for (1) the physical size of the country
(CIA, 2009); and (2) population (World Bank, 2010).
Fourth, we controlled for literacy, which we also took from the WDI. Several authors point
out that uneducated individuals often make poor entrepreneurs (Karnani, 2007a; Collier, 2007).
Microfinance may thus work most effectively in countries where borrowers are educated and
equipped to turn their loans into viable enterprises.
The fifth control variable was urbanization (World Bank, 2010). The microfinance group-
lending model was originally designed for the rural poor (Yunus, 2007). It may thus be less
appropriate for urban settings where borrowers are less socially tied to their neighbors.
Sixth, we included the control variable ‘Money and Quasi Money (M2) as a percent of
GDP’ from the WDI. Economists commonly use this measure to capture the size, depth, and
development of a country’s banking system (World Bank, 2006). Demand for microfinance may be
greater in countries with underdeveloped banking sectors.
Next, we included two measures to control for the degree of government intervention in the
24
economy. Greater government intervention may increase the cost of doing business (Cull,
Demirgüç-Kunt, and Morduch, 2011). Larger, more interventionist governments may also provide
their own poverty-reduction programs that compete directly with microfinance. To capture the size
of government and degree of intervention in the economy, we included measures for (1)
government spending as a percent of GDP; and (2) openness to trade (World Bank, 2010).
We also controlled for the number and magnitude of civil events from 1998-2009, using the
‘Total Summed Magnitude of All Societal Major Episodes of Political Violence’ from Polity IV
(Marshall and Jaggers, 2010). This variable captures any unexpected disruptions in otherwise stable
institutional conditions due to civil war, coups, or other types of political turmoil. Violence and
political instability may reduce business activity (Collier, 2007). Additionally, this measure
provides a partial control for the chance that political upheavals may have led some countries to
experience a change in state fragility levels over the time of the analysis.
Robustness checks
We included several robustness checks of our measures. As a robustness check for our poverty
measure we used three related variables: the inverse of GDP per capita; the percentage of the
country’s population that lives below $2.00 per day; and a variable we created that captures the
interaction effect of average income and the dispersion of incomes around that average. While
development agencies typically use some measure of average income by itself to determine a
country’s poverty level, some economic-development scholars argue that a country might have high
levels of poverty if it has low average incomes and/or high income inequality (Rice and Patrick,
2008). To create this variable, we multiplied each country’s GNI per capita with its Gini coefficient.
For simplicity, we called this newly created GNI X Gini measure ‘dispersion poverty.’ We obtained
all poverty measures from the WDI dataset (2010).
25
As a robustness check for our multi-dimensional measure of fragility, we used two related
variables: Polity IV’s own multi-dimensional ‘State Fragility Index’ (Marshall and Cole, 2008) and
Fund for Peace’s (2010) ‘Failed States Index.’
Data analysis
For our tests of hypotheses 1 through 4, we developed growth models using Random Coefficient
Modeling (RCM). The RCM method was developed specifically for experiments where the
independent variable remains relatively stable at the individual-unit level of analysis, as in
psychological experiments that look at the effects of an individual’s personality traits on an
outcome over time (Thoresen et al., 2004). Western (1998) notes that this attribute makes RCM
particularly suited for cross-national comparisons because national institutions often remain
constant from one time period to the next, as was the case for our institutional measures of state
fragility.
Before choosing RCM over panel-data regression, we followed the recommendation of the
RCM literature to test the relative strength of the two models (Beck and Katz, 2007; Bliese and
Ployhart, 2002; Ployhart and Vandenberg, 2010). RCM and panel-data regression can be compared
using a likelihood ratio test with a X2
distribution (critical X2
with 3 df = 7.82). For all longitudinal
hypotheses, the improvement of RCM over panel-data regression was significant at 99.9 percent
confidence levels, leading us to prefer RCM for our tests. However, to ensure the robustness of our
method, we also tested the effects of fragility on commercial microfinance using other time-series
cross-section methods: panel-corrected standard errors (PCSE), heteroscedasticity-consistent
standard errors (HCSE), and Newey-West standard errors (NWSE). We achieved similar results
across estimation methods.3
3 Results from the different estimation techniques are available from the authors upon request.
26
To build the RCM, we followed Bliese and Ployhart’s (2002: 380) ‘growth model building
sequence.’ First, we estimated a general global model by entering a dummy variable for time into
the model by itself. This variable captured the effects of time on the average level of growth across
all countries. Second, we examined country-specific differences in the global trend by estimating a
separate simple-regression equation (Y = b0 + b1*time) for each country one at a time. The country-
level analysis improved the fit over the general global model (as measured by the change in the log
likelihood) for hypotheses 1-4 (p < 0.001).
Third, we scrutinized the error structures of our model. We found that controlling for an
autoregressive error structure yielded the greatest improvement in the log likelihood. For
hypotheses 1 through 3, we also found that taking the log of the dependent variables significantly
improved the log likelihood (p < 0.001). We thus included these adjustments in our final model.
Fourth, we ran a cross-sectional model to test the effects of the independent variables on cross-
national difference in the levels of commercial microfinance in the first year of the study (1998).
Researchers usually report this cross-sectional model in RCM because it represents an initial
baseline by which to compare subsequent growth patterns (Bliese and Ployhart, 2002).
Since we did not have longitudinal data on the microfinance capital structure, we tested
hypotheses 5a and 5b using OLS regression.
RESULTS
Table 1 presents the descriptive statistics and correlation matrices. Table 1a shows the correlations
among the independent variables and the cross-sectional levels of each dependent variable.
Correlations among all independent variables were below |0.73|. Tables 1b through 1d show the
year-over-year correlations for each of the dependent variables in the study. These tables suggest
the possibility for non-independence of our longitudinal dependent variables. As noted previously,
27
we found that an autoregressive error structure provided the strongest solution for this issue.
***Insert Table 1 About Here***
Table 2 presents the results of the RCM models used to test hypotheses 1 through 2b.
***Insert Table 2 About Here***
Hypothesis 1 predicts a positive relationship between income poverty and the country-level growth
of the commercial microfinance business model. As shown in models 2 through 4, the coefficient
for poverty was not significant when entered into the model by itself (b = 0.02; p = 0.35). However,
it became significant when the fragility and the interaction terms were added into the model (b =
0.07; p = 0.01). We thus found a degree of support for hypothesis 1: a one-dollar decrease in the log
of a nation’s average income increased the logged growth of commercial microfinance by 0.07
borrowers per thousand citizens per year. Hypotheses 2a predicts that fragility will negatively
impact the growth of commercial microfinance. The coefficient for state fragility was not significant
when entered into the model by itself (b = -0.05; p = 0.11), but became significant in the presence of
the interaction term (b = -0.08; p = 0.02). We thus found a degree of support for hypothesis 2a: a
one-unit increase in a country’s fragility score reduced the logged growth of commercial
microfinance in that country by 0.08 borrowers per thousand citizens per year.
Hypothesis 2b predicts that fragility will moderate the relationship between poverty and
microfinance growth. The coefficient for the fragility X poverty interaction term was negative and
significant (b = -0.05; p = 0.003), thus supporting the hypothesis. We found that the growth of
commercial microfinance was greatest in those countries with high levels of poverty but low levels
of state fragility. Moreover, state fragility had a non-significant effect in explaining cross-national
variance in initial levels of microfinance in the first year of the study (1998), but a significant effect
in explaining cross-national variance in the subsequent growth of microfinance. These findings
suggest a distinct difference between early stages in the innovation of the business model and its
28
subsequent diffusion. The factors that explained where commercial microfinance initially emerged
seem to be quite different from the factors that explain where it eventually took root and grew.
The results of RCM models used to test hypotheses 3 and 4 are found in Table 3. We
followed the same model-building process as in our tests of hypotheses 1 and 2: we first entered the
control variables by themselves, then the direct effects for state fragility, and finally the interaction
effects of fragility X poverty. In this table, we only report the final model for each hypothesis test.
However, the effects of state fragility were similar for all tests whether it was entered into the model
with or without the fragility X poverty interaction term.
***Insert Table 3 About Here***
Table 3a shows the test of hypothesis 3. This hypothesis predicts that fragility will have a negative
effect on the survival of commercial microfinance vs. non-profit microfinance. As illustrated in the
table, we found the coefficient for state fragility to be negative and significant (b = -0.21; p = 0.04),
thus supporting the hypothesis.
Table 3b shows the tests of Hypothesis 4a and 4b. Hypothesis 4a predicts that operating
costs will be greater in countries with high levels of state fragility. As suggested, we found a
negative direct effect of national poverty on total operating costs per loan, most likely because of
the smaller loan size in these countries (MIX, 2011). Yet, after controlling for these effects, we still
found a significant effect of state fragility on operating costs per loan (b = 47.32; p = 0.01), thus
supporting the hypothesis: for each one-unit increase in a country’s fragility score the cost of
provisioning a single loan increased by $47.32 per year. Hypothesis 4b predicts a moderating effect
for state fragility on the relationship between income and the cost of lending. As shown in the table,
this hypothesis was also supported (b = 29.02; p = 0.01): poor countries with higher levels of state
fragility had greater operating costs per loan than poor countries with lower levels of state fragility.
Finally, Table 4 shows the tests of hypotheses 5a and 5b.
29
***Insert Table 4 About Here***
Hypothesis 5a predicts that capital will flow more readily to countries with lower levels of state
fragility. As shown in Table 4, the coefficient for state fragility was negative and significant (b = -
12.05; p = 0.05). We thus found support for hypothesis 5a. Hypothesis 5b predicts that state fragility
will negatively moderate the relationship between poverty and the flow of commercial capital into
microfinance. Table 4 shows support for this hypothesis (b = -14.82; p = 0.01).
Robustness checks
We ran our robustness checks for our poverty and state fragility measures in the RCM model used
to test hypotheses 1 through 2b.4 First, we included GDP per capita in place of GNI per capita. The
effects for poverty, fragility, and fragility X poverty were all significant at 95 percent confidence
levels. Second, we replaced GNI with our measure for the percentage of a country’s population that
lives below $2.00 per day. Poverty and the fragility X poverty interaction terms were both
significant at 95 percent confidence levels. Finally, we entered our ‘dispersion poverty’ variable
(which combined GNI X Gini) into the model. Fragility was significant at 95 percent confidence
levels while the fragility X poverty coefficient was significant at 90 percent confidence levels.
We then ran our model using the Fund for Peace’s (2010) Failed States Index in place of
Kaufmann’s measure. The coefficients for poverty, fragility, and fragility X poverty were all
significant at 95 percent confidence intervals. Finally, we ran the model with the Polity IV’s
(Marshall and Cole, 2008) State Fragility Index. The coefficients for poverty and the fragility X
poverty interaction term were significant at 95 percent confidence levels while the coefficient for
fragility was significant at 90 percent confidence levels.
4 Results of robustness tests are available from the authors upon request
30
DISCUSSION
Our analysis of the global expansion of commercial microfinance lending contributes to the broader
discussion in the management literature about the possibilities of global replication and scale of
business-led efforts to combat poverty. Our results indicate that the commercial microfinance
business model did cross national boundaries in some instances, thus providing a degree of global
scalability and scope. However, the ability of the model to grow its client base, lower operating
costs, and attract commercial investment decreased in more fragile state settings. While countries
with higher levels of poverty were able to generate greater demand for commercial microfinance
lending, poor countries with higher levels of state fragility were less likely to turn that demand into
a commercially viable market. Moreover, we found that commercial microfinance lenders
experienced greater difficulty than non-profit lenders in growing their client base in more fragile
state settings.
Our test of the effects of state fragility across multiple dependent variables, controls and
robustness checks provides initial evidence for the validity of this institutional dimension for
studying business activity in less-developed countries. Research into the study of poverty alleviation
further supports the need for additional research into the state fragility measure in the business and
poverty literature. Collier (2007) identifies the individuals that live in the most fragile states as the
‘bottom billion,’ an estimate of the number of people living in contexts where the most basic
regulatory and social functions of the state are not performed. Thus, if Prahalad (2005) estimates
that approximately four billion people live in deep poverty around the world, approximately 25
percent of this population lives in countries with extremely high levels of state fragility. Our
analysis of commercial microfinance suggests that reaching the bottom billion through business
innovation is likely to represent a distinct challenge that differs from serving the poor in other state
settings.
31
An important avenue for future research is to further analyze variance in the institutional
context of poverty around the world. State fragility researchers have proposed that the roots of
institutional weakness in the countries that populate the bottom billion stem from a single
underlying cause – a general unwillingness or inability of the state to deliver core functions to its
citizen. They developed the higher-level state fragility measure specifically to explore the
consequences of systemic institutional collapse for poverty alleviation programs (Marshall and
Cole, 2008; Rice and Patrick, 2008). In our study of business and poverty, we followed research
precedent in this literature and did not unbundle the state fragility measure into individual indicators
of its effects on market systems, such as policy uncertainty, weak property-rights protection or poor
contract enforcement. An outstanding question for future management research is whether the state
fragility measure can be further sub-divided into individual dimensions, such that institutional
weakness in one domain can be differentiated from weakness in another, or whether the institutional
context of business in the poorest countries of the world is better captured through holistic measures
such as state fragility. Future research will also be needed to explore alternative measures that
capture meaningful institutional variance across the developing world.
A limitation of our study is that we only examined the global spread of a single business
model: commercial microfinance. While microfinance is an especially attractive industry to test an
institutional perspective on the potential global scale of a low-income business model, it may
possess certain characteristics that differentiate it from other industries that may also target low-
income customers. For example, microfinance is a service, not a product, and thus builds on long-
term relationships rather than immediate exchange. Furthermore, unlike innovative products such as
solar ovens or inexpensive laptops that are novel products in low-income markets, microfinance
lenders face competition from existing providers of small loans, particularly loan sharks and
moneylenders. Many of the challenges of conducting business in fragile state environments may
32
arise from competition against pre-existing actors who may take advantage of a weak institutional
environment to pursue profits through unlimited means. While our study represents one of the
management literature’s first comprehensive analyses of commercial innovation across multiple
low-income markets, future research is required to explain the global replication and scale of other
business models designed to serve poor customers.
Despite the challenges of developing global research designs that include a representative
sample of the world’s poorest countries, an institutional agenda remains an important part of
continuing inquiry into the possibilities of business in helping to serve low-income customers
around the world. Our findings suggest that a single low-income business model is unlikely to be
equally effective across all national settings. Managers will therefore need to carefully analyze
variance in institutional contexts around the world when determining the potential ability of a
specific business practice or product to reach across national boundaries and achieve larger scale.
Moreover, policy makers may find that non-profit or government poverty alleviation models may be
more appropriate than commercial ventures in some contexts, allowing for a division of labor
between different types of programs and policies. Understanding the impact of national institutions
on the opportunities and risks to business-led efforts to combat poverty will increase the likelihood
that efforts to use this method to invoke social change will be deployed only to those locations that
are attractive from a financial – as well as social – perspective.
33
REFERENCES
Acemoglu D, Johnson S. 2005. Unbundling institutions. Journal of Political Economy 113: 949-
995.
Akula V. 2011. A Fistful of Rice: My Unexpected Quest to End Poverty Through Profitability.
Harvard Business School Publishing: Boston, MA.
Armendariz B, Szafarz A. 2011. On mission drift in microfinance institutions. In The Handbook of
Microfinance, Armendariz B, Labie M (eds). World Scientific: Singapore: 341-366.
Armendariz de Aghion B, Morduch J. 2005. The Economics of Microfinance. The MIT Press:
Cambridge, MA.
Baliamoune-Lutz MN, McGillivray M. 2008. State fragility: concepts and measurement. Working
Paper 2008/44, World Institute for Development Economics Research, Helsinki, FI.
Battilana J, Dorado S. 2010. Building sustainable hybrid organizations: the case of commercial
microfinance organizations. Academy of Management Journal 53: 1490-1440.
Beck N. 2001. Time-series-cross-section data: what have we learned in the past few years? Annual
Review of Political Science 4: 271-293.
Beck N, Katz JN. 2007. Random coefficient models for time-series-cross-section data: Monte Carlo
experiments. Political Analysis 15: 182-195.
Bliese PD, Ployhart RE. 2002. Growth modeling using random coefficient models: model building,
testing, and illustrations. Organizational Research Methods 5: 362-387.
Bruton GD, Khavul S, Chavez H. 2011. Microlending in emerging economies: building a new line
of inquiry from the ground up. Journal of International Business Studies 42: 718-739.
Burnside C, Dollar D. 2000. Aid, policies, and growth. American Economic Review 90: 847-868.
Business Call to Action. 2008. Business Call to Action. http://bcta-initiative.org/ [10 May, 2010].
Bystrom HNE. 2008. The microfinance collateralized debt obligation: a modern Robin Hood?
World Development 36: 2109-2126.
Callaghan I, Gonzalez H, Maurice D, Novak C. 2007. Microfinance – on the road to capital
markets. Journal of Applied Corporate Finance 19: 115-124.
CGAP. 2006. Good practice guidelines for funders of microfinance. CGAP/The World Bank
Group, Washington, DC.
Chauvet L, Collier P. 2004. Development effectiveness in fragile states: spillovers and turnarounds.
Oxford University: Oxford, U.K.
CIA. 2009. The World Fact Book. Potomac Books Inc: Washington, DC.
Collier P. 2006. African growth: why the big push? Journal of African Economies 15: 188-211.
Collier P. 2007. The Bottom Billion: Why the Poorest Countries are Failing and What Can Be Done
About It. Oxford University Press: Oxford, U.K.
Collier P. 2009. The political economy of state failure. Oxford Review of Economic Policy 25: 219-
240.
Collier P, Dollar D. 2002. Aid allocation and poverty reduction. European Economic Review 46:
1475-1500.
Cull R, Demirgüç-Kunt A, Morduch J. 2009. Microfinance meets the market. Journal of Economic
Perspectives 23: 167-192.
Cull R, Demirgüç-Kunt A, Morduch J. 2011. Does regulatory supervision curtail microfinance
profitability and outreach? World Development 39: 949-965.
De Soto H. 1989. The Other Path: The Economic Answer to Terrorism. Harper & Row: New York,
NY.
Delios A, Beamish PW. 1999. Ownership strategy of Japanese firms: transactional, institutional,
and experience influences. Strategic Management Journal 20: 915-933.
34
Delios A, Henisz WJ. 2000. Japanese firms’ investment strategies in emerging economies. Academy
of Management Journal 43: 305-323.
Delios A, Henisz WJ. 2003. Political hazards, experience, and sequential entry strategies: the
international expansion of Japanese firms, 1980-1998. Strategic Management Journal 24:1153-
1164.
Di John J. 2008. Conceptualizing the causes and consequences of failed states: a critical review of
the literature. Working Paper 25, Crisis States Research Centre, London, U.K.
Djankov S, La Porta R, Lopez-de-Silanes F, Schleifer A. 2002. The regulation of entry. The
Quarterly Journal of Economics 117: 1-37.
Engberg-Pedersen L, Andersen L, Jung D. 2008. Fragile situations. DIIS Report 2008:11,
Copenhagen, DK.
Feinberg SE, Gupta AK. 2009. MNC subsidiaries and country risk: internationalization as a
safeguard against weak external institution. Academy of Management Journal 52: 381-399.
Fund for Peace. 2010. Failed States Index. http://www.fundforpeace.org [January 17, 2011]
Gates, WH III. 2008. Creative Capitalism. In World Economic Forum, Davos, CH.
Gonzalez A. 2007. Resilience of microfinance institutions to national macroeconomic events: an
econometric analysis of MFI asset quality. MIX Discussion Paper No. 1, Microfinance
Information Exchange Inc., Washington, DC.
Gonzalez A, Rosenberg R. 2006. The state of microcredit – outreach, profitability, and poverty.
World Bank, Washington, DC.
Hart SL, Christensen CM. 2002. The great leap: driving innovation from the base of the pyramid.
MIT Sloan Management Review 44: 51-56.
Hermelo FD, Vassolo R. 2010. Institutional development and hypercompetition in emerging
economies. Strategic Management Journal 31: 1457-1473.
Hiatt SR, Sine W. Forthcoming. Clear and present danger: planning and new venture survival amid
political and civil violence. Strategive Management Journal.
INAFI. 2006. The Alternative Principles of Microfinance: Towards Equitable Service Delivery and
Resource Allocation. INAFI International Foundation: Dakar-Fann, Senegal.
Karnani A. 2007a. The mirage of marketing to the bottom of the pyramid: how the private sector
can help alleviate poverty. California Management Review 49: 90-111.
Karnani A. 2007b. Doing well by doing good – case study: ‘Fair & Lovely’ whitening cream.
Strategic Management Journal 28: 1351-1357.
Kaufmann D, Kraay A, Mastruzzi M. 2009. Governance matters VIII: Aggregate and individual
governance indicators, 1996-2008. World Bank Policy Working Papers, World Bank,
Washington, DC.
Khavul S. 2010. Microfinance: creating opportunities for the poor? Academy of Management
Perspectives 24: 58-72.
Koreen MJ. 1999. Banco Solidario: a new model for microfinance? Working Paper, CGAP,
Washington DC.
Krauss NA, Walter I. 2009. Can microfinance reduce portfolio volatility? Economic Development
and Cultural Change 58: 85-110.
Kutner MH, Nachtsheim CJ, Neter J, Li W. 2005. Applied Linear Statistical Models 5th
Edition.
McGraw-Hill: New York, NY.
Landrum NE. 2007. Advancing the ‘base of the pyramid’ debate. Strategic Management Review 1:
1-12.
Langbein L, Knack S. 2010. The worldwide governance indicators: six, one, or none? Journal of
Development Studies 46: 350-370.
London T, Hart SL. 2004. Reinventing strategies for emerging markets: beyond the transnational
35
model. Journal of International Business Studies 35: 350-370.
London T, Hart SL. 2010. Next Generation Business Strategies for the Base of the Pyramid: New
Approaches for Building Mutual Value. FT Press: Upper Saddle River, NJ.
Long JS. 1997. Regression Models for Categorical and Limited Dependent Variables (Advanced
Quantitative Techniques in the Social Sciences 7). Sage Publications: Thousand Oaks, CA.
Mair J, Marti I. 2009. Entrepreneurship in and around institutional voids: a case study from
Bangladesh. Journal of Business Venturing 24: 419-435.
Mair J, Marti I, Vantresca MJ. 2012. Building inclusive markets in rural Bangladesh: how
intermediaries work in institutional voids. Academy of Management Journal 55: 819-850.
Marshall MG, Cole BR. 2008. Global report on conflict, governance, and state fragility. Foreign
Policy Bulletin, Winter: 3-21.
Marshall MG, Jaggers K. 2010. Polity IV. http://www.systemicpeace.org [January 17, 2011].
Matin I, Hulme D, Rutherford S. 2002. Finance for the poor: from microcredit to microfinancial
services. Journal of International Development 14: 273-294.
Mersland R. 2008. The cost of ownership in microfinance organizations. World Development 37:
469-478.
Mersland R, Strøm RO. 2009. Performance and governance in microfinance institutions. Journal of
Banking and Finance 33: 662-669.
Meyer KE, Estrin S, Bhaumik SK, Peng MW. 2009. Institutions, resources, and entry strategies in
emerging economies. Strategic Management Journal 30: 61-80.
MIX. 2011. The Microfinance Information Exchange. http://www.mixmarket.org [April 6, 2011].
Morduch J. 2000. The microfinance schism. World Development 28: 617-629.
North DC. 1990. Institutions, Institutional Change and Economic Performance. Cambridge
University Press, Cambridge, U.K.
Otero M. 2002. Twenty Years of Microfinance Work and Future Challenges. In the 5th
International Forum on Microenterprise Inter-American Development Bank, Rio de Janeiro, BR.
Ployhart RE, Vandenberg RJ. 2010. Longitudinal research: the theory, design, and analysis of
change. Journal of Management 36: 94-120.
Pope Benedict XVI. 2009. Encyclical Letter on Integral Human Development. Vatican Publishing
House: Vatican, VA.
Prahalad CK. 2005. The Fortune at the Bottom of the Pyramid: Eradicating Poverty Through
Profits. Wharton School Publishing: Upper Saddle River, NJ.
Ricart JE, Enright MJ, Ghemawat P, Hart SL, Khanna T. 2004. New frontiers in international
strategy. Journal of International Business Studies 35: 175-200.
Rice SE, Patrick S. 2008. Index of State Weakness in the Developing World. The Brookings
Institute: Washington, DC.
Robinson M. 2001. The Microfinance Revolution: Sustainable Finance for the Poor. World Bank
Publications: Washington, DC.
Schreiner M. 2001. Informal finance and the design of microfinance. Development in Practice 11:
637-640.
Seelos C, Mair J. 2007. Profitable business models and market creation in the context of deep
poverty: a strategic view. Academy of Management Perspectives 21: 49-63.
Slangen AHL, Beugelsdijk S. 2010. The impact of institutional hazards on multinational activity: a
contingency perspective. Journal of International Business Studies 41: 980-995.
Thoresen CJ, Bradley JC, Bliese PD, Thoresen JD. 2004. The big five personality traits and
individual job performance growth trajectories in maintenance and transitional job stages.
Journal of Applied Psychology 89: 835-833.
United Nations. 2009. The Global Compact. United Nations. http://www.unglobalcompact.org
36
[October 21, 2010].
Walsh JP, Kress JP, Beyerchen KW. 2005. Book review essay: promises and perils at the bottom of
the pyramid. Administrative Science Quarterly 50: 859-881.
Western B. 1998. Causal heterogeneity in comparative research: a Bayesian hierarchical modeling
approach. American Journal of Political Science 42: 1233-1259.
World Bank. 1997. World Development Report. Oxford University Press: Oxford, U.K.
World Bank. 2006. Measuring banking sector development. Financial Sector Indicators Note.
World Bank: Washington, DC.
World Bank. 2010. World Development Indicators 2009. World Bank Publications: Washington,
DC.
World Bank. 2011. Doing Business in 2012. Oxford University Press: Oxford, U.K.
Yunus M. 2007. Creating a World Without Poverty: Social Business and the Future of Capitalism.
Public Affairs: New York, NY.
Zahra SA, Rawhouser HN, Bhawe N, Neubaum NO, Hayton JC. 2008. Globalization of social
entrepreneurship opportunities. Strategic Entrepreneurship Journal 2: 117-131.
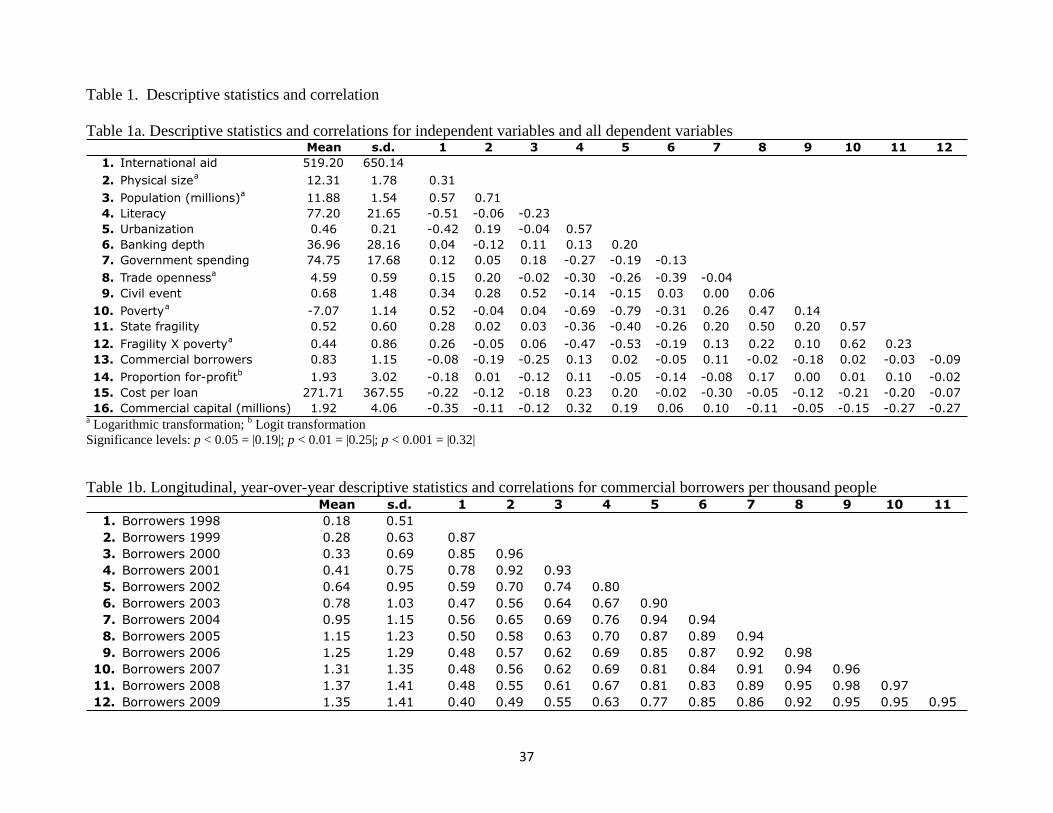
37
Table 1. Descriptive statistics and correlation
Table 1a. Descriptive statistics and correlations for independent variables and all dependent variables
a Logarithmic transformation;
b Logit transformation
Significance levels: p < 0.05 = |0.19|; p < 0.01 = |0.25|; p < 0.001 = |0.32|
Table 1b. Longitudinal, year-over-year descriptive statistics and correlations for commercial borrowers per thousand people
Mean s.d. 1 2 3 4 5 6 7 8 9 10 11 12
1. International aid 519.20 650.14
2. Physical sizea
12.31 1.78 0.31
3. Population (millions)a
11.88 1.54 0.57 0.71
4. Literacy 77.20 21.65 -0.51 -0.06 -0.23
5. Urbanization 0.46 0.21 -0.42 0.19 -0.04 0.57
6. Banking depth 36.96 28.16 0.04 -0.12 0.11 0.13 0.20
7. Government spending 74.75 17.68 0.12 0.05 0.18 -0.27 -0.19 -0.13
8. Trade opennessa
4.59 0.59 0.15 0.20 -0.02 -0.30 -0.26 -0.39 -0.04
9. Civil event 0.68 1.48 0.34 0.28 0.52 -0.14 -0.15 0.03 0.00 0.06
10. Povertya
-7.07 1.14 0.52 -0.04 0.04 -0.69 -0.79 -0.31 0.26 0.47 0.14
11. State fragility 0.52 0.60 0.28 0.02 0.03 -0.36 -0.40 -0.26 0.20 0.50 0.20 0.57
12. Fragility X povertya
0.44 0.86 0.26 -0.05 0.06 -0.47 -0.53 -0.19 0.13 0.22 0.10 0.62 0.23
13. Commercial borrowers 0.83 1.15 -0.08 -0.19 -0.25 0.13 0.02 -0.05 0.11 -0.02 -0.18 0.02 -0.03 -0.09
14. Proportion for-profitb
1.93 3.02 -0.18 0.01 -0.12 0.11 -0.05 -0.14 -0.08 0.17 0.00 0.01 0.10 -0.02
15. Cost per loan 271.71 367.55 -0.22 -0.12 -0.18 0.23 0.20 -0.02 -0.30 -0.05 -0.12 -0.21 -0.20 -0.07
16. Commercial capital (millions) 1.92 4.06 -0.35 -0.11 -0.12 0.32 0.19 0.06 0.10 -0.11 -0.05 -0.15 -0.27 -0.27
Mean s.d. 1 2 3 4 5 6 7 8 9 10 11
1. Borrowers 1998 0.18 0.51
2. Borrowers 1999 0.28 0.63 0.87
3. Borrowers 2000 0.33 0.69 0.85 0.96
4. Borrowers 2001 0.41 0.75 0.78 0.92 0.93
5. Borrowers 2002 0.64 0.95 0.59 0.70 0.74 0.80
6. Borrowers 2003 0.78 1.03 0.47 0.56 0.64 0.67 0.90
7. Borrowers 2004 0.95 1.15 0.56 0.65 0.69 0.76 0.94 0.94
8. Borrowers 2005 1.15 1.23 0.50 0.58 0.63 0.70 0.87 0.89 0.94
9. Borrowers 2006 1.25 1.29 0.48 0.57 0.62 0.69 0.85 0.87 0.92 0.98
10. Borrowers 2007 1.31 1.35 0.48 0.56 0.62 0.69 0.81 0.84 0.91 0.94 0.96
11. Borrowers 2008 1.37 1.41 0.48 0.55 0.61 0.67 0.81 0.83 0.89 0.95 0.98 0.97
12. Borrowers 2009 1.35 1.41 0.40 0.49 0.55 0.63 0.77 0.85 0.86 0.92 0.95 0.95 0.95
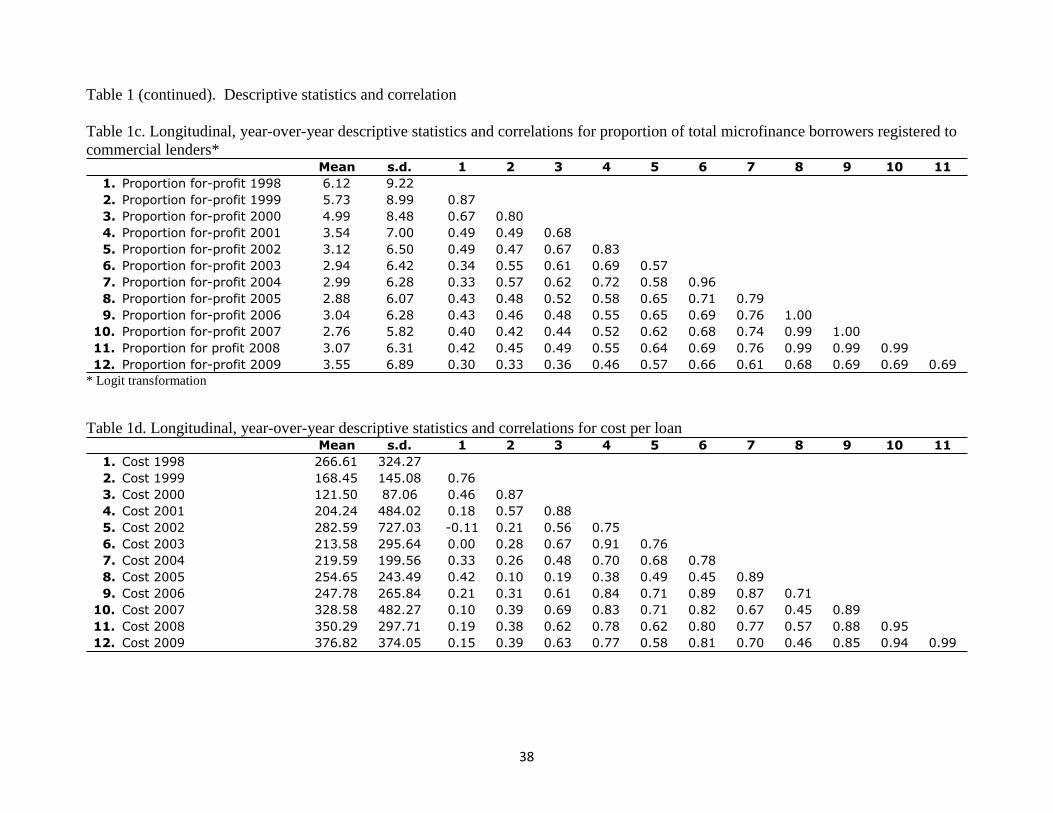
38
Table 1 (continued). Descriptive statistics and correlation
Table 1c. Longitudinal, year-over-year descriptive statistics and correlations for proportion of total microfinance borrowers registered to
commercial lenders*
* Logit transformation
Table 1d. Longitudinal, year-over-year descriptive statistics and correlations for cost per loan
Mean s.d. 1 2 3 4 5 6 7 8 9 10 11
1. Proportion for-profit 1998 6.12 9.22
2. Proportion for-profit 1999 5.73 8.99 0.87
3. Proportion for-profit 2000 4.99 8.48 0.67 0.80
4. Proportion for-profit 2001 3.54 7.00 0.49 0.49 0.68
5. Proportion for-profit 2002 3.12 6.50 0.49 0.47 0.67 0.83
6. Proportion for-profit 2003 2.94 6.42 0.34 0.55 0.61 0.69 0.57
7. Proportion for-profit 2004 2.99 6.28 0.33 0.57 0.62 0.72 0.58 0.96
8. Proportion for-profit 2005 2.88 6.07 0.43 0.48 0.52 0.58 0.65 0.71 0.79
9. Proportion for-profit 2006 3.04 6.28 0.43 0.46 0.48 0.55 0.65 0.69 0.76 1.00
10. Proportion for-profit 2007 2.76 5.82 0.40 0.42 0.44 0.52 0.62 0.68 0.74 0.99 1.00
11. Proportion for profit 2008 3.07 6.31 0.42 0.45 0.49 0.55 0.64 0.69 0.76 0.99 0.99 0.99
12. Proportion for-profit 2009 3.55 6.89 0.30 0.33 0.36 0.46 0.57 0.66 0.61 0.68 0.69 0.69 0.69
Mean s.d. 1 2 3 4 5 6 7 8 9 10 11
1. Cost 1998 266.61 324.27
2. Cost 1999 168.45 145.08 0.76
3. Cost 2000 121.50 87.06 0.46 0.87
4. Cost 2001 204.24 484.02 0.18 0.57 0.88
5. Cost 2002 282.59 727.03 -0.11 0.21 0.56 0.75
6. Cost 2003 213.58 295.64 0.00 0.28 0.67 0.91 0.76
7. Cost 2004 219.59 199.56 0.33 0.26 0.48 0.70 0.68 0.78
8. Cost 2005 254.65 243.49 0.42 0.10 0.19 0.38 0.49 0.45 0.89
9. Cost 2006 247.78 265.84 0.21 0.31 0.61 0.84 0.71 0.89 0.87 0.71
10. Cost 2007 328.58 482.27 0.10 0.39 0.69 0.83 0.71 0.82 0.67 0.45 0.89
11. Cost 2008 350.29 297.71 0.19 0.38 0.62 0.78 0.62 0.80 0.77 0.57 0.88 0.95
12. Cost 2009 376.82 374.05 0.15 0.39 0.63 0.77 0.58 0.81 0.70 0.46 0.85 0.94 0.99

39
Table 2. Random coefficient model predicting growth of commercial microfinance borrowers per capita
a Logarithmic transformation
Hypothesized effects are in bold italics
† p < 0.10; * p < 0.05; ** p < 0.01; *** p < 0.001
Coefficient
Standard
error Coefficient
Standard
error Coefficient
Standard
error Coefficient
Standard
error
Time 0.11 0.01 8.94 *** 0.12 0.27 0.45 0.17 0.27 0.63 0.48 0.28 1.71 †
Constant 0.19 0.06 3.25 *** -0.46 1.33 -0.34 -0.64 1.33 -0.48 -0.40 1.44 -0.28
Effects in base year (1998)
International aid 0.00 0.00 1.48 0.00 0.00 1.52 0.00 0.00 1.38
Physical sizea
0.06 0.06 0.94 0.06 0.06 0.93 0.06 0.06 0.94
Population (millions)a
-0.08 0.09 -0.88 -0.08 0.09 -0.88 -0.08 0.09 -0.88
Literacy 0.01 0.00 2.08 * 0.01 0.00 1.93 † 0.01 0.00 1.94 †
Urbanization 0.06 0.46 0.14 0.02 0.46 0.05 0.02 0.46 0.05
Banking depth 0.00 0.00 -0.61 0.00 0.00 -0.65 0.00 0.00 -0.64
Government spending 0.00 0.00 0.83 0.00 0.00 0.61 0.00 0.00 0.57
Trade opennessa
-0.05 0.15 -0.35 -0.10 0.15 -0.68 -0.11 0.15 -0.70
Civil event -0.05 0.05 -0.97 -0.06 0.05 -1.29 -0.06 0.05 -1.19
Povertya
0.09 0.11 0.81 0.02 0.12 0.19 0.05 0.14 0.37
State fragility 0.22 0.17 1.34 0.21 0.17 1.22
Fragility X povertya
-0.04 0.09 -0.45
Effects on growth
International aid 0.00 0.00 -0.36 0.00 0.00 -0.44 0.00 0.00 -0.89
Physical sizea
-0.02 0.01 -1.41 -0.02 0.01 -1.41 -0.02 0.01 -1.53
Population (millions)a
0.01 0.02 0.64 0.01 0.02 0.66 0.01 0.02 0.74
Literacy 0.02 0.01 2.51 * 0.02 0.01 2.70 * 0.02 0.01 2.87 **
Urbanization 0.05 0.09 0.56 0.06 0.09 0.67 0.07 0.09 0.74
Banking depth 0.00 0.00 -1.06 0.00 0.00 -1.02 0.00 0.00 -1.10
Government spending 0.00 0.00 1.44 0.02 0.01 1.68 † 0.00 0.00 1.49
Trade opennessa
0.02 0.03 0.59 0.03 0.03 0.98 0.03 0.03 0.97
Civil event 0.00 0.01 0.02 0.00 0.01 0.42 0.01 0.01 0.94
Povertya
0.02 0.02 0.94 0.04 0.03 1.53 0.07 0.03 2.72 *
State fragility -0.05 0.03 -1.60 -0.08 0.03 -2.29 *
Fragility X povertya
-0.05 0.02 -2.97 **
-2 Log likelihood
Wald X2
1,252.28 1,125.72 1,122.34 1,112.12
79.94*** 117.16*** 123.07*** 145.21***
Model 1 Model 2 Model 3 Model 4
z-value z-value z-value z-value
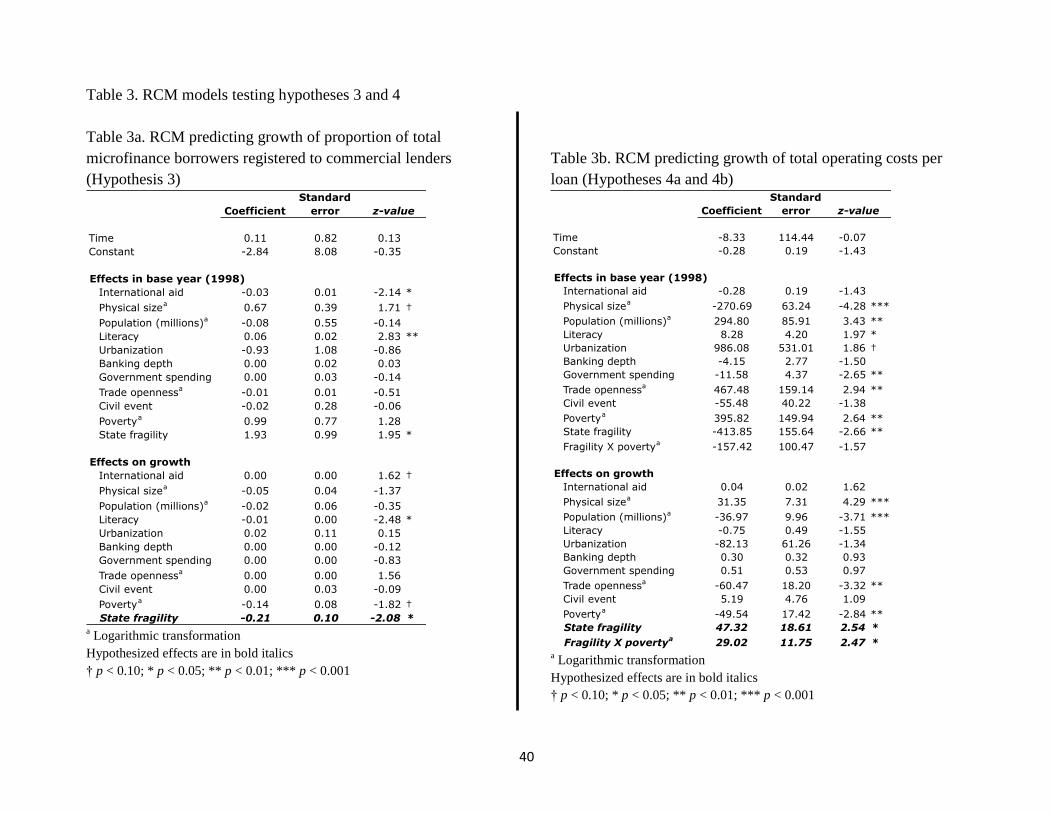
40
Table 3. RCM models testing hypotheses 3 and 4
Table 3a. RCM predicting growth of proportion of total
microfinance borrowers registered to commercial lenders
(Hypothesis 3)
a Logarithmic transformation
Hypothesized effects are in bold italics
† p < 0.10; * p < 0.05; ** p < 0.01; *** p < 0.001
Table 3b. RCM predicting growth of total operating costs per
loan (Hypotheses 4a and 4b)
a Logarithmic transformation
Hypothesized effects are in bold italics
† p < 0.10; * p < 0.05; ** p < 0.01; *** p < 0.001
Coefficient
Standard
error
Time 0.11 0.82 0.13
Constant -2.84 8.08 -0.35
Effects in base year (1998)
International aid -0.03 0.01 -2.14 *
Physical sizea
0.67 0.39 1.71 †
Population (millions)a
-0.08 0.55 -0.14
Literacy 0.06 0.02 2.83 **
Urbanization -0.93 1.08 -0.86
Banking depth 0.00 0.02 0.03
Government spending 0.00 0.03 -0.14
Trade opennessa
-0.01 0.01 -0.51
Civil event -0.02 0.28 -0.06
Povertya
0.99 0.77 1.28
State fragility 1.93 0.99 1.95 *
Effects on growth
International aid 0.00 0.00 1.62 †
Physical sizea
-0.05 0.04 -1.37
Population (millions)a
-0.02 0.06 -0.35
Literacy -0.01 0.00 -2.48 *
Urbanization 0.02 0.11 0.15
Banking depth 0.00 0.00 -0.12
Government spending 0.00 0.00 -0.83
Trade opennessa
0.00 0.00 1.56
Civil event 0.00 0.03 -0.09
Povertya
-0.14 0.08 -1.82 †
State fragility -0.21 0.10 -2.08 *
z-value Coefficient
Standard
error
Time -8.33 114.44 -0.07
Constant -0.28 0.19 -1.43
Effects in base year (1998)
International aid -0.28 0.19 -1.43
Physical sizea
-270.69 63.24 -4.28 ***
Population (millions)a
294.80 85.91 3.43 **
Literacy 8.28 4.20 1.97 *
Urbanization 986.08 531.01 1.86 †
Banking depth -4.15 2.77 -1.50
Government spending -11.58 4.37 -2.65 **
Trade opennessa
467.48 159.14 2.94 **
Civil event -55.48 40.22 -1.38
Povertya
395.82 149.94 2.64 **
State fragility -413.85 155.64 -2.66 **
Fragility X povertya
-157.42 100.47 -1.57
Effects on growth
International aid 0.04 0.02 1.62
Physical sizea
31.35 7.31 4.29 ***
Population (millions)a
-36.97 9.96 -3.71 ***
Literacy -0.75 0.49 -1.55
Urbanization -82.13 61.26 -1.34
Banking depth 0.30 0.32 0.93
Government spending 0.51 0.53 0.97
Trade opennessa
-60.47 18.20 -3.32 **
Civil event 5.19 4.76 1.09
Povertya
-49.54 17.42 -2.84 **
State fragility 47.32 18.61 2.54 *
Fragility X povertya
29.02 11.75 2.47 *
z-value
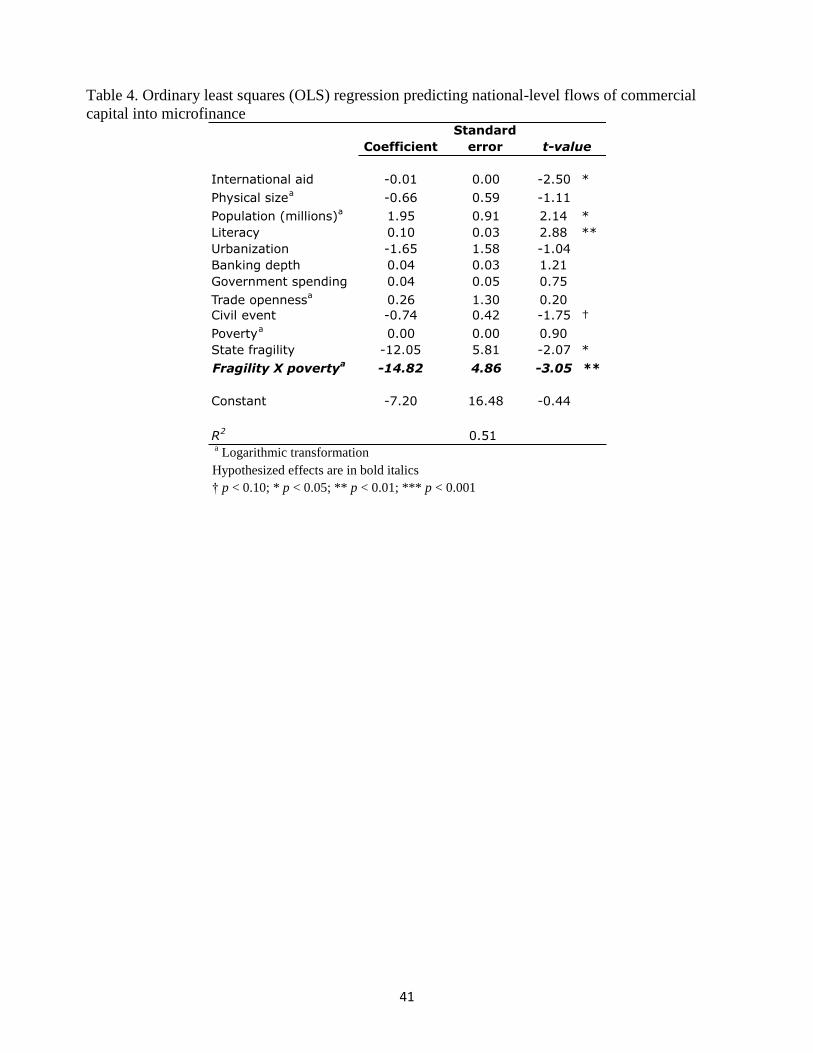
41
Table 4. Ordinary least squares (OLS) regression predicting national-level flows of commercial
capital into microfinance
a
Logarithmic transformation
Hypothesized effects are in bold italics
† p < 0.10; * p < 0.05; ** p < 0.01; *** p < 0.001
Coefficient
Standard
error
International aid -0.01 0.00 -2.50 *
Physical sizea
-0.66 0.59 -1.11
Population (millions)a
1.95 0.91 2.14 *
Literacy 0.10 0.03 2.88 **
Urbanization -1.65 1.58 -1.04
Banking depth 0.04 0.03 1.21
Government spending 0.04 0.05 0.75
Trade opennessa
0.26 1.30 0.20
Civil event -0.74 0.42 -1.75 †
Povertya
0.00 0.00 0.90
State fragility -12.05 5.81 -2.07 *
Fragility X povertya
-14.82 4.86 -3.05 **
Constant -7.20 16.48 -0.44
R2
t-value
0.51