Embed Size (px)
Citation preview
*Corresponding author. Tel.: #301-77-23-570; fax: #301-77-23-571.
E-mail address: [email protected] (I.P. Tatsiopoulos)
Int. J. Production Economics 66 (2000) 33}44
The integration of activity based costing and enterprisemodeling for reengineering purposes
I.P. Tatsiopoulos*, N. Panayiotou
National Technical University of Athens, Mechanical Engineering Department, 15780 Zografos, Athens, Greece
Received 28 February 1997; accepted 23 June 1999
Abstract
This paper describes an approach to integrate the Activity Based Costing (ABC) technique within the framework ofGRAI Integrated Methodology (GIM) in order to assist business process reengineering justi"cation and evaluation. The"rst step of integration is to have ABC adopt cost pools and lists of activities derived from GIM process modeling.Further on ABC is involved in two stages of the methodology: (a) ABC adds to the ECOGRAI method of performancemodeling by supporting the determination of the right performance indicators that are responsible for business processcosts. (b) ABC is a sound approach to translate operational performance indicators not found in accounting ledgers into"nancial terms and the company's pro"t bottom line. The approach has been developed during the Esprit researchproject REALMS and implementation results from two industrial partners are presented. ( 2000 Elsevier Science B.V.All rights reserved.
Keywords: Reengineering; Benchmarking; Activity based costing; Enterprise modeling
1. Introduction
The 1990s can be characterized as the decade ofchange. The struggle to gain or even sustain com-petitive advantage in a global market, in most oftimes, has led many companies to alter the com-plexion of many businesses. As a result, the directcost of products and services become shorter andshorter. All the above a!ect critically the cost struc-ture of the enterprises. The increase of overheads incomparison to direct costs is outstanding in themanufacturing sector [1] and a need for an alloca-
tion in a more equitable manner among dissimilarproducts and customers is identi"ed [2,12,24]. It isworth saying that the extremely demanding marketcalls for products of higher quality and lowerprices. The slogan `the customer pays for only theservices he getsa clearly depicts the market pressure[3]. The new economic and competitive realities, asbusinesses evolve into the 1990s a!ect the manage-ment as well. The organization must adapt to thechanging environment in order to survive and therole of management information is fundamental toa more long-term development of managementcapability [4].
Management information must re#ect reality, bepredictive, embody strategy, explain cause ande!ect, re#ect the customer's perspective, determinethe relative pro"tability of both products and
0925-5273/00/$ - see front matter ( 2000 Elsevier Science B.V. All rights reserved.PII: S 0 9 2 5 - 5 2 7 3 ( 9 9 ) 0 0 0 8 0 - 8
customers, relate to the business processes, be in thelanguage of management.
Enterprise modeling and Activity Based Costing(ABC) try to satisfy the above needs, having theobjective of improving business performance andsustaining this improvement in the future. A lot ofsuccess stories have been reported [5,6] trying tode"ne the most appropriate implementation ina company. Information Technology (IT) has de"-nitely been an enabler of ABC [7] and has helpedits extensive use in Business Process Reengineering(BPR) projects [8].
It is well recognized in the literature that one ofthe most di$cult tasks in the development of anactivity-based cost system is the identi"cation anddesign of the activities that should be included inthe processes. Many modeling tools are availablenowadays, whether for incremental (TQM) orradical enterprise system analysis, redesign andimprovement (BPR). Enterprise modeling is an im-portant prerequisite for a successful BPR project[9]. Many di!erent methodologies exist, such asSADT, NIAM [10] or ARIS [11], all of themhaving the same purposes:
f to handle the complexity of the real world,f to precisely model the business processes with
sophisticated mapping techniques,f to be understandable, #exible and descriptive.
The integration of enterprise modeling withan activity-based cost system is recently beenstudied, the most popular approach being this ofIDEF-0 modeling with ABC. Many di!erent soft-ware programs, such as Activa, EasyABC,TRM/ACM, Pro"t Manager, DaCapo ProcessManager [12}14] combine modeling techniques,activity based costing and/or simulation. However,this kind of integration has not always beensuccessful.
ABC was treated as an accounting approach inthe context of strategic management accountingthat can help the company in planning, control,decision measuring and performance evaluation.No systematic search for the activities to reengineeror for the appropriate performance indicators andrelated cost drivers is included in the above soft-ware products.
In the following paragraphs, an account of workdone within the ESPRIT project REALMS (REen-gineering AppLication using Modeling & Simula-tion) will be presented. This project's goal was toprove that the integration of enterprise modeling,activity based costing (ABC) and simulation tosupport reengineering is feasible and would lead toconsiderable bene"ts for the industrial pilot users.
The long-term goal of the project is the develop-ment of an integrated methodology and softwaretool to support business process reengineering andbenchmarking in mid-sized European companies.No similar integrated tool existed up to now thatcombines di!erent scienti"c disciplines (SystemsAnalysis, Simulation, Cost Accounting, EngineeringEconomics, Management Consulting).
2. Approach
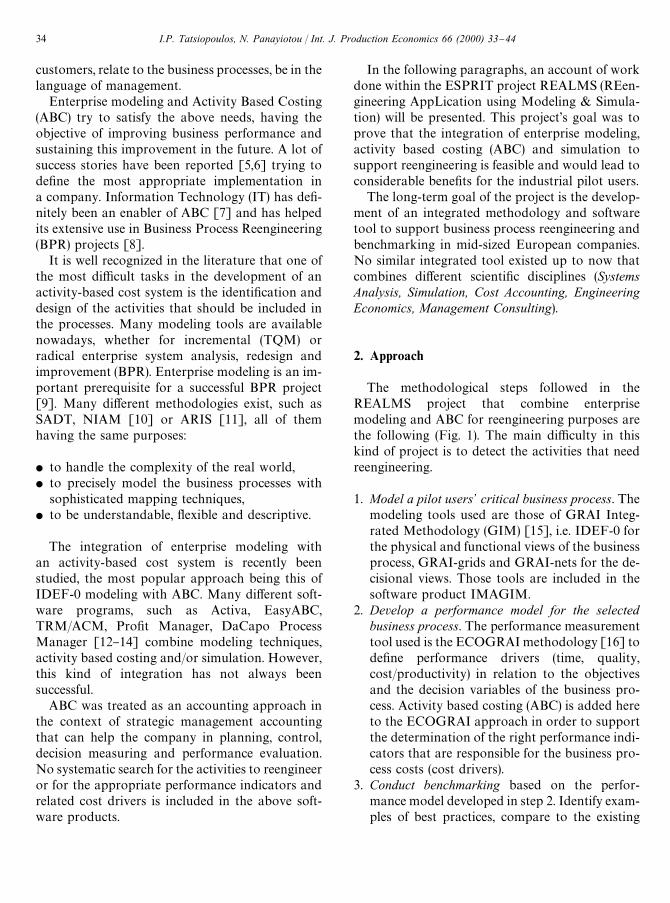
The methodological steps followed in theREALMS project that combine enterprisemodeling and ABC for reengineering purposes arethe following (Fig. 1). The main di$culty in thiskind of project is to detect the activities that needreengineering.
1. Model a pilot users+ critical business process. Themodeling tools used are those of GRAI Integ-rated Methodology (GIM) [15], i.e. IDEF-0 forthe physical and functional views of the businessprocess, GRAI-grids and GRAI-nets for the de-cisional views. Those tools are included in thesoftware product IMAGIM.
2. Develop a performance model for the selectedbusiness process. The performance measurementtool used is the ECOGRAI methodology [16] tode"ne performance drivers (time, quality,cost/productivity) in relation to the objectivesand the decision variables of the business pro-cess. Activity based costing (ABC) is added hereto the ECOGRAI approach in order to supportthe determination of the right performance indi-cators that are responsible for the business pro-cess costs (cost drivers).
3. Conduct benchmarking based on the perfor-mance model developed in step 2. Identify exam-ples of best practices, compare to the existing
34 I.P. Tatsiopoulos, N. Panayiotou / Int. J. Production Economics 66 (2000) 33}44
Fig. 1. Overview of the approach.
performance indicators and set targets to bepursued by the reengineering actions.
4. Evaluate reengineering targets. Those targets setin step 3 are usually expressed in the form ofoperational indicators (e.g. lead times, inventorylevels, etc.). Those indicators need to be trans-lated in "nancial terms, a task which is almostimpossible to be handled by traditional costaccounting systems. Two di!erent stages are de-"ned at this point: (a) evaluation of the proposedimprovement and (b) evaluation during the imple-mentation phase. Activity Based Costing (ABC)seems to be here the ideal approach to calculateReturn On Investment (ROI) coming from theimprovement of such operational indicators.
A more detailed description of those parts of theabove approach that require the integration of Activ-ity Based Costing is presented in the next paragraphs.
2.1. Model a pilot users' critical business process
Among the possible set of processes that repres-ent material/information #ows across the logisticschain, the Customer Order Flow [17] has beenchosen in this project as being the most critical
from the pilot users' point of view, in order to be thesubject of business modeling and reengineering.
The customer order #ow involves and cuts acrossthe sales, costing, product development, productionplanning and shipping/distribution functions of bothpilot industrial users. The two pilots are absolutelycomplementary across the value chain in the speci-"c user sector of semi-processing of non-ferrousmetals. ELVAL (GR) is a producer and supplier ofsemi-processed aluminum products, while TUBU-SMETALL (D) is a wholesaler of non-ferrous prod-ucts and a producer of components using semi-processed raw materials (Fig. 2). For both of themthe customer order #ow is of utter importance dueto the vast number of product varieties accordingto customer requirements.
The processing of customer orders considers thelogistics chain from the customer's request to thedelivery of the product. The "rst step is to calculatethe costs and the delivery date for a customerrequest concerning the capacity resources, the costsof raw material, etc. Further on, the price which willbe proposed to the customer has to be calculatedbased on the estimated costs.
The price and the date are "xed in the bid to thecustomer. On this basis the customer will negotiate
I.P. Tatsiopoulos, N. Panayiotou / Int. J. Production Economics 66 (2000) 33}44 35
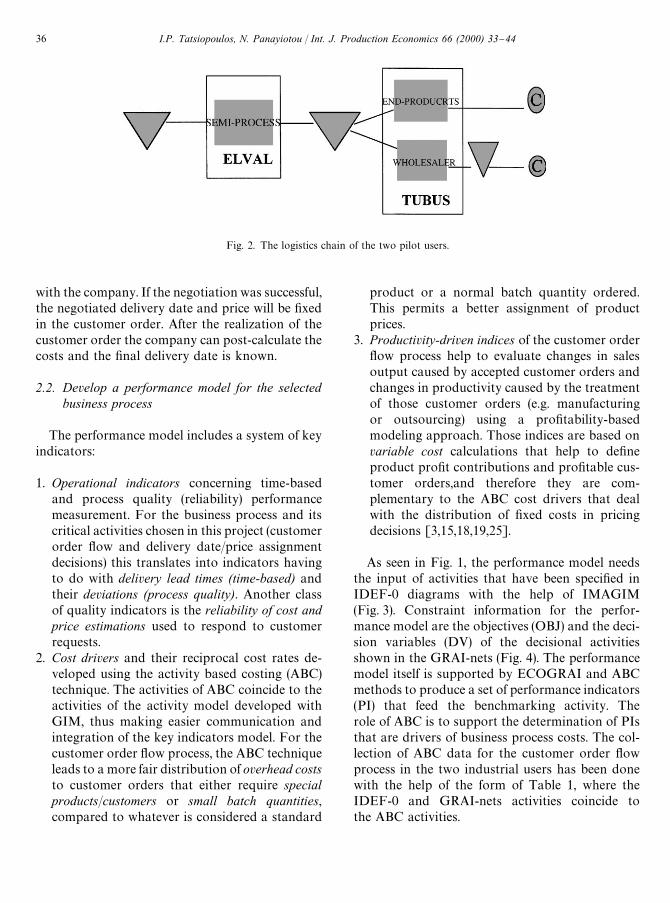
Fig. 2. The logistics chain of the two pilot users.
with the company. If the negotiation was successful,the negotiated delivery date and price will be "xedin the customer order. After the realization of thecustomer order the company can post-calculate thecosts and the "nal delivery date is known.
2.2. Develop a performance model for the selectedbusiness process
The performance model includes a system of keyindicators:
1. Operational indicators concerning time-basedand process quality (reliability) performancemeasurement. For the business process and itscritical activities chosen in this project (customerorder #ow and delivery date/price assignmentdecisions) this translates into indicators havingto do with delivery lead times (time-based) andtheir deviations (process quality). Another classof quality indicators is the reliability of cost andprice estimations used to respond to customerrequests.
2. Cost drivers and their reciprocal cost rates de-veloped using the activity based costing (ABC)technique. The activities of ABC coincide to theactivities of the activity model developed withGIM, thus making easier communication andintegration of the key indicators model. For thecustomer order #ow process, the ABC techniqueleads to a more fair distribution of overhead coststo customer orders that either require specialproducts/customers or small batch quantities,compared to whatever is considered a standard
product or a normal batch quantity ordered.This permits a better assignment of productprices.
3. Productivity-driven indices of the customer order#ow process help to evaluate changes in salesoutput caused by accepted customer orders andchanges in productivity caused by the treatmentof those customer orders (e.g. manufacturingor outsourcing) using a pro"tability-basedmodeling approach. Those indices are based onvariable cost calculations that help to de"neproduct pro"t contributions and pro"table cus-tomer orders,and therefore they are com-plementary to the ABC cost drivers that dealwith the distribution of "xed costs in pricingdecisions [3,15,18,19,25].
As seen in Fig. 1, the performance model needsthe input of activities that have been speci"ed inIDEF-0 diagrams with the help of IMAGIM(Fig. 3). Constraint information for the perfor-mance model are the objectives (OBJ) and the deci-sion variables (DV) of the decisional activitiesshown in the GRAI-nets (Fig. 4). The performancemodel itself is supported by ECOGRAI and ABCmethods to produce a set of performance indicators(PI) that feed the benchmarking activity. Therole of ABC is to support the determination of PIsthat are drivers of business process costs. The col-lection of ABC data for the customer order #owprocess in the two industrial users has been donewith the help of the form of Table 1, where theIDEF-0 and GRAI-nets activities coincide tothe ABC activities.
36 I.P. Tatsiopoulos, N. Panayiotou / Int. J. Production Economics 66 (2000) 33}44
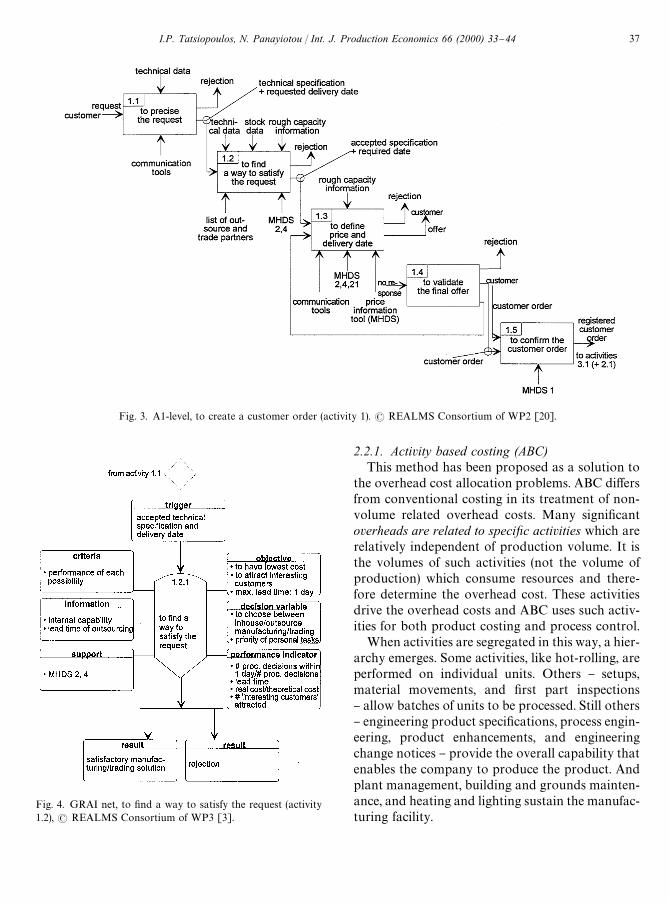
Fig. 3. A1-level, to create a customer order (activity 1). ( REALMS Consortium of WP2 [20].
Fig. 4. GRAI net, to "nd a way to satisfy the request (activity1.2), ( REALMS Consortium of WP3 [3].
2.2.1. Activity based costing (ABC)This method has been proposed as a solution to
the overhead cost allocation problems. ABC di!ersfrom conventional costing in its treatment of non-volume related overhead costs. Many signi"cantoverheads are related to specixc activities which arerelatively independent of production volume. It isthe volumes of such activities (not the volume ofproduction) which consume resources and there-fore determine the overhead cost. These activitiesdrive the overhead costs and ABC uses such activ-ities for both product costing and process control.
When activities are segregated in this way, a hier-archy emerges. Some activities, like hot-rolling, areperformed on individual units. Others } setups,material movements, and "rst part inspections} allow batches of units to be processed. Still others} engineering product speci"cations, process engin-eering, product enhancements, and engineeringchange notices } provide the overall capability thatenables the company to produce the product. Andplant management, building and grounds mainten-ance, and heating and lighting sustain the manufac-turing facility.
I.P. Tatsiopoulos, N. Panayiotou / Int. J. Production Economics 66 (2000) 33}44 37
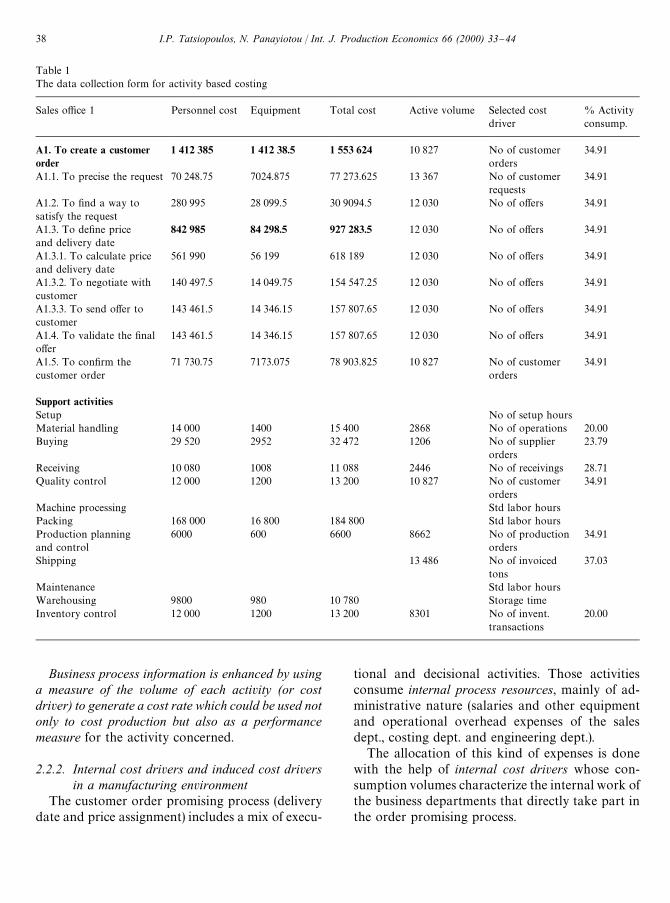
Table 1The data collection form for activity based costing
Sales o$ce 1 Personnel cost Equipment Total cost Active volume Selected costdriver
% Activityconsump.
A1. To create a customerorder
1 412 385 1 412 38.5 1 553 624 10 827 No of customerorders
34.91
A1.1. To precise the request 70 248.75 7024.875 77 273.625 13 367 No of customerrequests
34.91
A1.2. To "nd a way tosatisfy the request
280 995 28 099.5 30 9094.5 12 030 No of o!ers 34.91
A1.3. To de"ne priceand delivery date
842 985 84 298.5 927 283.5 12 030 No of o!ers 34.91
A1.3.1. To calculate priceand delivery date
561 990 56 199 618 189 12 030 No of o!ers 34.91
A1.3.2. To negotiate withcustomer
140 497.5 14 049.75 154 547.25 12 030 No of o!ers 34.91
A1.3.3. To send o!er tocustomer
143 461.5 14 346.15 157 807.65 12 030 No of o!ers 34.91
A1.4. To validate the "nalo!er
143 461.5 14 346.15 157 807.65 12 030 No of o!ers 34.91
A1.5. To con"rm thecustomer order
71 730.75 7173.075 78 903.825 10 827 No of customerorders
34.91
Support activitiesSetup No of setup hoursMaterial handling 14 000 1400 15 400 2868 No of operations 20.00Buying 29 520 2952 32 472 1206 No of supplier
orders23.79
Receiving 10 080 1008 11 088 2446 No of receivings 28.71Quality control 12 000 1200 13 200 10 827 No of customer
orders34.91
Machine processing Std labor hoursPacking 168 000 16 800 184 800 Std labor hoursProduction planningand control
6000 600 6600 8662 No of productionorders
34.91
Shipping 13 486 No of invoicedtons
37.03
Maintenance Std labor hoursWarehousing 9800 980 10 780 Storage timeInventory control 12 000 1200 13 200 8301 No of invent.
transactions20.00
Business process information is enhanced by usinga measure of the volume of each activity (or costdriver) to generate a cost rate which could be used notonly to cost production but also as a performancemeasure for the activity concerned.
2.2.2. Internal cost drivers and induced cost driversin a manufacturing environment
The customer order promising process (deliverydate and price assignment) includes a mix of execu-
tional and decisional activities. Those activitiesconsume internal process resources, mainly of ad-ministrative nature (salaries and other equipmentand operational overhead expenses of the salesdept., costing dept. and engineering dept.).
The allocation of this kind of expenses is donewith the help of internal cost drivers whose con-sumption volumes characterize the internal work ofthe business departments that directly take part inthe order promising process.
38 I.P. Tatsiopoulos, N. Panayiotou / Int. J. Production Economics 66 (2000) 33}44
However, the characteristic of the decisionalactivities of the order promising process in manu-facturing is that they seriously inyuence thefactory overhead expenses and the cost drivers offactory support activities. For example orderpromising decisions to accept special products in-#uence the product sustaining activities, and deci-sions to accept small orders in#uence the batch levelactivities. Consequently, we de"ne the so-called in-duced cost drivers of factory support activities(Table 1).
2.3. Target evaluation
This part of the approach follows benchmarking,where examples of best practices have been detec-ted and compared to the existing performance indi-cators of the industrial users. The outcome ofbenchmarking is a set of processes to reengineerwith their associated targets expressed in perfor-mance values.
The component productivity measures thatevaluate the performance of a single activity ora relatively small organizational unit (indicators)assist "rst-line managers in improving productivity.Goals are established for the productive use ofresources, and actual performance is compared tothe predetermined objectives. New thoughts on thissubject in relation to advanced manufacturing envi-ronments [21] claim that traditional summarymeasures of local performance } purchase pricevariances, direct labor and machine e$ciencies, ra-tios of indirect to direct labor, volume variances} are harmful and probably should be eliminated,since they con#ict with attempts to improve qual-ity, reduce inventories, and increase #exibility.Moreover, direct measurement is needed for qual-ity, process times, delivery performance, and anyother operating performance criterion that com-panies want to improve [22].
However, these operational measurements havesomehow to show ability to integrate with xnancialmeasurements in order to support the improvement ofthe company's bottom line. What is needed is a trans-lator of operational (or logistics) performance indi-cators into "nancial terms having to do with thepro"ts bottom line of the company. The role of thistranslator is played in our approach by ABC. The
sequence of reengineering targets evaluation duringthe REALMS project is as follows:
f Performance evaluation compares thedocumented targets expressed in the form ofperformance indicators to the actual perfor-mance of the two pilot users during the project.The improvement of performance indicators ismeasured at the pre-implementation phases bysimulation using the FEMOS system [22] andduring actual implementation in speci"c time-phased data collection steps. The performanceindicators include logistics measures as well ascost/productivity measures.
f Activity based costing is used to translate logis-tics measures into "nancial measures. It is theonly accounting method to measure and evalu-ate inventory and lead time policy costs usuallynot present in the formal cost accounting ledgers.
f Economic evaluation will provide "nancialmeasures at the enterprise level that in#uence the"nancial results of the pilot users' companies.This is the ROI (Return on Investment) of thesolutions implemented during the REALMSproject.
2.3.1. Proxtability modeling based on overhead costs(ABC)
Fig. 5 shows the basic pro"tability model used.The main di!erence from traditional engineeringeconomics models is that products do not consumeresources (production factors) directly (at the unitlevel). Instead, they consume resources throughactivities [26]. In our example the Customer Orderpromising process (A1. to create a Customer Order(C.O.), A12. to xnd ways to satisfy the request, A13. todexne delivery date & price according to the GIMactivity model) should guide the company to acceptcustomer orders that increase proxtability.
The use of activity based costing avoids the pit-falls of traditional costing practices, where standardproducts (in terms of product speci"cations, lotsizes and delivery conditions) subsidize specialproducts [23]. A more fair distribution of overheadcosts using activity based cost driver volumes re-sults in better pricing decisions: `Raise prices forcustomer orders that make heavy demands on
I.P. Tatsiopoulos, N. Panayiotou / Int. J. Production Economics 66 (2000) 33}44 39
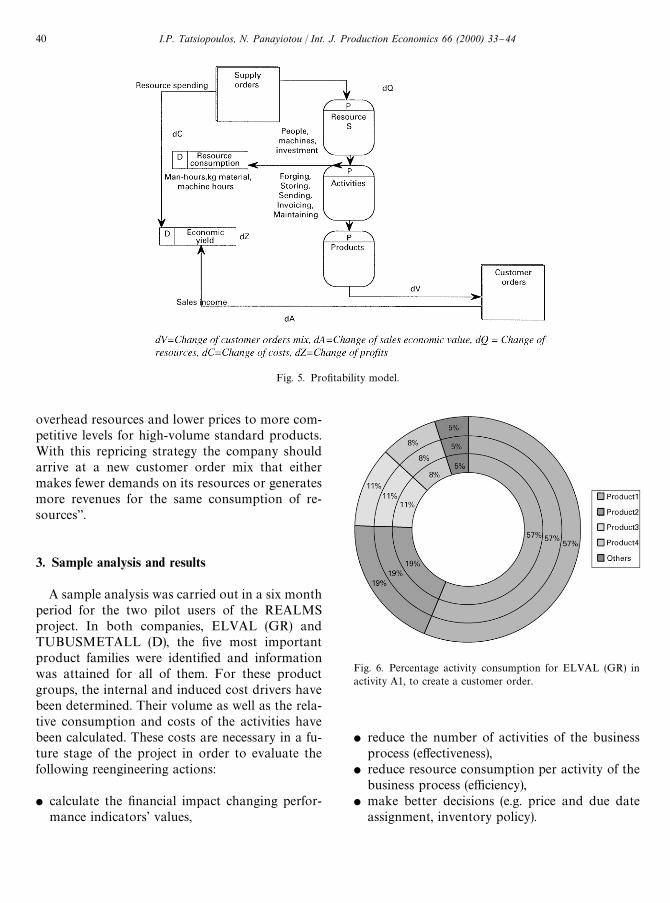
Fig. 5. Pro"tability model.
Fig. 6. Percentage activity consumption for ELVAL (GR) inactivity A1, to create a customer order.
overhead resources and lower prices to more com-petitive levels for high-volume standard products.With this repricing strategy the company shouldarrive at a new customer order mix that eithermakes fewer demands on its resources or generatesmore revenues for the same consumption of re-sourcesa.
3. Sample analysis and results
A sample analysis was carried out in a six monthperiod for the two pilot users of the REALMSproject. In both companies, ELVAL (GR) andTUBUSMETALL (D), the "ve most importantproduct families were identi"ed and informationwas attained for all of them. For these productgroups, the internal and induced cost drivers havebeen determined. Their volume as well as the rela-tive consumption and costs of the activities havebeen calculated. These costs are necessary in a fu-ture stage of the project in order to evaluate thefollowing reengineering actions:
f calculate the "nancial impact changing perfor-mance indicators' values,
f reduce the number of activities of the businessprocess (e!ectiveness),
f reduce resource consumption per activity of thebusiness process (e$ciency),
f make better decisions (e.g. price and due dateassignment, inventory policy).
40 I.P. Tatsiopoulos, N. Panayiotou / Int. J. Production Economics 66 (2000) 33}44
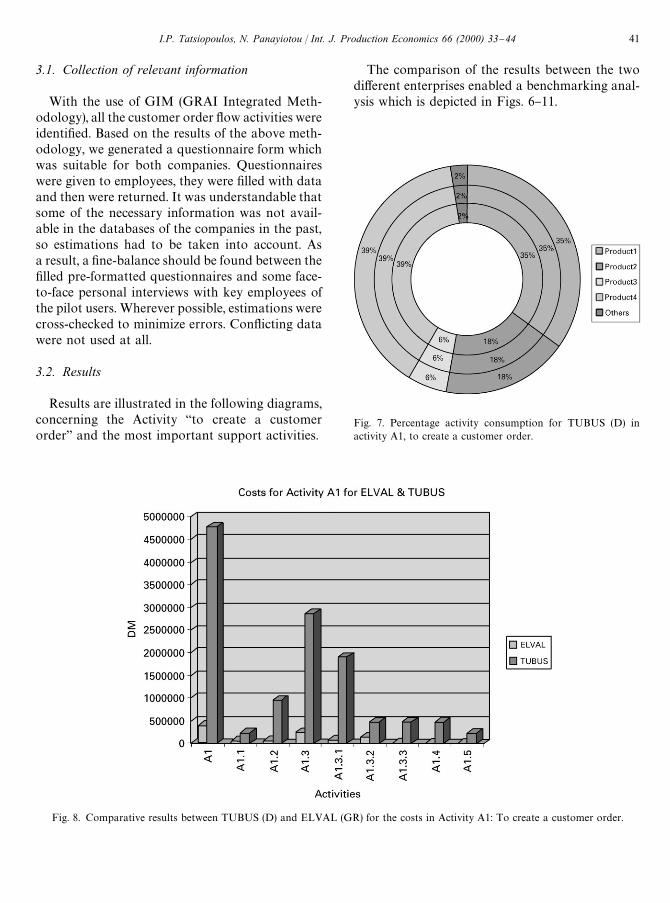
Fig. 8. Comparative results between TUBUS (D) and ELVAL (GR) for the costs in Activity A1: To create a customer order.
Fig. 7. Percentage activity consumption for TUBUS (D) inactivity A1, to create a customer order.
3.1. Collection of relevant information
With the use of GIM (GRAI Integrated Meth-odology), all the customer order #ow activities wereidenti"ed. Based on the results of the above meth-odology, we generated a questionnaire form whichwas suitable for both companies. Questionnaireswere given to employees, they were "lled with dataand then were returned. It was understandable thatsome of the necessary information was not avail-able in the databases of the companies in the past,so estimations had to be taken into account. Asa result, a "ne-balance should be found between the"lled pre-formatted questionnaires and some face-to-face personal interviews with key employees ofthe pilot users. Wherever possible, estimations werecross-checked to minimize errors. Con#icting datawere not used at all.
3.2. Results
Results are illustrated in the following diagrams,concerning the Activity `to create a customerordera and the most important support activities.
The comparison of the results between the twodi!erent enterprises enabled a benchmarking anal-ysis which is depicted in Figs. 6}11.
I.P. Tatsiopoulos, N. Panayiotou / Int. J. Production Economics 66 (2000) 33}44 41
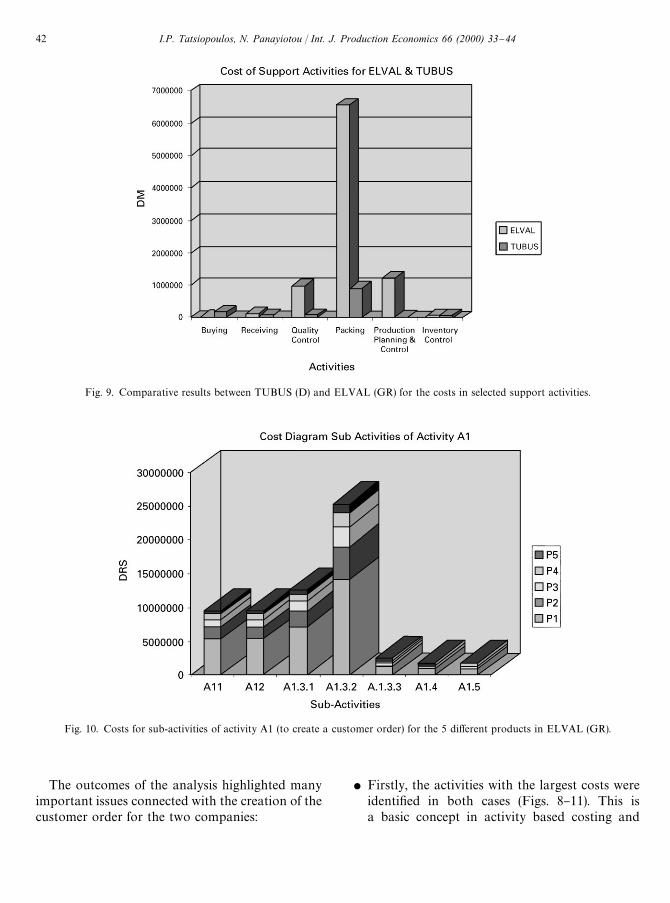
Fig. 9. Comparative results between TUBUS (D) and ELVAL (GR) for the costs in selected support activities.
Fig. 10. Costs for sub-activities of activity A1 (to create a customer order) for the 5 di!erent products in ELVAL (GR).
The outcomes of the analysis highlighted manyimportant issues connected with the creation of thecustomer order for the two companies:
f Firstly, the activities with the largest costs wereidenti"ed in both cases (Figs. 8}11). This isa basic concept in activity based costing and
42 I.P. Tatsiopoulos, N. Panayiotou / Int. J. Production Economics 66 (2000) 33}44
Fig. 11. Costs for sub-activities of activity A1 (to create a customer order) for the 5 di!erent products in TUBUS (D).
activity based management saying that cost canbe reduced where cost occurs.
f The cost was allocated to di!erent products andactivities. This helped the organization to createa clearer picture of the cost per product sold(Figs. 10 and 11).
f The cost of creation of one customer o!er andorder could be calculated (using informationfrom Table 1), giving a good productivity indica-tion of the process. This analysis could not beeasily carried out with a di!erent approach.
f The cause of cost in each activity was found withthe analysis of di!erent cost drivers for everyactivity and product (Figs. 6 and 7).
f Finally, the di!erentiation of the two companiescould be explained by the generation ofbenchmarking analyses per product in an activ-ity level, for the creation of the customer orderprocess.
References
[1] G. Perrin, Murphy, Accounting for Managers, Chapman& Hall, London, 1994.
[2] J. Innes, F. Mitchell, Activity Based Costing. A Reviewwith Case Studies, CIMA, 1990.
[3] REALMS Consortium, WP3 } A Benchmarking Model,1996.
[4] J. Bellis, N. Develin, Activity based cost management,Accounting Digest 281 (1992).
[5] T.N. Mangan, Integrating an activity-based cost system,Journal of Cost Management 8 (4) (1995) 5}13.
[6] A.W. Rupp, ABC: A pilot approach, ManagementAccounting (1995) (January) 50}55.
[7] T.R. Compton, Using activity-based costing in yourorganization } Part 2, Journal of Systems Management(1994) (April) 36}39.
[8] G. Cokins, Finding the crossroad to change, Bobbin (1994)(August) 50}55.
[9] J. Brown, D. O'Sullivan, Reengineering the Enterprise,Chapman & Hall, London, 1995.
[10] M. Zgorzelski, P. Zeno, Flowcharts, Data#ows,SADT, IDEF0 and NIAM for Enterprise Engineering,IFIP, 1995.
[11] M. Daneva, M. Krumker, ARIS-based Framework forEnhancing Reference Models: Experience in SimultaneousBid Preparation, IFIP, 1995.
[12] R. Cooper, R.S. Kaplan, The Design of Cost ManagementSystems, Text, Cases, and Readings, Prentice-Hall, Engle-wood Cli!s, NJ, 1992.
[13] J.P. Borden, Activity-based management software, Journalof Cost Management 7 (4) (1994) 39}47.
[14] T.G. Greenwood, M. Reeve, Process cost management,Journal of Cost Management 7 (4) (1994) 4}19.
[15] G. Doumeingts, Methode GRAI, Methode de Conceptiondes Systemes en Productique, These d' etat en Sciences,Universite Bordeaux I.
I.P. Tatsiopoulos, N. Panayiotou / Int. J. Production Economics 66 (2000) 33}44 43
[16] G. Doumeingts, F. Clave, Y. Ducq, ECOGRAI} A method to design and to implement performancemeasurement systems for industrial organizations, in: A.Rolstadas (Ed.), Benchmarking } Theory and Practice,Chapman & Hall, London, 1995.
[17] A. Rolstadas, Manufacturing industry benchmarking, in:I. Pappas, I.P. Tatsiopoulos (Eds.), Advances in ProductionManagement Systems, North-Holland, Amsterdam, 1993.
[18] S. Eilon, G. Cosmetatos, A pro"tability model for tacticalplanning, Omega 5 (6) (1977).
[19] G. Cosmetatos, S. Eilon, Analysis of unit cost } A model-ling approach, in: P. Falster, A. Rolstadas (Eds.), Produc-tion Management Systems, IFIP, North-Holland,Amsterdam, 1981, pp. 167}178.
[20] REALMS Consortium, WP2 }Modelling a Critical Busi-ness Process, ELVAL SA, Athens, 1996.
[21] R.S. Kaplan, Measures of Manufacturing Excellence,Harvard Business School Press, Boston, MA, 1990.
[22] G. Zuelch, Th. Grobel, U. Jonsson, Indicators for theevaluation of organizational performance, in: A. Rolstadas(Ed.), Benchmarking } Theory and Practice, Chapman andHall, London, 1995.
[23] R. Cooper, R.S. Kaplan, Pro"t priorities from activity-based costing, Harvard Business Review (May/June)(1991).
[24] C. Berliner, J.A. Brimson (Eds.), Cost Managementfor Today's Advanced Manufacturing, The CAM-I Con-ceptual Design, Harvard Business School Press, Boston,1989.
[25] G. Cosmetatos, S. Eilon, E!ects of productivity de"nitionand measurement on performance evaluation, EuropeanJournal of Operational Research 14 (1983) 31}35.
[26] J.A. Theeuwes, J.K. Adriaansen, Towards an integratedaccounting framework for manufacturing improvement,International Journal of Production Economics 36 (1994)85}96.
44 I.P. Tatsiopoulos, N. Panayiotou / Int. J. Production Economics 66 (2000) 33}44


![[PPT]PowerPoint Presentation - Directory UMM : …directory.umm.ac.id/Data Elmu/ppt/presentasi_bab_01.ppt · Web viewPENDAHULUAN PENGERTIAN STATISTIKA Oleh: Muhammad Jihadi OUTLINE](https://img.pdfslide.net/doc/110x75/5b9c13aa09d3f2f94c8be8e0/pptpowerpoint-presentation-directory-umm-elmupptpresentasibab01ppt.jpg)