Embed Size (px)
Citation preview
The Integration of Plant Condition Assessment with Risk Management
Programmes
John LILLEY, Veritec Sonomatic, Warrington, U.K.
Abstract. Risk management programmes such as Risk-Based Inspection (RBI) and Non-Invasive Inspection (NII) deal with failure probabilities, and generate inspection workscopes to mitigate some of the risk [1] of plant operation. This is achieved by providing information on the presence and stage of advancement of pertinent degradation processes. The reliabilities of inspection techniques in common use are often over-stated, but increasingly, the concept of Probability of Detection (POD) for a range of inspection techniques is being applied to link the reliability of inspection with the requirements of the risk management programme. POD values are frequently derived from round robin exercises and trials, but there are further steps which need to be taken when applying this concept to ensure that the differences between trial and site conditions are taken into consideration.
1. Introduction
Risk Based Inspection (RBI) planning programmes generate inspection workscopes to mitigate the risk of equipment failure by providing information on the status of active degradation mechanisms. Frequently these are carried out non-intrusively (NII) and differ significantly from historical intrusive inspection regimes. The deviation from prescriptive, typically 3 yearly, internal visual inspection supplemented with selective NDT techniques and pressure test, to a less frequent interval (possibly as much as 8 or 12 years), based predominantly upon ultrasonic inspection techniques inevitably leads to an increased reliance on the performance of NDT. It has been common practice to take code-compliant ultrasonic inspection procedures and to apply these to in-service situations. The danger here is that the procedures originate from a Quality Control perspective of pre-service inspection and the techniques, sensitivity levels and reporting criteria may not be suited to the degradation mechanisms of concern. There has been a growing trend to apply POD (Probability of Detection) curves to risk-based methods [2]. Volker et al describe a POD generator, a component of which is an inspection model that takes inspection performance into account. Wall et al [3] describe the need for human reliability models and make reference to the PISC III [4] human reliability studies, but these need to truly reflect true field conditions in order to support the risk management process effectively. There is a widespread misperception of the reliability of manually applied NDT procedures. Equally, there is a tendency for trial data to be assumed to be representative of field conditions. In general, routinely applied conventional, manual NDT procedures are far less effective than widely assumed [5]. Add to this the ‘site factor’ and it becomes evident that the performance of manual UT in particular is especially poor. This could lead
ECNDT 2006 - We.1.2.5
1
to the conclusion that risk-based methods are unsupportable, but in most cases control measures and technical modifications can be applied to a procedure in order to achieve the desired level of confidence in risk mitigation.
2. Probability of Detection (POD)
2.1 POD Curves
POD data has been generated over a number of years through trials by several organisations across a range of industries. They are well established for instance, in the aerospace industry [6] to support risk-based inspection planning processes. Work carried out in the oil & gas industry by the UK Health & Safety Industry (H&SE), PANI (Programme for the Assessment of NDT in Industry [7], The Dutch Welding Institute (NIL) [8], and NORDTEST [9] all point to a 50% POD for commonly applied conventional MT, PT and UT procedures. These studies have been summarized in the H&SE document POD/POS Curves for NDE [10]. POD curves are generated either through practical trials, expert elicitation or by modelling. Practical trials involve the analysis of a statistically significant number of operator/flaw interactions covering a range of flaw sizes. The percentage detection probability for each flaw size is plotted graphically.
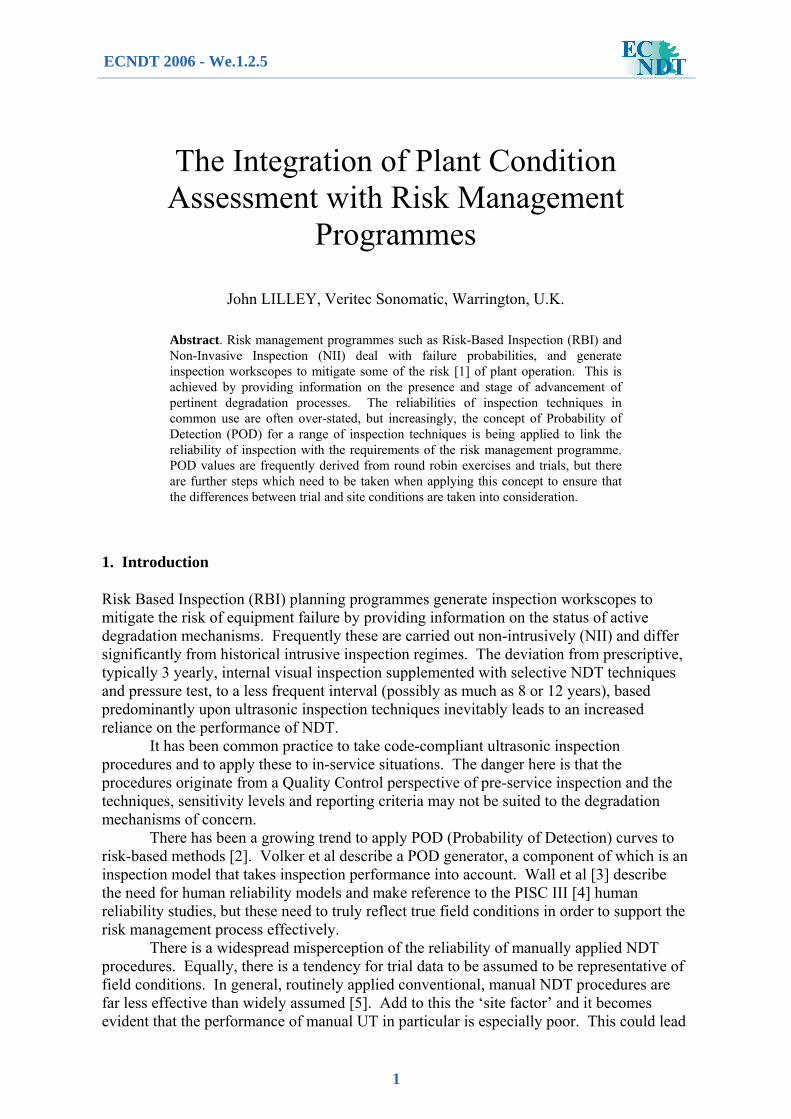
Figure 1. A POD reference curve for visual inspection of vessel internal corrosion pitting.
The hypothetical POD curve shown in Figure 1 is for the close visual inspection of a pressure vessel internal surface for the detection of isolated pitting, and has been drawn up by expert elicitation. In this case it shows the minimum detectable pit size is just over 0.25mm, but at this depth pits only just become detectable. By 0.5mm in depth only around 10% will be detectable. By 1mm in depth it is judged that 60% are detectable and by 2mm the maximum detection probability of 90% is achieved. This is our reference curve for internal visual testing. It could be argued that actual visual testing efficiency may have been lower than this (we have no means of assessing what was missed in the past – especially at the lower end of the scale), but this curve represents a detection probability distribution that we believe we can live with moving forwards, i.e. one which will be meaningful in the context of probabilistic failure analysis. It should be borne in mind that the inspection at this level of integrity was historically applied every three years. It is a natural tendency to assume that all flaws equal to or exceeding the dimensions of a widely accepted minimum detectable flaw size will be detected with 100% confidence at all times, i.e. a detection threshold. This is particularly prevalent amongst non-NDT staff, even those with high levels of engineering qualification. In an ideal world 100% reliability would be the case, but in real life there is a lower probability of detecting a flaw the closer it is to the lower limit of detection, and the POD increases with flaw size up
1.0 2.0 3.0 4.0 5.0 6.0
90%
50%
REFERENCE POD CURVE - VT
10%Prob
abili
ty O
f Det
ectio
n (P
OD
)
Defect height (mm)1.0 2.0 3.0 4.0 5.0 6.0
90%
50%
REFERENCE POD CURVE - VT
10%Prob
abili
ty O
f Det
ectio
n (P
OD
)
Defect height (mm)
2
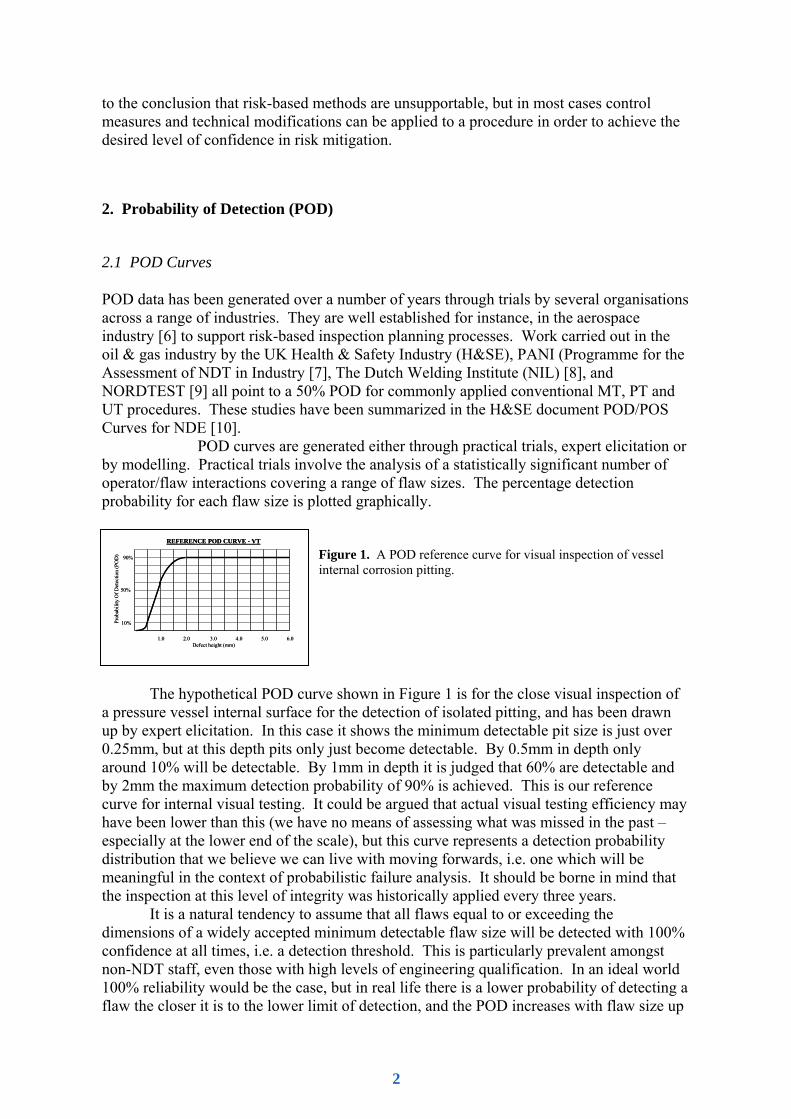
to a given size where a plateau is reached. This follows common sense and has been demonstrated through numerous practical trials. See previous references. Why does the curve never reach 100%? Good question. No inspection is ever 100% infallible. There will always be room for error and in the case of an internal visual vessel inspection this might include for example, inaccessible regions due to vessel internals, inadequate cleaning or poor lighting conditions. Other causes could be more human in nature such as the inspector having forgotten or lost his or her reading glasses, lack of concentration, having ‘missed a bit’ (who hasn’t done this when painting?), loss of inspection records or even getting vessel identification details mixed up. Extrapolating this to other inspections, there may also be technical reasons why a particular NDT technique may be incapable of detecting a particular type or location of flaw. Let us now consider that the internal visual inspection has been substituted by an external, on line ultrasonic inspection for the detection of internal corrosion pitting. Figure 2 shows a theoretical POD curve for UT based on trial data without taking human factors into account. The sensitivity of ultrasonic testing for shallow pits is not as great as it is for visual inspection. The sloped portion of the curve is therefore shifted to the right when compared to the curve in Figure 1. Pits of 0.5mm in depth are un-detectable with UT due to the resolution of the equipment used, 1mm deep pits are detectable only with a 10% probability, 1.5mm at 53% probability, 2mm at 75% probability with a maximum of only 80% for a 2.5mm deep pit. The 80% POD is in this case explained by the likelihood that some pits to have conical characteristics which do not lend themselves to detection by UT, but this would not affect detection by visual means. The technical factors which influence the ability to detect corrosion pitting by conventional 0° UT can be modelled and include the flaw morphology, the probe frequency & beam characteristics, scan resolution, etc. Trials such as PISC III [4] and NIL [7] have demonstrated that human error factors have a significant impact on the reliability of NDT and these will have the effect of lowering the overall curve. The NIL study showed a drop in the plateau from 80% for a fully automated UT weld inspection procedure to 50% for the same procedure applied manually.
Figure2. Reference POD curve for automated UT (excludes human factors).
Figure 3. Reference POD curve for automated UT (bold) and manual UT (dashed) based on trial data.
It needs to be taken into account that trials are generally carried out on clear-cut specimens containing distinctive flaws under laboratory conditions where everyone is aware they are under scrutiny. In real life inspections are not carried out like this. There is often no immediate supervision, control or checking of anyone’s work. Inspectors are often under pressure to complete their work, working conditions can be very poor and boredom
1.0 2.0 3.0 4.0 5.0 6.0
50%
REFERENCE POD CURVE - UT
10%
90%
Prob
abili
ty O
f Det
ectio
n (P
OD
)
Defect height (mm)1.0 2.0 3.0 4.0 5.0 6.0
50%
REFERENCE POD CURVE - UT
10%
90%
Prob
abili
ty O
f Det
ectio
n (P
OD
)
Defect height (mm)
1.0 2.0 3.0 4.0 5.0 6.0
50%
REFERENCE POD CURVE - UT
10%
90%
Prob
abili
ty O
f Det
ectio
n (P
OD
)
Defect height (mm)1.0 2.0 3.0 4.0 5.0 6.0
50%
REFERENCE POD CURVE - UT
10%
90%
Prob
abili
ty O
f Det
ectio
n (P
OD
)
Defect height (mm)
3

can play a huge factor in the integrity of inspections carried out. Inspectors may have worked for many years without supervision or cross-checking and excessive pressures on productivity and the cost of inspection are the norm rather than the exception. These can all have detrimental effects. Some parametric studies [4] have evaluated the effects of poor scanning techniques, length of shift, shift patterns, effect of certification levels, etc, but none of them take into account the realistic difference between a polished, scrubbed up senior technician participating in an international laboratory based round robin exercise where the entire NDT world scrutinises the results compared to a disgruntled, underpaid, tired UT operator working under dirty conditions, possibly in an extremely hot, cold or windy environment for year after year.
The PISC III human reliability studies [4] addressed some of the factors described above by simulating a nuclear power station environment involving an ambient temperature of 27ºC, humidity in the region of 40% to 50% and a background noise level of 80dB. It should be noted that the samples used were ground flush and mounted in frames. Nevertheless, the report states “Working long shifts in an environment typical of industrial practice, can cause tiredness and de-motivation for some inspectors, and these factors can have a profound effect on human reliability”. The work carried out in this study provides a valuable measure of the effect on inspection reliability for a given set of environmental conditions. This supports extrapolation to judgemental assessments of the differences in effects of variations in environmental conditions such as working on a refinery shutdown in dirty conditions with poorly prepared test surfaces in a night shift in the middle of winter with an absence of supervision or surveillance. On occasions in practice, inexperienced or poorly trained operators are used. Everyone has to start somewhere! Admittedly, some trials have simulated certain aspects of site conditions by placing samples high up, low down or at awkward angles, but none of this can realistically compensate for the ‘site factor’. The limitation of trials is that they are costly to set up and are time consuming. It would be impractical to perform trials covering every inspection situation. Alternative approaches to the derivation of POD curves are expert panels and modelling.
2.2 Expert panel
An expert panel can be used to take existing POD curves and, using expert elicitation, establish the effect of the application of the procedure in question on the shape and position of the existing POD curves. This is clearly judgemental in nature, but techniques are available to help provide structure to the process, particularly in the field of human reliability performance assessment.
Examples of the factors to be evaluated are included in 2.4 below. It is important that expert panels include participants who are personally experienced with all aspects of the working environment and also have a working knowledge of probabilistic methods. There must also be an element of independence. It is a mistake to have panels made up of highly qualified engineers who are lacking in field experience or to use inspectors too closely linked to the application.
2.3 Modelling
Some organisations have developed models to theoretically derive POD curves [2] & [3]. These references give descriptions of the excellent work carried out to calculate the theoretical probability of being able to detect a given flaw. Theoretical models tend to start
4

with a flaw specification and use mathematical principles based on the resolution of measurement, number and direction of beam angles deployed, sensitivity levels used, number of interactions, etc, to generate a probabilistic distribution of the ability of a technique to detect the defined flaw(s) based on the assumption that the technique will be applied perfectly on each occasion. The use of modelling very effectively addresses the issue of whether the underlying technique is fit for purpose as it starts with a detailed flaw description and systematically evaluates the detectability of that flaw using the chosen procedure. This effectively overcomes the potential pitfall of application of code-compliant, construction based procedures. The authors recognise the importance of human error or variables of interpretation, and suggest that corrections should be made to account for this, but no detail is provided in the literature of the specific impact of human error on POD curves.
2.4 The Effect of Field Conditions on POD Curves
A suggested method for the determination of the effect of field conditions on POD curves is to form an expert panel and evaluate each of the contributors to inspection reliability individually. This can be achieved by selecting a POD curve generated from trial data using the closest POD curve to the conditions in hand as possible. The Trial-based POD curve is then broken down into the individual influential factors which collectively contribute to the data. These influential factors are then compared to the factors present during the inspection under consideration. A ranking and scoring system can then be applied to assess the effects on the curve of site variances compared to trial conditions. Additional factors may also be considered if relevant.
Typical factors are as follows:
a) Working environment
b) Production pressures
c) Access conditions
d) Surface condition
e) Component temperature
f) Interpretative skills required (complexity)
g) Operator skill level
h) Hand – to – eye co-ordination
i) Familiarity
j) Diligence (supervision)
k) Repetition, including coverage of large areas
The above list is not exhaustive. It will be found that some factors affect the ability to detect small flaws, and will hence influence the origin or slope of the lower regions of the curve, and others will affect the slope and/or the plateau of the curve.
5
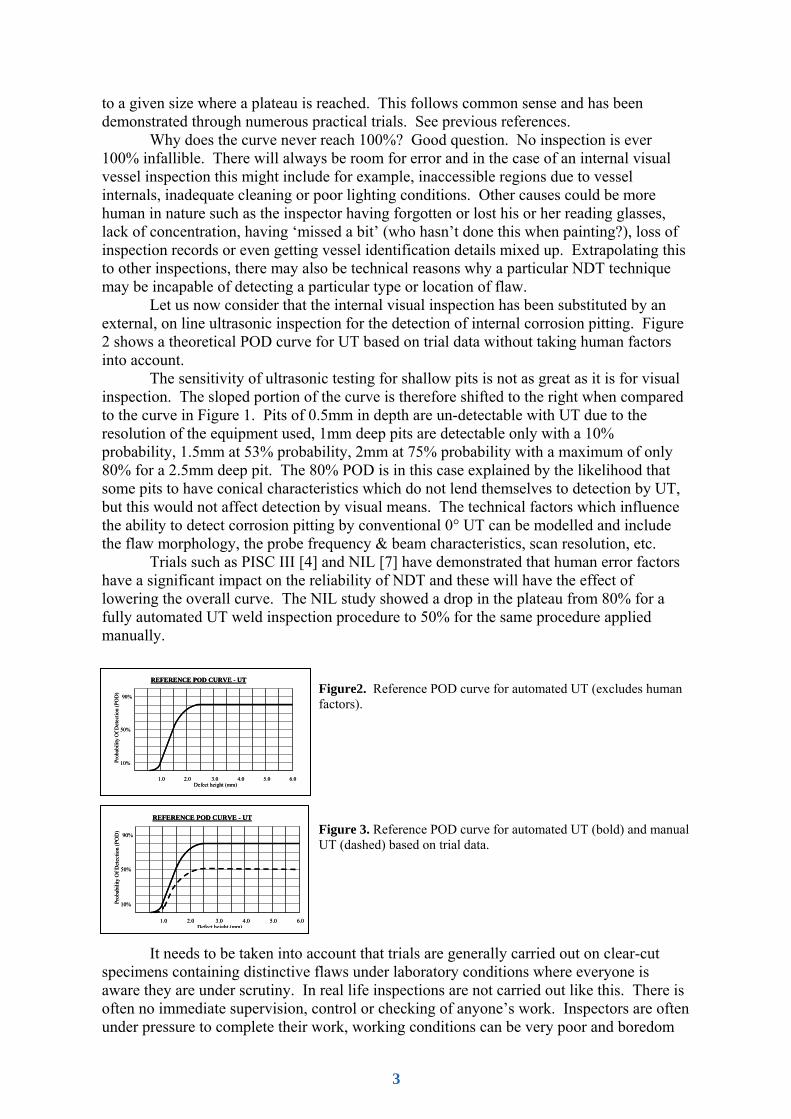
Figure 4. Reference POD curve for UT. Solid line = Automated UT curve.
Dashed line = Manual UT curve (trials) Dotted line = Manual UT curve (site)
3. Suggested Means of Improvement
3.1 Assessment of Parent material
Clearly, the manual UT POD curve (Figure 4) falls short of the original visual inspection POD curve (Figure 1) that we set out to achieve. It should also be borne in mind that under a non-invasive risk management programme the proposed UT survey would only be carried out over a relatively small area compared to the extent of inspection achieved through invasive methods (see next section). As previously mentioned, there are two fundamental reasons for the differences between figures 1 & 4. Firstly, UT is not as sensitive as visual inspection for the detection of small pits and secondly, it is not as reliable. The first issue, sensitivity could be addressed by the supplementary use of the Time-Of-Flight-Diffraction (TOFD) technique as diffracted signals are generated at the tips of conical pits which could go undetected using a conventional compression probe. Alternatives are the use of focused probes, possibly phased arrays, and/or the use of higher sensitivity settings. The second issue, human reliability can be addressed by either tighter controls over manual inspection, addressing in particular the factors listed in the previous section, or by mechanisation of the inspection as this by definition eliminates most of the human factor influences. Mechanisation also provides hard copy evidence of coverage and coupling efficiency.
Figure 5 shows a corrosion map of a pipeline (top left) which illustrates a Flow Assisted Corrosion (FAC) pattern and a localised, large pit (enlarged at bottom centre). A TOFD scan across the pit (top right) provides additional information. Firstly, the ligament measurement from the tip of the pit is correlated to the measurement taken form the corrosion map for confirmation purposes. Secondly, the TOFD data confirms that there are no sharp vertical components (cracks, sharp texture) which might not have been picked up by pulse-echo reflection. Thirdly, the TOFD back-wall echo on either side of the pit provides detail of the corrosion activity. The back-wall to the left of the pit has more half cycles than the back wall on the right and the half cycles that are present are more evenly aligned. This shows that the upstream corrosion (left) is less advanced than the downstream corrosion. The roughened surface texture (to the right of the pit) causes scattering of the back-wall echo, reducing its intensity or amplitude. In this case, both signals are saturated, but the loss of energy is evident by the reduction in the number of half cycles in the pulse train. This correlates well with the original corrosion map, but additional information is provided by the TOFD data. Interestingly, the post back-wall tails in the mode-converted echoes (lower set of data in the TOFD image) show evidence of a roughened surface. This ‘textural’ information is has the potential to narrow the gap between the qualitative information typically obtained during internal visual inspections (e.g. comments on signs of corrosive activity).
1.0 2.0 3.0 4.0 5.0 6.0
50%
REFERENCE POD CURVE - UT
10%
90%
Prob
abili
ty O
f Det
ectio
n (P
OD
)
Defect height (mm)1.0 2.0 3.0 4.0 5.0 6.0
50%
REFERENCE POD CURVE - UT
10%
90%
Prob
abili
ty O
f Det
ectio
n (P
OD
)
Defect height (mm)
6
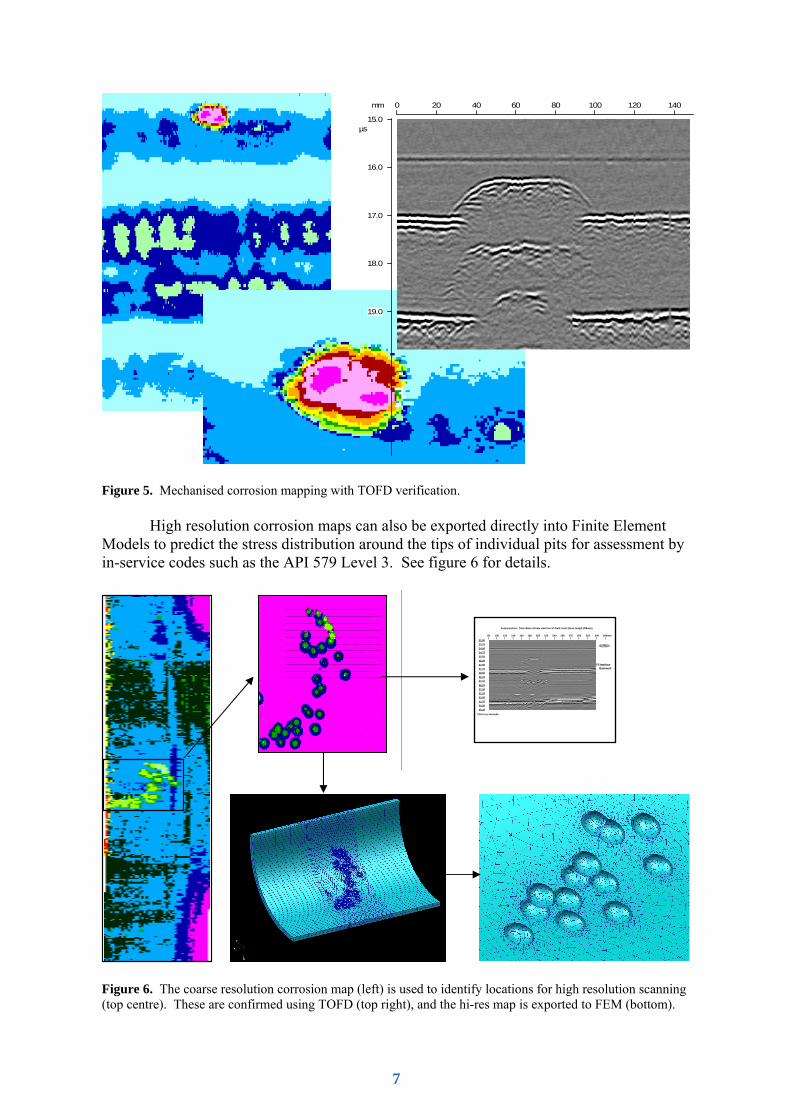
Figure 5. Mechanised corrosion mapping with TOFD verification. High resolution corrosion maps can also be exported directly into Finite Element
Models to predict the stress distribution around the tips of individual pits for assessment by in-service codes such as the API 579 Level 3. See figure 6 for details.
Figure 6. The coarse resolution corrosion map (left) is used to identify locations for high resolution scanning (top centre). These are confirmed using TOFD (top right), and the hi-res map is exported to FEM (bottom).
mm 0 20 40 60 80 100 120 140
µs15.0
16.0
17.0
18.0
19.0
22.5023.2524.0024.7525.5026.2527.0027.7528.5029.2530.0030.7531.5032.2533.0033.7534.5035.25
Axial position, from down stream weld toe of Field Joint (Scan length 280mm)
80 100 120 140 160 180 200 220 240 260 270 300 320 340 360mm | | | | | | | | | | | | | | |
Time in µ seconds.
SS Interface Backwall
Surface
12
7
3.2 Assessment of welds
The studies mentioned previously which cover weld inspection tend to be oriented towards all types of flaw, some of which may be either of pre- or in-service origin, and others which are clearly of pre-service origin. There tends to be a bias in the studies towards code-compliant inspection rather than inspections targeted at specific forms of in-service degradation. However, some interesting information can be derived from the work carried out. The NIL study [8] for example, involved the examination of 16 welds in plate material between 6mm and 15mm thick containing 157 artificial, yet highly realistic flaws. The flaw lengths were all equal and were larger than 10mm. Flaw heights were generally between 1mm and 4mm. Welding was single V with a 55° prep’ angle with TIG root/cap and MMA fill. Flaw types were:
• Lack of penetration • Lack of penetration with high/low • Lack of fusion (LOF) with various depth position • Slag inclusions at various depths, incl some complex slag.LOF • Gas inclusions, either at bottom or top of weld • Cracks: crater and thermal cracks
Altogether, the NIL study evaluated 11 different inspection techniques. The report
does not provide technical detail of all of the techniques or the procedures used, but the author is familiar with MicroPlus TOFD, MicroPlus Pulse-Echo (PE), Manual UT, X-RT, γ-RT & Bevel X-RT so these will be discussed further. It should be noted that the MicroPlus PE technique was simply a mechanised form of the Manual PE procedure.
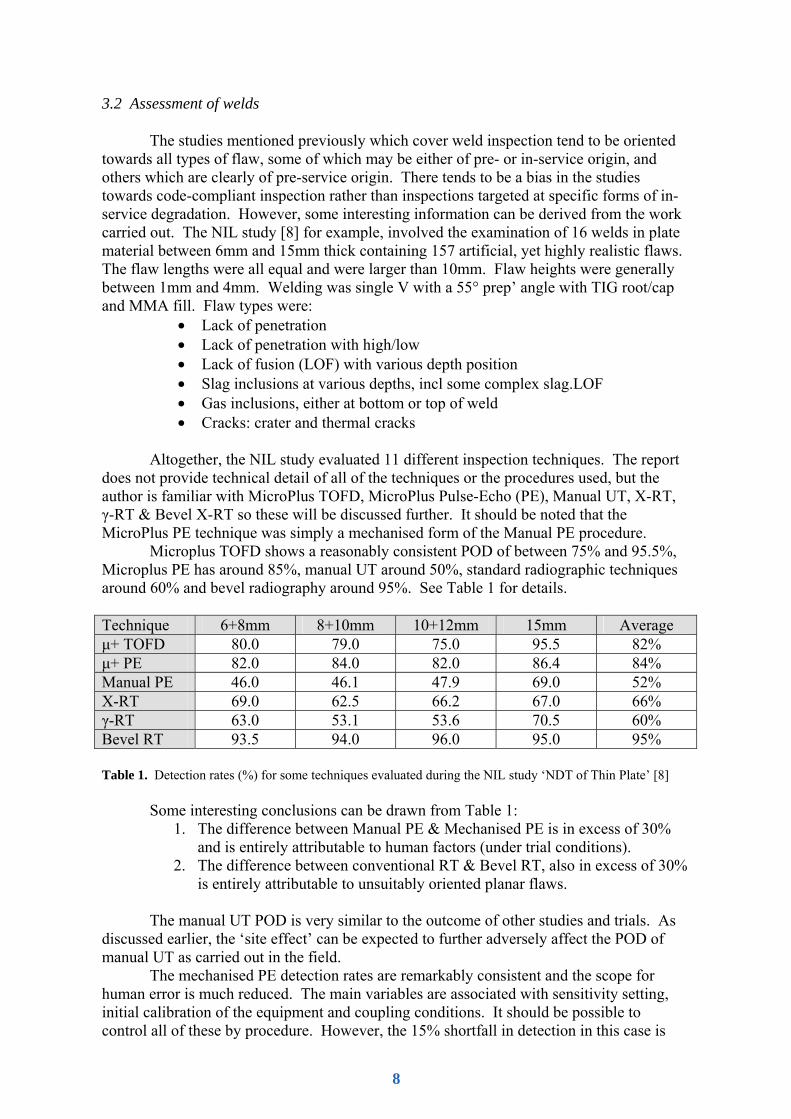
Microplus TOFD shows a reasonably consistent POD of between 75% and 95.5%, Microplus PE has around 85%, manual UT around 50%, standard radiographic techniques around 60% and bevel radiography around 95%. See Table 1 for details.
Technique 6+8mm 8+10mm 10+12mm 15mm Average μ+ TOFD 80.0 79.0 75.0 95.5 82% μ+ PE 82.0 84.0 82.0 86.4 84% Manual PE 46.0 46.1 47.9 69.0 52% X-RT 69.0 62.5 66.2 67.0 66% γ-RT 63.0 53.1 53.6 70.5 60% Bevel RT 93.5 94.0 96.0 95.0 95% Table 1. Detection rates (%) for some techniques evaluated during the NIL study ‘NDT of Thin Plate’ [8]
Some interesting conclusions can be drawn from Table 1:
1. The difference between Manual PE & Mechanised PE is in excess of 30% and is entirely attributable to human factors (under trial conditions).
2. The difference between conventional RT & Bevel RT, also in excess of 30% is entirely attributable to unsuitably oriented planar flaws.
The manual UT POD is very similar to the outcome of other studies and trials. As
discussed earlier, the ‘site effect’ can be expected to further adversely affect the POD of manual UT as carried out in the field.
The mechanised PE detection rates are remarkably consistent and the scope for human error is much reduced. The main variables are associated with sensitivity setting, initial calibration of the equipment and coupling conditions. It should be possible to control all of these by procedure. However, the 15% shortfall in detection in this case is
8
most probably due to technical factors, i.e. some flaws, although technically rejectable to the construction code, do not exhibit suitable reflective characteristics to be rejectable ultrasonically. No matter how many times the inspection is repeated, this type of flaw will remain undetected.
The TOFD results show detection rates of between 75% and 95.5%. It is not clear from the report the extent to which the non-detection is attributable to human factors of interpretation or physical limitations of the technique. It is reasonable to assume that human factors will be minimal due to the nature of the flaws in the specimens (similar number of flaws of equal length in each specimen). Therefore the undetected flaws are most probably due to technical reasons (e.g. indications obscured by the lateral wave or beyond the back-wall such as excess penetration).
3.3 The derivation of an effective weld inspection technique
The limitations of all NDT techniques are well understood. For instance with TOFD, excess penetration, flaws located to one side of a weld or in the lateral wave region are not suited to detection. A major weakness of TOFD is the difficulty of flaw characterisation. It is often the case, both under trial conditions and in the field that signals are observed, but incorrectly classified. This could be compensated for instance, by evaluating all ‘suspicious’ TOFD indications using a complimentary technique such as an appropriate mechanised pulse-echo or phased array technique.
With pulse-echo techniques, whether manual, mechanised or phased array, unsuitably oriented or reflective flaws may go undetected.
In the context of risk management of plant in an in-service application, RT is generally unsuitable as a) access is required to both internal and external surfaces and b) it is unsuited to the detection of unsuitably oriented planar flaws such as cracks. Manual UT frequently has inadequate reliability for use to demonstrate plant integrity with confidence. If the technical factors associated with pulse-echo and/or TOFD are addressed by using each in a complimentary manner, and controls are put in place to address the weaknesses, a very high level of confidence can be placed on their use as a means of supporting risk-based plant integrity management programmes.
The process should commence with a definition of the flaw type(s), sizes and locations requiring detection, which should be addressed by a) technical aspects and b) reliability issues associated with their detection.
3.4 The Extent of inspection
Internal visual inspection typically covers most, if not all of the internal surface of a pressure vessel and, once access has been gained, the cost of inspection is low. However, a Non-Invasive Inspection approach based on a combination of TOFD and mechanised UT as described above would be very expensive if it was to cover the entire surface of a vessel; even though this may be offset to some degree by the economic benefits of improved plant availability. However, it may not be necessary to inspect large areas of the vessel. It may in fact, be possible to restrict the extent of inspection to specific, meaningful areas provided these are scrutinised with an appropriate degree of confidence in the technique(s) used. Internal visual inspection is generally extended to the entire internal surface because it would be unwise not to once vessel entry had been obtained. However, risk-based methods such as RBI and/or NII evaluate degradation mechanisms in great detail and based on the information generated it may be observed that targeted sample areas will provide the
9
information necessary upon which to assess vessel integrity or to plan future inspection activity. This can be supplemented with inspections covering critical areas and/or areas of previously identified corrosion activity. In this manner, non-intrusive methods for the detection of internal corrosion can be carried out responsibly, economically and safely. In certain applications, statistical processes are available to support this approach.
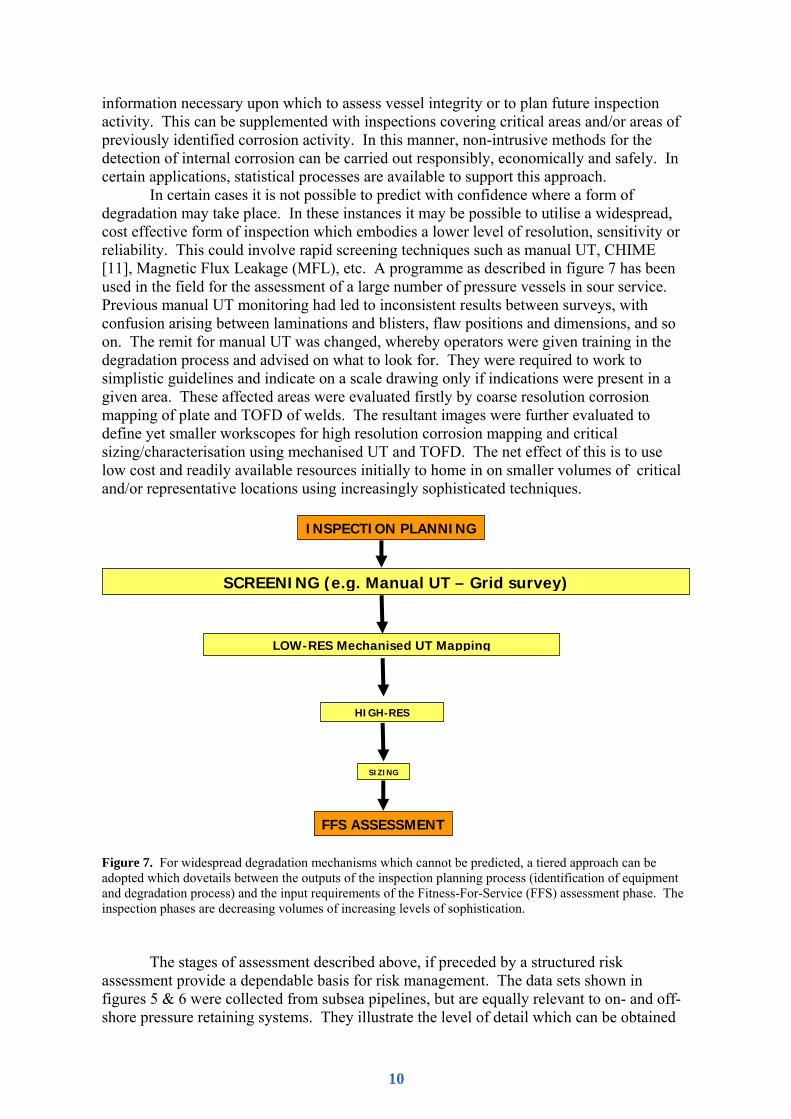
In certain cases it is not possible to predict with confidence where a form of degradation may take place. In these instances it may be possible to utilise a widespread, cost effective form of inspection which embodies a lower level of resolution, sensitivity or reliability. This could involve rapid screening techniques such as manual UT, CHIME [11], Magnetic Flux Leakage (MFL), etc. A programme as described in figure 7 has been used in the field for the assessment of a large number of pressure vessels in sour service. Previous manual UT monitoring had led to inconsistent results between surveys, with confusion arising between laminations and blisters, flaw positions and dimensions, and so on. The remit for manual UT was changed, whereby operators were given training in the degradation process and advised on what to look for. They were required to work to simplistic guidelines and indicate on a scale drawing only if indications were present in a given area. These affected areas were evaluated firstly by coarse resolution corrosion mapping of plate and TOFD of welds. The resultant images were further evaluated to define yet smaller workscopes for high resolution corrosion mapping and critical sizing/characterisation using mechanised UT and TOFD. The net effect of this is to use low cost and readily available resources initially to home in on smaller volumes of critical and/or representative locations using increasingly sophisticated techniques.
Figure 7. For widespread degradation mechanisms which cannot be predicted, a tiered approach can be adopted which dovetails between the outputs of the inspection planning process (identification of equipment and degradation process) and the input requirements of the Fitness-For-Service (FFS) assessment phase. The inspection phases are decreasing volumes of increasing levels of sophistication.
The stages of assessment described above, if preceded by a structured risk
assessment provide a dependable basis for risk management. The data sets shown in figures 5 & 6 were collected from subsea pipelines, but are equally relevant to on- and off-shore pressure retaining systems. They illustrate the level of detail which can be obtained
INSPECTION PLANNING
FFS ASSESSMENT
SCREENING (e.g. Manual UT – Grid survey)
LOW-RES Mechanised UT Mapping
SIZING
HIGH-RES
10
from in-line inspection which is of direct relevance to the corrosion engineer and structural integrity expert. The inspections can be carried out at temperatures up to 400°C and work is ongoing to increase this still further.
It can be seen that the level of detail that can be provided by using sophisticated forms of NDT, or perhaps more accurately defined as plant condition assessment, dovetails neatly between the risk-based inspection planning phase and the advanced life assessment process.
4. Conclusion
Risk-based methods to support plant integrity management are here to stay and they lend themselves to the use of probabilistic measures of inspection performance. The use of modelling very effectively ensures that inspection procedures are tuned into the detection of pertinent degradation mechanisms at the technical level, and expert elicitation can be used to ensure that the variables between the human factors associated with known trial performance data and actual site conditions are fully taken into account.
References
[1] Davies, M., and Lilley, J., Risk-Based Inspection Planning. Cape 97. Balkema Publishers, Rotterdam. [2] Volker, A. W. F., Dijkstra, F. H., Terpstra, S., Heenings, H. A. M., and Lont, M. A., Modeling of
NDE Reliability: Development of a POD-Generator, 16th World Conference of NDT, Montreal, Canada.
[3] Wall, M., Wedgewood, F. A., and Burch, S. Modelling of NDT Reliability (POD) and Applying Corrections for Human Factors, ECNDT 98, Copenhagen, 1998.
[4] Murgatroyd, R. A.., and Worrall, G. M., Human Reliability in Inspection: Results of Action 7 of PISC III Programme, 1994
[5] Lilley, J, Perrie, C, Advanced NDT. 2nd African Conference of NDT, Johannesburg, S Africa. [6] Rummel, W. D., Qualification and Validation of the Performance Capability (POD) for
Nondestructive Inspection Procedures, 16th WCNDT, Montreal, Canada. [7] McGrath, B. A., Programme for the Assessment of NDT in Industry, HSE report on CD-ROM, Dec
1999. [8] Stelwagen, U. Nederlands Instituut voor Laastechniek Doc no.: 93-40: Non Destructive Testing of
Thin Plate. March 1995. [9] Førli, et al, IIW document IIW-V-967-91NORDTEST NDT Programme [10] UK Health & Safety Executive, POD/POS curves for NDE, Offshore Technology Report 2000/18. [11] Ravenscroft et al, CHIME- A New Ultrasonic Method for Rapid Screening of Pipe, Plate and
Inaccessible Geometries. 7th ECNDT, Copenhagen, DK. April 1998.
11