Embed Size (px)
Citation preview
THE INTERACTION BETWEEN HUMAN
VISION AND EYE MOVEMENTS IN HEALTH
AND DISEASE
Richard Joel Sylvester
Institute of Cognitive Neuroscience
Wellcome Trust Centre for Neuroimging
Institute of Neurology
University College London
Prepared under the supervision of:
Professor Geraint Rees
Professor John Driver
Submitted to UCL for the Degree of PhD

2
DECLARATION
I, Richard Sylvester, confirm that the work presented in this thesis is my own. Where
information has been derived from other sources, I confirm that this has been indicated in
the thesis.
Part of the work presented in Chapters 3, 5 and 7 has been published as the following
papers.
Sylvester,R., Haynes,J.D., and Rees,G. (2005). Saccades differentially modulate human
LGN and V1 responses in the presence and absence of visual stimulation. Current
Biology. 15, 37-41.
Sylvester,R., Rees,G. (2006). Extraretinal saccadic signals in human LGN and early
retinotopic cortex. Neuroimage. 30(1):214-9.
Sylvester,R., Josephs,O., Driver,J., Rees,G. (2007) Visual FMRI responses in human
superior colliculus show a temporal-nasal asymmetry that is absent in lateral geniculate
and visual cortex. Journal of Neurophysiology. 97(2):1495-502.

3
ACKNOWLEDGEMENTS
Above all, I would like to thank my supervisor Geraint Rees for his encouragement,
guidance, patience and for his invaluable ability to remain positive and enthusiastic in
almost any situation. In addition I am very grateful to my second supervisor Jon Driver,
whose ability to get to the crux of a problem and then design a workable experiment to
test it was crucial in the construction of this thesis.
I would also like to thank the members of the Rees lab – David, Sue, John, Phillip,
Bahador, Davina, Rimona, Elaine, Claire, Christian and Ayshe for all their help and
advice, and also for the many evenings spent discussing a range of relevant (and trivial)
issues in the Queen‟s Larder. In addition without the input of many people at the ICN
including Eliot, Stephan, Neil and Christian my time there would have been less
productive (and less interesting). Klass and Will were both instrumental in helping with
the DCM analysis. Thanks also to all the ICN and FIL support staff – Michelle, Karen,
Dominic, Marcia, Amanda, Jan, David, Ric, Rachel, Chris, Lambert and Martin for all
their help. Special thanks to Eric, for providing much needed practical support in
overcoming a myriad of technical issues.
Thanks also to the Wellcome Trust and the Guarantors of Brain for funding me.
I would also like to thank my family and friends. In particular, Emma, for her unfailing
support and many ideas for imaging studies that I did not have time to carry out. Also
thanks to Eddie for his willingness to lie in the scanner for many hours of testing. Thank
you to Max, who has been a great distraction during the writing stage of this thesis.
Finally thanks to my parents for making it all possible.
4
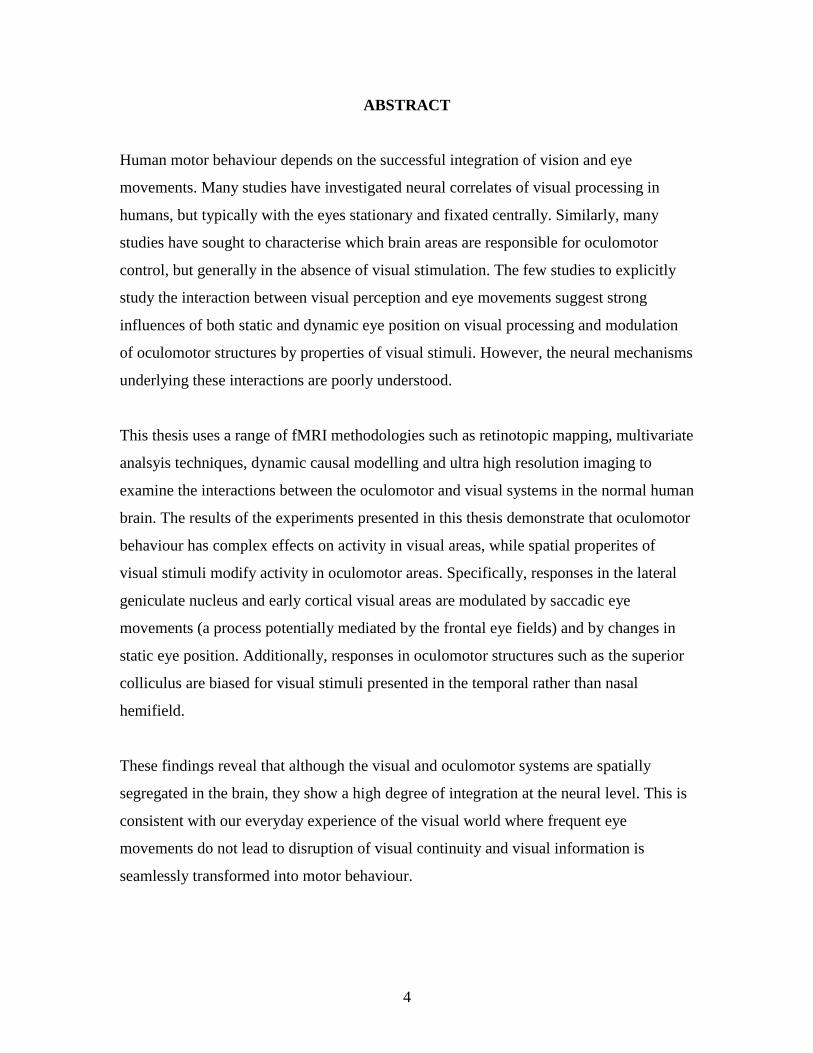
ABSTRACT
Human motor behaviour depends on the successful integration of vision and eye
movements. Many studies have investigated neural correlates of visual processing in
humans, but typically with the eyes stationary and fixated centrally. Similarly, many
studies have sought to characterise which brain areas are responsible for oculomotor
control, but generally in the absence of visual stimulation. The few studies to explicitly
study the interaction between visual perception and eye movements suggest strong
influences of both static and dynamic eye position on visual processing and modulation
of oculomotor structures by properties of visual stimuli. However, the neural mechanisms
underlying these interactions are poorly understood.
This thesis uses a range of fMRI methodologies such as retinotopic mapping, multivariate
analsyis techniques, dynamic causal modelling and ultra high resolution imaging to
examine the interactions between the oculomotor and visual systems in the normal human
brain. The results of the experiments presented in this thesis demonstrate that oculomotor
behaviour has complex effects on activity in visual areas, while spatial properites of
visual stimuli modify activity in oculomotor areas. Specifically, responses in the lateral
geniculate nucleus and early cortical visual areas are modulated by saccadic eye
movements (a process potentially mediated by the frontal eye fields) and by changes in
static eye position. Additionally, responses in oculomotor structures such as the superior
colliculus are biased for visual stimuli presented in the temporal rather than nasal
hemifield.
These findings reveal that although the visual and oculomotor systems are spatially
segregated in the brain, they show a high degree of integration at the neural level. This is
consistent with our everyday experience of the visual world where frequent eye
movements do not lead to disruption of visual continuity and visual information is
seamlessly transformed into motor behaviour.

5
CONTENTS
Title ................................................................................................................... 1
Declaration ....................................................................................................... 2
Acknowledgements .......................................................................................... 3
Abstract............................................................................................................. 4
Contents ........................................................................................................... 5
List of Figures .................................................................................................. 10
List of Tables ................................................................................................... 13
1. Chapter 1: General Introduction ............................................................ 14
1.1. Introduction......................................................................................... 14
1.2. The role of human eye movements..................................................... 15
1.3. The anatomy of interactions between vision and eye movements….. 19
1.4. Saccade generation – visual influences on oculomotor behaviour…. 23
1.5. The neurophysiology of interactions between eye movements and
vision……………………………………………………………...…
28
1.6. Oculomotor influences on human visual perception…………….…. 30
1.6.1. Dynamic oculomotor behaviour ............................................ 31
1.6.2. Static eye position…………………………………………… 32
1.7. Summary of current studies………………………..…………….…. 33
1.8. Conclusion 35
2. Chapter 2: General Methods.................................................................... 36
2.1. Introduction…………………………………………………………. 36
2.2. Functional MRI................................................................................... 36
2.2.1. Physics of MRI ....................................................................... 36
2.2.2. Formation of images using MRI ............................................. 37
2.2.3. Echo-planar imaging ............................................................... 38
2.2.4. BOLD signal ........................................................................... 38
2.2.5. Resolution of fMRI………………………………….............. 39
2.2.6. Neural basis of BOLD signal .................................................. 40

6
2.3. fMRI Analysis .................................................................................... 42
2.3.1. Pre-processing ........................................................................ 42
2.3.1.1. Spatial Realignment .......................................................... 42
2.3.1.2. Coregistration to T1 structural image................................ 43
2.3.1.3. Spatial Smoothing ............................................................. 44
2.3.2. Statistical Parametric Mapping ............................................... 44
2.3.2.1. Basic approach .................................................................. 44
2.3.2.2. GLM .................................................................................. 45
2.3.2.3. t and F-statistics ................................................................ 46
2.4. Retinotopic Mapping ......................................................................... 47
2.4.1. Meridian mapping procedure .................................................. 49
2.5. Conclusion……………...................................................................... 52
3. Chapter 3: Saccadic influences on human LGN and V1 ...................... 54
3.1. Introduction………………………..................................................... 54
3.1.1. Saccadic suppression of vision – active or passive process?.. 54
3.1.2. The site and nature of saccadic suppression………………… 55
3.2. Methods………................................................................................... 56
3.2.1. Participants………………………………..………………… 56
3.2.2. Stimuli and apparatus……………………………………….. 57
3.2.3. Experimental paradigm……………………………………… 59
3.2.4. Imaging and preprocessing………………………………….. 60
3.2.5. Visual area localisation……………………………………… 60
3.3. Results………..................................................................................... 63
3.3.1. Oculomotor structures – normalised analysis ………………. 63
3.3.2. Retinotopic analysis…………………………………………. 64
3.3.2.1. Primary visual cortex and LGN ........................................ 64
3.3.2.2. Higher visual areas 67
3.4. Discussion………….. ........................................................................ 68
3.4.1. LGN and V1 activity is modulated by saccades….…………. 69
3.4.2. Saccadic suppression depends on visual stimulation……….. 70
7
3.5. Conclusion …………………………………………………………. 72
4. Chapter 4: Modeling saccadic effects on effective connectivity in
visual and oculomotor networks..............................................................
73
4.1. Introduction ........................................................................................ 73
4.1.1. Modeling effective connectivity………………….…………. 74
4.1.2. Evidence informing the design of a model of saccadic
effects on visual activity……………………………………..
75
4.1.3. Model to be tested using DCM................................................ 77
4.2. Methods – DCM analysis ................................................................... 78
4.3. Results……......................................................................................... 79
4.3.1. External inputs ........................................................................ 81
4.3.2. Intrinsic connections…………………………………............ 81
4.3.3. Contextual modulations………………………....................... 81
4.3.4. Model comparison…………………………………………... 82
4.4. Discussion......................................................................................... 85
4.4.1. Summary of DCM results…………..……………………... 86
4.4.2. The primary site of saccadic modulation of visual activity…. 86
4.4.3. Differential modulation of LGN/V1 in darkness and light….. 88
4.5. Conclusion…................................................................................... 89
5. Chapter 5: Extraretinal saccadic signals in human LGN and early
retinotopic cortex.......................................................................................
90
5.1. Introduction ........................................................................................ 90
5.2. Methods .............................................................................................. 92
5.2.1. Participants ............................................................................. 92
5.2.2. Stimuli and apparatus….......................................................... 93
5.2.3. Imaging and analysis .............................................................. 94
5.2.4. Visual area localisation……………………... ........................ 94
5.3. Results ................................................................................................ 96
5.3.1. Eye movement data................................................................. 96

8
5.3.2. FMRI data………….............................................................. 96
5.4. Discussion .......................................................................................... 100
5.4.1. Saccadic suppression at low stimulus intensity……………... 101
5.4.2. The relationship between extraretinal signals and saccadic
suppression…………………………………………………..
101
5.5. Conclusion ......................................................................................... 103
6. Chapter 6: The effect of gaze direction on early visual processing….. 104
6.1. Introduction ....................................................... ................................ 104
6.2. Methods .............................................................................................. 106
6.2.1. Experimental paradigm .......................................................... 106
6.2.2. Imaging parameters................................................................. 108
6.2.3. Visual area localisation……………………………………… 108
6.2.4. Imaging data analysis……………………………………….. 108
6.3. Univariate results ............................................................................... 109
6.4. Discussion of univariate results ......................................................... 110
6.5. Overview of multivariate analysis in fMRI ....................................... 113
6.6. Multivariate pattern classification methods………………………… 117
6.7. Multivariate results…………………………………………………. 119
6.8. Discussion………………………………………………………....... 120
6.8.1. Human visual cortex contains sufficient information to
reconstruct horizontal gaze direction.......................................
120
6.8.2. Gaze representation is spatially distributed…………………. 122
6.9. Conclusion…...…………………………………………………....... 123
7. Chapter 7: Visual responses in human superior colliculus show
temporal-nasal asymmetry………………………………......................
125
7.1. Introduction ........................................................................................ 125
7.2. Methods .............................................................................................. 129
7.2.1. Subjects ................................................................................... 129
7.2.2. Stimuli..................................................................................... 130

9
7.2.3. Imaging and preprocessing...................................................... 131
7.2.4. Cortical and subcortical visual area localisation..................... 135
7.3. Results ................................................................................................ 138
7.4. Discussion .......................................................................................... 145
7.4.1. FMRI of human superior colliculus ........................................ 145
7.4.2. Possible neural substrate for behavioral temporal-hemifield
advantages is confirmed in the collicular pathway…………..
149
7.5. Conclusion ......................................................................................... 150
8. Chapter 8: General Discussion ................................................................ 152
8.1. Introduction ........................................................................................ 152
8.2. The effects of dynamic oculomotor behaviour on human visual
processing……………......................................................................
152
8.3. The effects of static eye position on human visual processing .......... 157
8.4. Conclusion ......................................................................................... 158
9. References ................................................................................................. 161

10
LIST OF FIGURES
1.1 Density distribution of cones and rods on the human retina with
respect to eccentricity…………………………………………………..
15
1.2 Cross-section of the human retina at the foveal region demonstrating
the foveal pit............................................................................................
16
1.3 The mapping of the visual field (A) on the LGN (B) and V1 (C) in the
macaque monkey.....................................................................................
17
1.4 A letter chart that accurately represents the perceptual consequences of
the variation in visual acuity with retinal eccentricity.............................
18
1.5 The hierarchy of visual areas in the macaque, based on laminar
patterns of anatomical connections (including subcortical regions).......
20
1.6 The dorsal and ventral streams of monkey visual system....................... 21
1.7 Schematic diagram of the primary structures involved in the neural
control of saccades..................................................................................
22
1.8 The location of V4 neurons presaccadic, perisaccadic and postsaccadic
receptive field..........................................................................................
29
2.1 Retinotopic organization of visual areas in the left hemisphere............. 48
2.2 Meridian mapping to identify cortical visual areas in human occipital
cortex......................................................................................................
49
2.3 Segmenting white and grey matter in MrGray........................................ 50
2.4 3D rendering of the cortical surface of the right occipital lobe of a
single subject...........................................................................................
51
2.5 Unfolded occipital lobe represented as a mesh (left panel) and a
flatmap (right panel)................................................................................
51
2.6 Functional data from meridian mapping projected onto a flatmap of a
single subject‟s left occipital lobe...........................................................
52
3.1 Quantification of Ganzfeld conditions.................................................... 57
3.2 EOG monitoring of saccadic eye movements during fMRI experiment. 59
3.3 LGN localisation in one representative subject....................................... 62
11
3.4 Oculomotor structures associated with saccade generation and
execution………………………………………………………………..
64
3.5 Modulation of responses in human LGN and V1 by saccades………… 65
3.6 Individual subject data for LGN and V1................................................. 66
3.7 Modulation of responses in human V2, V3 and V5/MT by saccades..... 68
4.1 Model of Saccadic Influences on Early Visual Areas used in DCM
analysis…………………………………………………………………
78
4.2 Results of DCM analysis......................................................................... 80
4.3 Splitting the DCM model into two reduced versions allowing
assessment of the relative contribution of contextual modulatory
factors affecting FEF-V1 and LGN-V1...................................................
83
5.1 LGN and V1-V3 responses to increasing illumination in the absence
of saccades...............................................................................................
97
5.2 Modulation of responses in human LGN and V1-V3 by
saccades...................................................................................................
98
5.3 Saccadic Modulation Indices for LGN, V1-V3 in darkness and strong
visual stimulation………………………………………………………
99
6.1 Experimental Stimulus............................................................................ 107
6.2 Activation evoked by the experimental stimulus in visual cortex........... 109
6.3 Modulation of mean visually evoked activity by gaze direction in
visual areas V1-3 ....................................................................................
110
6.4 Orientation selectivity in early human visual cortex shown using
multivariate analysis……………………………………………………
112
6.5 Analysis of spatial patterns using a multivariate pattern recognition
approach……………………….…..........................................................
114
6.6 Schematic representation of the steps in multivariate analysis .............. 116
6.7 Accuracy of prediction of gaze direction from visually active voxels in
V1-3.........................................................................................................
120
7.1 The proposed anatomical projections of the retinotectal and
retinogeniculate pathways.......................................................................
127
7.2 The visual stimulus used in the main study……………………………. 131
12
7.3 Anatomical distribution of physiological noise explained by regressors
calculated from the cardiac cycle during EPI volume acquisition……..
134
7.4 SC responses to contralateral visual field stimulation…………………. 136
7.5 LGN responses to contralateral visual field stimulation………………. 137
7.6 Group average responses (n=8) of human V1-V3, LGN and SC to
monocular hemifield visual stimuli presented in the nasal or temporal
visual field……………………………………………………………...
139
7.7 Normalised unfitted group average responses (n=8) of V1-V3, LGN
and SC to monocular hemifield visual stimuli presented in the nasal or
temporal visual field……………………………………………………
141
7.8 Group average responses (n=8) of V1-V3, LGN and SC to monocular
hemifield visual stimuli presented in the nasal or temporal visual field
using voxels selected on the basis of response to stimulation via the
left OR right eye………………………………………………………..
142
7.9 Distributions of nasal and temporal field preferences in visually
responsive voxels in V1-V3, LGN and SC……………………………..
144
7.10 Left and right SC voxels plotted according to the degree to which they
show eye preference to identical contralateral hemifield stimulation in
two representative subjects……………………………………………..
148

13
LIST OF TABLES
3.1 Location and t values of peak activations during saccades ………….... 63
4.1 Interpretation of Bayes factors................................................................ 85
14
CHAPTER 1 : GENERAL INTRODUCTION
1.1 Introduction
Over recent decades there has been remarkable progress towards an understanding of the
neural processes that underpin human cognition and behaviour. The prevalent approach,
utilised with great success, has involved the study of brain systems (and functions) in
relative isolation. While this method has enabled mapping of brain structures according
to their predominant function, it has often failed to address how closely related
behavioural processes are neurally integrated. The successes and limitations of this
method are clearly illustrated by considering the study of human vision and eye
movements. The visual system has predominately been investigated by measuring its
response to the systematic manipulation of basic visual properties (such as colour,
contrast or motion) while other factors affecting visual input such as eye movements are
controlled. This method eliminates „confounding‟ effects of eye movements by either
presenting visual stimuli very briefly or requiring subjects to maintain central fixation. In
contrast, the oculomotor system has largely been investigated by measuring its response
to systematic manipulations of oculomotor behaviour in an impoverished visual
environment. This approach has resulted in a detailed understanding of the
neurophysiology of both the visual and the oculomotor systems, but relatively little
information about how they interact.
However, outside of the strictly controlled environment of vision science experiments,
successful human behaviour requires that vision and eye movements are highly
integrated. For instance, normal vision is characterized by frequent saccades, blinks and
changes in the locus of fixation, while oculomotor behaviour usually takes place in a
complex and rich visual environment. Some human behavioural studies have indeed
demonstrated profound perceptual effects of eye movements on vision (and similarly
profound effects of vision on oculomotor behaviour) and in non-human subjects the
neural basis of these interactions has been explored. But, the neural mechanisms that
subserve successful integration of the visual and oculomotor systems in the human brain
15
are not well defined. This thesis is concerned with investigating these mechanisms to
generate an understanding of human vision that reflects the importance of interactions
between the visual and oculomotor systems.
1.2 The role of eye movements in human vision
In order to appreciate why the visual and oculomotor systems require such close neural
integration, one must first consider why eye movements are ubiquitous in human vision.
The most important reason for eye movements is readily apparent from examining the
anatomical organisation of the retina and early visual system. The structure of the retina
is not homogenous; the fovea is highly specialised for detailed processing of visual
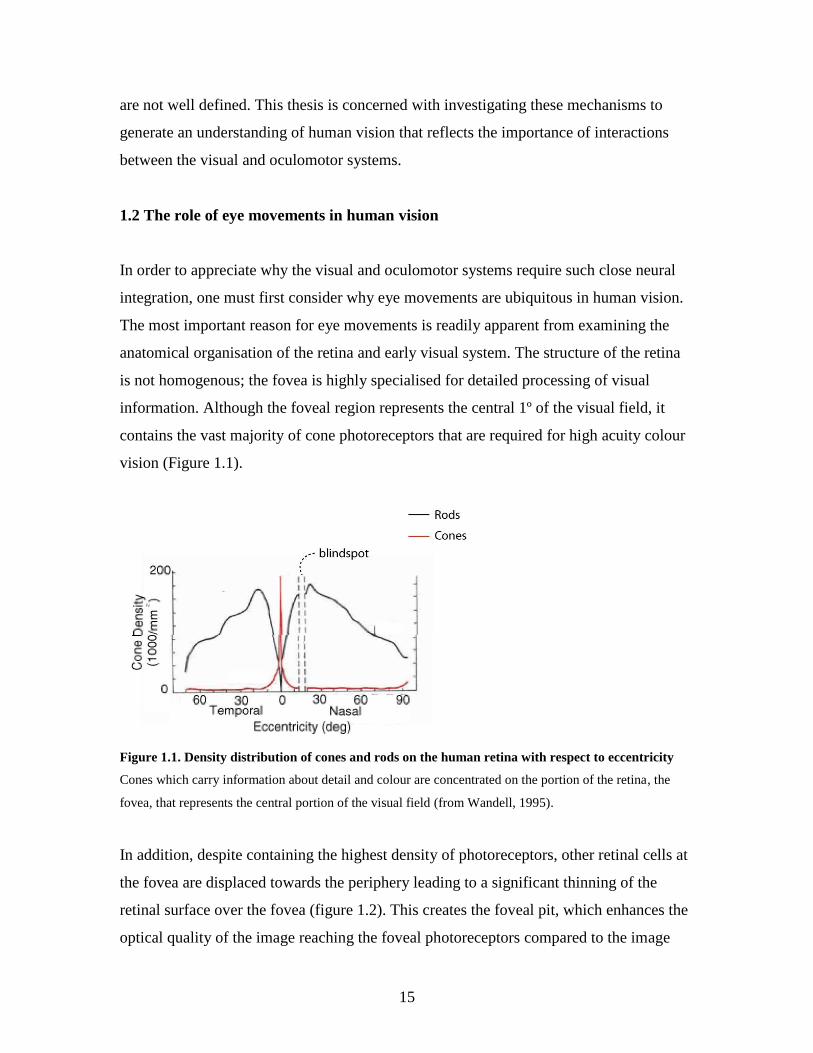
information. Although the foveal region represents the central 1º of the visual field, it
contains the vast majority of cone photoreceptors that are required for high acuity colour
vision (Figure 1.1).
Figure 1.1. Density distribution of cones and rods on the human retina with respect to eccentricity
Cones which carry information about detail and colour are concentrated on the portion of the retina, the
fovea, that represents the central portion of the visual field (from Wandell, 1995).
In addition, despite containing the highest density of photoreceptors, other retinal cells at
the fovea are displaced towards the periphery leading to a significant thinning of the
retinal surface over the fovea (figure 1.2). This creates the foveal pit, which enhances the
optical quality of the image reaching the foveal photoreceptors compared to the image
16
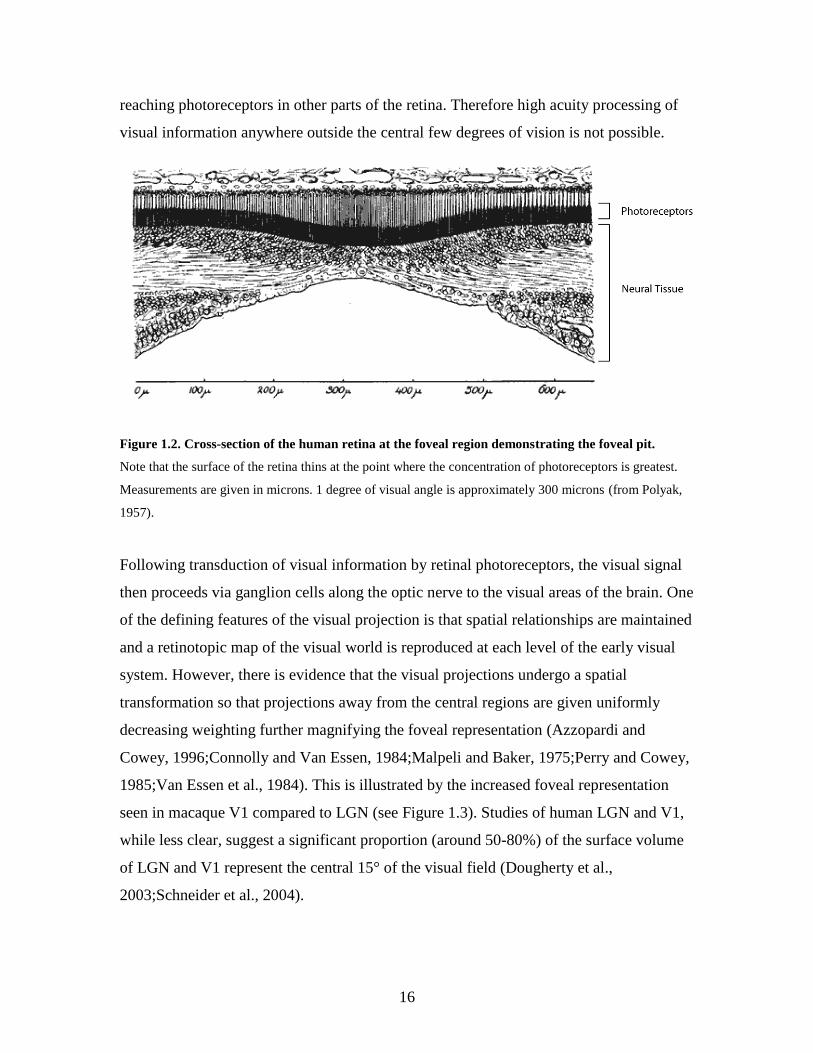
reaching photoreceptors in other parts of the retina. Therefore high acuity processing of
visual information anywhere outside the central few degrees of vision is not possible.
Figure 1.2. Cross-section of the human retina at the foveal region demonstrating the foveal pit.
Note that the surface of the retina thins at the point where the concentration of photoreceptors is greatest.
Measurements are given in microns. 1 degree of visual angle is approximately 300 microns (from Polyak,
1957).
Following transduction of visual information by retinal photoreceptors, the visual signal
then proceeds via ganglion cells along the optic nerve to the visual areas of the brain. One
of the defining features of the visual projection is that spatial relationships are maintained
and a retinotopic map of the visual world is reproduced at each level of the early visual
system. However, there is evidence that the visual projections undergo a spatial
transformation so that projections away from the central regions are given uniformly
decreasing weighting further magnifying the foveal representation (Azzopardi and
Cowey, 1996;Connolly and Van Essen, 1984;Malpeli and Baker, 1975;Perry and Cowey,
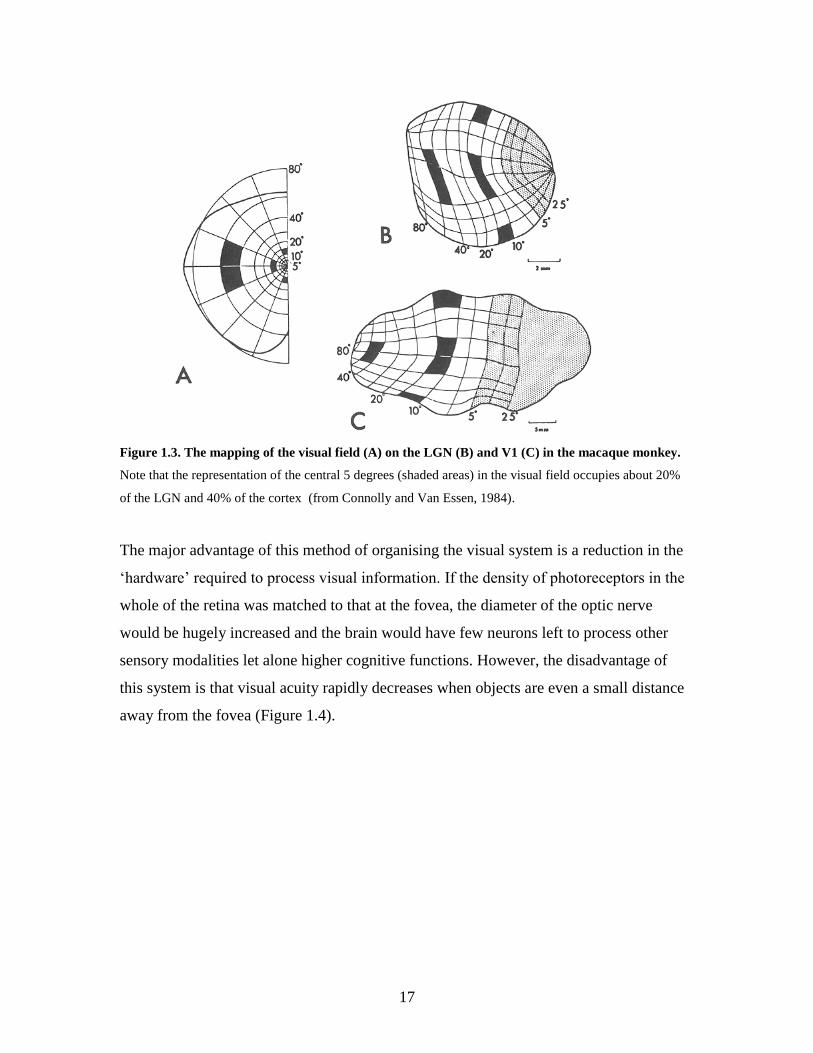
1985;Van Essen et al., 1984). This is illustrated by the increased foveal representation
seen in macaque V1 compared to LGN (see Figure 1.3). Studies of human LGN and V1,
while less clear, suggest a significant proportion (around 50-80%) of the surface volume
of LGN and V1 represent the central 15° of the visual field (Dougherty et al.,
2003;Schneider et al., 2004).
17
Figure 1.3. The mapping of the visual field (A) on the LGN (B) and V1 (C) in the macaque monkey.
Note that the representation of the central 5 degrees (shaded areas) in the visual field occupies about 20%
of the LGN and 40% of the cortex (from Connolly and Van Essen, 1984).
The major advantage of this method of organising the visual system is a reduction in the
„hardware‟ required to process visual information. If the density of photoreceptors in the
whole of the retina was matched to that at the fovea, the diameter of the optic nerve
would be hugely increased and the brain would have few neurons left to process other
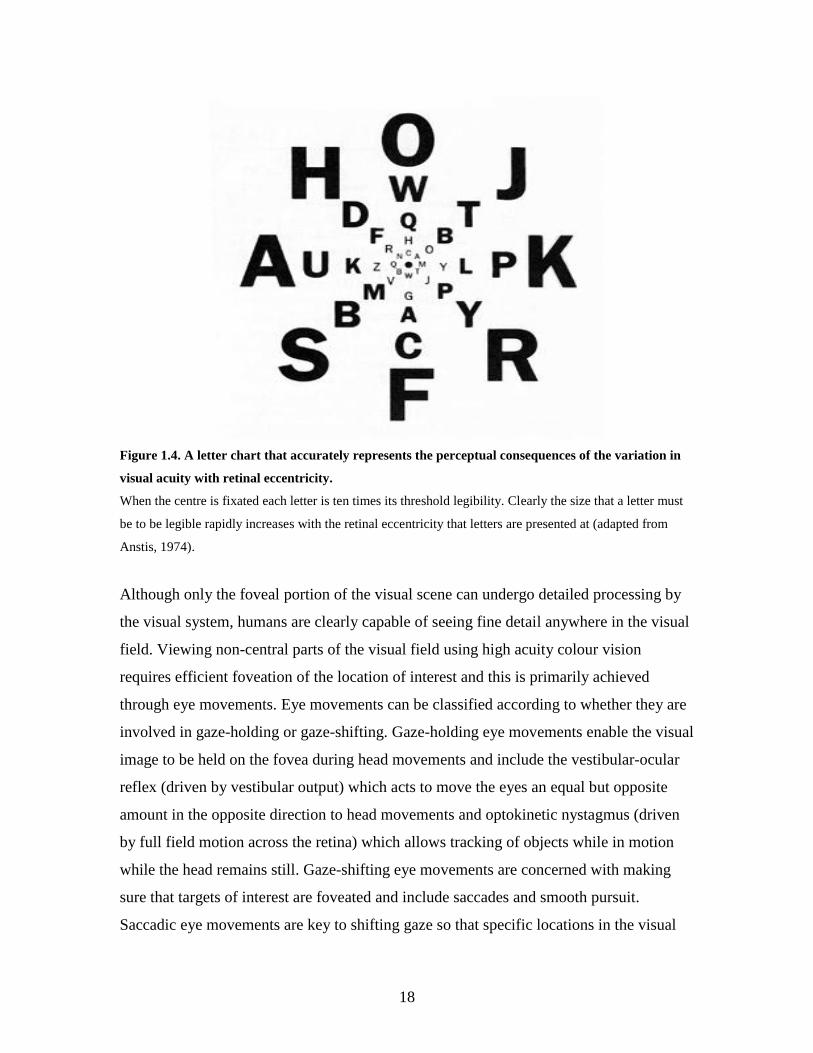
sensory modalities let alone higher cognitive functions. However, the disadvantage of
this system is that visual acuity rapidly decreases when objects are even a small distance
away from the fovea (Figure 1.4).
18
Figure 1.4. A letter chart that accurately represents the perceptual consequences of the variation in
visual acuity with retinal eccentricity.
When the centre is fixated each letter is ten times its threshold legibility. Clearly the size that a letter must
be to be legible rapidly increases with the retinal eccentricity that letters are presented at (adapted from
Anstis, 1974).
Although only the foveal portion of the visual scene can undergo detailed processing by
the visual system, humans are clearly capable of seeing fine detail anywhere in the visual
field. Viewing non-central parts of the visual field using high acuity colour vision
requires efficient foveation of the location of interest and this is primarily achieved
through eye movements. Eye movements can be classified according to whether they are
involved in gaze-holding or gaze-shifting. Gaze-holding eye movements enable the visual
image to be held on the fovea during head movements and include the vestibular-ocular
reflex (driven by vestibular output) which acts to move the eyes an equal but opposite
amount in the opposite direction to head movements and optokinetic nystagmus (driven
by full field motion across the retina) which allows tracking of objects while in motion
while the head remains still. Gaze-shifting eye movements are concerned with making
sure that targets of interest are foveated and include saccades and smooth pursuit.
Saccadic eye movements are key to shifting gaze so that specific locations in the visual
19
field are brought onto the fovea (although in subjects with congenital opthalmoplegia,
this can be successfully achieved using head movements, see Gilchrist et al., 1997).
While vergence and smooth pursuit eye movements allow foveation of objects moving in
depth or across the visual field respectively.
Thus the critical role of eye movements is to rapidly and accurately bring and hold
locations of interest onto the fovea. To successfully achieve this crucial function, the
oculomotor system clearly requires detailed visual information (which one would expect
to be derived from the visual system). In addition, in order to minimise disruption to
visual perception and allow successful visually guided action, the visual system also
requires detailed information about ongoing oculomotor behaviour (which one would
expect to derive from the oculomotor system). Consequently one might expect that the
visual and oculomotor systems interact at multiple levels. Although this interaction is
poorly defined in man, the integration of these two systems can be illustrated by
considering their anatomical organisation and the response properties of their components
in non-human primates.
1.3 The anatomy of interactions between vision and eye movements
The primate visual system has a complex and highly interconnected structure (Felleman
and Van Essen, 1991) illustrated in figure 1.5. However, this hierarchy can be simplified
into two parallel processing pathways: a ventral stream projecting from the primary
visual cortex (V1) to the inferotemporal cortex, and a dorsal stream projecting from V1 to
the posterior parietal cortex (Ungerleider and Mishkin, 1982). In this proposed scheme
(shown in figure 1.6), the two streams mediate different components of visual processing,
with the ventral stream handling information about an object's features (the „what‟
pathway) and the dorsal stream mediating information about its spatial location (the
„where‟ pathway).

20
Figure 1.5. The hierarchy of visual areas in the macaque, based on laminar patterns of anatomical
connections (adapted to include subcortical regions from Felleman and Van Essen, 1991).
21
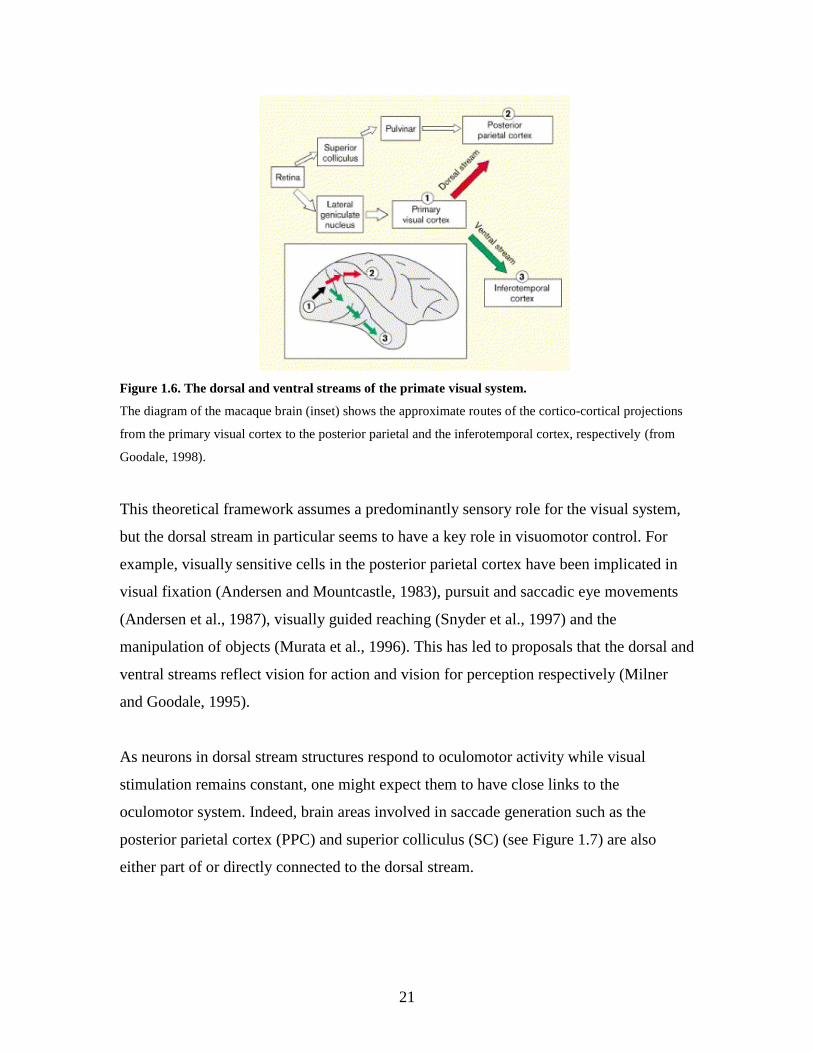
Figure 1.6. The dorsal and ventral streams of the primate visual system.
The diagram of the macaque brain (inset) shows the approximate routes of the cortico-cortical projections
from the primary visual cortex to the posterior parietal and the inferotemporal cortex, respectively (from
Goodale, 1998).
This theoretical framework assumes a predominantly sensory role for the visual system,
but the dorsal stream in particular seems to have a key role in visuomotor control. For
example, visually sensitive cells in the posterior parietal cortex have been implicated in
visual fixation (Andersen and Mountcastle, 1983), pursuit and saccadic eye movements
(Andersen et al., 1987), visually guided reaching (Snyder et al., 1997) and the
manipulation of objects (Murata et al., 1996). This has led to proposals that the dorsal and
ventral streams reflect vision for action and vision for perception respectively (Milner
and Goodale, 1995).
As neurons in dorsal stream structures respond to oculomotor activity while visual
stimulation remains constant, one might expect them to have close links to the
oculomotor system. Indeed, brain areas involved in saccade generation such as the
posterior parietal cortex (PPC) and superior colliculus (SC) (see Figure 1.7) are also
either part of or directly connected to the dorsal stream.
22
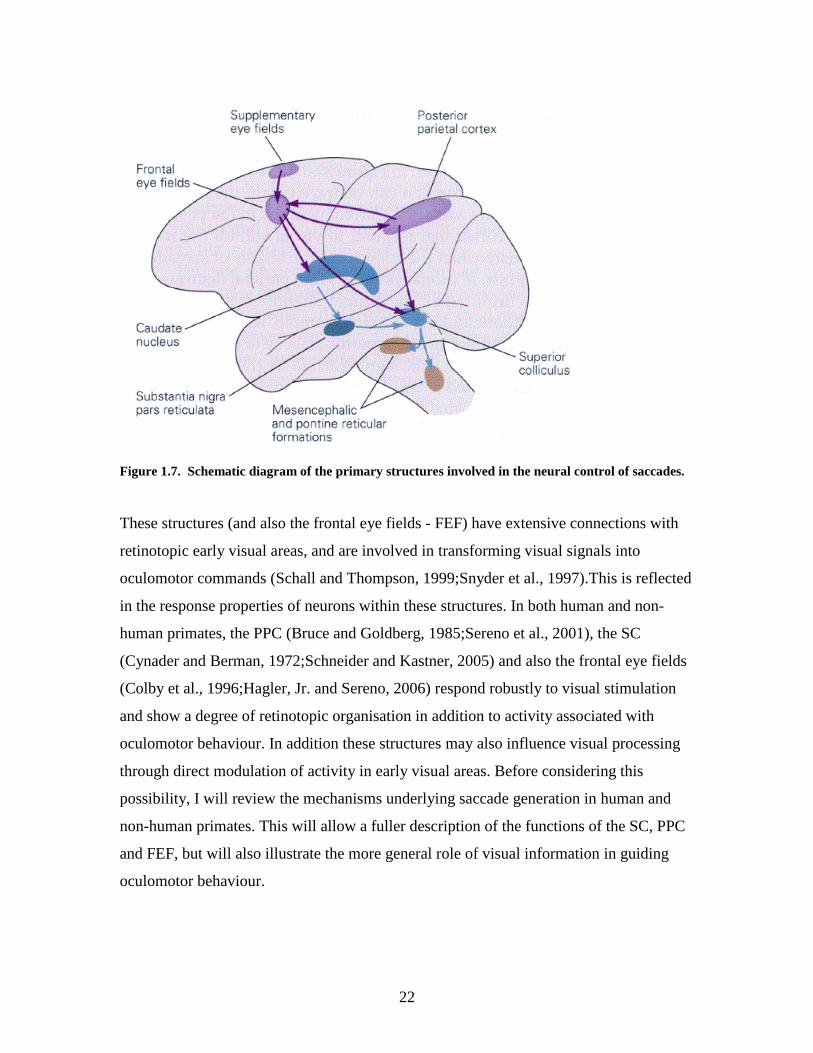
Figure 1.7. Schematic diagram of the primary structures involved in the neural control of saccades.
These structures (and also the frontal eye fields - FEF) have extensive connections with
retinotopic early visual areas, and are involved in transforming visual signals into
oculomotor commands (Schall and Thompson, 1999;Snyder et al., 1997).This is reflected
in the response properties of neurons within these structures. In both human and non-
human primates, the PPC (Bruce and Goldberg, 1985;Sereno et al., 2001), the SC
(Cynader and Berman, 1972;Schneider and Kastner, 2005) and also the frontal eye fields
(Colby et al., 1996;Hagler, Jr. and Sereno, 2006) respond robustly to visual stimulation
and show a degree of retinotopic organisation in addition to activity associated with
oculomotor behaviour. In addition these structures may also influence visual processing
through direct modulation of activity in early visual areas. Before considering this
possibility, I will review the mechanisms underlying saccade generation in human and
non-human primates. This will allow a fuller description of the functions of the SC, PPC
and FEF, but will also illustrate the more general role of visual information in guiding
oculomotor behaviour.
23
1.4 Saccade generation – Visual influences on oculomotor behaviour
The neural mechanisms underlying saccadic eye movements are of great relevance to this
thesis as many of the experiments presented later use saccades to investigate oculomotor
influences on visual processing, but also because saccade generation fundamentally
requires the integration of visual and oculomotor information. Therefore I will review the
mechanisms of saccade generation and in particular the processes that illustrate
interactions between the visual and oculomotor systems.
Generating saccadic eye movements requires involvement of both subcortical and higher
cortical brain structures, reflecting the multiple levels of control needed. At the lowest
level, brainstem structures control the eye muscles that generate the forces required to
rapidly and accurately move the eyes to a new fixation point. At the intermediate level,
the SC is involved in creating commands that allow saccades to be made to specific
locations in space. Finally, higher level cortical areas including the PPC and FEF are
involved in the planning and execution of object centred movements and the selection of
targets for upcoming saccades.
The mechanisms by which eye muscles are controlled are least relevant to this thesis, but
require a brief explanation in order to understand the later levels of saccade control (see
Carpenter, 1988 for a more detailed review). The rapid changes in force required for short
lasting saccades are generated by a burst of activity in oculomotor motor neurons during
a saccade and a reduction in this rate to maintain fixation. This change in firing rate is
under the control of two types of neuron located in the brainstem. Burst units fire rapidly
during saccades in a particular direction, while tonic units show activity that changes
from one steady level to another to reflect eye position. Tonic units are driven by burst
units (via a neural integrator), while burst units are under the control of omnipause cells
(again located in the brainstem). At rest, omnipause cells fire continuously; but they
pause for the duration of a saccade, thus determining its size. This sophisticated
mechanism allows highly accurate, rapid saccades to be generated using a set of slowly
responsive mechanical effectors (the eye muscles).
24
The specific location in space to which a saccade is made requires the integration of
visual information with oculomotor commands. There is considerable evidence that this
occurs in the SC. Macaque SC is anatomically arranged to enable transformation of
visual (or other sensory) information into orienting behaviours (overt and covert).
Histological staining reveals that the superior colliculus is a laminated structure, which
can be anatomically and functionally subdivided into superficial and deep layers (King
2004). The superficial layers have a purely sensory role (Robinson and McClurkin, 1989)
as they receive visual inputs directly from the retina via the retinotectal pathway (Schiller
and Malpeli, 1977) and indirectly via corticotectal feedback projections from striate
(Wilson and Toyne, 1970) and extrastriate cortex (Fries, 1984). In contrast, the
underlying deep layers, sometimes subdivided into intermediate and deep zones, have
both sensory and motor functions. Neurons in the deep layers can respond to auditory,
tactile or visual stimuli and many receive converging modality-specific inputs that endow
them with multisensory response properties. The deep layers output directly to
oculomotor brainstem nuclei and are involved with initiating saccades (Sparks and
Hartwich-Young, 1989). The intermediate layers contain a range of cell types including
fixation cells which are active during fixation and inhibit saccades (Munoz and Wurtz
1993a, 1993b), build-up and burst cells (Munoz and Wurtz 1995a, 1995b) whose function
in relation to saccade generation has already been discussed. Thus the superficial and
deep layers of SC have well segregated functions mediated by independent inputs and
outputs. This is illustrated differing effect of cooling of primary visual cortex on visual
responses in superficial and deep SC cells (Schiller et al., 1984). Visual responses are
abolished in deep layers but unaffected in the superficial layer. This functional
segregation is analogous to the sensorimotor transformation that occurs in from the
parietal visual areas to the FEF.
Neurons in the superficial areas are arranged in a systematic retinotopic map (Cynader &
Berman 1972) and their responses are fairly invariant to specific stimulus characteristics
such as colour and shape (Cynader and Berman 1972;Goldberg and Wurtz, 1972). As far
as can be ascertained, human SC seems to follow a similar anatomical pattern (Hilbig et
al., 1999;Laemle, 1981;Tardif et al., 2005) and also shows a degree of retinotopy
25
(Schneider and Kastner, 2005). In primitive visual systems, such as those of reptiles and
amphibians, the tectum (analogous to mammalian SC) receives retinal projections from
the contralateral eye only. This may reflect an anatomical adaptation to favour orientation
shifts to stimuli located in the visual periphery in animals lacking binocular vision (a
distinct advantage in rapidly responding to danger). Intriguingly, similar orienting biases
(to the periphery of vision – the temporal hemifield) can be demonstrated in human
subjects when stimuli are viewed monocularly (Rafal et al., 1991) suggesting that the
more complex visual systems retain this bias in the SC. Testing this claim is one aim of
the experiments presented in this thesis.
Neurons in the superficial layers of macaque SC have small receptive fields while those
in the intermediate and deep layers have large receptive fields that taper off at the edges
so that a visual target generates a diffuse „hill‟ of neural activity in the deep layers
(Waitzman et al., 1991). As outlined above, the deep layers have a predominantly motor
function and stimulation of many deep neurons evokes an eye movement to a specific
location in visual space (corresponding to the area represented by superficial layer
neurons above them (Wurtz and Goldberg, 1972). Neurons at the rostral pole of the SC
(corresponding to the fovea) project to omnipause cells and show similar activity
patterns, firing rapidly while a target is being fixated, and pausing during a saccade
(Munoz and Wurtz, 1993).
Although it is not entirely clear how the SC uses this neural machinery to generate
saccades to specific locations in space, one model proposes the following elegant
mechanism (Guitton, 1992). As a target appears in the visual periphery, it activates a
corresponding collicular region (via the superficial and deep layers), but inhibits the
fixation cells in the foveal region. This leads to omnipause cell inhibition and the saccade
begins. Meanwhile, an efference copy is sent back to the SC, where it moves the hill of
neural activity towards the fixation region, in correspondence with the simultaneous
movement of the eye itself. When it finally reaches the fixation region, omnipause cells
are activated, and the eye stops. Therefore, within the superior colliculus sensory
information is utilized to guide oculomotor behaviour through the integration of sensory
26
and motor maps of visual space. Although the SC may create the command needed to
move the eye to any particular location, it requires input from parietal and frontal
occulomotor areas for other crucial components of the process of saccade generation.
These include the integration of multimodal sensory information to allow planning and
execution of saccades in object-centred space and the control of choice of saccade target.
Within the parietal and frontal lobes specific regions show greater activation in
association with different movements. The areas most associated with oculomotor
behaviour are the FEF and lateral intraparietal area (LIP) in monkeys and their human
homologues. Although I will consider the function of these areas independently, there
may well be a degree of overlap in their role in saccade generation.
Primate FEF is involved in a range of oculomotor behaviours including intentional
saccades, smooth pursuit and fixation. There is little doubt that the FEF has a crucial role
in saccade generation. Low-intensity electrical stimulation of monkey FEF (Bruce et al.,
1985) and TMS over the FEF in humans elicits saccades. The FEF is part of a network of
human brain areas (including the PPC and supplementary eye fields) that is activated
during saccades and fixation (Anderson et al., 1994;Berman et al., 1999;Darby et al.,
1996;Luna et al., 1998). Furthermore, activity in presaccadic movement related neurons
in the macaque FEF is sufficient to specify whether and when saccades will be produced
(Hanes et al., 1998;Hanes and Schall, 1996), while the magnitiude of presaccadic BOLD
activity in human FEF correlates with saccade reaction time (Connolly et al., 2005). In
addition, reversible inactivation studies show that FEF is necessary to produce saccades
(Sommer and Tehovnik, 1997). Lesions of the FEF in both human and non-human
primates produce a similar range of deficits. These include deficits in generating saccades
to briefly presented targets, in the production of saccades to two or more sequentially
presented targets, in the selection of simultaneously presented targets, and in the
execution of smooth pursuit eye movements (Tehovnik et al., 2000b).
FEF has clear connections to the motor portions of the SC (Segraves and Goldberg,
1987;Sommer and Wurtz, 2001;Sommer and Wurtz, 1998) but also has direct
connections to brainstem saccade generator structures (Segraves, 1992) including the
27
rostral interstitial nucleus of the medial longitudinal fasciculus and the paramedian
pontine reticular formation (Huerta et al., 1986). Therefore FEF can influence saccade
generation via two pathways, one indirect via the deep layers of the SC (Hanes and
Wurtz, 2001) and the other through directly influencing brainstem saccade generators.
However, the FEF also has reciprocal connections with many visual cortical areas
(Huerta et al., 1987;Schall et al., 1995;Stanton et al., 1995), the thalamus and the visual
portion of the SC (Huerta et al., 1986;Sommer and Wurtz, 1998). These connections
mean that human and non-human primate FEF respond robustly to visual stimulation and
show a degree of retinotopic organisation in addition to activity associated with
oculomotor behaviour (Colby et al., 1996;Hagler, Jr. and Sereno, 2006). This extensive
convergence of afferents from the thalamus and cortical visual areas means that
individual neurons in the FEF receive signals representing the colour, form, depth and
direction of motion of objects in the image. Such convergence has led to proposals that
the FEF contains a salience map of visual space that enables selection of targets for gaze
shifts regardless of the visual properties of the target (Thompson and Bichot, 2005).
Area LIP also receives input from several visual areas, and is interconnected with the
FEF and the SC (Blatt et al., 1990;Lynch et al., 1985). LIP neurons fire both when a
salient visual stimulus is detected and during preparation and performance of a saccade
(Gnadt and Andersen, 1988), suggesting involvement in target selection and saccade
planning or execution. However there is contradictory evidence concerning the
relationship between LIP activity and saccades. Some studies suggest that the activity of
LIP neurons does not predict where or when a saccade will occur (Goldberg et al., 2002).
This led to proposals that LIP activity represents a dynamic map of the locus of visual
attention (Bisley and Goldberg, 2003a). For example, LIP neuronal activity significantly
correlates with the level of attention at a specific location, but not with whether a saccade
is actually attended or performed to that location (Bisley and Goldberg, 2003a).
However, more recent studies (Janssen and Shadlen, 2005) suggest that LIP activity does
predict saccadic reaction times, albeit not as well as FEF or SC activity (Everling and
Munoz, 2000). Inactivation of macaque LIP produces deficits in saccadic target selection
whereas saccade programming and execution remain unaffected (Wardak et al., 2002).
28
Additionally, the representation of visual space in both monkey and human LIP is
modified in a way that is dependent on the metrics of upcoming saccades (Duhamel et al.,
1992;Merriam et al., 2003), such predictive remapping may help to maintain a spatially
accurate representation of the visual field despite a moving eye and a resulting change in
the eye-centred frame of reference. Furthermore, higher cognitive processes such as
decision making, reward expectancy and perception of time have also been related to
activity of LIP neurons (Dickinson et al., 2003;Platt and Glimcher, 1999;Roitman and
Shadlen, 2002).
It is clear that many of the processes underlying the generation and execution of saccadic
eye movements require the successful integration of visual and oculomotor information.
These range from functions carried out by low level structures such as directing eye
movements to specific locations in space, to higher level functions such as saccade target
selection. Therefore it is not surprising that each level of the oculomotor system receives
visual input and this modulates oculomotor activity and subsequently behaviour. As
discussed earlier, the influence of oculomotor information on visual processing is also
likely to be important. For example, in compensating for visual disruption due to eye
movements and mediating coordinate transformations from retinotopic to craniotopic
space (c.f. remapping of visual responses in PPC). In the next section, I will review
specific evidence showing that oculomotor activity directly influences neural activity in
visual brain areas.
1.5 The neurophysiology of interactions between vision and eye movements
A range of experiments have shown that oculomotor behaviour can modulate neuronal
responses in monkey early visual areas. For example, visually evoked neuronal activity in
LGN, V1 and later visual areas is modified during saccades (Duffy and Burchfiel,
1975;Ramcharan et al., 2001;Reppas et al., 2002;Thiele et al., 2002). One possible
explanation for these findings is that modulation of visually evoked activity during
oculomotor behaviour is merely due to differences in the spatiotemporal characteristics of
the pattern of light reaching the retina during eye movements compared to rest. However,
29
similar modulation still occurs when visual conditions are carefully matched between eye
movement and rest conditions (Reppas et al., 2002) and visual activity is also influenced
by alterations in the direction of static gaze (Campos et al., 2006;Rosenbluth and Allman,
2002;Trotter and Celebrini, 1999;Weyand and Malpeli, 1993) where this confound is far
less pronounced. Together these results suggest that oculomotor behaviour itself can
influence activity of neurons in visual areas, but the relevance of these findings to visual
perception and the mechanisms that drive such effects are unclear.
Although the oculomotor system is likely to influence visual activity through a range of
mechanisms, its effects can be broadly categorised as either compensating for disruptive
consequences of eye movements (c.f. studies of saccadic effects on visual cortex activity
cited above) or facilitating visual processing at sites in the visual field that are not
currently foveated (but may well be foveated by an upcoming eye movement). The
effects of these influences on visual perception have been studied using human
psychophysical methods and will be considered in the next section. I will now
concentrate on what is known about the underlying neural mechanisms and specifically
on the second category of influences – facilitation of visual responses. The rational for
considering the mechanisms underlying these facilitatory processes is based on the pre-
motor theory of attention (Rizzolatti et al., 1987), which proposes that overt and covert
shifts in attention have the same neural substrate (activity in oculomotor structures
leading to an increase in visual processing power at a region in visual space that is
currently non-foveal). Moving the eyes clearly leads to a new region of visual space
being foveated and therefore facilitation of visual processing at this site. However, visual
perception can also be enhanced by attending to non-foveal sites without moving the
eyes. Indeed, neurophysiological studies in monkeys and functional imaging studies in
humans have established that this covert attention enhances representations in visual
cortex (Kastner et al., 1998;Luck et al., 1997;Moran and Desimone, 1985;Rees et al.,
1997;Reynolds and Desimone, 2003). In addition, prior to saccade initiation, neurons in
visual areas show facilitation of visual processing at the site of an upcoming saccade.
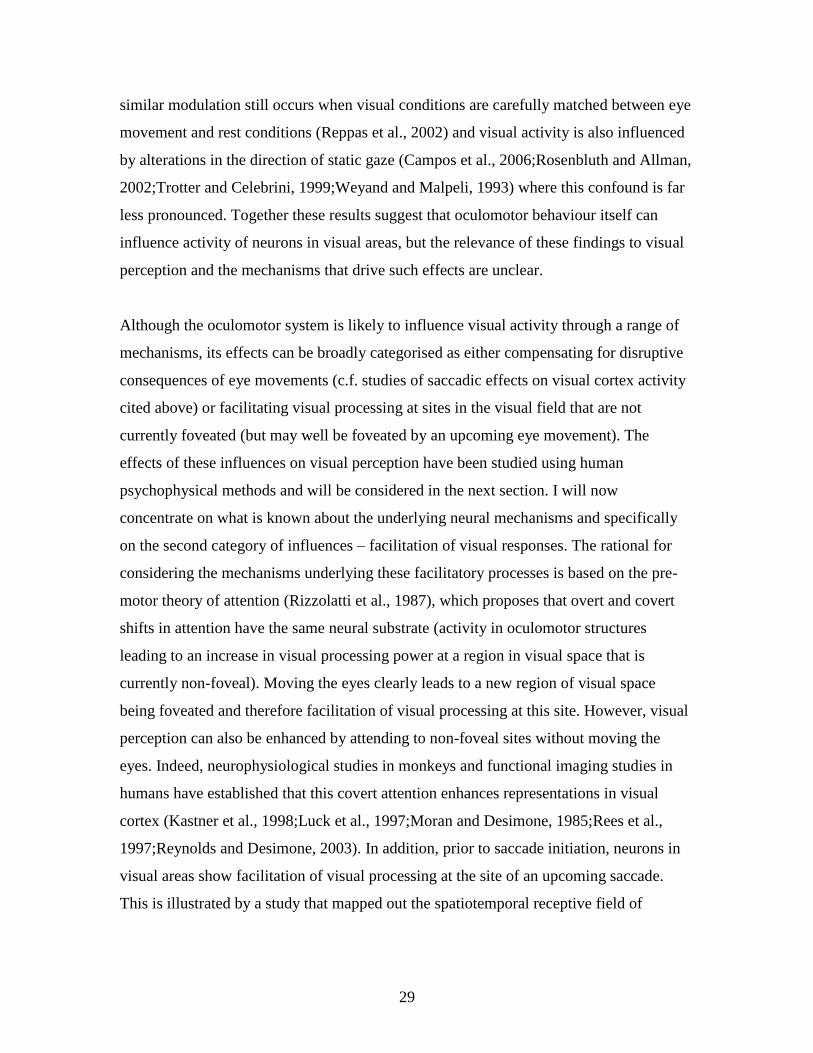
This is illustrated by a study that mapped out the spatiotemporal receptive field of
30
macaque V4 neurons perisaccadically, finding that receptive fields shrunk and shifted
towards the target of a saccade prior to saccade initiation (Tolias et al., 2001 - figure 1.8).
Figure 1.8. The location of V4 neurons presaccadic, perisaccadic and postsaccadic receptive field
A/B. Each plot shows the receptive field (RF) structure for a single V4 neuron (mapped using a probe
stimulus). The edges of the presaccadic RF (shown in blue), the perisaccadic-RF (shown in red), and the
postsaccadic-RF (shown in green) are drawn for each neuron. The perisaccadic RF shrinks and is shifted
towards the saccade target. FT (fixation target). ST (saccade target).
C. The time-bins at which the presaccadic RF, perisaccadic-RF and postsaccadic-RF were calculated,
shown schematically relative to the eye trace (Tolias et al., 2001).

31
Thus both covert and overt shifts of attention can lead to modulation of receptive field
structure that is consistent with enhancement of visual processing at the locus of visual
attention. In line with the premotor theory of attention, one possible explanation for these
findings is that neural facilitation at covertly attended sites in the visual field (either prior
to a saccade or without any eye movement) is directly caused by top down influences
from oculomotor structures. Several studies have provided evidence that brain areas with
established roles in the programming of visually-guided saccadic eye movements, such as
the FEF (Moore and Fallah, 2001;Moore and Fallah, 2004), the SC (Cavanaugh and
Wurtz, 2004;McPeek and Keller, 2004a;Muller et al., 2005b) and area LIP (Bisley and
Goldberg, 2003b;Bushnell et al., 1981) are causally involved in covert attention. For
example, Moore and colleagues found that subthreshold microstimulation of FEF neurons
enhances retinotopically corresponding V4 responses to isolated stimuli, suggesting that
FEF stimulation drives covert attention and its neural correlates in visual cortex (Moore
and Armstrong, 2003a;Moore and Fallah, 2004). Spatial updating prior to saccades also
occurs in FEF itself and this seems to be dependent on corollary discharge originating
from the thalamus (Sommer and Wurtz, 2006).
These findings demonstrate that in non-human primates, under certain circumstances,
there is a direct causal relationship between oculomotor activity and modulation of visual
responses. There is far less evidence for similar neural mechanisms in humans. One
approach to studying such questions in humans employed TMS stimulation of FEF and
found modulation of BOLD responses in V1 using concurrent fMRI (Ruff et al., 2006).
However, in general little is known about the neural mechanisms underlying oculomotor
interactions with the visual system in man. In contrast, the effects of oculomotor
behaviour on human visual perception have been extensively studied and can provide a
basis for generating testable hypotheses regarding human the neural basis of integration
of eye movements and vision.
32
1.6 Oculomotor influences on human visual perception
Although diverse effects of both dynamic oculomotor behaviour (saccades, blinks and
pursuit) and changes in static eye position on human visual perception have been
described, very few studies have examined their physiological correlates. As it is
precisely these underlying neural mechanisms that this thesis seeks to explore, I will
concentrate on findings that make specific predictions about the site of oculomotor
effects on vision, or the specific nature of any effects (for instance inhibition or
facilitation). This will allow the generation of hypotheses that can be empirically tested
by directly measuring activity at various sites in the human visual system while varying
the oculomotor behaviour of subjects.
1.6.1 Dynamic oculomotor behaviour
A range of oculomotor behaviours have been shown to influence human visual
perception, but the effect of saccades has been studied most intensively. In contrast to
monkey studies, where examining mechanisms of facilitation at covertly attended sites
(or targets of upcoming saccades) has provided most insight, human psychophysics has
concentrated on how the visually disruptive effects of saccades are avoided. During a
saccade the visual image moves across the retina at high velocity, yet our perception of
the visual world is stable and no blurring or motion of the visual scene is perceived.
There seem to be a number of compensatory mechanisms that act to maintain visual
continuity during saccades. Several groups have shown that there is a significant
reduction in the sensitivity of the visual system during saccades (Bridgeman et al.,
1975;Deubel et al., 1998;Honda, 1993;Honda, 1995;Ross et al., 1997 ;Morrone et al.,
1997). Interestingly similar suppression of vision occurs during eyeblinks (Volkmann et
al., 1980;Volkmann, 1986). In addition to a reduction in visual sensitivity, subjects
mislocalize the position of stimuli presented during saccades in a way that is consistent
with perisaccadic compression of visual space (Morrone et al., 2005). This may play a
role in maintaining visuospatial relationships during saccades and is also seen during
smooth pursuit eye movements (Brenner et al., 2001;Mateeff et al., 1981).
33
Detailed study of the reduction in visual sensitivity seen perisaccadically, has generated
specific hypotheses regarding the underlying physiological processes. There is evidence
that saccadic suppression of vision occurs after retinal processing (Diamond et al., 2000),
but before high level visual information is extracted (Burr et al., 1982;Burr et al., 1994),
suggesting involvement of the earliest stages of visual processing in the brain (LGN and
early visual cortex). In addition, suppression is limited to visual stimuli processed by the
motion processing magnocellular system (Burr et al., 1994), suggesting that activity in
the magnocellular but not the parvocellular visual pathway is modulated by saccades.
Finally suppression of vision occurs prior to saccade initiation (Burr et al., 1994)
suggesting that an efference copy of the saccadic command (originating from structures
involved in saccade generation) rather than feedback from eye muscles is the source of
saccadic suppression. As outlined in the previous section, single cell recording in non-
human primates has shown saccade related modulation of LGN and visual cortex activity
(Duffy and Burchfiel, 1975;Ramcharan et al., 2001;Reppas et al., 2002) and V4 receptive
field changes that could represent the neural correlates of saccadic suppression of vision
and compression of space respectively. However, there is little direct physiological data
in humans concerning activity in retinotopic visual areas during saccades and the source
of saccadic suppression and the physiological basis for other psychophysical findings
(such as magnocellular pathway involvement) have not been examined directly.
1.6.2 Static eye position
In addition to compensating for disruptive effects of dynamic oculomotor behaviour,
perceptual consequences of oculomotor / visual interactions can have other roles. For
example, successful visually guided action requires that visual signals encoded in retinal
co-ordinates be combined with information about the position of the eyes in the head.
This has been shown to occur in many macaque parietal cortical areas, for example area
VIP where visual and tactile information are combined in head centred co-ordinates
(Colby et al., 1998). However, as discussed earlier, single cell recording in monkeys has
shown that early visual areas show modulation of visual responses by static gaze
direction (Campos et al., 2006;Rosenbluth and Allman, 2002;Trotter and Celebrini,
34
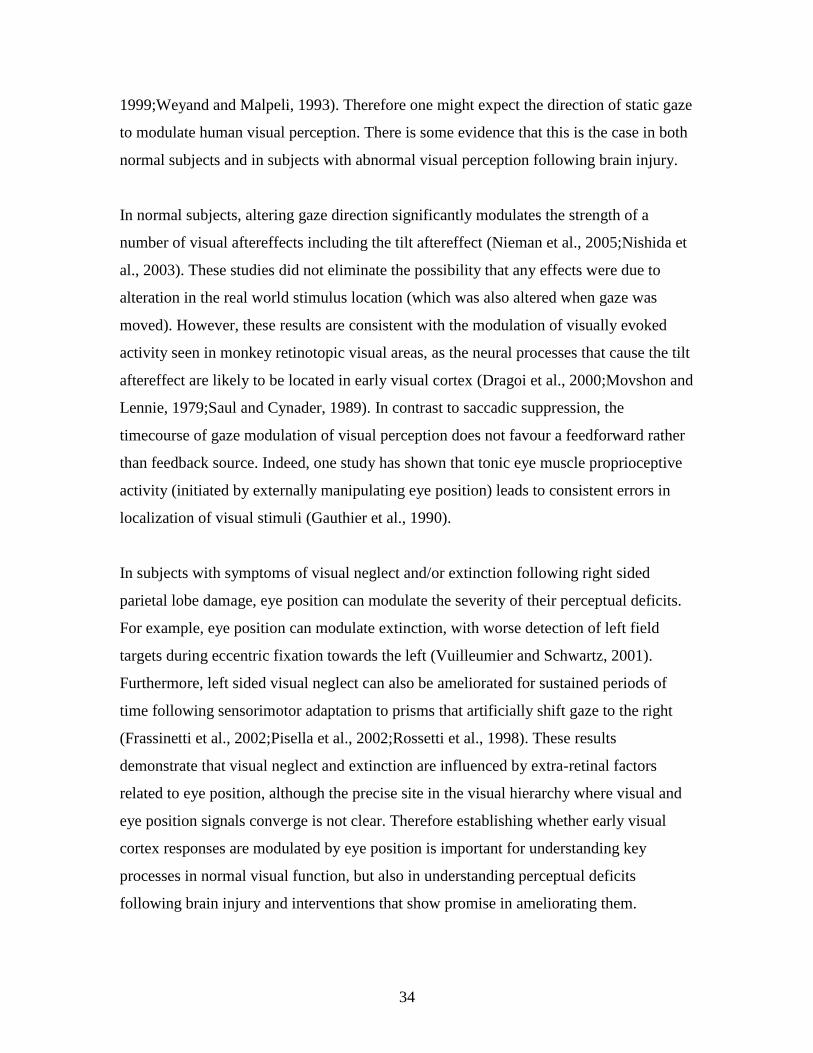
1999;Weyand and Malpeli, 1993). Therefore one might expect the direction of static gaze
to modulate human visual perception. There is some evidence that this is the case in both
normal subjects and in subjects with abnormal visual perception following brain injury.
In normal subjects, altering gaze direction significantly modulates the strength of a
number of visual aftereffects including the tilt aftereffect (Nieman et al., 2005;Nishida et
al., 2003). These studies did not eliminate the possibility that any effects were due to
alteration in the real world stimulus location (which was also altered when gaze was
moved). However, these results are consistent with the modulation of visually evoked
activity seen in monkey retinotopic visual areas, as the neural processes that cause the tilt
aftereffect are likely to be located in early visual cortex (Dragoi et al., 2000;Movshon and
Lennie, 1979;Saul and Cynader, 1989). In contrast to saccadic suppression, the
timecourse of gaze modulation of visual perception does not favour a feedforward rather
than feedback source. Indeed, one study has shown that tonic eye muscle proprioceptive
activity (initiated by externally manipulating eye position) leads to consistent errors in
localization of visual stimuli (Gauthier et al., 1990).
In subjects with symptoms of visual neglect and/or extinction following right sided
parietal lobe damage, eye position can modulate the severity of their perceptual deficits.
For example, eye position can modulate extinction, with worse detection of left field
targets during eccentric fixation towards the left (Vuilleumier and Schwartz, 2001).
Furthermore, left sided visual neglect can also be ameliorated for sustained periods of
time following sensorimotor adaptation to prisms that artificially shift gaze to the right
(Frassinetti et al., 2002;Pisella et al., 2002;Rossetti et al., 1998). These results
demonstrate that visual neglect and extinction are influenced by extra-retinal factors
related to eye position, although the precise site in the visual hierarchy where visual and
eye position signals converge is not clear. Therefore establishing whether early visual
cortex responses are modulated by eye position is important for understanding key
processes in normal visual function, but also in understanding perceptual deficits
following brain injury and interventions that show promise in ameliorating them.
35
1.7 Summary of current studies
The experiments presented in this thesis all attempt to characterize the neural basis of the
interaction between the human oculomotor and visual systems. All the studies use fMRI
to examine this interaction in retinotopically mapped visual areas in normal human
subjects. The basis of fMRI acquisition, analysis and retinotopic mapping are
summarised in Chapter 2. The experimental studies can be grouped according to whether
they examine the effect of dynamic oculomotor behaviour on visual activity (Chapters
3,4,5), static eye position (Chapter 6) or visual effects on oculomotor activity (Chapter 7).
Chapter 3 presents a study that aims to characterize the effect of saccadic eye movements
on activity in human LGN and early retinotopic cortex for a range of visual conditions.
These visual conditions include presentation of visual stimuli primarily processed by
either the magnocellular or parvocellular systems, plus total darkness. This allows two
related hypotheses to be tested:
i) Visually evoked activity in LGN and early retinotopic visual cortex is
suppressed by saccades.
ii) Activity related to stimuli processed by the magnocellular visual pathway
alone is suppressed during saccades.
Chapter 4 presents a re-analysis of the data from the experiment presented in Chapter 3
using Dynamic Causal Modelling (Friston et al., 2003b). This method attempts to define
the relationships that lead to changes in activity in a network of brain structures across
different experimental manipulations. Therefore this type of analysis can start to define
the sources and primary site of saccadic modulation of visual activity.
Chapter 5 presents a further study of saccadic influences on early visual activity that tests
the hypothesis that saccades result in an extraretinal signal in visual areas (corollary
discharge or efference copy) that can be isolated from any visually evoked activity.
36
Chapter 6 presents a study that examines whether visually evoked activity in early
rertinotopic visual cortex is modulated by static eye position. This study also compares
univariate and multivariate analysis techniques to explore whether gaze direction has a
distributed representation in visual cortex.
Chapter 7 presents a study that uses fMRI to image visual responses in human SC, a
technically challenging structure to image given its small size and location near many
large blood vessels. This chapter then examines whether visually evoked responses in the
SC show increased responses to stimuli presented in the temporal compared to nasal
hemifield – as predicted by psychophysical studies in normals and subjects with damaged
geniculostriate pathways.
1.8 Conclusion
Modern cognitive neuroscience aims to develop models that accurately describe the
relationship between neurophysiological events in the brain and human behaviour and
experience. It is becomingly increasingly clear that to successfully fulfil this aim requires
sophisticated models of brain function that go beyond those that ascribe unitary functions
to brain structures. The world we live in is not segregated and functionally related brain
structures must interact in order to extract information and guide behaviour in such a
complex environment. Using human vision as an example, visual processing does not
occur in isolation, but takes place within the context of dynamic oculomotor behaviour
and the physiological processes underlying visual processing and oculomotor behaviour
must be closely linked. Therefore an ideal description of visual or oculomotor processing
would define oculomotor effects in primarily visual brain structures and visual effects in
primarily oculomotor structures. In addition, the functional role of connections between
visual and oculomotor brain areas needs to be explored. Taken together, the series of
experiments outlined above will allow the neural basis for the interaction between
oculomotor behaviour and visual perception to be systematically examined in the human
brain for the first time.
37
CHAPTER 2 : GENERAL METHODS
2.1 Introduction
This chapter will describe the methods that are common to all of the studies presented in
this thesis. These are functional MRI (fMRI), the analysis of fMRI data using statistical
parametric mapping (SPM) and the localisation of early cortical visual areas in individual
subjects using retinotopic mapping. Other methods that are utilised in individual studies,
such as electro-oculography, long range infrared eye tracking, multivariate analysis
techniques, modelling effective connectivity and localization of subcortical structures
(such as the lateral geniculate nucleus and the superior colliculus) and visual area V5/MT
will be discussed in the relevant chapters describing the studies that used those
techniques.
2.2 Functional MRI
2.2.1 Physics of MRI
Magnetic Resonance Imaging relies on the relaxation properties of excited hydrogen
nuclei in body tissue (e.g. water and fat). When an object (typically a subject‟s brain) is
placed in a uniform magnetic field (Bø), the spins of unpaired atomic nuclei (mainly
protons) within it align parallel to this uniform magnetic field. By analogy with a
spinning top under the influence of gravity, the spinning protons precess around the axis
of the B0 at a frequency proportional to the strength of Bø (known as the resonance
frequency). The direction of the precessing around the main field direction is random for
all nuclei and the net „transverse magnetisation‟ (Mø) is zero. However, if a radio
frequency (RF) pulse is applied perpendicular to Bø at the resonance frequency, nuclei
absorb this energy and their spins move away from their equilibrium positions. This leads
to Mø aligning away from Bø, towards the new applied radio frequency magnetic field
38
(B1) and gives rise to non-zero transverse magnetisation in the XY plane (Mxy), if the
original magnetic field, Bø, is aligned to the Z-axis.
As the protons relax and realign, they emit energy which is recorded in a receiver coil
surrounding the subject‟s brain and provides information about the structures being
scanned. The nature of this information depends on the time constants involved in the
relaxation processes following RF excitation. The realignment of nuclear spins with the
magnetic field is termed longitudinal relaxation and the time (typically about 1 sec)
required for a certain percentage of the tissue nuclei to realign is termed T1. T1 is
affected by the composition of the environment and thus is different in different tissues,
which can be used to provide contrast between tissues. T2-weighted imaging relies upon
local dephasing of spins following the application of the transverse energy pulse; the
transverse relaxation time (typically < 100 ms) is termed T2. T2 imaging usually employs
a spin echo technique, in which spins are refocused to compensate for local magnetic
field inhomogeneities. T2* imaging (used in fMRI) is performed without refocusing and
sacrifices image fidelity in order to provide additional sensitivity for the T2 relaxation
processes.
2.2.2 Formation of Images using MRI
To create an image with MRI, protons have to be distinguishable on the basis of their
spatial location. As Bø is homogeneous, the frequency of emitted RF signals is not
affected by the specific location of protons in a sample. In order to localise the nuclei an
additional magnetic field is applied by passing currents through coils placed around the
subject. This varies across the subject, causing the resonant frequencies of the nuclei to
vary according to their position (the amplitude of the signal at that frequency depends on
the number of protons in that particular location) and allows the encoding of position
along the x-axis. Phase encoding enables encoding of position in a second dimension
(along the y-axis). Resolution in the third dimension (along the z-axis) is created by
exciting the sample one slice at a time, by combining the frequency gradient with an RF
pulse of a particular frequency and bandwidth. Discrete increases in the frequency
39
encoding and phase encoding gradients divide each slice into small cubes, called voxels
(volume elements). All the protons in a voxel experience the same frequency and phase
encoding, and the signal from a voxel is the sum of the signal for all the protons in that
voxel.
Contrast in the image is created by the differences in signal intensity from different
tissues. The largest contribution to the signal comes from hydrogen atoms in tissue water
(or other biological fluids such as blood), and signal intensity depends in part on the
density of these nuclei. Signal intensity is also determined by T1 and T2 relaxation times,
the magnetic susceptibility of the tissue (determined by other protons and electron clouds
in the tissue), and the characteristics of the RF pulse. Spins from solid tissues such as
bone are not detectable by MRI because their relaxation times are so fast that they have
returned to equilibrium before any signal is detected.
2.2.3 Echo-planar imaging
Echo-planar imaging (EPI), allows extremely rapid acquisition of whole brain images.
An image of a complete slice can be acquired in less than 100ms. The acquired data are
Fourier transformed from the spatial frequency domain to the spatial domain. The
transformed data are considered to lie in a two dimensional spatial frequency space,
called K-space. EPI sequences acquire data from all the lines of K-space after each RF
pulse, whereas other MRI sequences can only acquire data from one line per RF pulse.
This means that acquisition time is far lower for EPI, making it very suitable for
recording dynamic information, like in fMRI. All the fMRI experiments in this thesis use
EPI sequences.
2.2.4 BOLD signal
Neuronal activity and increased local glucose metabolism are tightly coupled to a local
increase in blood flow. FMRI measures neural activity indirectly by detecting changes in
regional blood flow as indicated by blood oxygenation levels. The MRI signal is sensitive
40
to the oxygenation state of haemoglobin (Blood Oxygenation Level Dependent contrast)
as deoxyhaemoglobin is more paramagnetic than oxyhaemoglobin (Pauling and Coryell,
1936). Paramagnetic substances have a more rapid transverse relaxation time, and a
shorter T2* time constant, resulting in a reduced T2* weighted MRI signal. Thus
deoxyhaemoglobin produces a smaller MRI signal than oxyhaemoglobin. This is what
underlies the BOLD signal, as blood with more deoxyhaemoglobin will produce a
reduced signal relative to highly oxygenated blood. This was first demonstrated in mice
(Ogawa et al., 1990) and in cats (Turner et al., 1991) and subsequently in human visual
cortex (Kwong et al., 1992).
BOLD contrast is determined by the balance between supply, determined by blood flow
and blood volume, and demand, determined by the surrounding tissue's rate of glucose
metabolism, and consumption of oxygen. Local increases in neural activity lead to
increased glucose metabolism and increased oxygen consumption (Hyder et al., 1997).
After about 100ms there is a relative deoxygenation of the blood in surrounding vessels
(Vanzetta and Grinvald, 1999), coupled to vasodilatation and increased blood flow to the
500-1000ms later (Villringer and Dirnagl, 1995). As the rise in oxygen uptake is smaller
than the rise in blood flow to activated brain regions (Fox and Raichle, 1986), there is an
overall increase in blood oxygenation levels lasting for several seconds. This
overcompensation is the basis for the increased BOLD signal seen when neural activity
increases. This increase in BOLD contrast, caused by the decrease in deoxyhaemoglobin
and measured in fMRI, is delayed in time with respect to the neural activity. Typically
the BOLD signal peaks 4-6 seconds after the onset of neural activity. The rise and
subsequent return to baseline of the BOLD signal is known as the Haemodynamic
Response Function (HRF).
2.2.5 Resolution of fMRI
The limitations on the spatial and temporal resolution of fMRI are physiological and are
imposed by the spatio-temporal properties of the HRF. Spatial resolution is limited to 2-
5mm and temporal resolution is limited to seconds (Friston et al., 1998). The BOLD

41
signal originates in red blood cells in capillaries and veins surrounding the activated
neural tissue, and thus is an indirect measure of tissue oxygenation and neural activation,
thus the maximum spatial resolution obtainable with the BOLD signal is dependent on
the local structure and density of the vasculature in a particular brain region.
2.2.6 Neural basis of BOLD signal
The specific cellular and molecular mechanisms underlying the BOLD signal are still a
matter for debate. It is widely believed that increased blood flow follows directly from
increased synaptic activity, as blood flow increases in proportion to glucose consumption
(Fox et al., 1988) and glucose metabolism is linked to synaptic activity (Magistretti and
Pellerin, 1999;Schwartz et al., 1979;Shulman and Rothman, 1998;Sibson et al., 1998).
However, this does not explain the mismatch between blood flow and oxygen
consumption described earlier. One proposal is that increases in brain activation are
supported by glycolysis (non-oxidative glucose metabolism) (Fox et al., 1988;Fox and
Raichle, 1986). In particular, astrocytes which have a crucial role in neurotransmitter
recycling and surround both synapses and intraparenchymal capillaries, rely on glycolysis
(Magistretti and Pellerin, 1999). However, astrocytes may rely on stores of glycogen to
provide energy during transient periods of strong neuronal activity, obviating the need for
increased glucose delivery (Shulman et al., 2001).
An alternative view is that the blood flow response does serve to deliver oxygen to active
neurons, but the apparent mismatch between blood flow and oxygen consumption is a
consequence of extraction (by passive diffusion) of oxygen from the blood being less
efficient at higher flow rates (Buxton and Frank, 1997;Hyder et al., 1998;Vafaee and
Gjedde, 2000). Therefore a disproportionately large change in blood flow is required to
support a small change in oxygen metabolism. This view is supported by the finding that
oxygen consumption increases with neuronal activity, although to a lesser extent than
blood flow (Davis et al., 1998;Hoge et al., 1999) and estimates of brain metabolism show
that most of the energy is used by neurons (and correlates with increased firing rates). In
contrast only a small percentage of the energy is used for neurotransmitter recycling by
42
the astrocytes (Attwell and Laughlin, 2001). However, both the theories outlined above
assume that the relationship between blood flow response and glucose consumption (or
oxygen consumption) is causal, whereas the current evidence only shows correlation.
Interestingly, the blood flow response is not affected by sustained hypoxia or
hypoglycaemia (Mintun et al., 2001;Powers et al., 1996), suggesting that this causal
assumption may be false.
The signals that cause the blood flow response are far from clear and may be multiple
(Magistretti and Pellerin, 1999;Villringer and Dirnagl, 1995). The response might be
triggered by lactate (released by astrocytes), implying a tight link between the fMRI
signal and synaptic activity. However, there is evidence that nitric oxide, a diffusible by-
product of neuronal spiking, has a role. Specifically, the blood flow response is reduced
by blocking nitric oxide synthase while preserving the normal level of glucose
metabolism (Cholet et al., 1997). Finally, the blood flow response might be triggered
within the blood vessels themselves, in response to transient decreases in oxygenation
that occur immediately after a neurons firing rate increases.
In order to compare fMRI studies with electrophysiological studies, it is clearly important
to understand the relationship between the BOLD signal and patterns of activity shown
by invasive recording techniques. A comparison of single unit data from monkey V5/MT
(a motion responsive cortical area) with human fMRI measurements from V5/MT (the
human homologue) showed that neuronal firing and BOLD responses increased linearly
with increasing motion coherence (Rees et al., 2000). This is consistent with the two
measures being well correlated. Furthermore, simultaneous recording of multi-unit
activity (MUA) and local field potential (LFPs) from microelectrodes placed in monkey
primary visual cortex while measuring BOLD contrast responses using fMRI (Logothetis
et al., 2001) has broadly shown good correlation between these measures. However the
correlation was variable over the brain areas studied. LFPs correlated slightly more than
MUA with the BOLD response. MUA represents the spiking activity of neurons near
(~200m) the electrode tip, while LFPs reflect synchronised dendritic currents averaged
over a larger volume of tissue (reflecting inputs and intracortical activity), and they often
43
(but not always) correlated with output spiking activity. This suggests that the BOLD
response probably reflects additional components over and above spiking output. Further
studies that decouple inputs and intracortical activity from spiking may shed light on this
unresolved issue.
2.3 FMRI Analysis
All fMRI data acquired for the experiments in this thesis were analysed (at least in part)
with Statistical Parametric Mapping software, SPM2, developed at the Wellcome
Department of Imaging Neuroscience (http://www.fil.ion.ucl.ac.uk/spm/). SPM is a set of
software tools implemented in MATLAB that allows preprocessing of fMRI data into a
form that can then undergo statistical analysis to look at the effect of experimentally
manipulated variables. The analyses were similar in all studies. First a series of spatial
transformations was applied to each subject‟s data, to align and warp it to the anatomical
space of the T1 structural image for that subject. In some (but not all) cases this data was
then smoothed. Next a model of the hypothesised BOLD signal changes during all
conditions in the experiment was created and the data fitted to the model using a General
Linear Model. Analysis of the resulting parameter estimates was limited to defined a
priori regions of interest (sub-cortical or retinotopic visual cortex in individual subjects)
and tested for statistical significance across subjects. Therefore many „standard‟ SPM
techniques such as spatial normalization and multiple comparison correction across the
whole brain are not relevant to this thesis and will not be discussed here.
2.3.1 Preprocessing
2.3.1.1 Spatial realignment
Head motion during the scan causes changes in signal intensity of a voxel over time, due
to movement of the head through the fixed field of view, a serious confound. Despite
head restraints, most subjects will move their heads at least a few millimetres.
Realignment involves applying an affine rigid-body transformation to align each scan
44
with a reference scan (usually the first scan or the average of all scans) and resampling
the data using tri-linear, sinc or spline interpolation. The 6 parameters of the rigid-body
transformation, representing adjustments to pitch, yaw, roll, and in X, Y, Z position, are
estimated iteratively to minimise the sum of squares difference between each successive
scan and the reference scan (Friston, 1995). However, even after realignment significant
movement related signals persist (Friston et al., 1996). This is due to non-linear effects,
including movements between slice acquisitions, interpolation artefacts, non-linear
distortion of magnetic field and spin excitation history effects, which cannot be corrected
using an affine linear transformation. These non-linear movement related effects can be
estimated and subtracted from the original data by including the estimated movement
parameters from the realignment procedure in the design matrix during the model
estimation stage of the analysis (Friston et al., 1996).
2.3.1.2 Coregistration to T1 structural image
After realignment the mean functional image (created during realignment) is used to
estimate the warping parameters that map this mean image onto that subject‟s structural
image. The warping is modelled as a 12-parameter affine transformation, where the
parameters constitute a spatial transformation matrix. The parameters are estimated
iteratively, within a Bayesian framework, to maximise the posterior probability of the
parameters being correct. The posterior probability is the probability of getting the given
data, assuming the current estimate of the transformation is true, times the probability of
that estimate being true (Ashburner et al., 1997). Finding this solution involves jointly
minimising the sum-of-squares differences between the T1 image and the deformed mean
functional image (the likelihood potential), and the prior potentials, which are used to
incorporate prior information about the likelihood of a particular warp. The estimated
warp is then applied to all the functional images.
45
2.3.1.3 Spatial Smoothing
Functional images are generally spatially smoothed with a three-dimensional isotropic
Gaussian kernel of 5-10 mm full width at half maximum. There are several reasons for
doing this:
1) Smoothing the data makes the errors more normal ensuring the validity of
parametric statistical test, which are based on the assumption that the errors are
normally distributed.
2) Smoothing with a Gaussian kernel makes the data fit the assumptions of the
Gaussian Random field model, which is used to make statistical inferences about
regional effects, more closely (Adler, 1981).
3) Smoothing compensates for any small variations in anatomy between subjects that
still exist after normalisation, reducing the variation in the localisation of
activations across subjects (this is less relevant in the single subject designs used
in studies presented in this thesis – where normalisation is not used).
2.3.2 Statistical Parametric Mapping
2.3.2.1 Basic approach
The approach used by SPM for analysis of fMRI data is based on the conjoint use of the
General Linear Model (GLM) and Gaussian Random Field (GRF) theory to test
hypotheses and make inferences about spatially extended data through the use of
statistical parametric maps. The GLM is used to estimate parameters for the variables that
could explain the BOLD signal time series recorded in each and every voxel individually.
The resulting statistical parameters determined at each and every voxel are then
assembled into three-dimensional images – Statistical Parametric Maps (SPM), that can
then be contrasted with one another. Gaussian random field theory is used to resolve the
problem of multiple comparisons that occurs when conducting statistical tests across the
whole brain. The voxel values of the SPM are considered to be distributed according to
46
the probabilistic behaviour of Gaussian fields, and „unlikely‟ excursions of the SPM are
interpreted as regionally specific effects, caused by the experimentally manipulated
variables.
2.3.2.2 GLM
The general linear model is used in SPM to partition the variance in the observed
neurosphysiological response into components of interest, i.e. the experimentally
manipulated variables, confounds and error, and to make inferences about the effects of
interest in relation to the error variance. For each voxel the GLM explains variations in
the BOLD signal time series (Y) in terms of a linear combination of explanatory variables
(x) plus an error term (ε):
Yj = xj1β1 + xj2β2 + …… + xjlβl + ..…. + xjLβL + ε
The β parameters reflect the independent contribution of each independent variable, x, to
the value of the dependent variable, Y, .i.e. the amount of variance in Y that is accounted
for by each x variable after all the other x variables have been accounted for. The errors,
ε, are assumed to be identically and normally distributed. The GLM can also be
expressed in matrix formulation:
Y = Xβ + ε
Where Y is a vector of J BOLD signal measurements (one per image volume) at a
particular voxel (Y = [1…j…J]) and β is the vector of the parameters to be estimated (β=[
β1… βj… βJ]. X is the design matrix containing the variables which explain the observed
data. The matrix has J rows, one per observation, and L columns, one per explanatory
variable (x) (also referred to as covariates or regressor).
The regressors, which form the columns of the design matrix (and have one value of x for
each time point j), are created for each explanatory variable manipulated in the
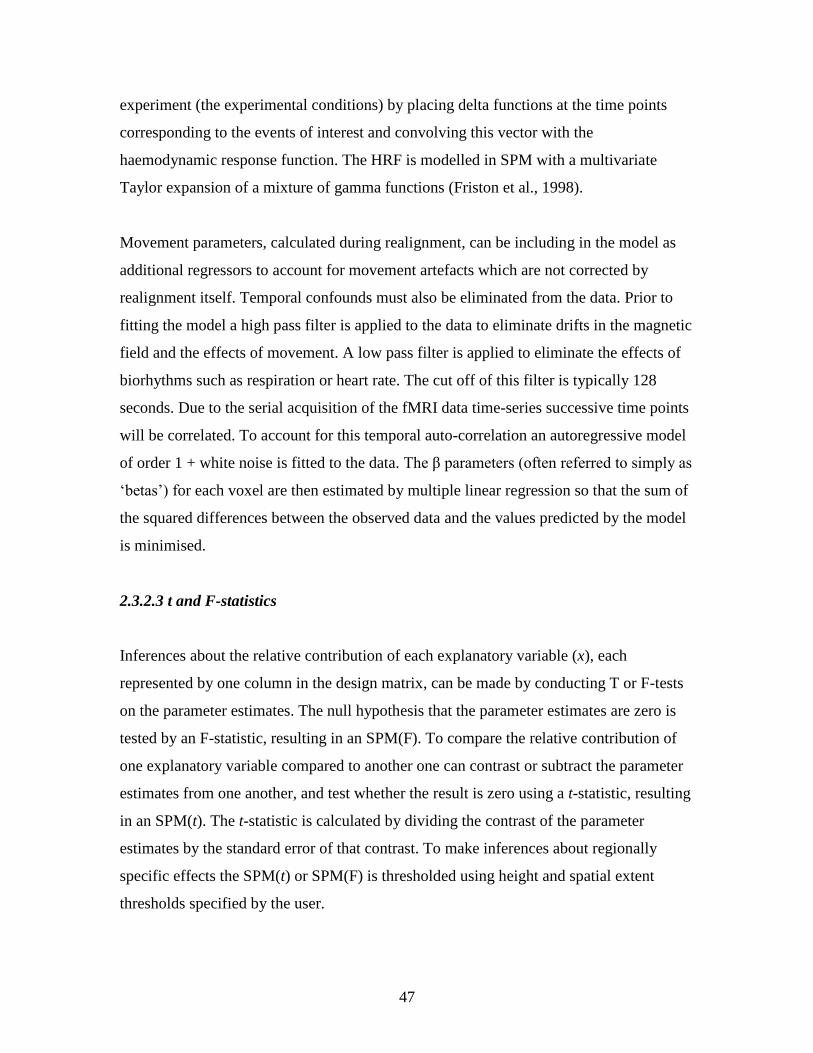
47
experiment (the experimental conditions) by placing delta functions at the time points
corresponding to the events of interest and convolving this vector with the
haemodynamic response function. The HRF is modelled in SPM with a multivariate
Taylor expansion of a mixture of gamma functions (Friston et al., 1998).
Movement parameters, calculated during realignment, can be including in the model as
additional regressors to account for movement artefacts which are not corrected by
realignment itself. Temporal confounds must also be eliminated from the data. Prior to
fitting the model a high pass filter is applied to the data to eliminate drifts in the magnetic
field and the effects of movement. A low pass filter is applied to eliminate the effects of
biorhythms such as respiration or heart rate. The cut off of this filter is typically 128
seconds. Due to the serial acquisition of the fMRI data time-series successive time points
will be correlated. To account for this temporal auto-correlation an autoregressive model
of order 1 + white noise is fitted to the data. The β parameters (often referred to simply as
„betas‟) for each voxel are then estimated by multiple linear regression so that the sum of
the squared differences between the observed data and the values predicted by the model
is minimised.
2.3.2.3 t and F-statistics
Inferences about the relative contribution of each explanatory variable (x), each
represented by one column in the design matrix, can be made by conducting T or F-tests
on the parameter estimates. The null hypothesis that the parameter estimates are zero is
tested by an F-statistic, resulting in an SPM(F). To compare the relative contribution of
one explanatory variable compared to another one can contrast or subtract the parameter
estimates from one another, and test whether the result is zero using a t-statistic, resulting
in an SPM(t). The t-statistic is calculated by dividing the contrast of the parameter
estimates by the standard error of that contrast. To make inferences about regionally
specific effects the SPM(t) or SPM(F) is thresholded using height and spatial extent
thresholds specified by the user.

48
2.4 Retinotopic Mapping
The response properties of neurons in primary visual cortex are often significantly
different to those of neurons in V2 or V3. This holds for basic properties; such as
receptive field size (Smith et al., 2001) and more complex properties; such as the
modulation of responses by directed attention (Kastner et al., 2004). This means that
precise delineation of the borders of early visual areas is of crucial importance to the
success of fMRI studies of human vision. In addition, it is often necessary to localize
activations in the occipital cortex to specific early visual areas. However, there is wide
inter-subject anatomical variability of early visual areas which precludes the assignment
of visual area borders based on stereotactically normalised coordinates (Dougherty et al.,
2003). Thus, unless a more accurate method is used, voxels representing adjacent visual
areas (with very different neuronal response properties) will often be incorporated into a
single „visual‟ region of interest or visual activations will be mislocalized. Fortunately,
early visual cortical areas are retinotopically organised, that is, their neurons respond to
stimulation of limited receptive fields whose centres are organized to form a continuous
mapping between the cortical surface and the contralateral visual field. This consistent
organisation can be utilised to accurately determine the boundaries between early visual
cortical areas using fMRI (Engel et al., 1994;Sereno et al., 1995).
In order to appreciate the basis of retinotopic mapping, it is necessary to review the
anatomy of the occipital lobe. Within each hemisphere, human area V1 occupies a
roughly 4- by 8-cm area located at the posterior pole of the brain in the occipital lobe. A
large fraction of area V1 falls in the calcarine sulcus. The relationship between locations
in retinotopic space and those of the cortical surface of V1 are shown in Figure 2.1. From
posterior to anterior cortex, the visual field representation shifts from the centre (fovea) to
the periphery. The midline of V1 represents the horizontal meridian, while the boundary
of V1 and V2 represents the vertical meridian (both dorsally and ventrally). The local
representation of the visual field on the cortical surface changes its orientation at the
boundaries between V1 and V2 (and V2 and V3). Therefore, the spatial extent of
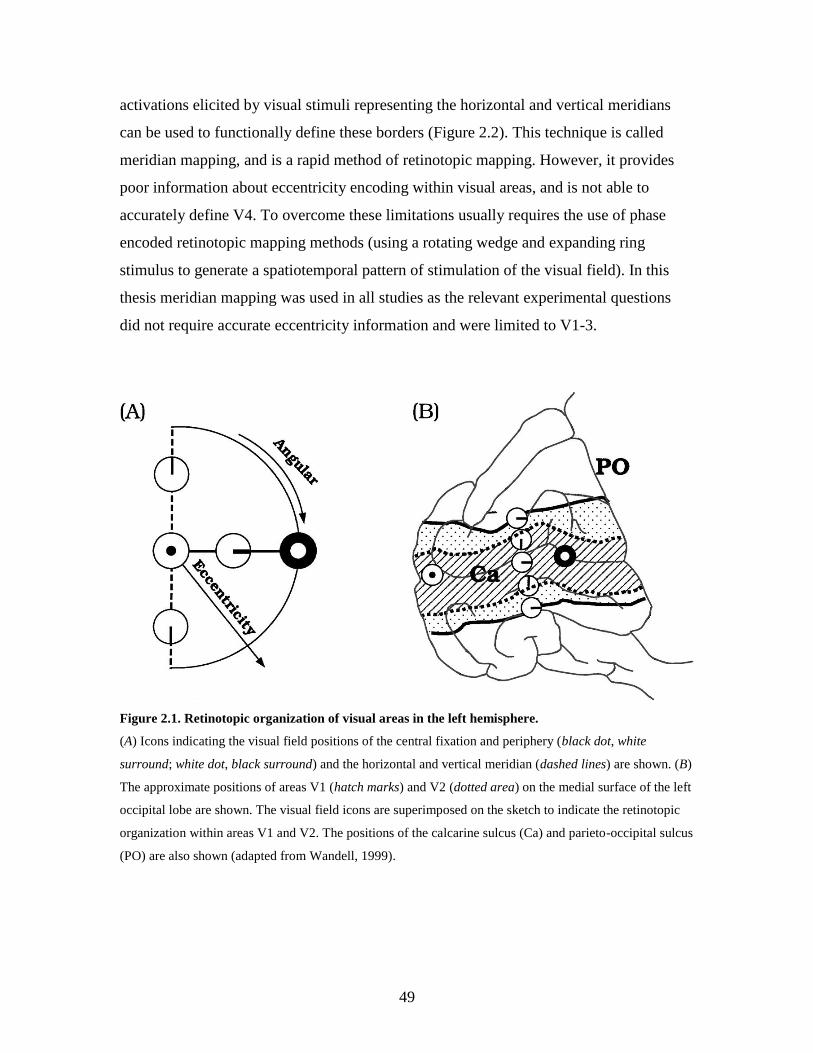
49
activations elicited by visual stimuli representing the horizontal and vertical meridians
can be used to functionally define these borders (Figure 2.2). This technique is called
meridian mapping, and is a rapid method of retinotopic mapping. However, it provides
poor information about eccentricity encoding within visual areas, and is not able to
accurately define V4. To overcome these limitations usually requires the use of phase
encoded retinotopic mapping methods (using a rotating wedge and expanding ring
stimulus to generate a spatiotemporal pattern of stimulation of the visual field). In this
thesis meridian mapping was used in all studies as the relevant experimental questions
did not require accurate eccentricity information and were limited to V1-3.
Figure 2.1. Retinotopic organization of visual areas in the left hemisphere.
(A) Icons indicating the visual field positions of the central fixation and periphery (black dot, white
surround; white dot, black surround) and the horizontal and vertical meridian (dashed lines) are shown. (B)
The approximate positions of areas V1 (hatch marks) and V2 (dotted area) on the medial surface of the left
occipital lobe are shown. The visual field icons are superimposed on the sketch to indicate the retinotopic
organization within areas V1 and V2. The positions of the calcarine sulcus (Ca) and parieto-occipital sulcus
(PO) are also shown (adapted from Wandell, 1999).
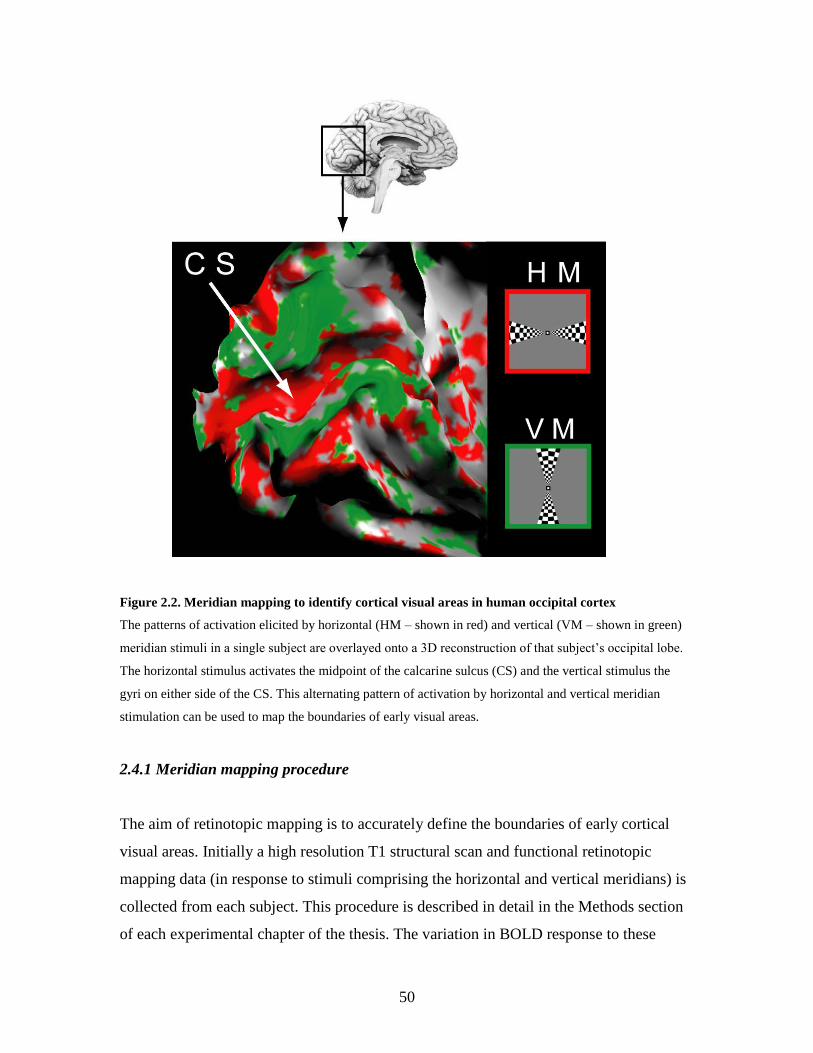
50
Figure 2.2. Meridian mapping to identify cortical visual areas in human occipital cortex
The patterns of activation elicited by horizontal (HM – shown in red) and vertical (VM – shown in green)
meridian stimuli in a single subject are overlayed onto a 3D reconstruction of that subject‟s occipital lobe.
The horizontal stimulus activates the midpoint of the calcarine sulcus (CS) and the vertical stimulus the
gyri on either side of the CS. This alternating pattern of activation by horizontal and vertical meridian
stimulation can be used to map the boundaries of early visual areas.
2.4.1 Meridian mapping procedure
The aim of retinotopic mapping is to accurately define the boundaries of early cortical
visual areas. Initially a high resolution T1 structural scan and functional retinotopic
mapping data (in response to stimuli comprising the horizontal and vertical meridians) is
collected from each subject. This procedure is described in detail in the Methods section
of each experimental chapter of the thesis. The variation in BOLD response to these
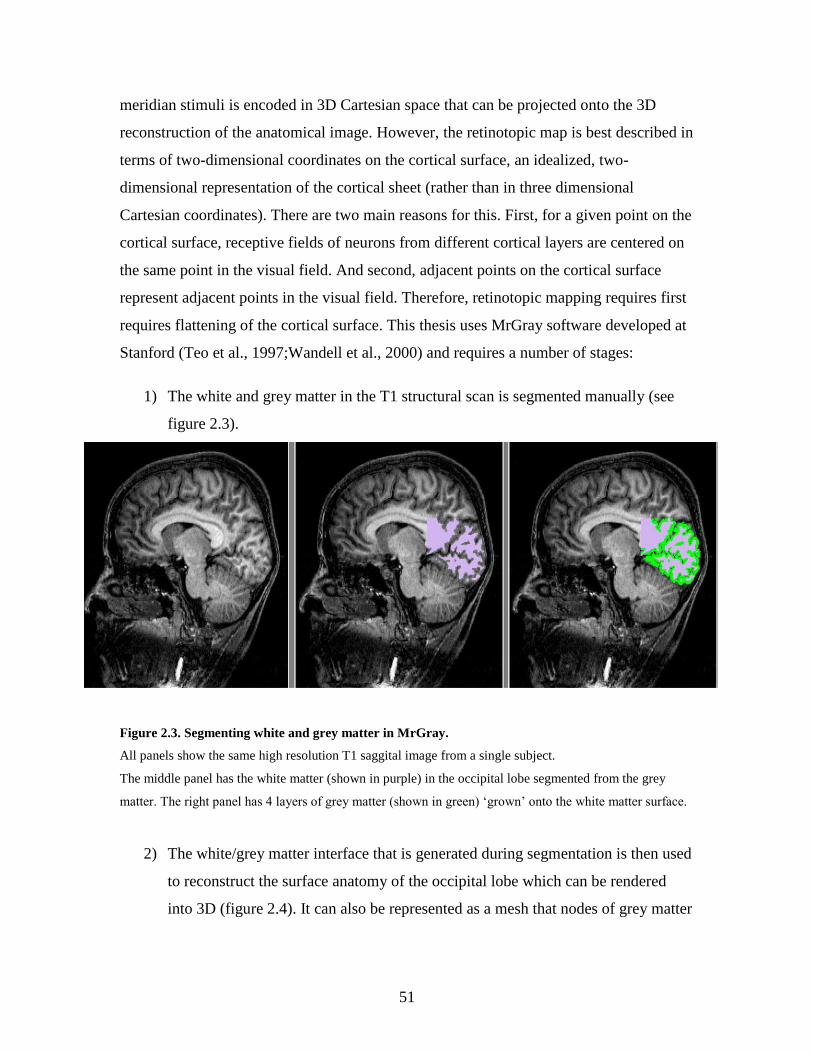
51
meridian stimuli is encoded in 3D Cartesian space that can be projected onto the 3D
reconstruction of the anatomical image. However, the retinotopic map is best described in
terms of two-dimensional coordinates on the cortical surface, an idealized, two-
dimensional representation of the cortical sheet (rather than in three dimensional
Cartesian coordinates). There are two main reasons for this. First, for a given point on the
cortical surface, receptive fields of neurons from different cortical layers are centered on
the same point in the visual field. And second, adjacent points on the cortical surface
represent adjacent points in the visual field. Therefore, retinotopic mapping requires first
requires flattening of the cortical surface. This thesis uses MrGray software developed at
Stanford (Teo et al., 1997;Wandell et al., 2000) and requires a number of stages:
1) The white and grey matter in the T1 structural scan is segmented manually (see
figure 2.3).
Figure 2.3. Segmenting white and grey matter in MrGray.
All panels show the same high resolution T1 saggital image from a single subject.
The middle panel has the white matter (shown in purple) in the occipital lobe segmented from the grey
matter. The right panel has 4 layers of grey matter (shown in green) „grown‟ onto the white matter surface.
2) The white/grey matter interface that is generated during segmentation is then used
to reconstruct the surface anatomy of the occipital lobe which can be rendered
into 3D (figure 2.4). It can also be represented as a mesh that nodes of grey matter
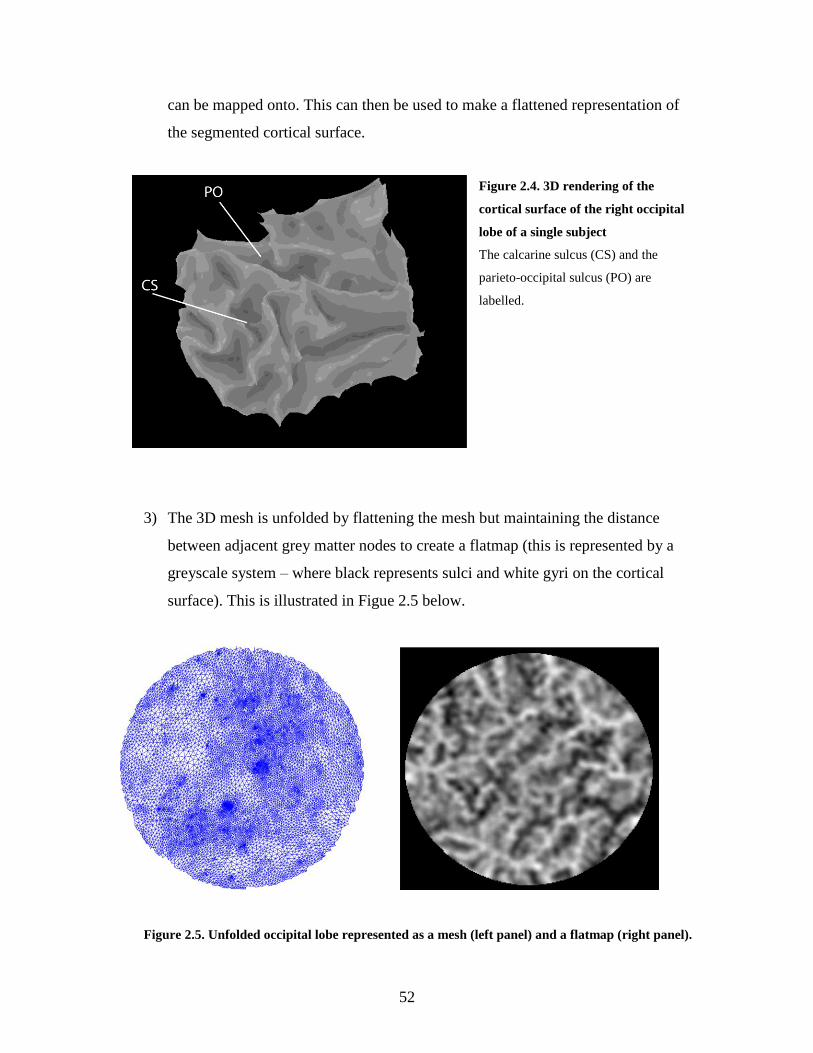
52
can be mapped onto. This can then be used to make a flattened representation of
the segmented cortical surface.
Figure 2.4. 3D rendering of the
cortical surface of the right occipital
lobe of a single subject
The calcarine sulcus (CS) and the
parieto-occipital sulcus (PO) are
labelled.
3) The 3D mesh is unfolded by flattening the mesh but maintaining the distance
between adjacent grey matter nodes to create a flatmap (this is represented by a
greyscale system – where black represents sulci and white gyri on the cortical
surface). This is illustrated in Figue 2.5 below.
Figure 2.5. Unfolded occipital lobe represented as a mesh (left panel) and a flatmap (right panel).
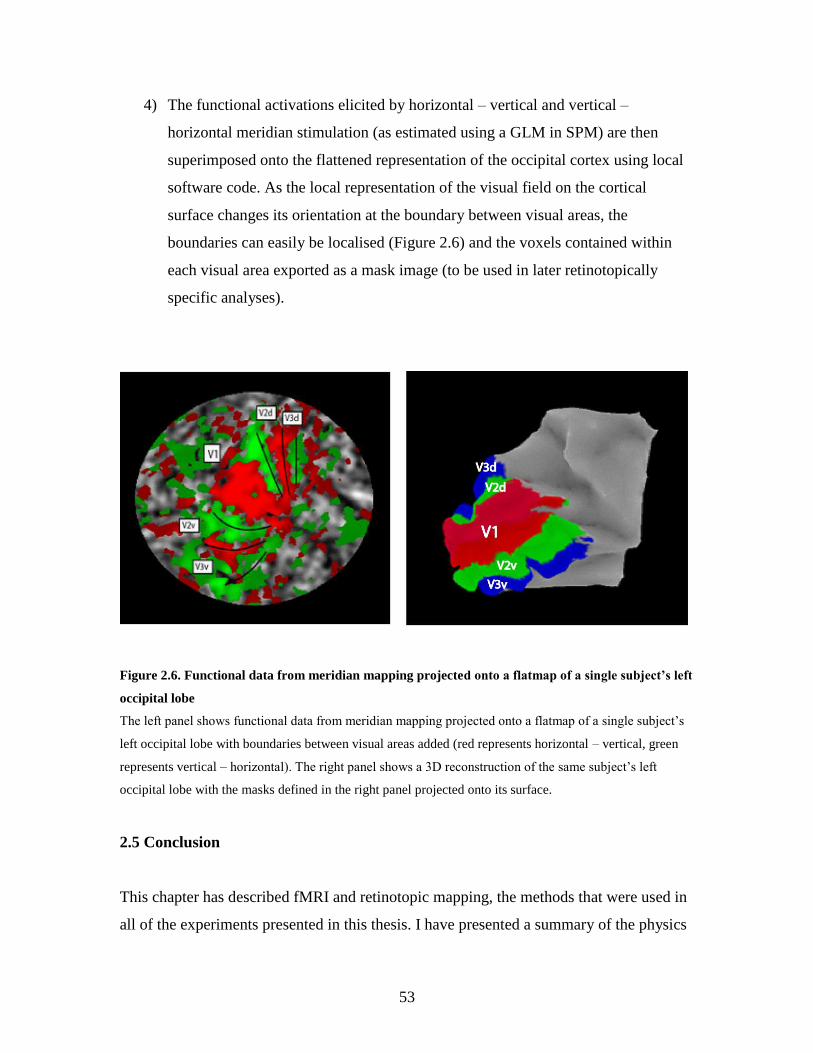
53
4) The functional activations elicited by horizontal – vertical and vertical –
horizontal meridian stimulation (as estimated using a GLM in SPM) are then
superimposed onto the flattened representation of the occipital cortex using local
software code. As the local representation of the visual field on the cortical
surface changes its orientation at the boundary between visual areas, the
boundaries can easily be localised (Figure 2.6) and the voxels contained within
each visual area exported as a mask image (to be used in later retinotopically
specific analyses).
Figure 2.6. Functional data from meridian mapping projected onto a flatmap of a single subject’s left
occipital lobe
The left panel shows functional data from meridian mapping projected onto a flatmap of a single subject‟s
left occipital lobe with boundaries between visual areas added (red represents horizontal – vertical, green
represents vertical – horizontal). The right panel shows a 3D reconstruction of the same subject‟s left
occipital lobe with the masks defined in the right panel projected onto its surface.
2.5 Conclusion
This chapter has described fMRI and retinotopic mapping, the methods that were used in
all of the experiments presented in this thesis. I have presented a summary of the physics

54
and physiology underlying fMRI and the statistical basis of SPM which was used to
analyse fMRI data. In addition, I have discussed the physiological basis of retinotopic
mapping and how this technique was practically implemented. However, for practical
reasons the precise use of these methods varied across experiments and each experiment
utilised additional methods. Therefore each experimental chapter in this thesis has a
methods section describing these points in more detail.
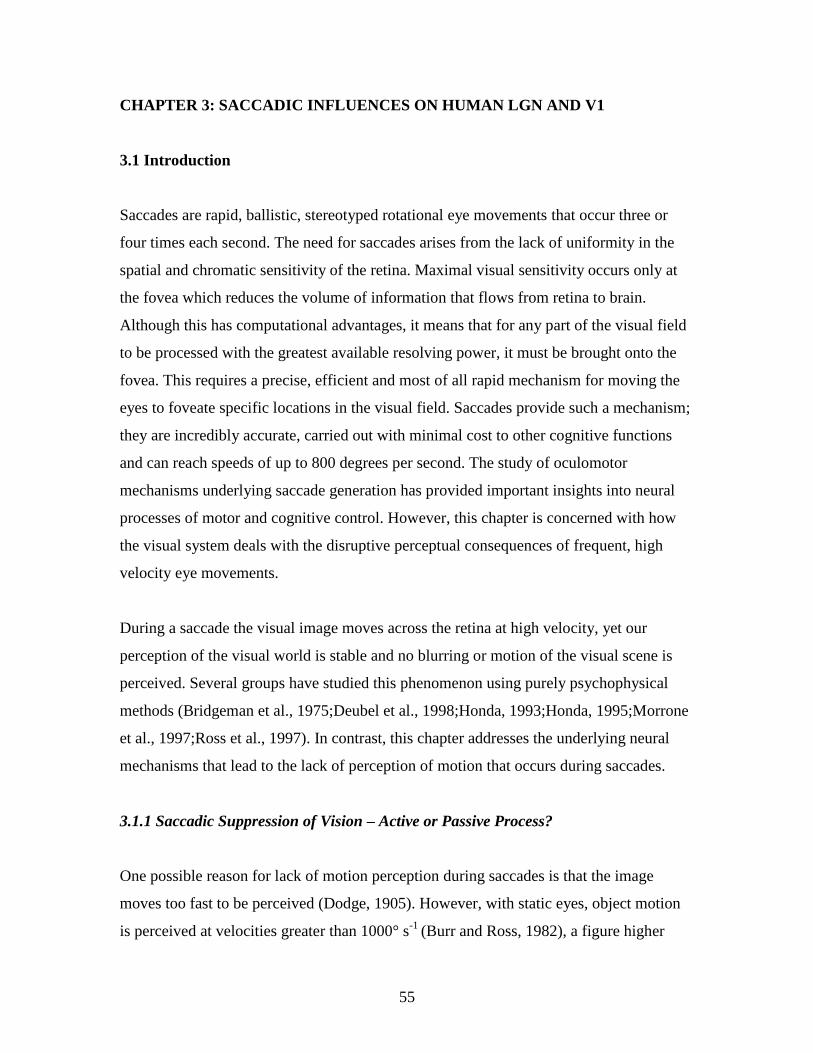
55
CHAPTER 3: SACCADIC INFLUENCES ON HUMAN LGN AND V1
3.1 Introduction
Saccades are rapid, ballistic, stereotyped rotational eye movements that occur three or
four times each second. The need for saccades arises from the lack of uniformity in the
spatial and chromatic sensitivity of the retina. Maximal visual sensitivity occurs only at
the fovea which reduces the volume of information that flows from retina to brain.
Although this has computational advantages, it means that for any part of the visual field
to be processed with the greatest available resolving power, it must be brought onto the
fovea. This requires a precise, efficient and most of all rapid mechanism for moving the
eyes to foveate specific locations in the visual field. Saccades provide such a mechanism;
they are incredibly accurate, carried out with minimal cost to other cognitive functions
and can reach speeds of up to 800 degrees per second. The study of oculomotor
mechanisms underlying saccade generation has provided important insights into neural
processes of motor and cognitive control. However, this chapter is concerned with how
the visual system deals with the disruptive perceptual consequences of frequent, high
velocity eye movements.
During a saccade the visual image moves across the retina at high velocity, yet our
perception of the visual world is stable and no blurring or motion of the visual scene is
perceived. Several groups have studied this phenomenon using purely psychophysical
methods (Bridgeman et al., 1975;Deubel et al., 1998;Honda, 1993;Honda, 1995;Morrone
et al., 1997;Ross et al., 1997). In contrast, this chapter addresses the underlying neural
mechanisms that lead to the lack of perception of motion that occurs during saccades.
3.1.1 Saccadic Suppression of Vision – Active or Passive Process?
One possible reason for lack of motion perception during saccades is that the image
moves too fast to be perceived (Dodge, 1905). However, with static eyes, object motion
is perceived at velocities greater than 1000° s-1
(Burr and Ross, 1982), a figure higher
56
than the maximum velocity of saccades. Another suggestion (Holt, 1901) is that saccades
lead to a „momentary central visual anaesthesia‟, implying a total suspension of vision
through modulation of brain processes during saccades. Indeed, many groups have found
significant perisaccadic decreases in human visual sensitivity (Burr et al., 1982;Riggs et
al., 1974;Volkmann et al., 1980;Zuber and Stark, 1966). However, certain stimuli are
only seen during saccades (Castet and Masson, 2000), suggesting that suppression of
vision is not total and saccadic modulation of visual perception may solely reflect visual
masking by presaccadic and postsaccadic perception (rather than any central mechanism,
see Garcia-Perez and Peli, 2001). This view has difficulty explaining the findings that
suppression of visual sensitivity only occurs for real but not simulated saccades
(Diamond et al., 2000), occurs prior to saccade initiation (Burr et al., 1994) and is limited
to stimuli processed by the magnocellular system (Burr et al., 1994). Thus, current
evidence is consistent with a modification of Dodge‟s theory; perceptual continuity
during saccades is maintained by central mechanisms that influence some but not all
stages of visual processing.
3.1.2 The Site and Nature of Saccadic Suppression
The precise nature and location of active saccadic influences on the human visual system
are not clear. Indirect evidence suggests that the earliest stages of human visual
processing are suppressed peri-saccadically. Psychophysically, saccadic suppression
occurs beyond the retina (Diamond et al., 2000) but prior to the site of contrast masking
(Burr et al., 1994) and precedes visual motion analysis (Burr et al., 1982). Visual
phosphenes generated by TMS stimulation of human occipital cortex are perceived
during saccades, whereas those produced by electrical stimulation of the eye are
suppressed (Thilo et al., 2004). This suggests that saccades modulate visual processing at
or before primary visual cortex (V1). Consistent with this, single cell responses in
monkey V1 and LGN show substantial changes in activity during saccades (Duffy and
Burchfiel, 1975;Ramcharan et al., 2001;Reppas et al., 2002). In humans, although
saccadic suppression has been observed in higher visual areas (Kleiser et al., 2004), and
regions of occipital visual cortex show modulation of responses during saccades (Bodis-
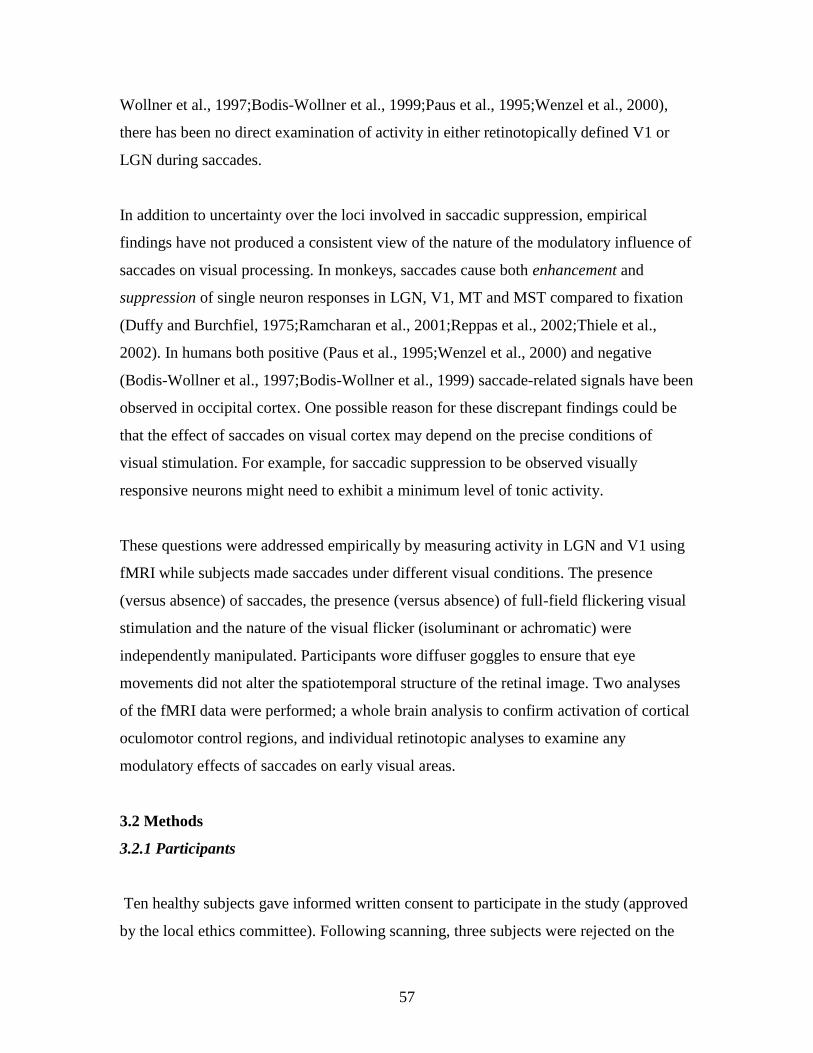
57
Wollner et al., 1997;Bodis-Wollner et al., 1999;Paus et al., 1995;Wenzel et al., 2000),
there has been no direct examination of activity in either retinotopically defined V1 or
LGN during saccades.
In addition to uncertainty over the loci involved in saccadic suppression, empirical
findings have not produced a consistent view of the nature of the modulatory influence of
saccades on visual processing. In monkeys, saccades cause both enhancement and
suppression of single neuron responses in LGN, V1, MT and MST compared to fixation
(Duffy and Burchfiel, 1975;Ramcharan et al., 2001;Reppas et al., 2002;Thiele et al.,
2002). In humans both positive (Paus et al., 1995;Wenzel et al., 2000) and negative
(Bodis-Wollner et al., 1997;Bodis-Wollner et al., 1999) saccade-related signals have been
observed in occipital cortex. One possible reason for these discrepant findings could be
that the effect of saccades on visual cortex may depend on the precise conditions of
visual stimulation. For example, for saccadic suppression to be observed visually
responsive neurons might need to exhibit a minimum level of tonic activity.
These questions were addressed empirically by measuring activity in LGN and V1 using
fMRI while subjects made saccades under different visual conditions. The presence
(versus absence) of saccades, the presence (versus absence) of full-field flickering visual
stimulation and the nature of the visual flicker (isoluminant or achromatic) were
independently manipulated. Participants wore diffuser goggles to ensure that eye
movements did not alter the spatiotemporal structure of the retinal image. Two analyses
of the fMRI data were performed; a whole brain analysis to confirm activation of cortical
oculomotor control regions, and individual retinotopic analyses to examine any
modulatory effects of saccades on early visual areas.
3.2 Methods
3.2.1 Participants
Ten healthy subjects gave informed written consent to participate in the study (approved
by the local ethics committee). Following scanning, three subjects were rejected on the
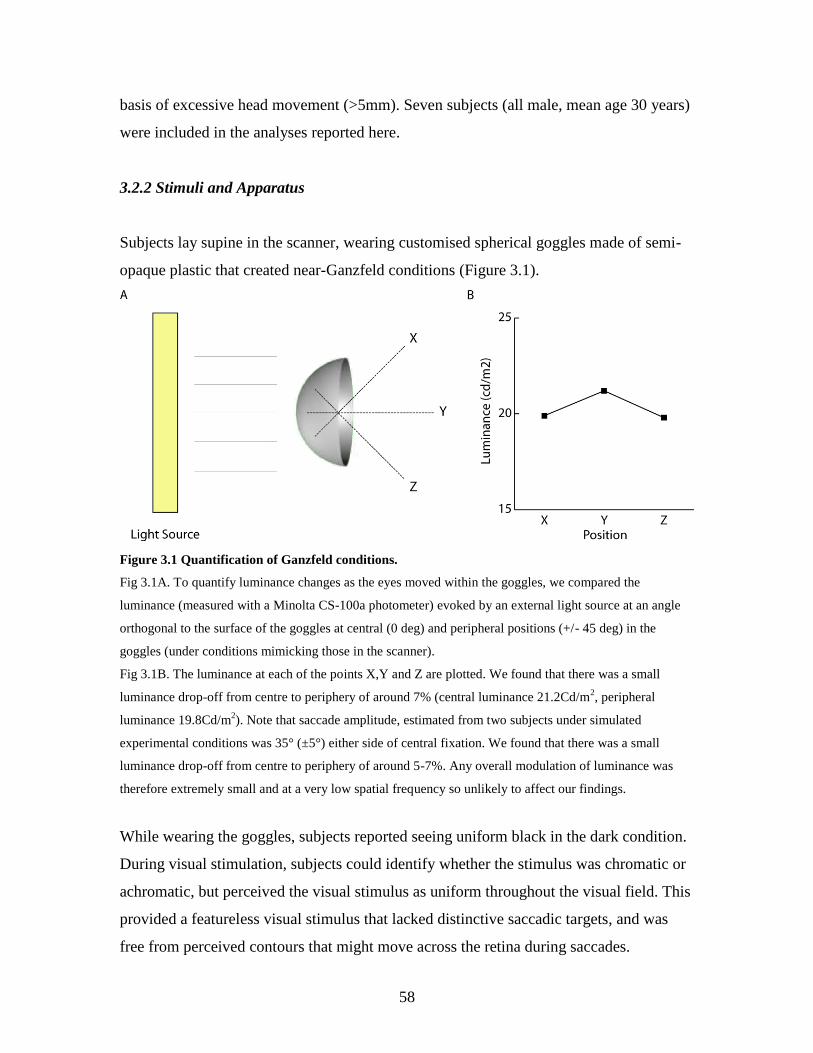
58
basis of excessive head movement (>5mm). Seven subjects (all male, mean age 30 years)
were included in the analyses reported here.
3.2.2 Stimuli and Apparatus
Subjects lay supine in the scanner, wearing customised spherical goggles made of semi-
opaque plastic that created near-Ganzfeld conditions (Figure 3.1).
Figure 3.1 Quantification of Ganzfeld conditions.
Fig 3.1A. To quantify luminance changes as the eyes moved within the goggles, we compared the
luminance (measured with a Minolta CS-100a photometer) evoked by an external light source at an angle
orthogonal to the surface of the goggles at central (0 deg) and peripheral positions (+/- 45 deg) in the
goggles (under conditions mimicking those in the scanner).
Fig 3.1B. The luminance at each of the points X,Y and Z are plotted. We found that there was a small
luminance drop-off from centre to periphery of around 7% (central luminance 21.2Cd/m2, peripheral
luminance 19.8Cd/m2). Note that saccade amplitude, estimated from two subjects under simulated
experimental conditions was 35° (±5°) either side of central fixation. We found that there was a small
luminance drop-off from centre to periphery of around 5-7%. Any overall modulation of luminance was
therefore extremely small and at a very low spatial frequency so unlikely to affect our findings.
While wearing the goggles, subjects reported seeing uniform black in the dark condition.
During visual stimulation, subjects could identify whether the stimulus was chromatic or
achromatic, but perceived the visual stimulus as uniform throughout the visual field. This
provided a featureless visual stimulus that lacked distinctive saccadic targets, and was
free from perceived contours that might move across the retina during saccades.
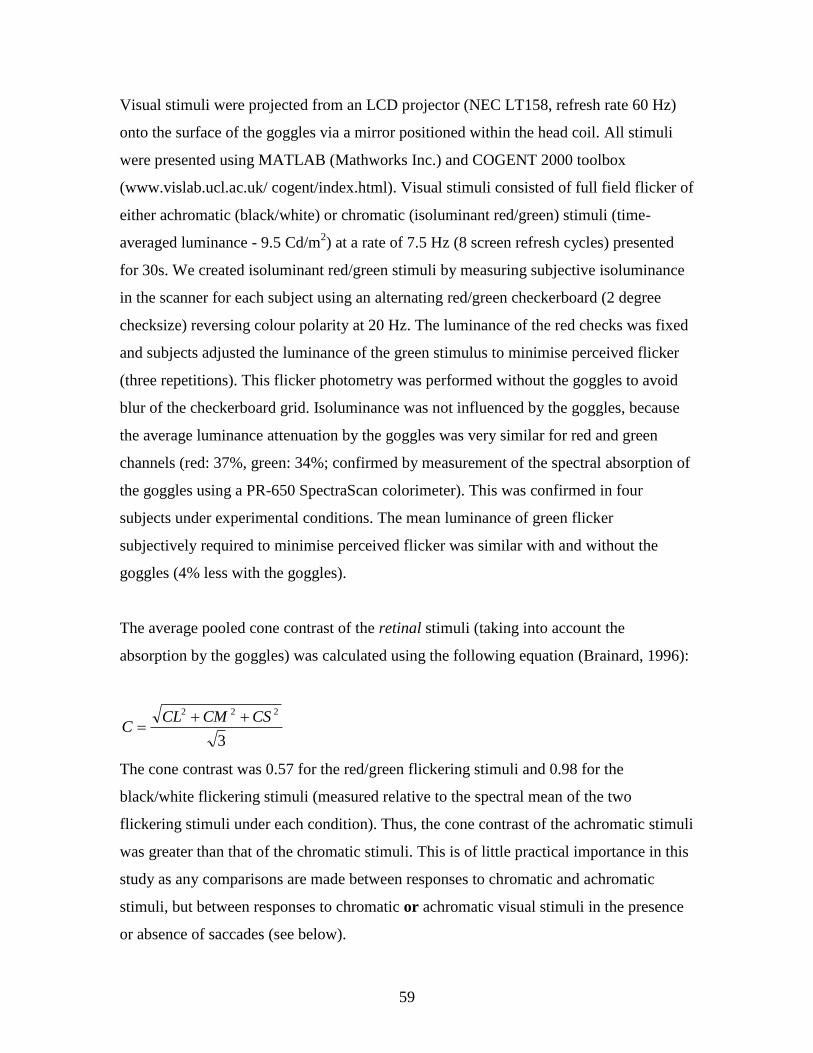
59
Visual stimuli were projected from an LCD projector (NEC LT158, refresh rate 60 Hz)
onto the surface of the goggles via a mirror positioned within the head coil. All stimuli
were presented using MATLAB (Mathworks Inc.) and COGENT 2000 toolbox
(www.vislab.ucl.ac.uk/ cogent/index.html). Visual stimuli consisted of full field flicker of
either achromatic (black/white) or chromatic (isoluminant red/green) stimuli (time-
averaged luminance - 9.5 Cd/m2) at a rate of 7.5 Hz (8 screen refresh cycles) presented
for 30s. We created isoluminant red/green stimuli by measuring subjective isoluminance
in the scanner for each subject using an alternating red/green checkerboard (2 degree
checksize) reversing colour polarity at 20 Hz. The luminance of the red checks was fixed
and subjects adjusted the luminance of the green stimulus to minimise perceived flicker
(three repetitions). This flicker photometry was performed without the goggles to avoid
blur of the checkerboard grid. Isoluminance was not influenced by the goggles, because
the average luminance attenuation by the goggles was very similar for red and green
channels (red: 37%, green: 34%; confirmed by measurement of the spectral absorption of
the goggles using a PR-650 SpectraScan colorimeter). This was confirmed in four
subjects under experimental conditions. The mean luminance of green flicker
subjectively required to minimise perceived flicker was similar with and without the
goggles (4% less with the goggles).
The average pooled cone contrast of the retinal stimuli (taking into account the
absorption by the goggles) was calculated using the following equation (Brainard, 1996):
3
222 CSCMCLC
The cone contrast was 0.57 for the red/green flickering stimuli and 0.98 for the
black/white flickering stimuli (measured relative to the spectral mean of the two
flickering stimuli under each condition). Thus, the cone contrast of the achromatic stimuli
was greater than that of the chromatic stimuli. This is of little practical importance in this
study as any comparisons are made between responses to chromatic and achromatic
stimuli, but between responses to chromatic or achromatic visual stimuli in the presence
or absence of saccades (see below).
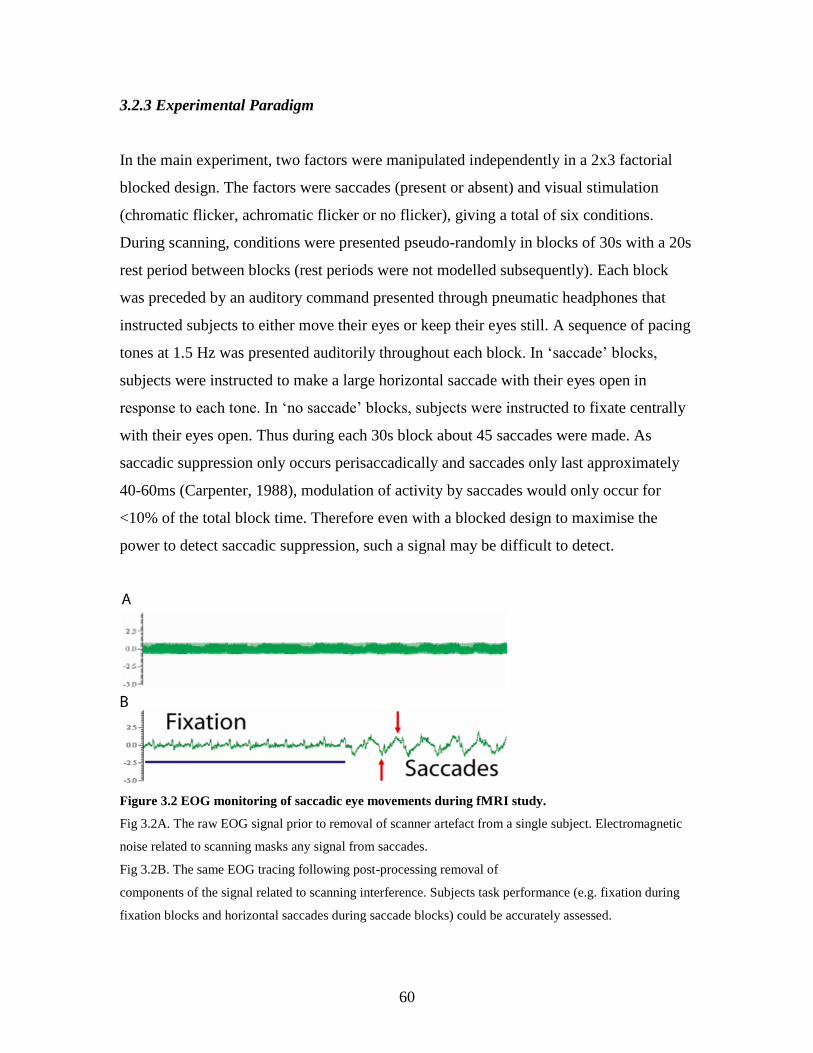
60
3.2.3 Experimental Paradigm
In the main experiment, two factors were manipulated independently in a 2x3 factorial
blocked design. The factors were saccades (present or absent) and visual stimulation
(chromatic flicker, achromatic flicker or no flicker), giving a total of six conditions.
During scanning, conditions were presented pseudo-randomly in blocks of 30s with a 20s
rest period between blocks (rest periods were not modelled subsequently). Each block
was preceded by an auditory command presented through pneumatic headphones that
instructed subjects to either move their eyes or keep their eyes still. A sequence of pacing
tones at 1.5 Hz was presented auditorily throughout each block. In „saccade‟ blocks,
subjects were instructed to make a large horizontal saccade with their eyes open in
response to each tone. In „no saccade‟ blocks, subjects were instructed to fixate centrally
with their eyes open. Thus during each 30s block about 45 saccades were made. As
saccadic suppression only occurs perisaccadically and saccades only last approximately
40-60ms (Carpenter, 1988), modulation of activity by saccades would only occur for
<10% of the total block time. Therefore even with a blocked design to maximise the
power to detect saccadic suppression, such a signal may be difficult to detect.
Figure 3.2 EOG monitoring of saccadic eye movements during fMRI study.
Fig 3.2A. The raw EOG signal prior to removal of scanner artefact from a single subject. Electromagnetic
noise related to scanning masks any signal from saccades.
Fig 3.2B. The same EOG tracing following post-processing removal of
components of the signal related to scanning interference. Subjects task performance (e.g. fixation during
fixation blocks and horizontal saccades during saccade blocks) could be accurately assessed.
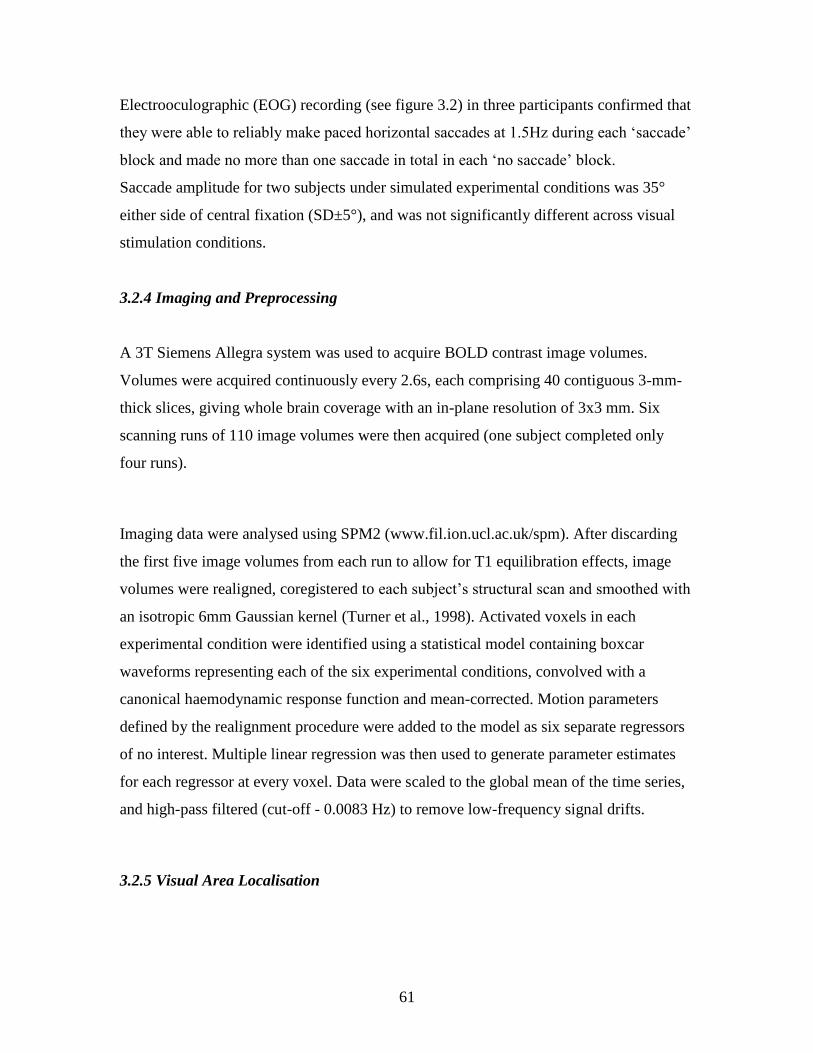
61
Electrooculographic (EOG) recording (see figure 3.2) in three participants confirmed that
they were able to reliably make paced horizontal saccades at 1.5Hz during each „saccade‟
block and made no more than one saccade in total in each „no saccade‟ block.
Saccade amplitude for two subjects under simulated experimental conditions was 35°
either side of central fixation (SD±5°), and was not significantly different across visual
stimulation conditions.
3.2.4 Imaging and Preprocessing
A 3T Siemens Allegra system was used to acquire BOLD contrast image volumes.
Volumes were acquired continuously every 2.6s, each comprising 40 contiguous 3-mm-
thick slices, giving whole brain coverage with an in-plane resolution of 3x3 mm. Six
scanning runs of 110 image volumes were then acquired (one subject completed only
four runs).
Imaging data were analysed using SPM2 (www.fil.ion.ucl.ac.uk/spm). After discarding
the first five image volumes from each run to allow for T1 equilibration effects, image
volumes were realigned, coregistered to each subject‟s structural scan and smoothed with
an isotropic 6mm Gaussian kernel (Turner et al., 1998). Activated voxels in each
experimental condition were identified using a statistical model containing boxcar
waveforms representing each of the six experimental conditions, convolved with a
canonical haemodynamic response function and mean-corrected. Motion parameters
defined by the realignment procedure were added to the model as six separate regressors
of no interest. Multiple linear regression was then used to generate parameter estimates
for each regressor at every voxel. Data were scaled to the global mean of the time series,
and high-pass filtered (cut-off - 0.0083 Hz) to remove low-frequency signal drifts.
3.2.5 Visual Area Localisation
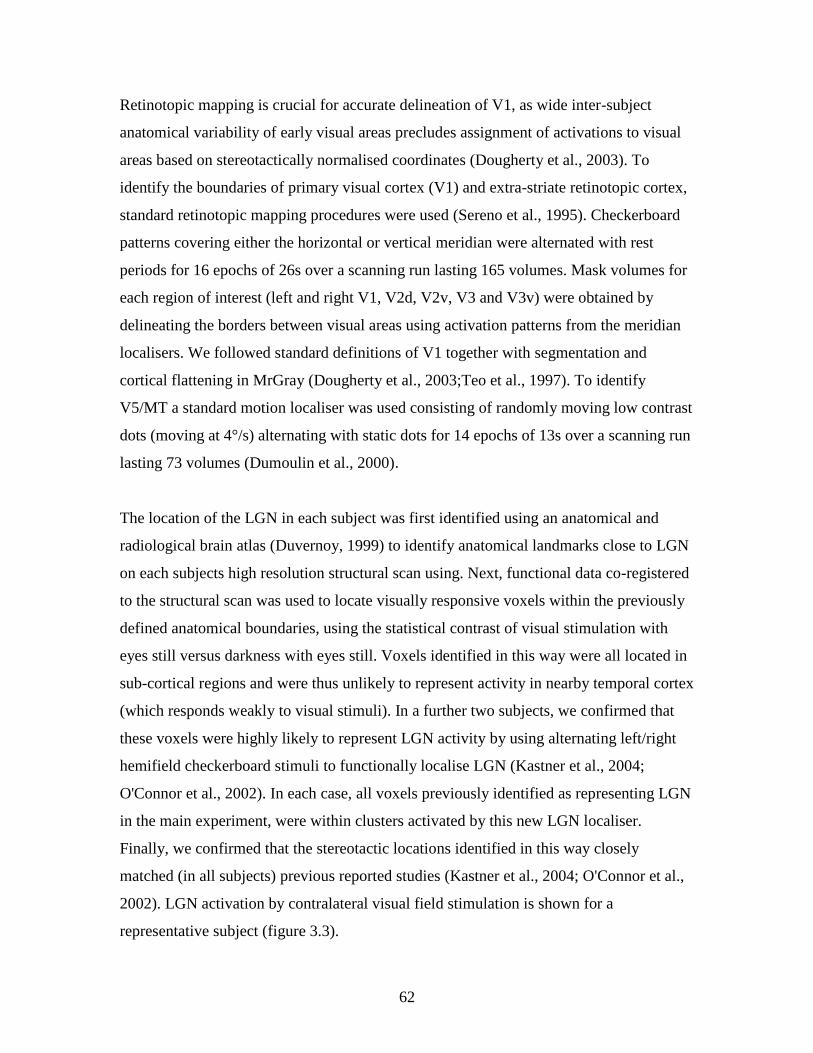
62
Retinotopic mapping is crucial for accurate delineation of V1, as wide inter-subject
anatomical variability of early visual areas precludes assignment of activations to visual
areas based on stereotactically normalised coordinates (Dougherty et al., 2003). To
identify the boundaries of primary visual cortex (V1) and extra-striate retinotopic cortex,
standard retinotopic mapping procedures were used (Sereno et al., 1995). Checkerboard
patterns covering either the horizontal or vertical meridian were alternated with rest
periods for 16 epochs of 26s over a scanning run lasting 165 volumes. Mask volumes for
each region of interest (left and right V1, V2d, V2v, V3 and V3v) were obtained by
delineating the borders between visual areas using activation patterns from the meridian
localisers. We followed standard definitions of V1 together with segmentation and
cortical flattening in MrGray (Dougherty et al., 2003;Teo et al., 1997). To identify
V5/MT a standard motion localiser was used consisting of randomly moving low contrast
dots (moving at 4°/s) alternating with static dots for 14 epochs of 13s over a scanning run
lasting 73 volumes (Dumoulin et al., 2000).
The location of the LGN in each subject was first identified using an anatomical and
radiological brain atlas (Duvernoy, 1999) to identify anatomical landmarks close to LGN
on each subjects high resolution structural scan using. Next, functional data co-registered
to the structural scan was used to locate visually responsive voxels within the previously
defined anatomical boundaries, using the statistical contrast of visual stimulation with
eyes still versus darkness with eyes still. Voxels identified in this way were all located in
sub-cortical regions and were thus unlikely to represent activity in nearby temporal cortex
(which responds weakly to visual stimuli). In a further two subjects, we confirmed that
these voxels were highly likely to represent LGN activity by using alternating left/right
hemifield checkerboard stimuli to functionally localise LGN (Kastner et al., 2004;
O'Connor et al., 2002). In each case, all voxels previously identified as representing LGN
in the main experiment, were within clusters activated by this new LGN localiser.
Finally, we confirmed that the stereotactic locations identified in this way closely
matched (in all subjects) previous reported studies (Kastner et al., 2004; O'Connor et al.,
2002). LGN activation by contralateral visual field stimulation is shown for a
representative subject (figure 3.3).
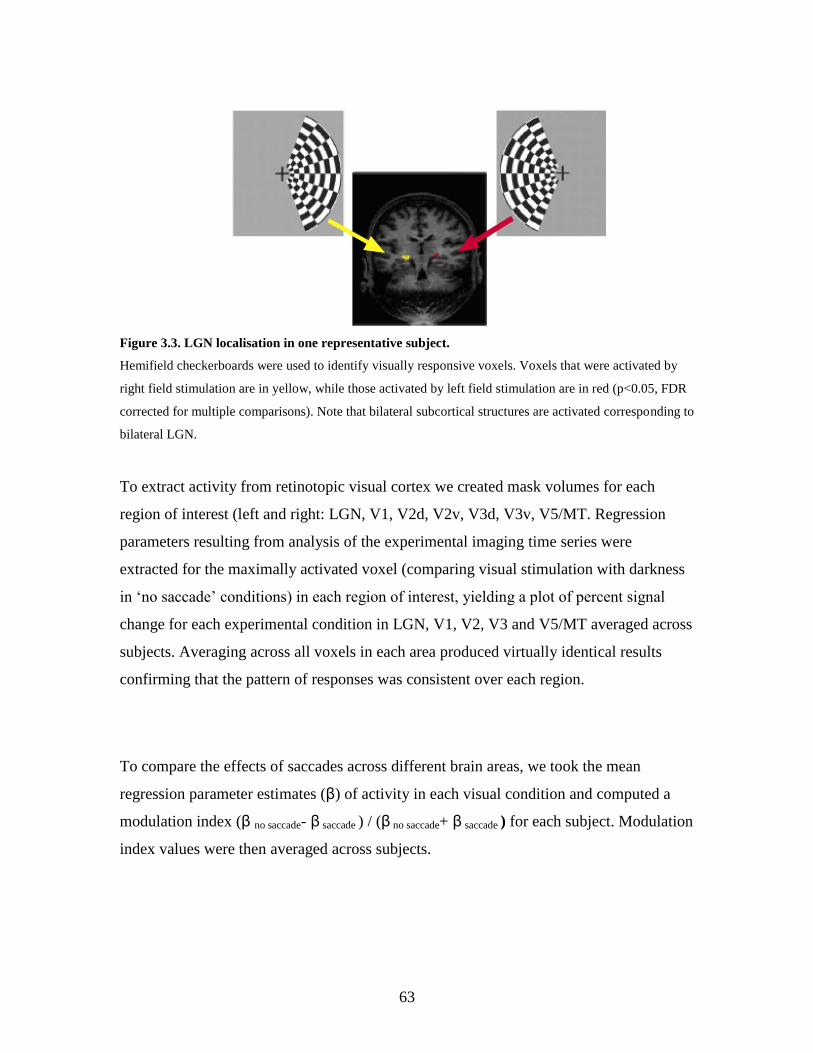
63
Figure 3.3. LGN localisation in one representative subject.
Hemifield checkerboards were used to identify visually responsive voxels. Voxels that were activated by
right field stimulation are in yellow, while those activated by left field stimulation are in red (p<0.05, FDR
corrected for multiple comparisons). Note that bilateral subcortical structures are activated corresponding to
bilateral LGN.
To extract activity from retinotopic visual cortex we created mask volumes for each
region of interest (left and right: LGN, V1, V2d, V2v, V3d, V3v, V5/MT. Regression
parameters resulting from analysis of the experimental imaging time series were
extracted for the maximally activated voxel (comparing visual stimulation with darkness
in „no saccade‟ conditions) in each region of interest, yielding a plot of percent signal
change for each experimental condition in LGN, V1, V2, V3 and V5/MT averaged across
subjects. Averaging across all voxels in each area produced virtually identical results
confirming that the pattern of responses was consistent over each region.
To compare the effects of saccades across different brain areas, we took the mean
regression parameter estimates (β) of activity in each visual condition and computed a
modulation index (β no saccade- β saccade ) / (β no saccade+ β saccade ) for each subject. Modulation
index values were then averaged across subjects.
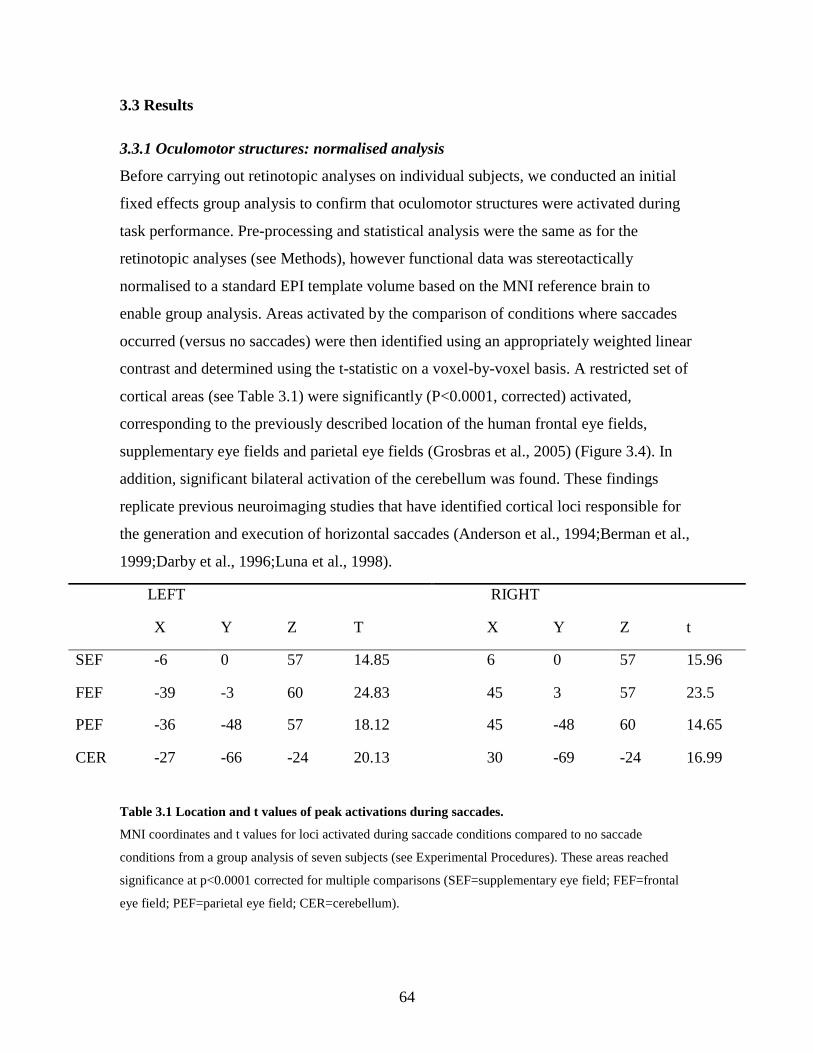
64
3.3 Results
3.3.1 Oculomotor structures: normalised analysis
Before carrying out retinotopic analyses on individual subjects, we conducted an initial
fixed effects group analysis to confirm that oculomotor structures were activated during
task performance. Pre-processing and statistical analysis were the same as for the
retinotopic analyses (see Methods), however functional data was stereotactically
normalised to a standard EPI template volume based on the MNI reference brain to
enable group analysis. Areas activated by the comparison of conditions where saccades
occurred (versus no saccades) were then identified using an appropriately weighted linear
contrast and determined using the t-statistic on a voxel-by-voxel basis. A restricted set of
cortical areas (see Table 3.1) were significantly (P<0.0001, corrected) activated,
corresponding to the previously described location of the human frontal eye fields,
supplementary eye fields and parietal eye fields (Grosbras et al., 2005) (Figure 3.4). In
addition, significant bilateral activation of the cerebellum was found. These findings
replicate previous neuroimaging studies that have identified cortical loci responsible for
the generation and execution of horizontal saccades (Anderson et al., 1994;Berman et al.,
1999;Darby et al., 1996;Luna et al., 1998).
Table 3.1 Location and t values of peak activations during saccades.
MNI coordinates and t values for loci activated during saccade conditions compared to no saccade
conditions from a group analysis of seven subjects (see Experimental Procedures). These areas reached
significance at p<0.0001 corrected for multiple comparisons (SEF=supplementary eye field; FEF=frontal
eye field; PEF=parietal eye field; CER=cerebellum).
LEFT RIGHT
X Y Z T X Y Z t
SEF -6 0 57 14.85 6 0 57 15.96
FEF -39 -3 60 24.83 45 3 57 23.5
PEF -36 -48 57 18.12 45 -48 60 14.65
CER -27 -66 -24 20.13 30 -69 -24 16.99
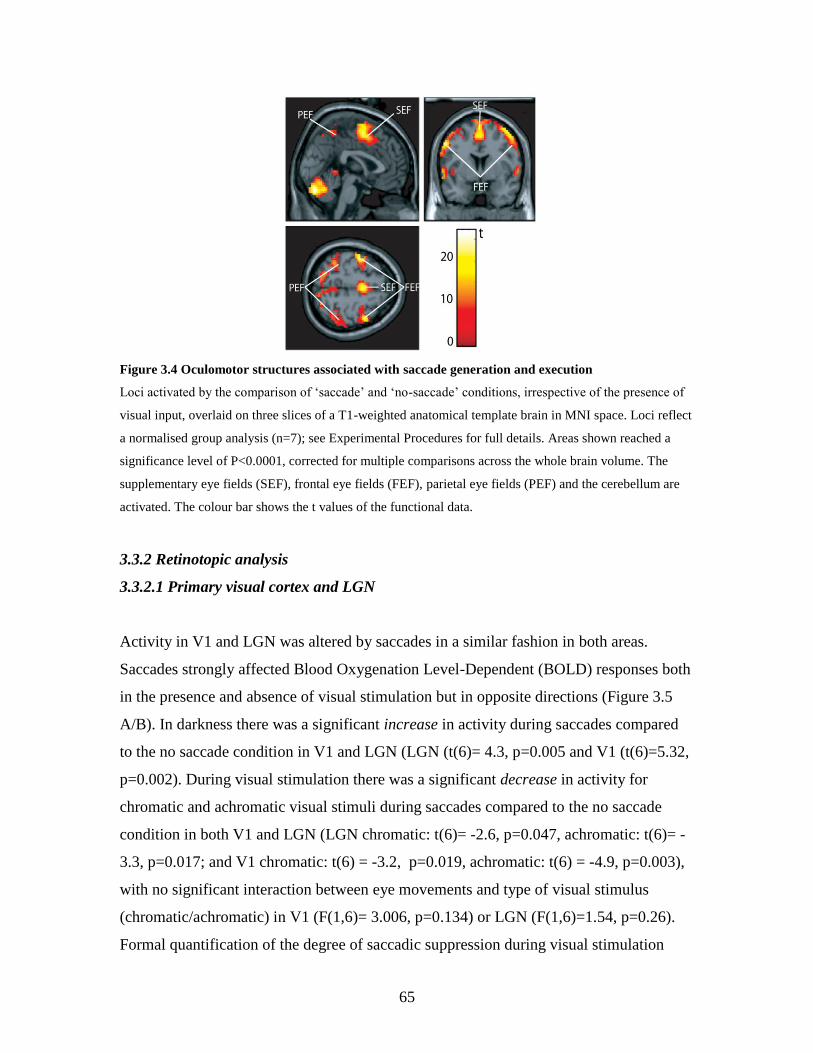
65
Figure 3.4 Oculomotor structures associated with saccade generation and execution
Loci activated by the comparison of „saccade‟ and „no-saccade‟ conditions, irrespective of the presence of
visual input, overlaid on three slices of a T1-weighted anatomical template brain in MNI space. Loci reflect
a normalised group analysis (n=7); see Experimental Procedures for full details. Areas shown reached a
significance level of P<0.0001, corrected for multiple comparisons across the whole brain volume. The
supplementary eye fields (SEF), frontal eye fields (FEF), parietal eye fields (PEF) and the cerebellum are
activated. The colour bar shows the t values of the functional data.
3.3.2 Retinotopic analysis
3.3.2.1 Primary visual cortex and LGN
Activity in V1 and LGN was altered by saccades in a similar fashion in both areas.
Saccades strongly affected Blood Oxygenation Level-Dependent (BOLD) responses both
in the presence and absence of visual stimulation but in opposite directions (Figure 3.5
A/B). In darkness there was a significant increase in activity during saccades compared
to the no saccade condition in V1 and LGN (LGN (t(6)= 4.3, p=0.005 and V1 (t(6)=5.32,
p=0.002). During visual stimulation there was a significant decrease in activity for
chromatic and achromatic visual stimuli during saccades compared to the no saccade
condition in both V1 and LGN (LGN chromatic: t(6)= -2.6, p=0.047, achromatic: t(6)= -
3.3, p=0.017; and V1 chromatic: t(6) = -3.2, p=0.019, achromatic: t(6) = -4.9, p=0.003),
with no significant interaction between eye movements and type of visual stimulus
(chromatic/achromatic) in V1 (F(1,6)= 3.006, p=0.134) or LGN (F(1,6)=1.54, p=0.26).
Formal quantification of the degree of saccadic suppression during visual stimulation
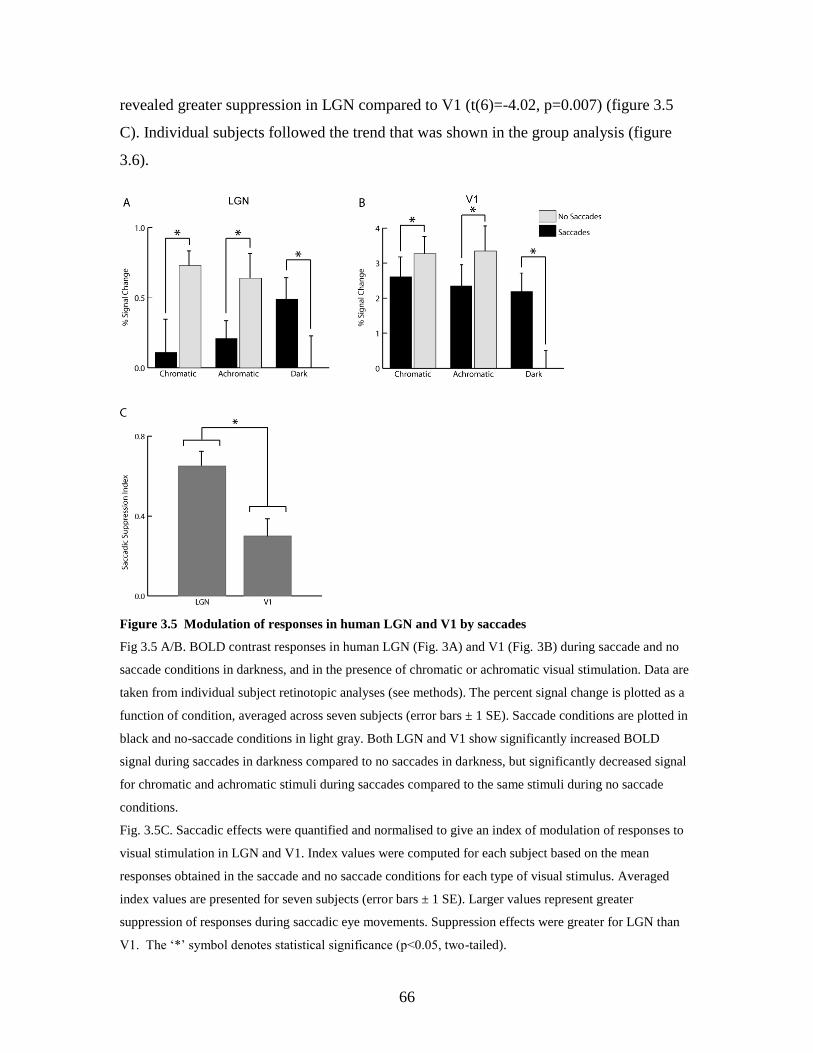
66
revealed greater suppression in LGN compared to V1 (t(6)=-4.02, p=0.007) (figure 3.5
C). Individual subjects followed the trend that was shown in the group analysis (figure
3.6).
Figure 3.5 Modulation of responses in human LGN and V1 by saccades
Fig 3.5 A/B. BOLD contrast responses in human LGN (Fig. 3A) and V1 (Fig. 3B) during saccade and no
saccade conditions in darkness, and in the presence of chromatic or achromatic visual stimulation. Data are
taken from individual subject retinotopic analyses (see methods). The percent signal change is plotted as a
function of condition, averaged across seven subjects (error bars ± 1 SE). Saccade conditions are plotted in
black and no-saccade conditions in light gray. Both LGN and V1 show significantly increased BOLD
signal during saccades in darkness compared to no saccades in darkness, but significantly decreased signal
for chromatic and achromatic stimuli during saccades compared to the same stimuli during no saccade
conditions.
Fig. 3.5C. Saccadic effects were quantified and normalised to give an index of modulation of responses to
visual stimulation in LGN and V1. Index values were computed for each subject based on the mean
responses obtained in the saccade and no saccade conditions for each type of visual stimulus. Averaged
index values are presented for seven subjects (error bars ± 1 SE). Larger values represent greater
suppression of responses during saccadic eye movements. Suppression effects were greater for LGN than
V1. The „*‟ symbol denotes statistical significance (p<0.05, two-tailed).
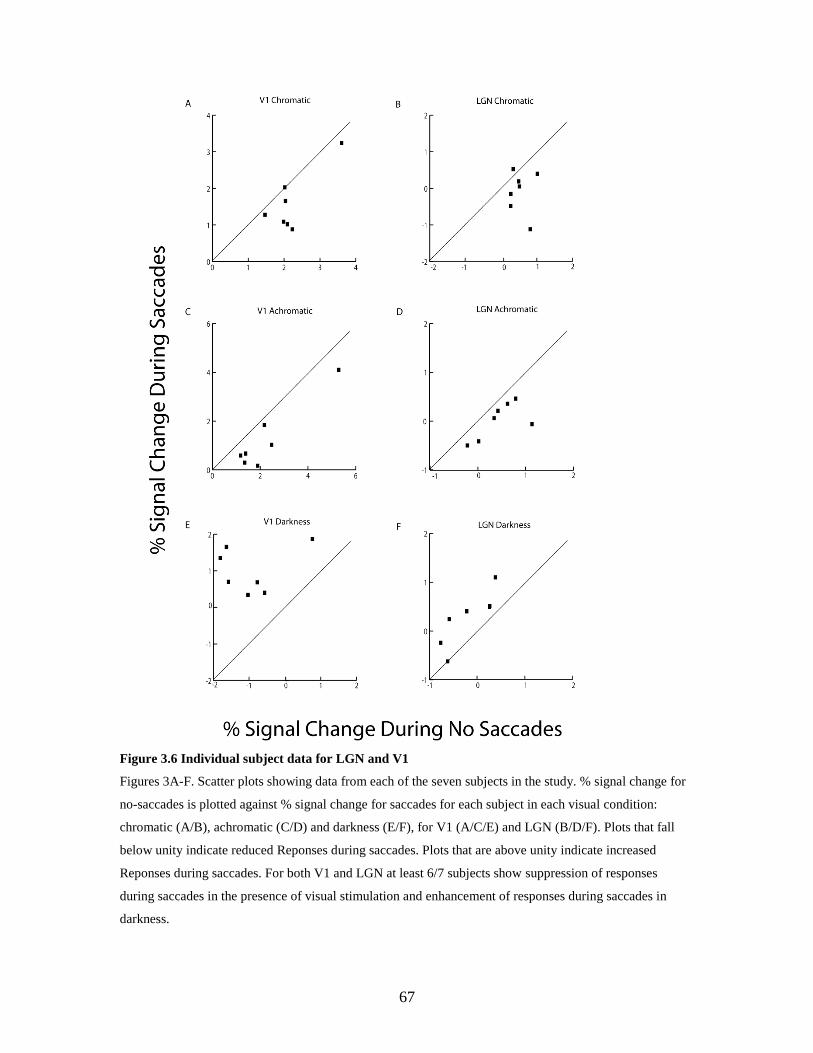
67
Figure 3.6 Individual subject data for LGN and V1
Figures 3A-F. Scatter plots showing data from each of the seven subjects in the study. % signal change for
no-saccades is plotted against % signal change for saccades for each subject in each visual condition:
chromatic (A/B), achromatic (C/D) and darkness (E/F), for V1 (A/C/E) and LGN (B/D/F). Plots that fall
below unity indicate reduced Reponses during saccades. Plots that are above unity indicate increased
Reponses during saccades. For both V1 and LGN at least 6/7 subjects show suppression of responses
during saccades in the presence of visual stimulation and enhancement of responses during saccades in
darkness.
68
3.3.2.2 Higher visual areas
Higher visual areas V2, V3 and V5/MT showed a qualitatively similar pattern of
modulation to LGN/V1, but responses were weaker overall (Figure 3.7). Saccades in
darkness resulted in significant increases in activity in V2 darkness (t(6)= 2.52, p=0.045),
and a trend towards significance in V3 (t(6)= 2.3, p=0.061). Responses of V5/MT were
not affected by saccades in darkness (t(6)=0.19, p=0.85), but responses overall were
weak suggesting that the visual stimuli used were not optimal for activating V5/MT.
During visual stimulation saccades evoked small reductions in activity that did not reach
significance in V2 (chromatic: t(6)= -1.99, p=0.09, achromatic: t(6)= -1.44, p=0.2), V3
(chromatic: t(6)= -2.2, p=0.07, achromatic: t(6)= -1.59, p=0.16) and V5/MT (chromatic:
t(6)= -0.9, p=0.39, achromatic: t(6)= -1.5, p=0.17). There was no significant interaction
between eye movements and visual stimulus type (V2: F(1,6)=0.85, p=0.39, V3:
F(1,6)=1.38, p=0.29, V5/MT: F(1,6)=0.09, p<0.7). This pattern of results did not differ
between dorsal and ventral portions of V2/V3.

69
Figure 3.7 Modulation of responses in human V2, V3 and V5/MT by saccades
BOLD contrast responses in human V2 (Fig. 3.7A), V3 (Fig. 3.7B) and V5/MT (Fig. 3.7C) during saccade
and no saccade conditions in darkness and in the presence of chromatic or achromatic visual stimulation.
Data are taken from individual subject retinotopic analyses (see Methods). The percent signal change is
plotted as a function of condition, averaged across seven subjects (error bars ± 1 SE). Saccade conditions
are plotted in black and no-saccade conditions in light gray. Both V2 (A) and V3 (B) show increased
BOLD signal during saccades in darkness compared to no saccades in darkness. V5/MT (C) shows no
modulation of responses during saccades in darkness. Responses to chromatic and achromatic stimuli
during saccades compared to the same stimuli during no saccade conditions were reduced, but not
significantly in V2, V3 and V5/MT. The „*‟ symbol denotes statistical significance (p<0.05, two-tailed).
3.4 Discussion
The major finding in this study was that saccades altered activity in LGN and retinotopic
visual cortex in two distinct ways. First, the presence (versus absence) of saccades was
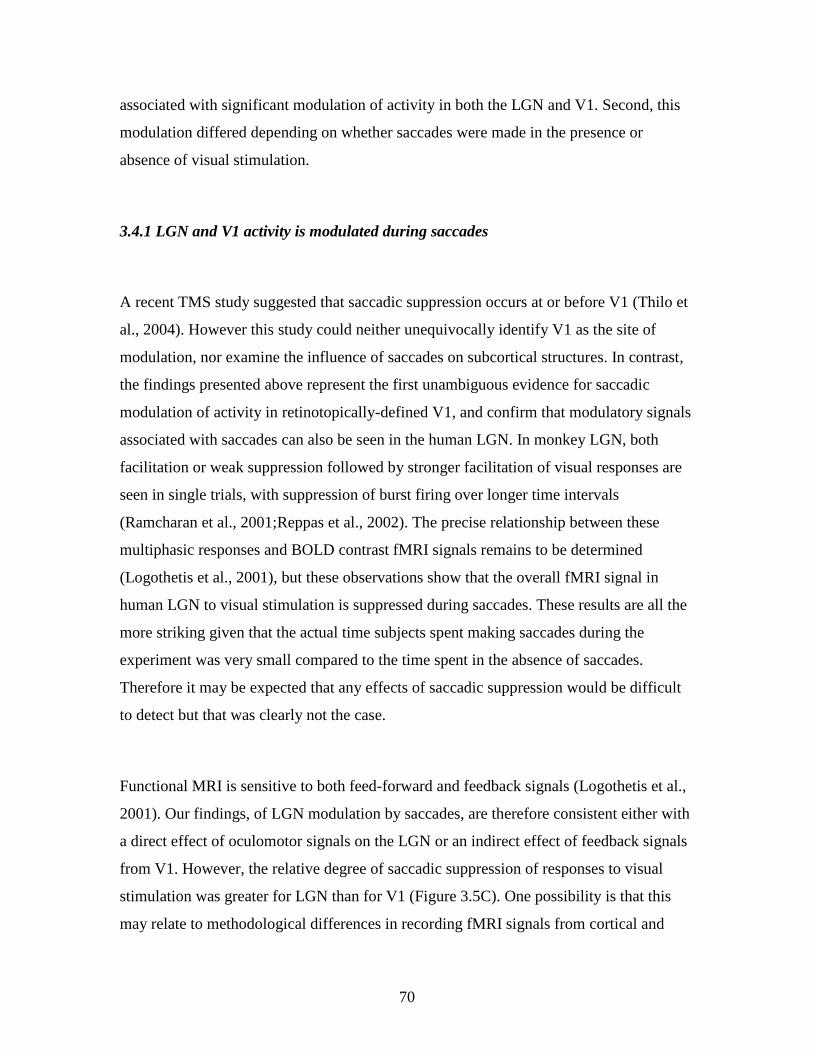
70
associated with significant modulation of activity in both the LGN and V1. Second, this
modulation differed depending on whether saccades were made in the presence or
absence of visual stimulation.
3.4.1 LGN and V1 activity is modulated during saccades
A recent TMS study suggested that saccadic suppression occurs at or before V1 (Thilo et
al., 2004). However this study could neither unequivocally identify V1 as the site of
modulation, nor examine the influence of saccades on subcortical structures. In contrast,
the findings presented above represent the first unambiguous evidence for saccadic
modulation of activity in retinotopically-defined V1, and confirm that modulatory signals
associated with saccades can also be seen in the human LGN. In monkey LGN, both
facilitation or weak suppression followed by stronger facilitation of visual responses are
seen in single trials, with suppression of burst firing over longer time intervals
(Ramcharan et al., 2001;Reppas et al., 2002). The precise relationship between these
multiphasic responses and BOLD contrast fMRI signals remains to be determined
(Logothetis et al., 2001), but these observations show that the overall fMRI signal in
human LGN to visual stimulation is suppressed during saccades. These results are all the
more striking given that the actual time subjects spent making saccades during the
experiment was very small compared to the time spent in the absence of saccades.
Therefore it may be expected that any effects of saccadic suppression would be difficult
to detect but that was clearly not the case.
Functional MRI is sensitive to both feed-forward and feedback signals (Logothetis et al.,
2001). Our findings, of LGN modulation by saccades, are therefore consistent either with
a direct effect of oculomotor signals on the LGN or an indirect effect of feedback signals
from V1. However, the relative degree of saccadic suppression of responses to visual
stimulation was greater for LGN than for V1 (Figure 3.5C). One possibility is that this
may relate to methodological differences in recording fMRI signals from cortical and

71
subcortical structures. However, fMRI measurement of LGN and V1 contrast response
functions reveal similar monotonic increases in BOLD activation with increasing
stimulus contrast (Kastner et al., 2004). This finding could also reflect the pattern of
connectivity between V1 and LGN. Feedback from V1 to LGN may arise from a subset
of V1 neurons but provide a numerically extensive input to LGN leading to a situation
where small changes in average V1 activity could lead to larger changes in LGN activity.
An alternate possibility is that feedback from V1 is not the only source of the LGN
modulation that we observed. The LGN is well placed to receive direct modulatory
influences from the oculomotor system due to its connections with the superior
colliculus, a crucial structure in the saccade generation (Sparks, 2002). Intriguingly,
greater modulation of LGN (versus V1) responses is also seen during voluntary shifts of
spatial attention (O'Connor et al., 2002). It has been proposed that this arises from direct
top-down influences of attentional signals on LGN rather than feedback from V1
(O'Connor et al., 2002). Our findings suggest that LGN activity can be influenced not
only by attentional, but also by extra-retinal oculomotor signals.
It is not entirely clear how saccadic suppression is mediated on a cellular level in the
LGN, but one intriguing possibility is via the influence of the parabrachial region. This
cholinergic area is involved with sleep and arousal and projects to the dLGN where
postsynaptic cholinergic receptors act to modify visual gain in LGN neurons (Fjeld et al.,
2002). Retinogeniculate transmission is also modified by activity in the perigeniculate
nucleus which shows mirror responses to dLGN and could also mediate saccadic
suppression (Funke and Eysel, 1998). These issues will be explored in greater detail in
chapter 4, where data concerning changes in effective connectivity between V1 and LGN
during saccades will be presented.
3.4.2 Saccadic suppression depends on visual stimulation
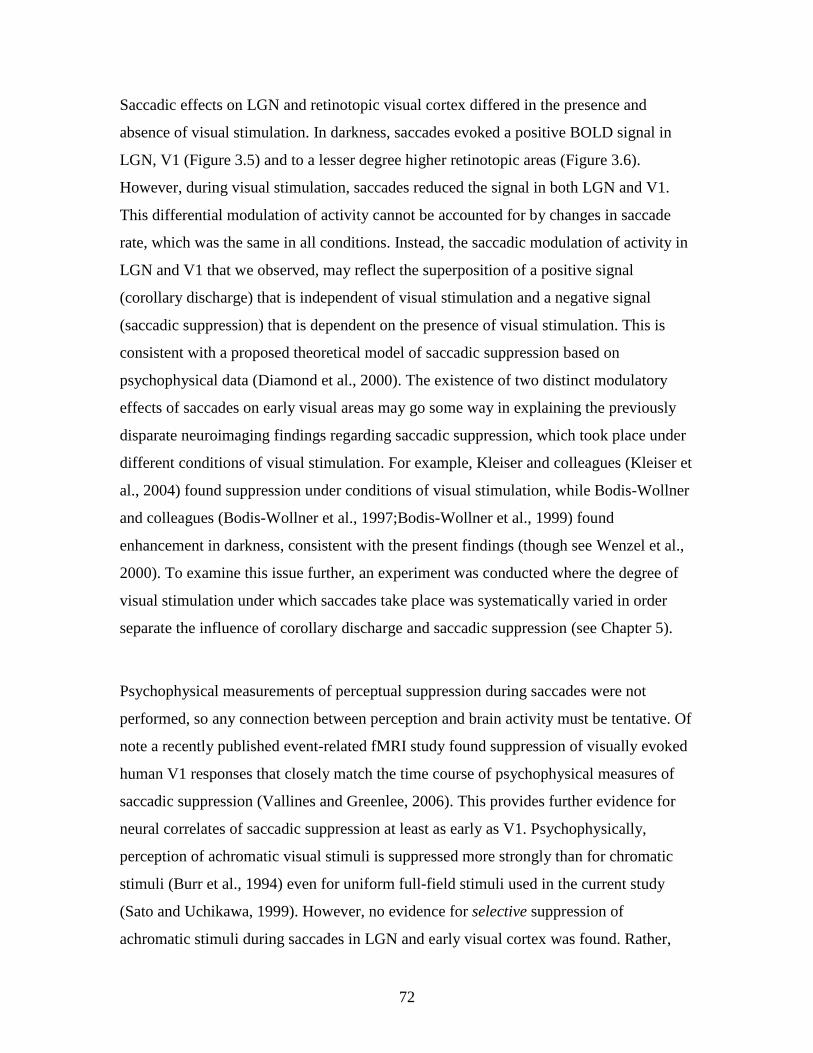
72
Saccadic effects on LGN and retinotopic visual cortex differed in the presence and
absence of visual stimulation. In darkness, saccades evoked a positive BOLD signal in
LGN, V1 (Figure 3.5) and to a lesser degree higher retinotopic areas (Figure 3.6).
However, during visual stimulation, saccades reduced the signal in both LGN and V1.
This differential modulation of activity cannot be accounted for by changes in saccade
rate, which was the same in all conditions. Instead, the saccadic modulation of activity in
LGN and V1 that we observed, may reflect the superposition of a positive signal
(corollary discharge) that is independent of visual stimulation and a negative signal
(saccadic suppression) that is dependent on the presence of visual stimulation. This is
consistent with a proposed theoretical model of saccadic suppression based on
psychophysical data (Diamond et al., 2000). The existence of two distinct modulatory
effects of saccades on early visual areas may go some way in explaining the previously
disparate neuroimaging findings regarding saccadic suppression, which took place under
different conditions of visual stimulation. For example, Kleiser and colleagues (Kleiser et
al., 2004) found suppression under conditions of visual stimulation, while Bodis-Wollner
and colleagues (Bodis-Wollner et al., 1997;Bodis-Wollner et al., 1999) found
enhancement in darkness, consistent with the present findings (though see Wenzel et al.,
2000). To examine this issue further, an experiment was conducted where the degree of
visual stimulation under which saccades take place was systematically varied in order
separate the influence of corollary discharge and saccadic suppression (see Chapter 5).
Psychophysical measurements of perceptual suppression during saccades were not
performed, so any connection between perception and brain activity must be tentative. Of
note a recently published event-related fMRI study found suppression of visually evoked
human V1 responses that closely match the time course of psychophysical measures of
saccadic suppression (Vallines and Greenlee, 2006). This provides further evidence for
neural correlates of saccadic suppression at least as early as V1. Psychophysically,
perception of achromatic visual stimuli is suppressed more strongly than for chromatic
stimuli (Burr et al., 1994) even for uniform full-field stimuli used in the current study
(Sato and Uchikawa, 1999). However, no evidence for selective suppression of
achromatic stimuli during saccades in LGN and early visual cortex was found. Rather,

73
the finding that saccades significantly modulated the processing of both achromatic and
chromatic stimuli in these areas was demonstrated. Although the achromatic stimulus we
used had a higher cone contrast than the achromatic stimulus (see methods), observations
of saccadic suppression presented here do not derive from any direct comparison of
chromatic and achromatic stimuli. Thus although the achromatic and chromatic stimuli
were not matched in terms of cone contrast, this cannot explain the finding that responses
to both types of stimuli are significantly reduced in V1 and LGN during saccades. The
difference in cone contrast between the chromatic and achromatic stimuli may account
for the approximately equal brain responses that were measured under both conditions, as
V1 responds significantly stronger to chromatic than achromatic stimuli of identical cone
contrast (Engel et al., 1997). Some caveats in interpreting saccadic suppression of
chromatic and achromatic stimuli do require mention. It is possible that the “low” spatial
frequency of the full-field flicker stimulus did not optimally drive the parvocellular
system in early visual cortex. It should also be noted that equiluminance is very difficult
to achieve over large fields as it varies with eccentricity, so the stimuli used may not be
perfectly isoluminant over their full spatial extent. Despite these caveats, these findings
are consistent with recent observations that selective suppression of magnocellular
processing during saccades can be observed in higher visual areas such as V5/MT rather
than in early visual cortex (Kleiser et al., 2004).
3.5 Conclusion
Taken together, these findings may argue against the notion of saccadic suppression as a
unitary process resulting from modulation of activity at a single cortical location. Instead,
it may manifest itself in different ways depending on the nature of the visual stimulus,
consistent with the idea that the perceptual phenomenon of saccadic suppression results
from an interaction of oculomotor and visual signals (Diamond et al., 2000). The
mechanism underlying this interaction will be explored in the next chapter, which
examines how saccades modulate the effective connectivity between oculomotor and
visual brain areas.
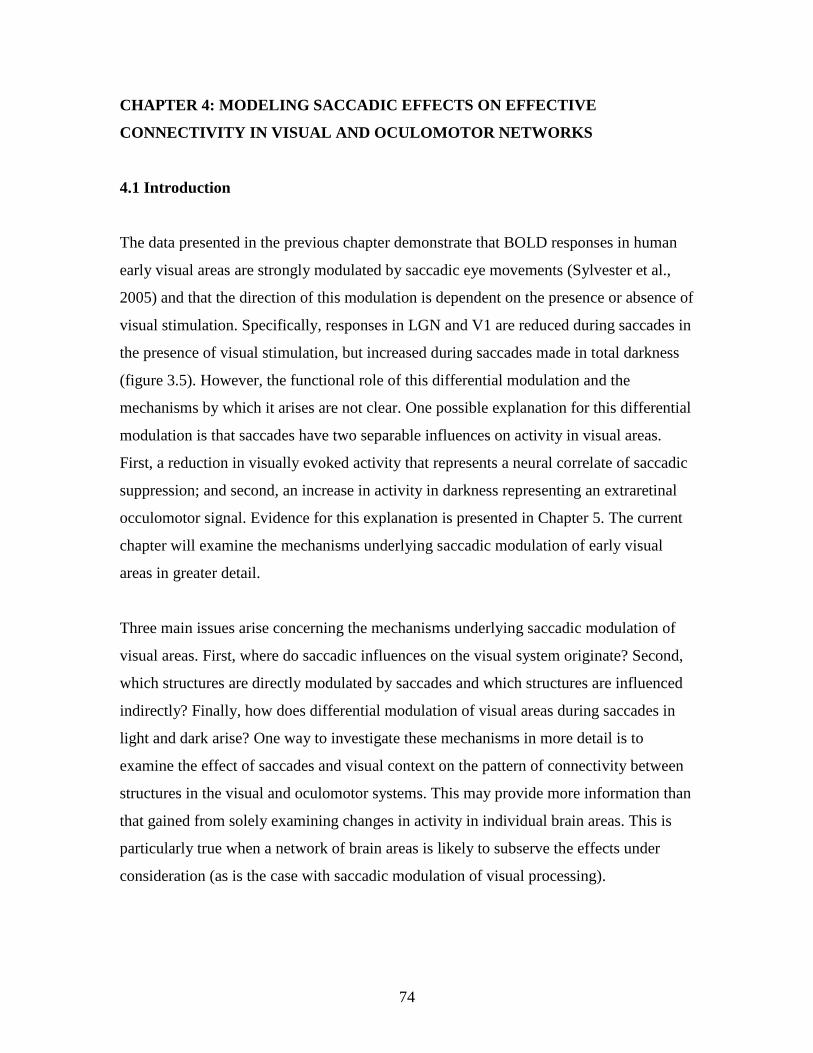
74
CHAPTER 4: MODELING SACCADIC EFFECTS ON EFFECTIVE
CONNECTIVITY IN VISUAL AND OCULOMOTOR NETWORKS
4.1 Introduction
The data presented in the previous chapter demonstrate that BOLD responses in human
early visual areas are strongly modulated by saccadic eye movements (Sylvester et al.,
2005) and that the direction of this modulation is dependent on the presence or absence of
visual stimulation. Specifically, responses in LGN and V1 are reduced during saccades in
the presence of visual stimulation, but increased during saccades made in total darkness
(figure 3.5). However, the functional role of this differential modulation and the
mechanisms by which it arises are not clear. One possible explanation for this differential
modulation is that saccades have two separable influences on activity in visual areas.
First, a reduction in visually evoked activity that represents a neural correlate of saccadic
suppression; and second, an increase in activity in darkness representing an extraretinal
occulomotor signal. Evidence for this explanation is presented in Chapter 5. The current
chapter will examine the mechanisms underlying saccadic modulation of early visual
areas in greater detail.
Three main issues arise concerning the mechanisms underlying saccadic modulation of
visual areas. First, where do saccadic influences on the visual system originate? Second,
which structures are directly modulated by saccades and which structures are influenced
indirectly? Finally, how does differential modulation of visual areas during saccades in
light and dark arise? One way to investigate these mechanisms in more detail is to
examine the effect of saccades and visual context on the pattern of connectivity between
structures in the visual and oculomotor systems. This may provide more information than
that gained from solely examining changes in activity in individual brain areas. This is
particularly true when a network of brain areas is likely to subserve the effects under
consideration (as is the case with saccadic modulation of visual processing).
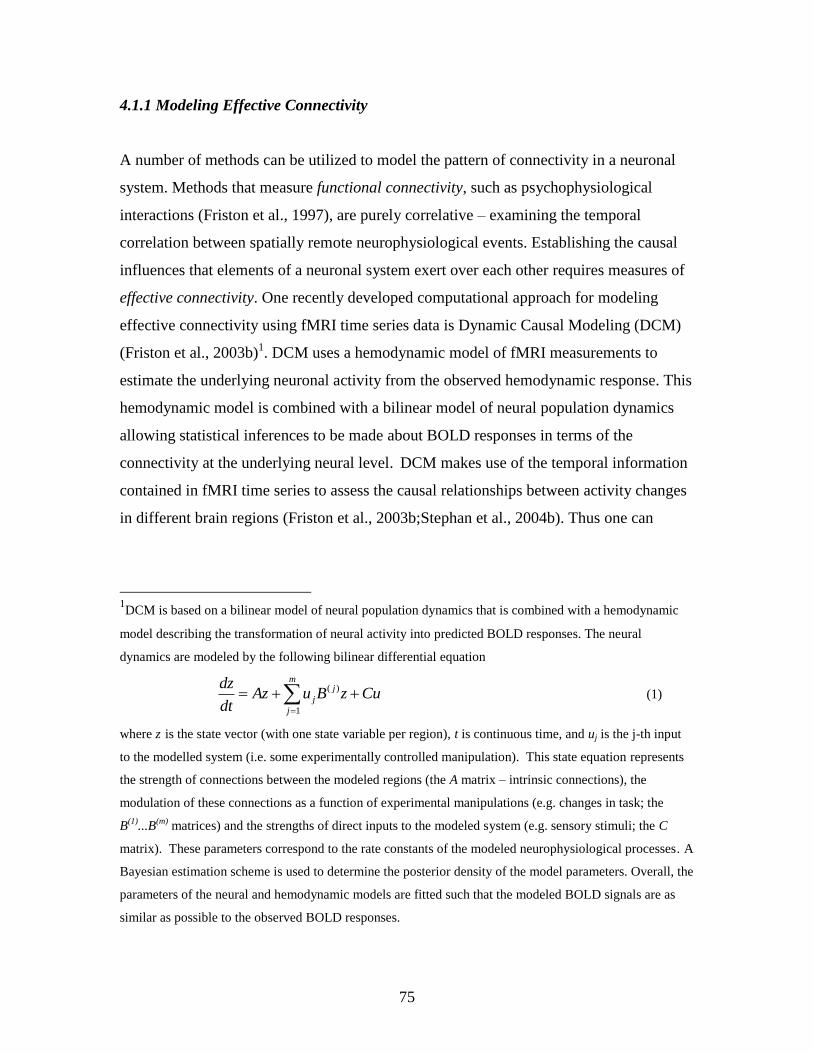
75
4.1.1 Modeling Effective Connectivity
A number of methods can be utilized to model the pattern of connectivity in a neuronal
system. Methods that measure functional connectivity, such as psychophysiological
interactions (Friston et al., 1997), are purely correlative – examining the temporal
correlation between spatially remote neurophysiological events. Establishing the causal
influences that elements of a neuronal system exert over each other requires measures of
effective connectivity. One recently developed computational approach for modeling
effective connectivity using fMRI time series data is Dynamic Causal Modeling (DCM)
(Friston et al., 2003b)1. DCM uses a hemodynamic model of fMRI measurements to
estimate the underlying neuronal activity from the observed hemodynamic response. This
hemodynamic model is combined with a bilinear model of neural population dynamics
allowing statistical inferences to be made about BOLD responses in terms of the
connectivity at the underlying neural level. DCM makes use of the temporal information
contained in fMRI time series to assess the causal relationships between activity changes
in different brain regions (Friston et al., 2003b;Stephan et al., 2004b). Thus one can
1DCM is based on a bilinear model of neural population dynamics that is combined with a hemodynamic
model describing the transformation of neural activity into predicted BOLD responses. The neural
dynamics are modeled by the following bilinear differential equation
m
j
j
j CuzBuAzdt
dz
1
)( (1)
where z is the state vector (with one state variable per region), t is continuous time, and uj is the j-th input
to the modelled system (i.e. some experimentally controlled manipulation). This state equation represents
the strength of connections between the modeled regions (the A matrix – intrinsic connections), the
modulation of these connections as a function of experimental manipulations (e.g. changes in task; the
B(1)
...B(m)
matrices) and the strengths of direct inputs to the modeled system (e.g. sensory stimuli; the C
matrix). These parameters correspond to the rate constants of the modeled neurophysiological processes. A
Bayesian estimation scheme is used to determine the posterior density of the model parameters. Overall, the
parameters of the neural and hemodynamic models are fitted such that the modeled BOLD signals are as
similar as possible to the observed BOLD responses.
76
separately model and make inferences about feed-forward and feedback connectivity,
which is particularly relevant in the context of saccadic modulation of visual areas.
4.1.2 Evidence informing the design of a model of saccadic effects on visual activity
While the hemodynamic model used by DCM has been biophysically validated (Friston
et al., 2000;Stephan et al., 2004a), the design of specific neural models depends on the
framework of a particular experiment and the scientific hypotheses posed. Assumptions
therefore have to be made with respect to the brain regions included in the neural model,
the anatomical connectivity between them, and the modulation of regions and
connections by experimental context (Penny et al., 2004). Therefore to a large extent, the
biological validity of any conclusions based on DCM analysis is dependent on using
anatomical and physiological evidence to inform model design. In this case, evidence
concerning the origin, site of action and mechanisms of saccadic influences on the visual
system needs to be considered.
In relation to the origin of saccadic effects in visual areas, existing evidence implicates
the frontal eye fields. Activity in this structure is consistently associated with saccade
planning and execution (Grosbras et al., 2005;Tehovnik et al., 2000a). Simultaneous
microstimulation of monkey FEF while recording from V4 neurons shows that FEF
modulates activity in primate visual cortex (Moore and Fallah, 2004). An analogous
finding has recently been reported using concurrent TMS-fMRI in humans. Ruff et al
(Ruff et al., 2006) showed remote modulation of visual cortex (V1-V4) BOLD responses
by TMS applied to the FEF. Although these findings do not require the existence of direct
anatomical connections between FEF and visual cortex, as TMS could have remote
effects through indirect pathways, they do provide physiological plausibility to the idea
that modulation of visual areas activity seen during saccades may originate from the FEF.
It is also therefore possible that differential effects on visual processing seen in the
presence and absence of visual stimulation (Sylvester et al., 2005), may reflect changes in
the influence that FEF has on visual areas under these conditions.
77
There is less evidence concerning the locations within the visual system that are directly
influenced by saccades. Multiple locations in the human visual system including LGN,
V1-3 (Sylvester et al., 2005), V4, V7 and hMT+ (Kleiser et al., 2004), are influenced by
saccades. Whether one of these sites represents a critical modulatory site has not been
established. For example, saccades could act in a „top-down‟ manner, influencing higher
visual areas directly and earlier visual areas through alterations in the strength of
feedback connections, or in a „bottom-up‟ manner, influencing sub-cortical areas directly
and higher visual areas through feedforward connections. These two possibilities can be
examined in the light of the earlier findings (presented in Chapter 3) that saccades
modulate the earliest stages of visual processing in the LGN and V1. In the „top-down‟
model, saccades might first modulate V1 (or higher visual areas) and effects on LGN
would then occur via the feedback connection between V1 and LGN. In the „bottom-up‟
model saccades might first modulate LGN and effects in V1 (and later visual areas) are
then mediated through the feedforward connection between LGN and V1. A third
possibility is that saccades might modulate both LGN and V1 directly and their effects
could be mediated by both feedforward and feedback connections. Feedforward and
feedback connections between V1 and LGN are well established anatomically and
changes in the pattern of connectivity between these structures can profoundly alter the
flow of visual information to higher visual areas (Sherman and Guillery, 2002;Sillito and
Jones, 2002). The LGN is also well placed to receive direct modulatory influences from
the oculomotor system due to its connections with the SC (Sparks, 2002) and both
behavioral (Burr et al., 1999) and TMS (Thilo et al., 2004) evidence suggest that the
critical locus of saccadic suppression of vision is subcortical. Of note, the data presented
in Chapter 3 showed that saccades caused a significantly greater degree of modulation in
LGN than V1 (figure 3.5C) indirectly supporting a „bottom-up‟ rather than „top-down‟
model of saccadic influences within the visual system. However, this may merely reflect
methodological differences in recording fMRI signals from cortical and subcortical
structures rather than any differences caused by the action of saccades.
78
4.1.3 Model to be Tested Using DCM
With the above evidence in mind, a model of saccadic influences on FEF, V1 and LGN
was designed that could be tested using DCM (figure 4.1). DCM permits three
components of a connected network of brain areas to be modeled. First, the external
inputs to areas (e.g. sensory inputs - which are the primary focus of conventional
regionally specific analyses), second, the intrinsic connectivity between areas and finally,
the contextual influences that modulate the strength of connections between areas. The
intrinsic connectivity between brain areas represents the degree to which activity in one
area is causally related to activity seen in the second area (or vice versa – as the
connections are directionally specific), in the absence of driving inputs and contextual
modulations. Note that modeling intrinsic connectivity between areas in this way does
not imply that these areas must be directly connected by a monosynaptic anatomical
pathway. The influence of one area on another could also be mediated by a third area (or
through a network of areas).
In the model shown in figure 1, feedforward and feedback connections between FEF and
V1 and between V1 and LGN can be tested. In the model the external inputs are light
(which drives LGN activity) and saccades (which drives FEF activity). Two contextual
modulations are also included in the model, the effect of saccades on the connections
between LGN and V1 and the effect of visual stimulation on the feedforward and
feedback connections between FEF and V1. Contextual modulations reflect the extent to
which an experimental manipulation modulates how activity in one area might be
causally related to activity in a second area. This can be positive or negative depending
on whether the experimental manipulation under consideration causes an increase or
decrease in the effective connectivity between two areas.
In summary the DCM model shown in figure 1 allows two different hypotheses generated
from the results presented in Chapter 3 to be empirically tested:
1) Saccades primarily modulate visually evoked brain activity by directly acting on
LGN. Therefore, V1 modulation during saccades is mediated through changes in
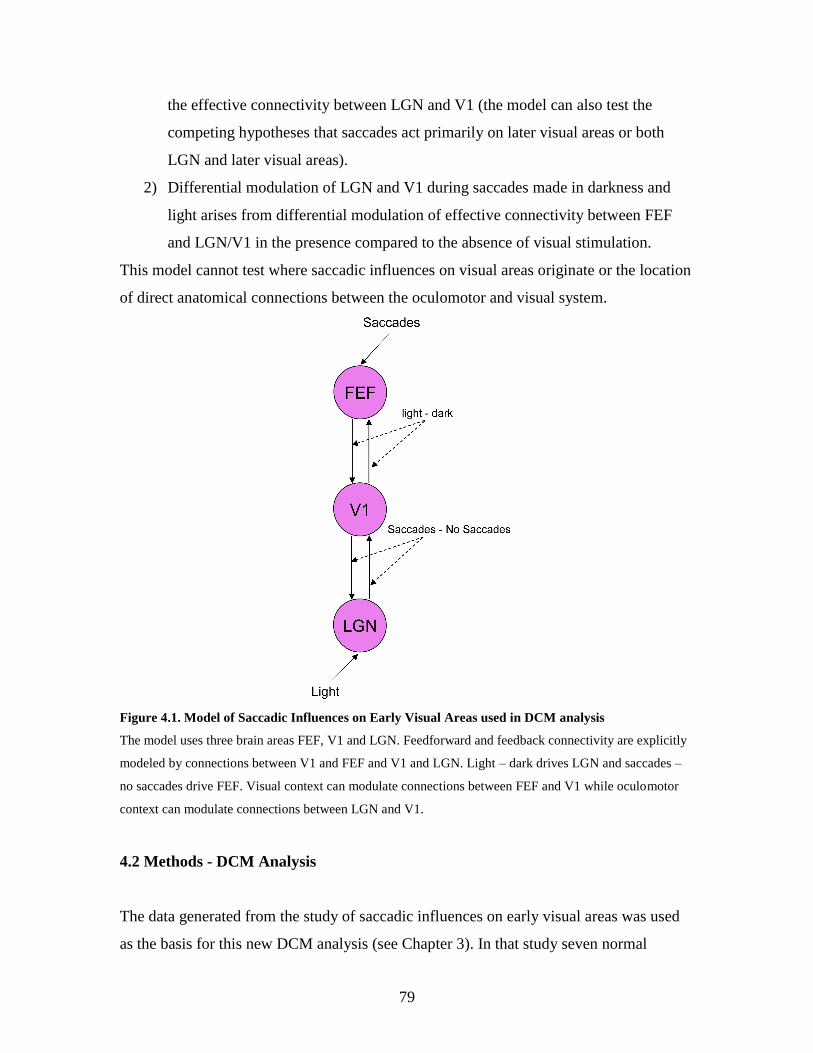
79
the effective connectivity between LGN and V1 (the model can also test the
competing hypotheses that saccades act primarily on later visual areas or both
LGN and later visual areas).
2) Differential modulation of LGN and V1 during saccades made in darkness and
light arises from differential modulation of effective connectivity between FEF
and LGN/V1 in the presence compared to the absence of visual stimulation.
This model cannot test where saccadic influences on visual areas originate or the location
of direct anatomical connections between the oculomotor and visual system.
Figure 4.1. Model of Saccadic Influences on Early Visual Areas used in DCM analysis
The model uses three brain areas FEF, V1 and LGN. Feedforward and feedback connectivity are explicitly
modeled by connections between V1 and FEF and V1 and LGN. Light – dark drives LGN and saccades –
no saccades drive FEF. Visual context can modulate connections between FEF and V1 while oculomotor
context can modulate connections between LGN and V1.
4.2 Methods - DCM Analysis
The data generated from the study of saccadic influences on early visual areas was used
as the basis for this new DCM analysis (see Chapter 3). In that study seven normal
80
subjects were scanned using a 3T fMRI scanner and two factors were manipulated
independently in a block design: saccades (present or absent) and visual stimulation
(chromatic flicker, achromatic flicker or no flicker), giving a total of six conditions. For
the purposes of the DCM analysis chromatic and achromatic flicker conditions were
considered together as visual stimulation. This was justified as there was no difference
between the activity evoked in V1 and LGN, and its modulation by saccades, when these
conditions were analysed separately (figure 3.6). Pre-processing and visual area
localisation are described in the methods section of Chapter 3. The maximally active
voxels in left and right LGN, V1 and FEF were identified using a t-contrast of light –
dark for LGN and V1 and a t-contrast of saccade – no saccade for FEF. Time series for
these voxels were extracted using SPM2. DCM analysis was carried out separately for
each hemisphere of each subject and the results were then averaged across hemispheres
in each subject. The coupling parameters from the DCM of each of the seven subjects
were then averaged. To test whether these effects were statistically significant, the
coupling parameters from each subject were used in paired sample t-tests (in the case of
contrasts, such as the modulatory influence of saccades – no saccades) or one sampled t-
tests (in the case of intrinsic connections).
4.3 Results
The results of the initial DCM analysis are outlined in figure 4.2. The results are
presented as an average coupling parameter derived from all subjects and a measure of
statistical significance using two-tailed paired t-tests (or one sample t-tests in the case of
intrinsic connections) across subjects. The value of any coupling parameter represents a
measure of the strength of direction-specific coupling between one area and another.
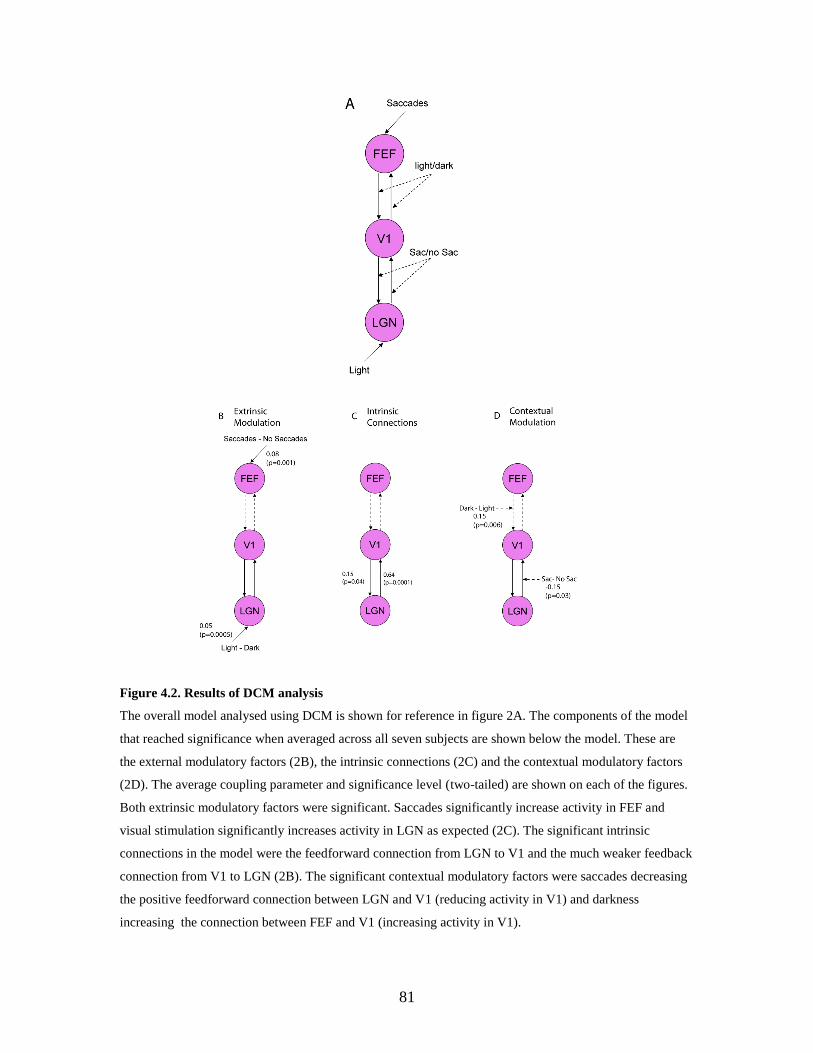
81
Figure 4.2. Results of DCM analysis
The overall model analysed using DCM is shown for reference in figure 2A. The components of the model
that reached significance when averaged across all seven subjects are shown below the model. These are
the external modulatory factors (2B), the intrinsic connections (2C) and the contextual modulatory factors
(2D). The average coupling parameter and significance level (two-tailed) are shown on each of the figures.
Both extrinsic modulatory factors were significant. Saccades significantly increase activity in FEF and
visual stimulation significantly increases activity in LGN as expected (2C). The significant intrinsic
connections in the model were the feedforward connection from LGN to V1 and the much weaker feedback
connection from V1 to LGN (2B). The significant contextual modulatory factors were saccades decreasing
the positive feedforward connection between LGN and V1 (reducing activity in V1) and darkness
increasing the connection between FEF and V1 (increasing activity in V1).
82
4.3.1 External Inputs
External inputs to a region (figure 4.2B) represent the extent to which an experimental
manipulation (such as sensory stimulation) drives regionally specific activity. In this
model light – dark significantly drives LGN (c=0.05, t(6)=6.7, p=0.0005) and saccades –
no saccades drives FEF (c=0.08, t(6)=5.9, p=0.001). These results are expected both on a
conceptual level (LGN responds to visual stimulation and FEF activity is correlated to
saccades) and on a practical level (voxels were selected on the basis of their response to
these contrasts in a standard SPM).
4.3.2 Intrinsic Connections
Intrinsic connections (figure 4.2C) represent the impact that one region has over another
in the absence of experimental perturbations. In this model, both the feedforward and
feedback connections between V1 and LGN were significantly greater than zero (LGN –
V1: c=0.64, t(6)=9.17, p=0.00001. V1-LGN: c=0.15, t(6)=2.6, p=0.04). Note that the
feedforward connection from LGN to V1 is much stronger (and significant) than the
feedback connection. Both the connection between FEF and V1 and the connection
between V1 and FEF were not significantly different to zero across subjects (FEF – V1:
c= -0.03, t(6)= -0.4, p=0.69. V1 – FEF: c= -0.13, t(6)= -1.24, p=0.26).
4.3.3 Contextual Modulations
Contextual modulations (figure 4.2D) represent the effects that experimental
perturbations have on the connectivity between areas. In this model the contextual
modulatory factors tested were the effect of saccades on connections between V1 and
LGN and the effect of visual context on connections between V1 and FEF. The effect of
saccades (derived from saccades – no saccades) significantly decreased the strength of
the feedforward connection between LGN and V1 (c= -0.15, t(6)= 2.7, p=0.035) but had
no significant effect on feedback from V1 to LGN (c= -0.07, t(6)= 1.25, p=0.26). The
strength of the connection between FEF and V1 (which was not significantly different to
83
zero in the absence of experimental inputs) was significantly enhanced in darkness
(derived from dark – light) (c=0.15, t(6)=4.11, p=0.006) but there was no significant
effect on the V1 to FEF connection (c= -0.03, t(6)= 0.5, p=0.59).
4.3.4 Model Comparison
These results suggest that differential modulation of V1 during saccades can be
accounted for by two independent contextual modulations. The decrease in visually
evoked activity during saccades was associated with a decrease in the excitatory
feedforward connection from LGN to V1. In contrast, increased V1 activity during
saccades in darkness was related to an increase in the excitatory connection from FEF to
V1. This account assumes that both the contextual modulatory effects make a similar
contribution to how well the DCM model fits the fMRI data. However, there is no a priori
reason why these two contextual factors should contribute equally to the DCM.
Therefore, in order to validate the results of the DCM one must empirically assess the
relative contribution of each modualtory factor to the DCM. One method for doing this is
to remove specific components of the model and then quantify the resulting effects on
model fit. To this end, two new reduced models were designed and their coupling
parameters estimated using DCM (figure 4.3). The first model was the same as the
original DCM but the modulatory influence of visual stimulation on connections between
FEF and V1 was removed. The second model was the same as the original DCM but the
modulatory influence of saccades on connections between LGN and V1 was removed.
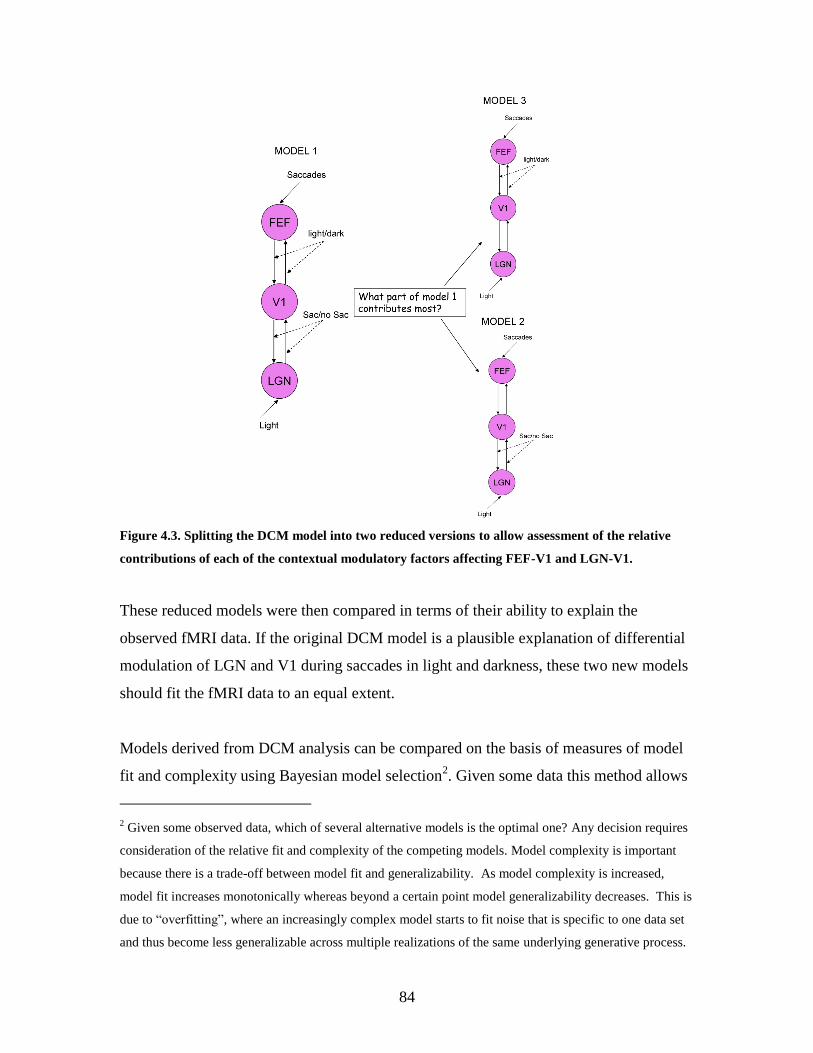
84
Figure 4.3. Splitting the DCM model into two reduced versions to allow assessment of the relative
contributions of each of the contextual modulatory factors affecting FEF-V1 and LGN-V1.
These reduced models were then compared in terms of their ability to explain the
observed fMRI data. If the original DCM model is a plausible explanation of differential
modulation of LGN and V1 during saccades in light and darkness, these two new models
should fit the fMRI data to an equal extent.
Models derived from DCM analysis can be compared on the basis of measures of model
fit and complexity using Bayesian model selection2. Given some data this method allows
2 Given some observed data, which of several alternative models is the optimal one? Any decision requires
consideration of the relative fit and complexity of the competing models. Model complexity is important
because there is a trade-off between model fit and generalizability. As model complexity is increased,
model fit increases monotonically whereas beyond a certain point model generalizability decreases. This is
due to “overfitting”, where an increasingly complex model starts to fit noise that is specific to one data set
and thus become less generalizable across multiple realizations of the same underlying generative process.
85
selection of the optimal model from several alternatives. This can be expressed
statistically in terms of a Bayes Factor, where a value is assigned to the hypothesis that
one model fits the data more than another. The Bayes Factor was calculated for the
comparison between model 2 (modulation of LGN-V1 by saccades) and model 3
(modulation of FEF-V1 by visual context) in each of the individual subjects, and was less
than 3 in all subjects. When trying to find the optimal model for a group of individuals
using BMS, it is likely that the optimal model will vary, at least to some degree, across
subjects. An overall decision for n subjects can be made by computing an average Bayes
Factor which corresponds to the n-th root of the product of the in dividual Bayes Factors
In this case, the average Bayes Factor was 1.091 suggesting that both models are equally
Therefore, the question “What is the optimal model?” can be reformulated as “What is the model that
represents the best balance between fit and complexity?” In a Bayesian context, the latter question can be
addressed by comparing the evidence, )|( myp , of different models. Unfortunately, this cannot be
solved analytically, therefore an approximation to the model evidence is needed. Suitable approximations,
which do not depend on the prior density, are the Bayesian Information Criterion (BIC) and Akaike
Information Criterion (AIC), respectively. In the context of fMRI data, BIC will be biased towards simpler
models whereas AIC will be biased towards complex models. Therefore the convention that, for any pairs
of models to be compared, if AIC and BIC decisions do not concur; the decision is then based on that
approximation which gives the smaller Bayes factor has been adopted. This approach to Bayesian model
selection (BMS) provides a robust procedure to decide between competing hypotheses represented by
different DCMs. When trying to find the optimal model for a group of individuals by BMS, it is likely that
the optimal model will vary, at least to some degree, across subjects. An overall decision for n subjects can
be made by computing an average Bayes factor which corresponds to the n-th root of the product of the
individual Bayes factors.
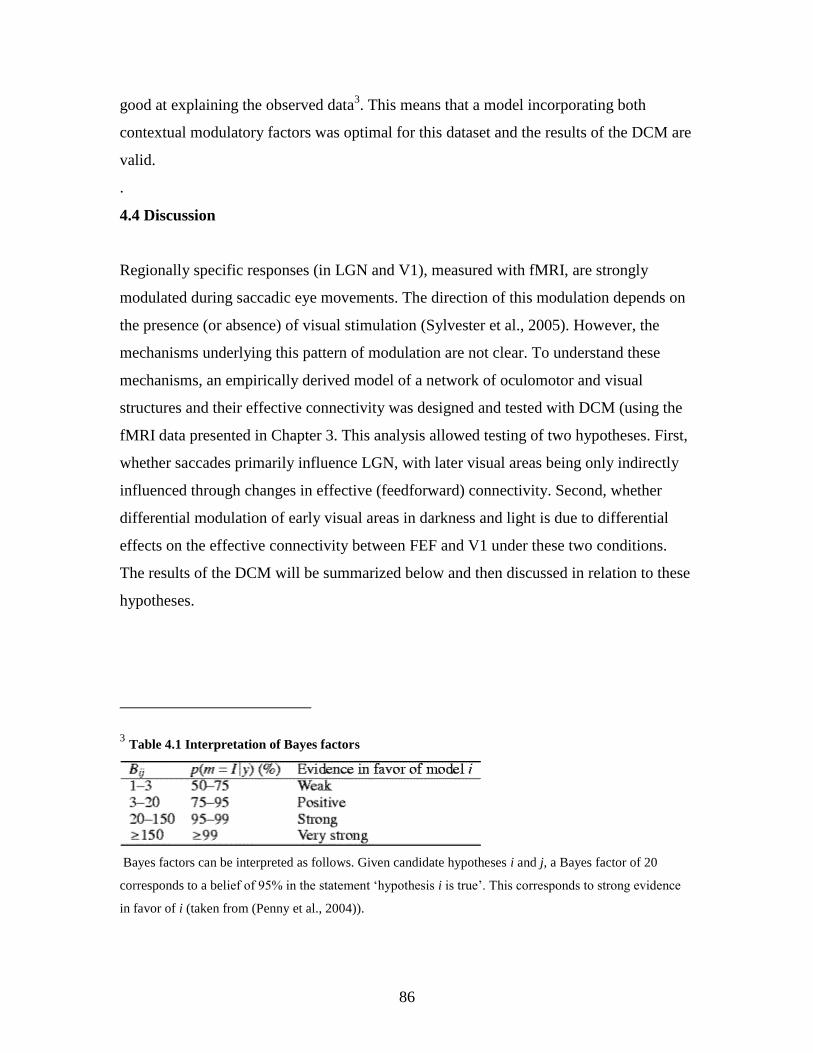
86
good at explaining the observed data3. This means that a model incorporating both
contextual modulatory factors was optimal for this dataset and the results of the DCM are
valid.
.
4.4 Discussion
Regionally specific responses (in LGN and V1), measured with fMRI, are strongly
modulated during saccadic eye movements. The direction of this modulation depends on
the presence (or absence) of visual stimulation (Sylvester et al., 2005). However, the
mechanisms underlying this pattern of modulation are not clear. To understand these
mechanisms, an empirically derived model of a network of oculomotor and visual
structures and their effective connectivity was designed and tested with DCM (using the
fMRI data presented in Chapter 3. This analysis allowed testing of two hypotheses. First,
whether saccades primarily influence LGN, with later visual areas being only indirectly
influenced through changes in effective (feedforward) connectivity. Second, whether
differential modulation of early visual areas in darkness and light is due to differential
effects on the effective connectivity between FEF and V1 under these two conditions.
The results of the DCM will be summarized below and then discussed in relation to these
hypotheses.
3 Table 4.1 Interpretation of Bayes factors
Bayes factors can be interpreted as follows. Given candidate hypotheses i and j, a Bayes factor of 20
corresponds to a belief of 95% in the statement „hypothesis i is true‟. This corresponds to strong evidence
in favor of i (taken from (Penny et al., 2004)).
87
4.4.1 Summary of DCM results
1) A model incorporating both saccades and visual context is required to optimally
fit the observed fMRI data (from Chapter 3).
2) Visual stimulation strongly influences LGN and saccades strongly influence FEF.
3) Activity in LGN strongly influences V1 activity but saccades reduce the strength
of this effect (leading to reduced V1 activity). Saccades significantly decrease
connectivity between LGN and V1.
4) Activity in FEF does not strongly influence activity in V1 unless visual
stimulation is absent (FEF activity leads to increased V1 activity in darkness).
These results are consistent with the following mechanism of differential modulation of
visual areas during saccades made in the presence and absence of visual stimulation.
Passively viewing visual stimuli directly increases LGN activity which increases V1
activity through feedforward connections (positive feedback from V1 to LGN also
occurs). Saccades modulate this connection by specifically reducing the strength of
feedforward connectivity between LGN and V1 leading to a reduction in visually evoked
activation in LGN and V1 during saccades. Saccades also directly increase FEF activity.
As FEF is not intrinsically connected to V1, under normal circumstances this increased
activity has no direct effect on V1 activity. However darkness increases the strength of
connectivity between FEF and V1, so that when saccades are made in darkness, increased
activity in FEF results in increased V1 activity (increased LGN activity could occur
through V1-LGN feedback or directly, but the current model cannot test between these
alternatives). Thus the interaction between saccades and visual context found LGN and
V1 responses can be explained by changes in effective connectivity between LGN, V1
and FEF due to modulatory influences of saccades and background visual conditions.
4.4.2 The primary site of saccadic modulation of visual activity
DCM analyses suggests that suppression of visually evoked activity in V1 during
saccades (as measured using fMRI) can be best explained by reduced effective
88
feedforward connectivity between LGN and V1 but not by alterations in effective
feedback connectivity from V1 to LGN. These results support LGN, rather than later
visual areas, as the primary site at which saccades modulate visual processing. This is
consistent with the fMRI data presented in Chapter 3, which showed that the degree of
saccadic suppression of visually evoked responses was significantly greater in LGN than
for V1. Three separate lines of evidence are consistent with LGN as a critical site for
saccadic influences on vision. First, psychophysically saccadic suppression occurs very
early in the visual processing stream prior to the sites of contrast masking (Burr et al.,
1994) and visual motion analysis (Burr et al., 1999). Second, visual phosphenes
generated by TMS stimulation of human occipital cortex are perceived during saccades,
whereas those produced by electrical stimulation of the eye are suppressed (Thilo et al.,
2004). Finally, monkey LGN neuronal responses are strongly modulated during saccades
(Bartlett et al., 1976;Ramcharan et al., 2001;Reppas et al., 2002) and similar modulation
in cat LGN is seen (Felisberti and Derrington, 1999) and can be modulated by
inactivation of the pretectum (Fischer et al., 1998), consistent with saccadic influences in
LGN arising from brainstem occulomotor circuits. However, saccades also lead to
complex effects on receptive field properties in later monkey visual areas, such as V5/MT
(e.g. reversal of their preferred direction of motion) (Thiele et al., 2002), which are very
difficult to explain through reduction in LGN output alone. Such findings suggest that
later visual areas may also be directly modulated by cortical oculomotor structures (such
as FEF – see below). In the model tested using DCM, this would appear as reduced
feedback from V1 to LGN during saccades. Although the DCM analysis did not provide
evidence for saccadic modulation of cortico-geniculate feedback, there are a number of
reasons why reduced feedback from V1 to LGN remains an attractive mechanism for
saccadic suppression. Firstly, abolishing cortico-geniculate feedback has similar effects
functional effects to directly inhibiting LGN (Przybyszewski et al., 2000). Furthermore,
awareness of visual stimuli has been linked to intact recurrent processing (Lamme and
Roelfsema, 2000). Disruption of cortico-geniculate feedback might also therefore explain
the lack of awareness during saccades.
89
DCM is useful for testing hypotheses involving effective connectivity using fMRI data.
However, direct testing of predictions based on DCM findings is important to establish
their validity. For example, one could test whether cortico-geniculate feedback is
necessary for saccadic modulatory effects in LGN, by repeating the experiment outlined
in Chapter 3 using subjects with unilateral optic radiation (or V1) lesions and
hemianopia. These subjects have no intact cortico-geniculate pathways in the damaged
hemisphere (but functioning pathways in the intact hemisphere). Therefore the presence
of modulation of LGN in the damaged hemisphere during saccades would prove that
cortico-geniculate feedback is not necessary for saccadic modulation of LGN (the intact
hemisphere would act as a within subject control). Lack of LGN modulation would
suggest that cortico-geniculate pathways are required for the saccadic effects seen in
LGN.
4.4.3 Differential modulation of V1/LGN by saccades in darkness and light
The DCM findings suggest that reduced visual responses in LGN and V1 during saccades
can be explained by a reduction in LGN activity and its effective connectivity to V1.
However, this cannot explain why saccades made in darkness lead to an increase in V1
and LGN activity. The DCM suggests that this is due the influence of a second
modulatory factor, visual stimulation, and effective connectivity between FEF (which is
significantly activated during saccades) and V1 is increased in darkness compared to
light. This increase in effective connectivity leads to increased V1 activity seen during
saccades in darkness. The concurrent increase in LGN activity could occur through V1-
LGN feedback from oculomotor input (FEF or SC), but the current model cannot test
between these alternatives.
The DCM result suggests that the FEF has a key role in saccadic modulation of visual
areas. Although it is worth mentioning that in a preliminary analysis of the data presented
here replacing FEF with either PEF and SEF gave similar results (suggesting that these
areas may also be involved in saccadic modulation of V1/LGN). FEF is known to be
critically involved in saccade planning and execution (Grosbras et al., 2005;Tehovnik et
90
al., 2000b) and covert shifts of attention (Wardak et al., 2006). But microstimulation of
sites in FEF leads to enhanced visual responses of retinotopically corresponding monkey
V4 neurons (Moore and Fallah, 2004), suggesting that FEF activity also modulates early
visual cortical activity. In humans, TMS to FEF has been shown to modulate early VEPs
(Taylor et al., 2006) and V1-V4 BOLD responses (Ruff et al., 2006). In particular TMS
applied to FEF led to suppression of V1-V4 BOLD responses in retinotopic
representations of the central visual field and increased activation of representations of
the peripheral visual field. Ruff and colleagues report that this pattern was identical in
darkness and during visual stimulation, suggesting that any influence of FEF on visual
cortex is not altered by visual conditions (see above). However, the TMS pulses applied
to the FEF did not elicit saccades, whereas subjects in the current study made large
horizontal saccades. It is possible that effective connectivity between FEF and V1 is only
increased when FEF activity is above the threshold required to elicit saccades. If this is
the case then evidence of the saccade related signal seen in LGN and V1 in darkness
should be present when a saccade is made in light. This possibility will be explored in
Chapter 5.
4.5 Conclusion
The results presented in Chapter 3 showed that saccades differentially modulate BOLD
responses in early visual areas depending on visual context. In this chapter the effect of
saccades and visual context on the effective connectivity between visual and oculomotor
areas was investigated using DCM. The results of this analysis demonstrate that saccadic
modulation of visual brain areas can be explained by changes in the effective
connectivity between LGN, V1 and FEF. Specifically, saccades modulate LGN activity
rather than later visual areas (which are modulated through decreased feedforward
effective connectivity). Second, differential modulation of visual areas during saccades in
darkness and light can be explained by changes in the effective connectivity between FEF
and V1. As DCM is primarily a computational modeling method, further empirical
research based on hypotheses derived from the DCM results are required in order to
validate these findings.
91
CHAPTER 5: EXTRARETINAL SACCADIC SIGNALS IN HUMAN LGN AND
EARLY RETINOTOPIC CORTEX
5.1 Introduction
The data presented in chapter 3 demonstrated that activity in human early visual areas is
strongly modulated by saccadic eye movements (Sylvester et al., 2005) and that the
direction of this modulation is dependent on the presence or absence of visual
stimulation. The previous chapter used DCM to show that this pattern of modulation
could be explained by changes in the effective connectivity between visual and
oculomotor areas. This chapter presents data that examines the nature of the modulation
of visual areas by saccades in greater detail.
One possible explanation for the finding that saccades lead to differential modulation of
visual areas in the presence and absence of visual stimulation, is that the positive and
negative modulation represent separate saccadic influences on visual areas. A reduction
in visually evoked activity could represent the neural correlate of saccadic suppression
(perisaccadic reduction in visual sensitivity), while increased activity seen during
saccades in darkness could represent an extraretinal signal related to oculomotor activity.
Support for this view comes from the recent finding that the time course of suppression
of visual responses in human V1 by saccades closely matches the time course of the
reduction in observed behaviorally (Vallines and Greenlee, 2006). Additionally, reduced
visually evoked activity during saccades is consistent with some monkey LGN and V1
single cell studies (Duffy and Burchfiel, 1975;Ramcharan et al., 2001), although the most
definitive study suggests a more complex biphasic response in LGN (Reppas et al, 2002).
Although a reduction in visual activity during saccades seems likely to represent neural
correlate of saccadic suppression, the hypothesis that increased activity in visual areas
92
represents an oculomotor signal is problematic. Results from other imaging studies have
been inconsistent, with both increases (Bodis-Wollner et al., 1997) and decreases (Paus et
al., 1995;Wenzel et al., 2000) in occipital cortex found when saccades are made in total
darkness. Additionally, saccadic enhancement of visually responsive brain areas in total
darkness must reflect an extraretinal signal (as in this situation retinal activation is
minimal4), However, it is not clear what the basis of such a signal might be. There are
two mutually exclusive possibilities concerning the nature of this extraretinal signal.
First, an extraretinal signal might be present in visual cortex only in total darkness.
Darkness may be a special „resting state‟ for the visual system (Raichle et al., 2001), in
which visual areas respond to extraretinal information that does not elicit activity in the
presence of visual stimulation. Alternatively, differential saccadic modulation of LGN
and V1 activity in the presence and absence of visual stimulation might reflect the
superposition of a positive extraretinal signal (independent of visual stimulation) and a
negative signal (saccadic suppression - dependent on the presence of visual stimulation).
The positive extraretinal signal represents a copy of the efferent motor command
(corollary discharge) that is present whenever the eyes are moved. Such an oculomotor
corollary discharge in early visual areas could be used to aid compensation for the visual
consequences of eye movements. Interestingly, single unit recording data in non-human
primates suggest that V1 neurons may encode corollary discharge, in the form of precise
spatial information about upcoming saccades (Super et al., 2004). Furthermore,
eyeblinks, another disruptive oculomotor action leading to suppression of visual
perception (Volkmann et al., 1980), have similar effects to saccades on responses in early
visual areas (Bristow et al., 2005).
Significant saccadic suppression of visual sensitivity still occurs with weak visual stimuli
(Diamond et al., 2000). However, the two possibilities above make different predictions
about how saccades might modulate visual responses to weak visual stimuli. If an
extraretinal signal is only present in total darkness, suppression of visually evoked
4 If large saccades are performed in total darkness, one has the impression of very faint peripheral visual
phosphenes, presumably due to mechanical stimulation of the retina (secondary to torsion of the eye
muscles). This phenomenon was originally described by Helmholtz and is analogous to the perception one
gets when applying light pressure to the eyeball when the eye is closed. Therefore it is not strictly true to
say that there is no retinal stimulation during saccades, although any stimulation that does occur is minimal.
93
responses during saccades should be observable over a range of visual stimulus strengths.
However, if an extraretinal signal is present whenever saccades are executed, it should
instead mask suppression of visually evoked activity during saccades at lower visual
stimulus strengths, leading to an underestimate of the extent of saccadic suppression. The
graded reduction (or absence) of a neural signature of saccadic suppression at
intermediate visual stimulation levels could then be interpreted as evidence in favor of an
additive explanation, where measured BOLD activity in visual areas during saccades
results from the sum of retinally and extraretinally evoked signals. In contrast, saccadic
suppression of visually evoked responses over the whole range of visual stimulation
strengths, would be more consistent with the extraretinal signal only occurring in
darkness.
To test these hypotheses, the effect of systematically manipulating the strength of visual
stimulation on saccadic modulation of LGN and V1 responses was examined. In order to
replicate previous findings and to explore the role of other visual areas (V2 and V3), a
paradigm related to the study presented in Chapter 3 was used. Specifically, activity in
LGN and V1/V2/V3 (identified using retinotopic mapping in individual participants) was
measured using high field fMRI while participants made saccades under different visual
conditions. The presence (versus absence) of saccades, the presence (versus absence) of
full-field achromatic flickering visual stimulation and the mean luminance of the visual
flicker driving visual responses (0%, 15%, 45% and 90%; see Methods) was
independently manipulated. The effect of saccades on luminance-evoked signals was
studied, as these can strongly modulate BOLD signals in human early visual cortex
(Haynes et al., 2004). Participants wore diffuser goggles to ensure that eye movements
did not alter the spatiotemporal structure of the retinal image, and eye movements were
monitored using electro-oculography. Individual retinotopic analyses of each participant
were performed so that modulatory effects of saccades on early visual areas over the
range of different visual stimulation conditions could be examined.
5.2 Methods
5.2.1 Participants
94
Seven healthy volunteers gave written informed consent to participate in the study, which
was approved by the local ethics committee. Following scanning, one participant was
rejected on the basis of excessive head movement (>5mm). Six participants (four male,
mean age 27.8 years) were included in the analyses reported here.
5.2.2 Stimuli and Apparatus
Stimuli and apparatus used were very similar to those used for the experiment outlined in
Chapter 3. Participants lay supine in the scanner, wearing customised spherical goggles
made of semi-opaque plastic that created near-Ganzfeld conditions (Figure 3.1). The
goggles minimized the effect of eye movements on the pattern of retinal stimulation.
Visual stimuli were presented with an LCD projector (NEC LT158, refresh rate 60 Hz)
and projected onto the surface of the goggles via a mirror positioned within the head coil.
All stimuli were presented using MATLAB (Mathworks Inc.) and COGENT 2000
toolbox (www.vislab.ucl.ac.uk/ cogent/index.html). Visual stimuli consisted of full field
flicker of achromatic (black/white) stimuli at a rate of 7.5 Hz (8 screen refresh cycles)
presented for 16s, with the white aspect of the stimuli set to 15%, 45% or 90% of the
maximal output of the projector in the scanning environment (10cd/m2). Thus mean
luminance of the visual stimulus was varied while keeping the Michelson contrast
constant. Using electro-oculography, eye movements were recorded during scanning in
four of the six participants whose scanning data were analyzed.
In the main experiment, two factors were manipulated independently in a 2x4 factorial
blocked design. The factors were saccades (present or absent) and the mean luminance of
visual stimulation (0%, 15%, 45% or 90% of maximum mean luminance), giving a total
of eight conditions. During scanning, conditions were presented pseudo-randomly in
blocks of 16s with a short 20s rest period between blocks (rest periods were not modelled
in the subsequent analysis). Each block was preceded by an auditory command presented
through pneumatic headphones that instructed subjects to either move their eyes or keep
95
their eyes still in the subsequent block. During the block, a sequence of pacing tones at
1.5 Hz was presented binaurally for 16s. In „saccade‟ blocks, subjects were instructed to
make a large horizontal saccade with their eyes open in response to each tone. In „no
saccade‟ blocks, subjects were instructed to fixate centrally with their eyes open. Note
that pacing tones were always present in all blocks, regardless of whether eye movements
were required, and that the eyes were always open throughout the experiment.
5.2.3 Imaging and Analysis
A 3T Siemens Allegra MRI system was used to acquire Blood Oxygenation Level-
Dependent (BOLD) contrast image volumes. Volumes were acquired continuously every
1.56s, each comprising 24 contiguous 3-mm-thick slices to give coverage of early visual
brain areas with an in-plane resolution of 3x3 mm. Six scanning runs were then acquired,
each comprising 180 image volumes for each subject.
Imaging data were analysed using SPM2 (www.fil.ion.ucl.ac.uk/spm). After discarding
the first five image volumes from each run to allow for T1 equilibration effects, image
volumes were realigned, coregistered to each subject‟s structural scan and smoothed with
an isotropic 6mm Gaussian kernel (Turner et al., 1998). Voxels that were activated in
each experimental condition were identified using a statistical model containing boxcar
waveforms representing each of the eight experimental conditions, convolved with a
canonical haemodynamic response function and mean-corrected. Motion parameters
defined by the realignment procedure were added to the model as six separate regressors
of no interest. Multiple linear regression was then used in order to generate parameter
estimates for each regressor at every voxel. Data were scaled to the global mean of the
time series, and high-pass filtered (cut-off frequency 0.0083 Hz) to remove low-
frequency signal drifts.
5.2.4 Visual Area Localisation

96
To identify the boundaries of primary visual cortex (V1) and extra-striate retinotopic
cortex, standard retinotopic mapping procedures were used (Sereno et al., 1995).
Checkerboard patterns covering either the horizontal or vertical meridian were alternated
with rest periods for 5 epochs of 20s over a scanning run lasting 155 volumes. Mask
volumes for each region of interest (left and right V1, V2d, V2v, V3d, V3v) were
obtained by delineating the borders between visual areas using activation patterns from
the meridian localisers. Standard definitions of V1 together with segmentation and
cortical flattening in MrGray were followed (Wandell et al., 2000). LGN was localised in
each subject by using 10 alternating 20s epochs of left/right hemifield checkerboard
stimuli over a scanning run lasting 155 volumes (O'Connor et al., 2002). These data were
pre-processed and co-registered to each subjects structural scan as in the main
experiment. LGN activations generated from a contrast of left greater than right hemifield
stimulation (for right LGN) or right greater than left hemifield stimulation (for left LGN)
in each subject were identified using an anatomical and radiological brain atlas
(Duvernoy, 1999) to locate anatomical landmarks close to LGN on the high resolution
structural scan of each subject. In two subjects LGN was only reliably localised
unilaterally; therefore for these two subjects, data from unilateral LGN was used in the
main analysis (one subject right side only, the other subject left side only).
To extract activity from early retinotopic visual mask volumes for each region of interest
were created (left and right – LGN, V1, V2d, V2v, V3d and V3v). Regression parameters
(estimates of evoked brain activity) resulting from analysis of the experimental imaging
time series were extracted for the maximally activated voxel (comparing visual
stimulation with darkness in „no saccade‟ conditions) in each of these regions of interest
to yield a plot of percent signal change for each experimental condition in LGN, V1, V2
and V3 averaged across subjects. To ensure that responses were consistent across each
region, we performed an identical analysis but averaging across all voxels in each area,
which produced virtually identical results.
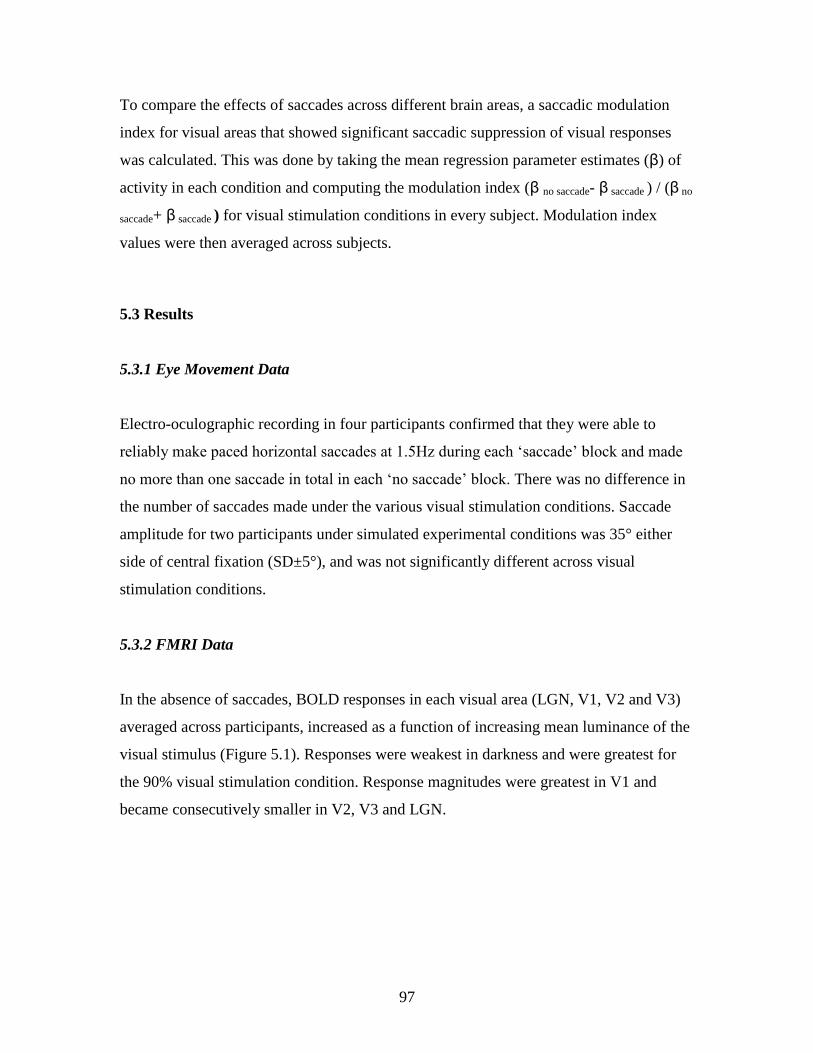
97
To compare the effects of saccades across different brain areas, a saccadic modulation
index for visual areas that showed significant saccadic suppression of visual responses
was calculated. This was done by taking the mean regression parameter estimates (β) of
activity in each condition and computing the modulation index (β no saccade- β saccade ) / (β no
saccade+ β saccade ) for visual stimulation conditions in every subject. Modulation index
values were then averaged across subjects.
5.3 Results
5.3.1 Eye Movement Data
Electro-oculographic recording in four participants confirmed that they were able to
reliably make paced horizontal saccades at 1.5Hz during each „saccade‟ block and made
no more than one saccade in total in each „no saccade‟ block. There was no difference in
the number of saccades made under the various visual stimulation conditions. Saccade
amplitude for two participants under simulated experimental conditions was 35° either
side of central fixation (SD±5°), and was not significantly different across visual
stimulation conditions.
5.3.2 FMRI Data
In the absence of saccades, BOLD responses in each visual area (LGN, V1, V2 and V3)
averaged across participants, increased as a function of increasing mean luminance of the
visual stimulus (Figure 5.1). Responses were weakest in darkness and were greatest for
the 90% visual stimulation condition. Response magnitudes were greatest in V1 and
became consecutively smaller in V2, V3 and LGN.
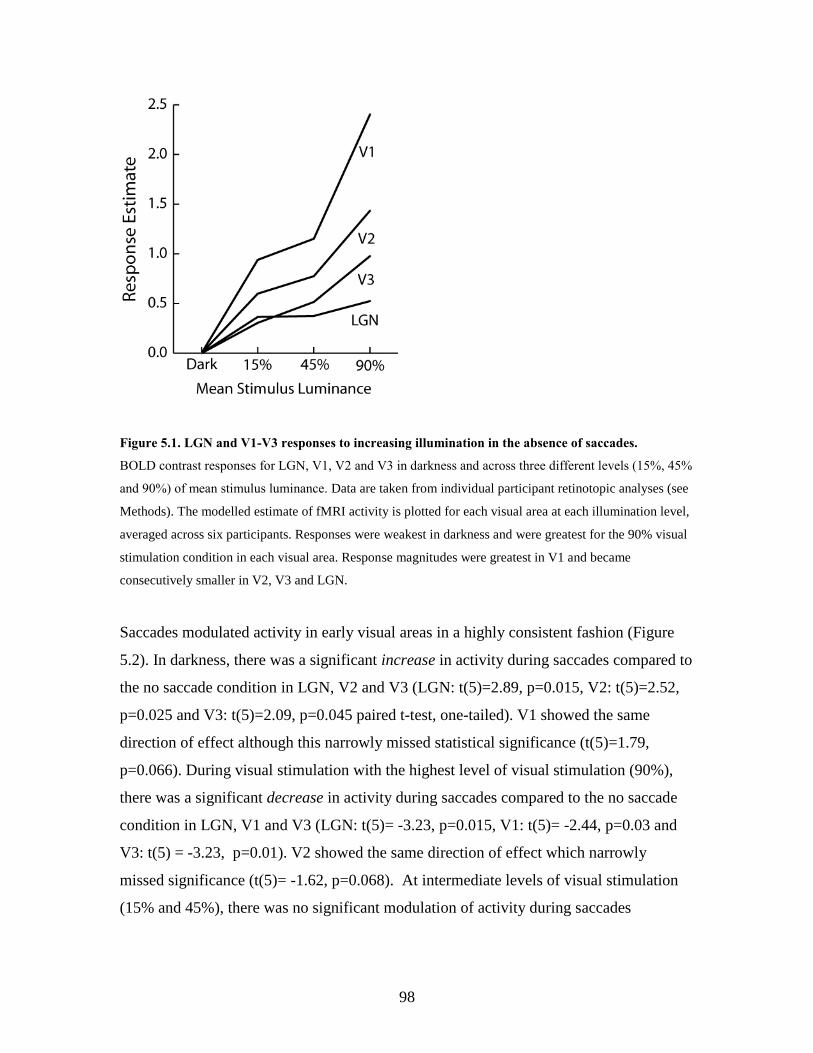
98
Figure 5.1. LGN and V1-V3 responses to increasing illumination in the absence of saccades.
BOLD contrast responses for LGN, V1, V2 and V3 in darkness and across three different levels (15%, 45%
and 90%) of mean stimulus luminance. Data are taken from individual participant retinotopic analyses (see
Methods). The modelled estimate of fMRI activity is plotted for each visual area at each illumination level,
averaged across six participants. Responses were weakest in darkness and were greatest for the 90% visual
stimulation condition in each visual area. Response magnitudes were greatest in V1 and became
consecutively smaller in V2, V3 and LGN.
Saccades modulated activity in early visual areas in a highly consistent fashion (Figure
5.2). In darkness, there was a significant increase in activity during saccades compared to
the no saccade condition in LGN, V2 and V3 (LGN: t(5)=2.89, p=0.015, V2: t(5)=2.52,
p=0.025 and V3: t(5)=2.09, p=0.045 paired t-test, one-tailed). V1 showed the same
direction of effect although this narrowly missed statistical significance (t(5)=1.79,
p=0.066). During visual stimulation with the highest level of visual stimulation (90%),
there was a significant decrease in activity during saccades compared to the no saccade
condition in LGN, V1 and V3 (LGN: t(5)= -3.23, p=0.015, V1: t(5)= -2.44, p=0.03 and
V3: t(5) = -3.23, p=0.01). V2 showed the same direction of effect which narrowly
missed significance (t(5)= -1.62, p=0.068). At intermediate levels of visual stimulation
(15% and 45%), there was no significant modulation of activity during saccades
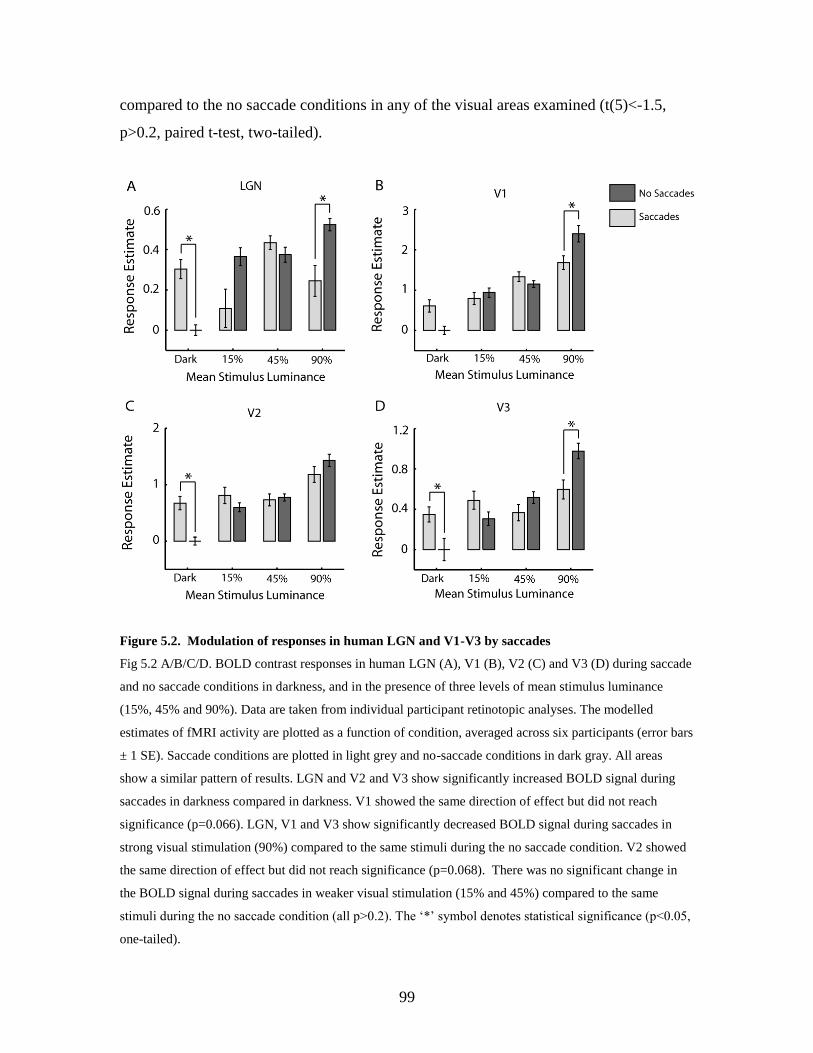
99
compared to the no saccade conditions in any of the visual areas examined (t(5)<-1.5,
p>0.2, paired t-test, two-tailed).
Figure 5.2. Modulation of responses in human LGN and V1-V3 by saccades
Fig 5.2 A/B/C/D. BOLD contrast responses in human LGN (A), V1 (B), V2 (C) and V3 (D) during saccade
and no saccade conditions in darkness, and in the presence of three levels of mean stimulus luminance
(15%, 45% and 90%). Data are taken from individual participant retinotopic analyses. The modelled
estimates of fMRI activity are plotted as a function of condition, averaged across six participants (error bars
± 1 SE). Saccade conditions are plotted in light grey and no-saccade conditions in dark gray. All areas
show a similar pattern of results. LGN and V2 and V3 show significantly increased BOLD signal during
saccades in darkness compared in darkness. V1 showed the same direction of effect but did not reach
significance (p=0.066). LGN, V1 and V3 show significantly decreased BOLD signal during saccades in
strong visual stimulation (90%) compared to the same stimuli during the no saccade condition. V2 showed
the same direction of effect but did not reach significance (p=0.068). There was no significant change in
the BOLD signal during saccades in weaker visual stimulation (15% and 45%) compared to the same
stimuli during the no saccade condition (all p>0.2). The „*‟ symbol denotes statistical significance (p<0.05,
one-tailed).
100
Formal quantification of a saccadic modulation index for each visual area revealed no
significant difference between visual areas in the degree of enhancement of activity
during saccades in darkness (Figure 5.3A). However, the degree of suppression of
activity during visual stimulation was significantly greater in LGN than in V1 (t(5)= 3.17,
p=0.02) and V2 (t(5)= 2.97, p=0.03) (Figure 5.3B).
Figure 5.3 Saccadic Modulation Indices for LGN, V1-V3 in darkness and strong visual stimulation.
Fig. 5.3A/B Saccadic effects were quantified and normalised to give an index of saccadic modulation of
responses in the presence and absence of visual stimulation in LGN, V1, V2 and V3. Index values were
computed for each participant based on the mean responses obtained in the saccade and no saccade
conditions in darkness and during strong visual stimulation. Averaged index values are presented for six
participants (error bars ± 1 SE). Positive values represent suppression of responses during saccadic eye
movements. Negative values represent enhancement of responses during saccadic eye movements. The
degree of modulation is represented by the magnitude of the modulation index. There were no significant
differences in the degree on saccadic enhancement seen in darkness (Fig. 5.3A). Suppression effects were
significantly greater for LGN than V1 and V2 but there were no other significant differences between areas
Fig. 5.3B). The „*‟ symbol denotes statistical significance (p<0.05, two-tailed).
101
5.4 Discussion
Using a comparable paradigm in a different group of participants, previous findings that
saccades alter activity in human LGN, V1 and V2 were replicated (Sylvester et al., 2005).
In that earlier study, the effects of saccades on activity in V3 did not reach conventional
levels of statistical significance. However, in the present study we were able to confirm
that saccades significantly modulate activity in V3. Taken together, the present and
previous studies provide consistent evidence that in total darkness, the presence (versus
absence) of saccades is associated with increased activity in human LGN, V1, V2 and
V3. In contrast, saccades decrease activity in these areas during strong visual stimulation
(Fig. 5.2). Consistent with the previous fMRI and DCM analysis, the degree of
suppression was significantly greater in LGN compared to V1.
To investigate the mechanisms underlying these differential saccadic effects in greater
detail, the intensity of visual stimulation (by varying the mean luminance of full field
flicker) during saccade and no-saccade conditions was manipulated. Responses in early
visual cortex are strongly modulated by the mean luminance of full field achromatic
visual stimuli (Haynes et al., 2004) and consistent with this, response amplitude was
modulated by changes in the mean luminance of our flickering stimuli in retinotopic
areas V1-V3, plus LGN (Figure 5.1). The effect of saccades on these stimulus-evoked
responses varied according to stimulus luminance. At intermediate levels of visual
stimulation, the presence (versus absence) of saccades did not lead to significant
modulation of activity in LGN, V1, V2 or V3. These findings suggest that the positive
extraretinal signal seen during saccades in darkness may exert an influence during visual
stimulation (by masking the suppressive effect of saccades on visually evoked responses
at lower visual stimulus strengths), and is consistent with retinal and extraretinal signals
combining in an additive manner during saccades. These findings are less consistent with
extraretinal signals only occurring in visual areas in the absence of visual stimulation.
Before discussing how this finding relates to the neural mechanisms of saccadic
suppression, other possible explanations require discussion.

102
5.4.1 Saccadic suppression at low stimulus intensity
The loss in visual sensitivity accompanying saccades is reduced at low luminance.
Reducing stimulus luminance from 17 to 0.17 cd/m2 decreases the loss of visual
sensitivity (measured as contrast sensitivity in normal participants) during saccades by
about 50% (Diamond et al., 2000). A more recent study examining the effect of stimulus
contrast on saccadic suppression (measured by detection of a bar stimulus peri-
saccadically) found that decreasing stimulus contrast led to decreased perception of
stimuli peri-saccadically (a greater loss of visual sensitivity) (Michels and Lappe, 2004).
Thus it seems that visual stimuli with low luminance or contrast are seen less easily
during saccades than when the eyes are still.
In the current study the 15% and 45% visual stimuli were of reduced mean luminance
compared to the 90% stimulus. Psychophysical evidence suggests that visual sensitivity
for low luminance stimuli is reduced during saccades, but this reduction is less than that
seen at higher stimulus luminance. If the decrease in visually evoked responses during
saccades (versus no saccades) represents a neural signature of saccadic suppression (an
assumption, given that perceptual suppression during saccades was not measured), then
decreasing the luminance of visual stimulation would lead to a lesser degree of
suppression of visual responses. However, no consistent effect of saccades on retinotopic
visual areas at low levels of visual stimulus luminance was found (even at non-significant
levels, Figure 5.2). This suggests that a reduced sensitivity in detecting (weaker) saccadic
suppression at low visual stimulation strengths is not a likely explanation for the results.
5.4.2 The relationship between extraretinal signals and saccadic suppression
This study, together with the data presented in Chapter 3, provides consistent evidence
that saccades alter activity in early human retinotopic visual areas. In the present study,
whether saccades modulated signals evoked by changes in mean luminance of achromatic
full-field flicker was specifically examined. In future research it would be interesting to
examine whether similar effects of saccades can also be observed on BOLD signals in
103
retinotopic cortex evoked by different types of stimulus-driven manipulation (e.g.
contrast or color; see Kleiser et al 2004).
The precise source of these saccadic modulatory influences and exactly how they lead to
suppression of visual perception remains poorly understood. Saccadic effects on visual
processing could logically derive from two extraretinal sources; efferent motor
commands (corollary discharge from oculomotor control areas) or afferent signals
(produced by ocular muscle proprioceptors as the eyes move). There is now considerable
evidence that ocular muscle proprioceptors are functionally significant (see Weir et al.,
2000) for review). However, proprioceptive feedback cannot account for the loss of
visual sensitivity that occurs prior to saccade initiation (Diamond et al., 2000) and any
influence of proprioception during saccades is likely to be small compared to corollary
discharge (Bridgeman and Stark, 1991). The precise anatomical pathway through which
corollary discharge from oculomotor structures might influence early visual cortical areas
is not addressed by the present study. In monkey, stimulation of the frontal eye fields
(FEF) can alter activity in retinotopic area V4 thus providing evidence for a causally
efficacious connection between the two (Moore and Armstrong, 2003b). Similarly, there
is evidence that transcranial magnetic stimulation of human FEF can modulate VEPs
(Taylor et al., 2006) and BOLD signals in early retinotopic cortex including V1 (Ruff et
al 2006). Although the DCM analysis presented in Chapter 4 is consistent with a role for
FEF in corollary discharge, it remains an intriguing question for future research to
understand the anatomical pathways underlying any such causal relationship between
oculomotor activity and visual signals.
These results are consistent with early retinotopic visual areas containing both
information relating to efferent oculomotor commands and compensatory mechanisms to
null the visual consequences of eye movements. This raises the issue of whether saccadic
suppression arises through the modulatory influence of corollary discharge on the
responsiveness of early visual areas. Intriguingly, a model of saccadic suppression based
on psychophysical data proposes exactly this (Diamond et al., 2000). The model takes the
contrast change resulting from the presentation of a test stimulus and the image motion of
104
that stimulus during a saccade and combines it with a corollary discharge signal. The
addition of corollary discharge (present only during saccades) acts to transiently reduce
the sensitivity of the visual system to the test stimulus, effectively reducing the contrast
response function of observers during saccades.
Corollary discharge may also play a role in other changes in visual perception around the
time of oculomotor activity. Peri-saccadic spatial compression, in which targets flashed
around the time of saccades are seen as displaced in external space towards the saccade
target (Ross et al., 1997), has a similar time course (Diamond et al., 2000) and contrast
dependency (Michels and Lappe, 2004) as saccadic suppression, suggesting common
underlying neural mechanisms. Recently, it has been shown that blinking in total
darkness also leads to increased activity in early retinotopic areas (Bristow et al., 2005).
This may suggest that motor signals relating to other self-induced disruptions to visual
continuity are also expressed in early retinotopic visual cortex. Indeed, the notion of
shared mechanisms for the visual effects of blinks and saccades is consistent with the
known effects of blinks on the kinematics of saccadic oculomotor programming
(Rambold et al., 2004).
5.5 Conclusion
Taken together, these results suggest that the motor component of saccades alone can
lead to increased activity in retinotopic visual areas. This can be measured directly in
darkness using fMRI, but only inferred during visual stimulation (by the absence of
suppression of visual activity at low levels of visual stimulation). The source of this
extraretinal signal is not clear, nor whether it is involved in suppression of visually
evoked responses seen during strong visual stimulation and whether different oculomotor
behaviors (such as blinks and saccades) lead to specific neural signatures in early visual
areas. However, oculomotor signals in visual brain areas have the potential to explain
many of the interesting perceptual phenomena that occur around the time of eye
movements.
105
CHAPTER 6: THE EFFECT OF GAZE DIRECTION ON EARLY VISUAL
PROCESSING
6.1 Introduction
So far this thesis has been concerned with the effects that saccadic eye movements have
on activity in human early visual areas (Chapter 3,4,5). I have presented evidence
demonstrating that saccades strongly modulate responses in the LGN and early cortical
visual areas. In many respects this finding is not surprising, given that during saccades
the pattern of light that falls on the retina profoundly changes without any disruption to
the continuity of our conscious visual experience. Indeed, it seems likely that modulation
of early visual activity has a crucial role in maintaining perceptual continuity during
saccades (an assertion supported by the demonstration of similar modulation of visual
activity during eyeblinks - another visually disruptive oculomotor behaviour, see Bristow
et al., 2005). However, whether other oculomotor behaviors modulate early visual
processing also needs to be considered. This chapter will examine the effect of altering
the location of the eyes in relation to the head (static eye position) on human early visual
cortex responses.
When an identical visual stimulus is foveated from two different gaze positions, the
pattern of light that falls on the retina is closely matched in both conditions. Therefore,
altering gaze direction leads to minimal disruption of perceptual continuity. Thus one
might expect that altering gaze direction, while foveating identical visual stimuli, would
not lead to modulation of activity in early visual areas. However, oculomotor influences
on visual processing may have roles in addition to minimizing disruptions to visual
continuity. For instance, successful visually guided action requires that visual signals
encoded in retinal co-ordinates be combined with information about the position of the
eyes in the head. The neural hallmark of such a sensorimotor transformation is
modulation of visually evoked activity by static eye position. If early visual areas are
involved in this transformation, one could expect their visually evoked activity to be
modulated by changes in static eye position.
106
Traditional accounts have emphasised a critical role for parietal cortex in the
transformation from retinal to head centred co-ordinates (Andersen et al., 1985;Baker et
al., 1999;Brotchie et al., 1995;DeSouza et al., 2000). Single cell recordings in monkey
show that parietal neurons jointly encode direction of gaze and the position of visual
stimulation on the retina (Andersen and Mountcastle, 1983;Brotchie et al., 1995).
However, visual responses of neurons in many earlier visual areas, including primary
visual cortex, also show modulation by gaze direction (Rosenbluth and Allman,
2002;Trotter and Celebrini, 1999;Weyand and Malpeli, 1993). These findings suggest
that this sensorimotor transformation may occur in early visual areas in addition to
parietal cortex. In humans, the sites where direction of gaze interacts with visual
processing are not well defined. There is strong evidence that parietal cortical responses
are influenced by eye position. For example, parietal BOLD responses to finger
movements (Baker et al., 1999) and memory guided reaching (DeSouza et al., 2000) are
modulated by gaze direction. However, there is no evidence that gaze direction directly
modulates visual responses in the parietal cortex as is the case in non-human primates.
The role of earlier sites in the human visual stream is also poorly understood. Human V4
and V5/MT show gaze modulation of baseline BOLD responses but not visually evoked
responses (DeSouza et al., 2002). In addition, gaze direction modulates short latency
visual evoked potentials (Andersson et al., 2004) and the strength of the perceptual tilt
aftereffect (Nishida et al., 2003) which are both thought to arise from activity in early
retinotopic cortex. Furthermore, occipital BOLD responses are greater in the hemisphere
that is contralateral to direction of lateral gaze (Deutschlander et al., 2005), although
whether this solely reflects gaze modulation of visually evoked responses is unclear (this
study used a single small LED as a visual stimulus but found that gaze led to spatially
extensive activity changes throughout the occipital lobe). In summary, responses in many
monkey visual areas are modulated by eye position and there is some evidence for similar
influences in humans. However, there has been no direct examination of whether
direction of gaze modulates visual responses in early retinotopic cortex in humans.
In order to directly examine the effects of direction of gaze on human early visual cortex,
I measured visual responses while subjects passively viewed closely matched visual
107
stimuli and manipulated the direction of horizontal gaze (to the left or right of the
subjects‟ midline). The effect of gaze on activity in retinotopic early visual cortex (V1-3
– identified in each subject using standard retinotopic mapping techniques) was then
analysed. If gaze direction modulated visually evoked responses in early visual cortex, I
hypothesised that there would be a difference in retinotopic cortical activity evoked from
viewing identical visual stimuli under different directions of gaze.
6.2 Methods
6.2.1 Experimental Paradigm
Six healthy subjects (4 male, mean age 28.4 years) gave written informed consent to
participate in the study, which was approved by the local ethics committee. Subjects lay
supine in the scanner and viewed visual stimuli that were projected from an LCD
projector (NEC LT158, refresh rate 60 Hz) onto a screen viewed via a mirror positioned
within the MR head coil. Stimuli were presented using MATLAB (Mathworks Inc.) and
COGENT 2000 (www.vislab.ucl.ac.uk/Cogent/index.html). In addition to a small central
fixation spot, the visual stimuli comprised a ring shaped annulus with a radius between 3°
and 5, made up of alternating black/white checks reversing contrast at 8Hz (see Fig 6.1).
Complete darkness was achieved in the scanning environment by manually masking the
fMRI projection screen, head coil and internal bore with matt black card. This eliminated
discernable non-retinotopic luminance cues, ensuring that the only source of visual
stimulation during experimental runs was the experimental stimulus.
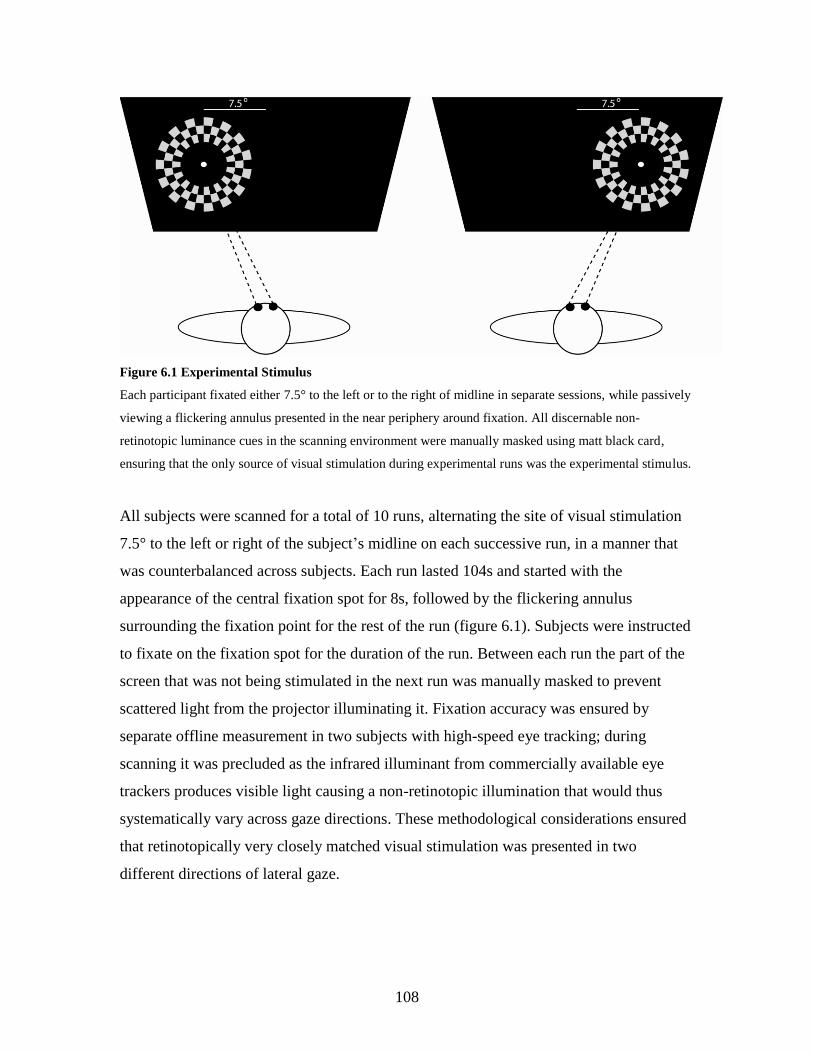
108
Figure 6.1 Experimental Stimulus
Each participant fixated either 7.5° to the left or to the right of midline in separate sessions, while passively
viewing a flickering annulus presented in the near periphery around fixation. All discernable non-
retinotopic luminance cues in the scanning environment were manually masked using matt black card,
ensuring that the only source of visual stimulation during experimental runs was the experimental stimulus.
All subjects were scanned for a total of 10 runs, alternating the site of visual stimulation
7.5° to the left or right of the subject‟s midline on each successive run, in a manner that
was counterbalanced across subjects. Each run lasted 104s and started with the
appearance of the central fixation spot for 8s, followed by the flickering annulus
surrounding the fixation point for the rest of the run (figure 6.1). Subjects were instructed
to fixate on the fixation spot for the duration of the run. Between each run the part of the
screen that was not being stimulated in the next run was manually masked to prevent
scattered light from the projector illuminating it. Fixation accuracy was ensured by
separate offline measurement in two subjects with high-speed eye tracking; during
scanning it was precluded as the infrared illuminant from commercially available eye
trackers produces visible light causing a non-retinotopic illumination that would thus
systematically vary across gaze directions. These methodological considerations ensured
that retinotopically very closely matched visual stimulation was presented in two
different directions of lateral gaze.
109
6.2.2 Imaging Parameters
A 3T Siemens Allegra system acquired T2*-weighted Blood Oygenation Level
Dependent (BOLD) contrast image volumes using a descending sequence every 1.3s.
Each volume comprised 30 3-mm-thick slices, positioned on a per subject basis to give
coverage of the occipital lobe with an in-plane resolution of 3x3 mm. To maximize signal
to noise in early visual cortex an occipital head coil was used. In total, 10 scanning runs
of 80 image volumes were acquired per subject.
6.2.3 Visual Area Localisation
To identify the boundaries of primary visual cortex (V1) and extra-striate retinotopic
cortical areas V2 and V3, standard retinotopic mapping procedures were used (Sereno et
al., 1995). Checkerboard patterns covering either the horizontal or vertical meridian were
alternated with rest periods for 16 epochs of 26s over two scanning runs each lasting 165
volumes. Mask volumes for each region of interest (left and right V1, V2d, V2v, V3d,
V3v) were obtained by delineating the borders between visual areas using activation
patterns from the meridian localisers. Standard definitions of V1 were followed together
with segmentation and cortical flattening in MrGray (Teo et al., 1997;Wandell et al.,
2000).
6.2.4 Imaging data analysis
Data were preprocessed using Statistical Parametric Mapping software (SPM2,
www.fil.ion.ucl.ac.uk/spm). After discarding the first five image volumes from each run
to allow for T1 equilibration effects, functional image volumes were realigned to the first
of the remaining volumes and co-registered to the individual participants‟ structural
scans. Data were not spatially smoothed.
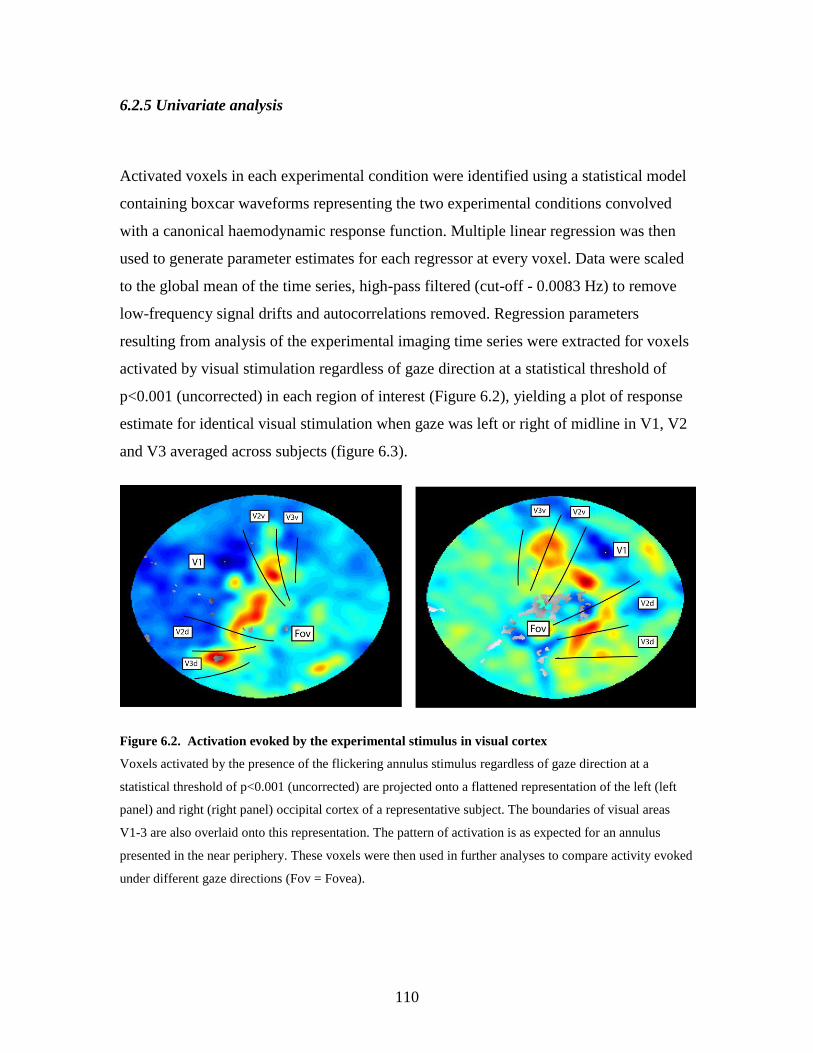
110
6.2.5 Univariate analysis
Activated voxels in each experimental condition were identified using a statistical model
containing boxcar waveforms representing the two experimental conditions convolved
with a canonical haemodynamic response function. Multiple linear regression was then
used to generate parameter estimates for each regressor at every voxel. Data were scaled
to the global mean of the time series, high-pass filtered (cut-off - 0.0083 Hz) to remove
low-frequency signal drifts and autocorrelations removed. Regression parameters
resulting from analysis of the experimental imaging time series were extracted for voxels
activated by visual stimulation regardless of gaze direction at a statistical threshold of
p<0.001 (uncorrected) in each region of interest (Figure 6.2), yielding a plot of response
estimate for identical visual stimulation when gaze was left or right of midline in V1, V2
and V3 averaged across subjects (figure 6.3).
Figure 6.2. Activation evoked by the experimental stimulus in visual cortex
Voxels activated by the presence of the flickering annulus stimulus regardless of gaze direction at a
statistical threshold of p<0.001 (uncorrected) are projected onto a flattened representation of the left (left
panel) and right (right panel) occipital cortex of a representative subject. The boundaries of visual areas
V1-3 are also overlaid onto this representation. The pattern of activation is as expected for an annulus
presented in the near periphery. These voxels were then used in further analyses to compare activity evoked
under different gaze directions (Fov = Fovea).
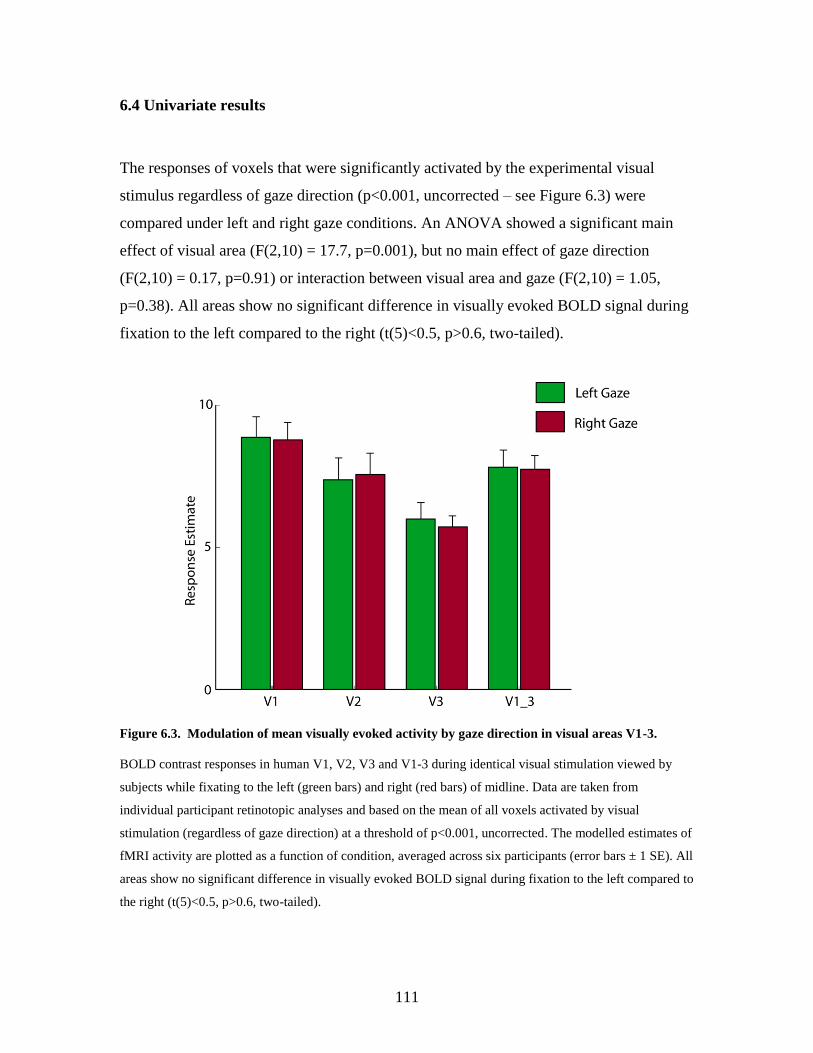
111
6.4 Univariate results
The responses of voxels that were significantly activated by the experimental visual
stimulus regardless of gaze direction (p<0.001, uncorrected – see Figure 6.3) were
compared under left and right gaze conditions. An ANOVA showed a significant main
effect of visual area (F(2,10) = 17.7, p=0.001), but no main effect of gaze direction
(F(2,10) = 0.17, p=0.91) or interaction between visual area and gaze (F(2,10) = 1.05,
p=0.38). All areas show no significant difference in visually evoked BOLD signal during
fixation to the left compared to the right (t(5)<0.5, p>0.6, two-tailed).
Figure 6.3. Modulation of mean visually evoked activity by gaze direction in visual areas V1-3.
BOLD contrast responses in human V1, V2, V3 and V1-3 during identical visual stimulation viewed by
subjects while fixating to the left (green bars) and right (red bars) of midline. Data are taken from
individual participant retinotopic analyses and based on the mean of all voxels activated by visual
stimulation (regardless of gaze direction) at a threshold of p<0.001, uncorrected. The modelled estimates of
fMRI activity are plotted as a function of condition, averaged across six participants (error bars ± 1 SE). All
areas show no significant difference in visually evoked BOLD signal during fixation to the left compared to
the right (t(5)<0.5, p>0.6, two-tailed).
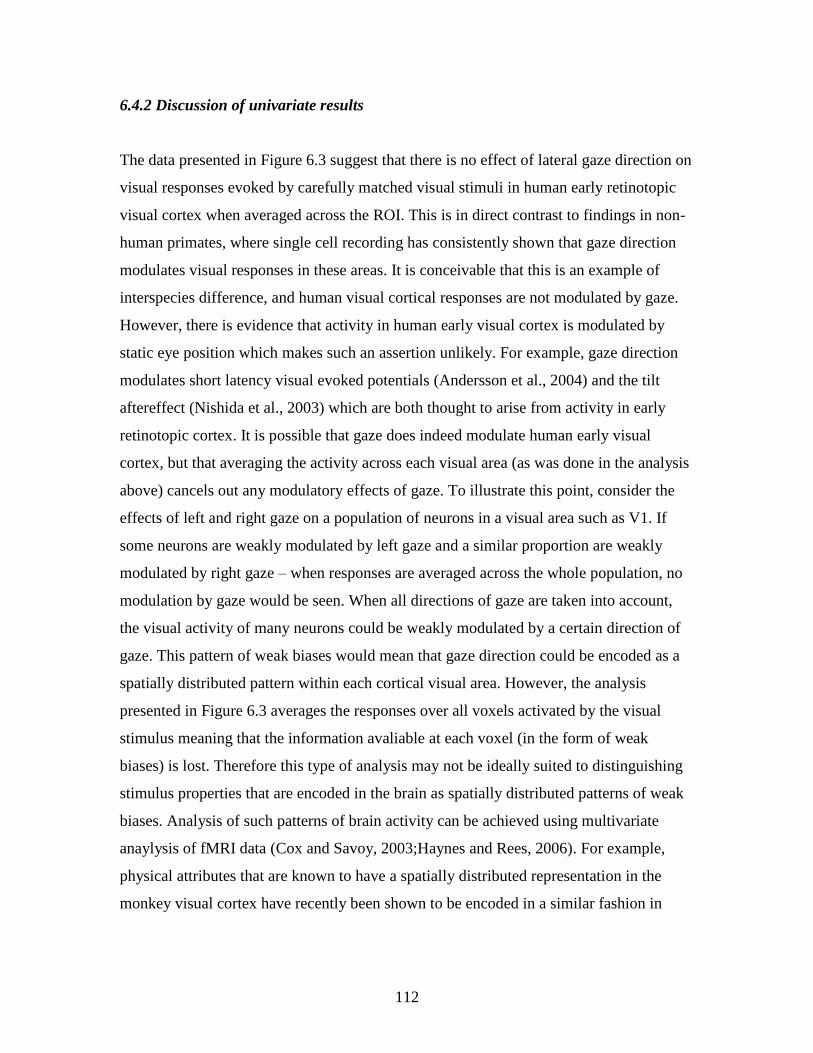
112
6.4.2 Discussion of univariate results
The data presented in Figure 6.3 suggest that there is no effect of lateral gaze direction on
visual responses evoked by carefully matched visual stimuli in human early retinotopic
visual cortex when averaged across the ROI. This is in direct contrast to findings in non-
human primates, where single cell recording has consistently shown that gaze direction
modulates visual responses in these areas. It is conceivable that this is an example of
interspecies difference, and human visual cortical responses are not modulated by gaze.
However, there is evidence that activity in human early visual cortex is modulated by
static eye position which makes such an assertion unlikely. For example, gaze direction
modulates short latency visual evoked potentials (Andersson et al., 2004) and the tilt
aftereffect (Nishida et al., 2003) which are both thought to arise from activity in early
retinotopic cortex. It is possible that gaze does indeed modulate human early visual
cortex, but that averaging the activity across each visual area (as was done in the analysis
above) cancels out any modulatory effects of gaze. To illustrate this point, consider the
effects of left and right gaze on a population of neurons in a visual area such as V1. If
some neurons are weakly modulated by left gaze and a similar proportion are weakly
modulated by right gaze – when responses are averaged across the whole population, no
modulation by gaze would be seen. When all directions of gaze are taken into account,
the visual activity of many neurons could be weakly modulated by a certain direction of
gaze. This pattern of weak biases would mean that gaze direction could be encoded as a
spatially distributed pattern within each cortical visual area. However, the analysis
presented in Figure 6.3 averages the responses over all voxels activated by the visual
stimulus meaning that the information avaliable at each voxel (in the form of weak
biases) is lost. Therefore this type of analysis may not be ideally suited to distinguishing
stimulus properties that are encoded in the brain as spatially distributed patterns of weak
biases. Analysis of such patterns of brain activity can be achieved using multivariate
anaylysis of fMRI data (Cox and Savoy, 2003;Haynes and Rees, 2006). For example,
physical attributes that are known to have a spatially distributed representation in the
monkey visual cortex have recently been shown to be encoded in a similar fashion in
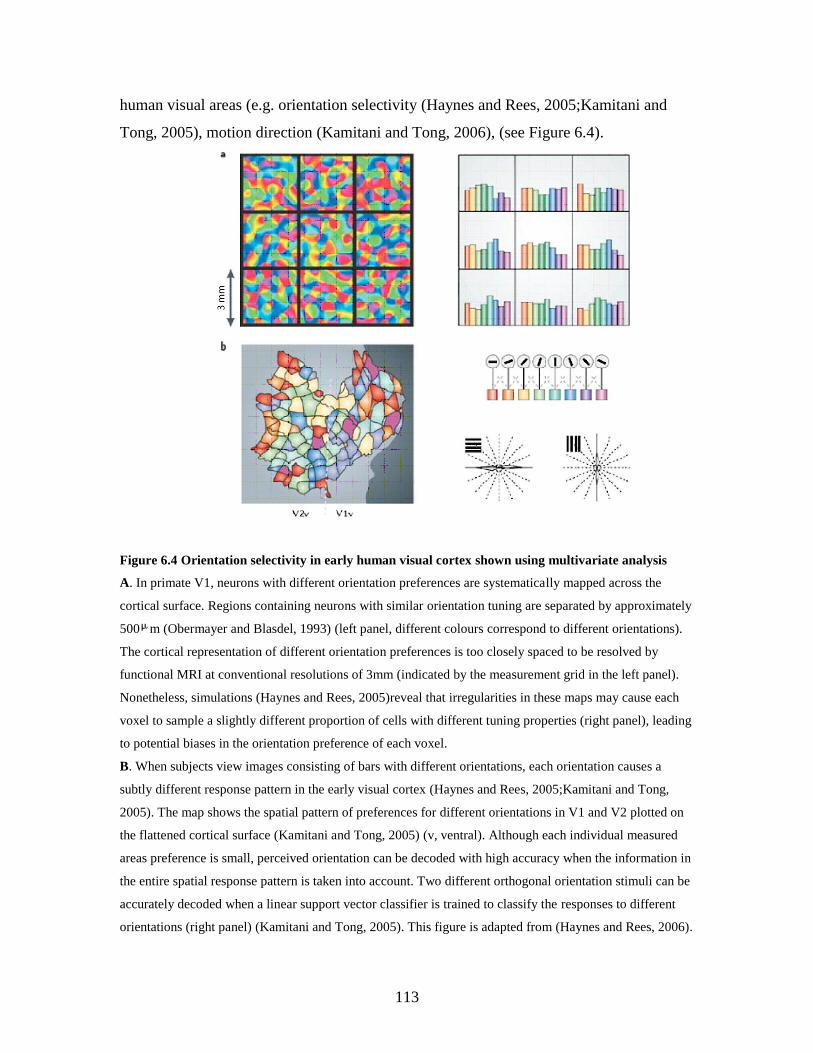
113
human visual areas (e.g. orientation selectivity (Haynes and Rees, 2005;Kamitani and
Tong, 2005), motion direction (Kamitani and Tong, 2006), (see Figure 6.4).
Figure 6.4 Orientation selectivity in early human visual cortex shown using multivariate analysis
A. In primate V1, neurons with different orientation preferences are systematically mapped across the
cortical surface. Regions containing neurons with similar orientation tuning are separated by approximately
500 m (Obermayer and Blasdel, 1993) (left panel, different colours correspond to different orientations).
The cortical representation of different orientation preferences is too closely spaced to be resolved by
functional MRI at conventional resolutions of 3mm (indicated by the measurement grid in the left panel).
Nonetheless, simulations (Haynes and Rees, 2005)reveal that irregularities in these maps may cause each
voxel to sample a slightly different proportion of cells with different tuning properties (right panel), leading
to potential biases in the orientation preference of each voxel.
B. When subjects view images consisting of bars with different orientations, each orientation causes a
subtly different response pattern in the early visual cortex (Haynes and Rees, 2005;Kamitani and Tong,
2005). The map shows the spatial pattern of preferences for different orientations in V1 and V2 plotted on
the flattened cortical surface (Kamitani and Tong, 2005) (v, ventral). Although each individual measured
areas preference is small, perceived orientation can be decoded with high accuracy when the information in
the entire spatial response pattern is taken into account. Two different orthogonal orientation stimuli can be
accurately decoded when a linear support vector classifier is trained to classify the responses to different
orientations (right panel) (Kamitani and Tong, 2005). This figure is adapted from (Haynes and Rees, 2006).
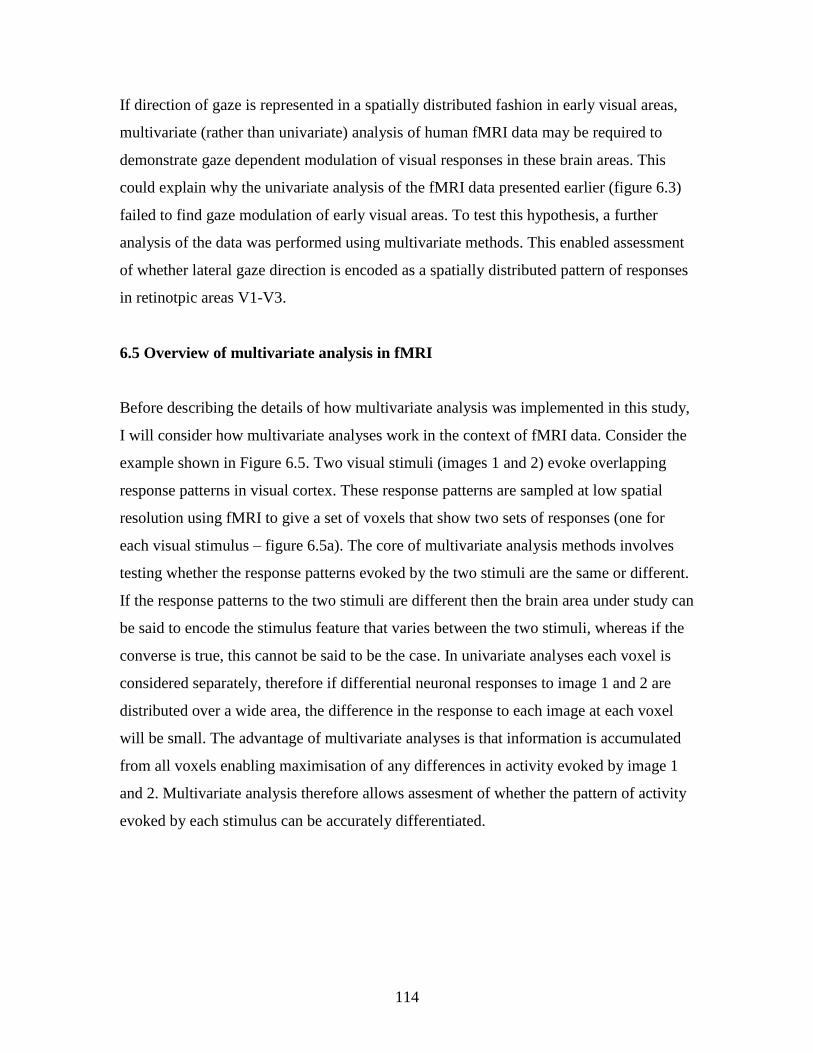
114
If direction of gaze is represented in a spatially distributed fashion in early visual areas,
multivariate (rather than univariate) analysis of human fMRI data may be required to
demonstrate gaze dependent modulation of visual responses in these brain areas. This
could explain why the univariate analysis of the fMRI data presented earlier (figure 6.3)
failed to find gaze modulation of early visual areas. To test this hypothesis, a further
analysis of the data was performed using multivariate methods. This enabled assessment
of whether lateral gaze direction is encoded as a spatially distributed pattern of responses
in retinotpic areas V1-V3.
6.5 Overview of multivariate analysis in fMRI
Before describing the details of how multivariate analysis was implemented in this study,
I will consider how multivariate analyses work in the context of fMRI data. Consider the
example shown in Figure 6.5. Two visual stimuli (images 1 and 2) evoke overlapping
response patterns in visual cortex. These response patterns are sampled at low spatial
resolution using fMRI to give a set of voxels that show two sets of responses (one for
each visual stimulus – figure 6.5a). The core of multivariate analysis methods involves
testing whether the response patterns evoked by the two stimuli are the same or different.
If the response patterns to the two stimuli are different then the brain area under study can
be said to encode the stimulus feature that varies between the two stimuli, whereas if the
converse is true, this cannot be said to be the case. In univariate analyses each voxel is
considered separately, therefore if differential neuronal responses to image 1 and 2 are
distributed over a wide area, the difference in the response to each image at each voxel
will be small. The advantage of multivariate analyses is that information is accumulated
from all voxels enabling maximisation of any differences in activity evoked by image 1
and 2. Multivariate analysis therefore allows assesment of whether the pattern of activity
evoked by each stimulus can be accurately differentiated.

115
Figure 6.5 Analysis of spatial patterns using a multivariate pattern recognition approach.
A. FMRI measures brain activity repeatedly every few seconds in a large number of voxels (left). The joint
activity in a subset (N) of these voxels (shown here as a 3x3 grid) constitutes a spatial pattern that can be
expressed as a pattern vector (right). Different pattern vectors reflect different mental states; for example,
those associated with different images viewed by the subject.
B-D. Each pattern vector can be interpreted as a point in an N-dimensional space (shown here in panels b–d
for only the first two dimensions, red and blue indicate the two conditions). Each measurement of brain
activity corresponds to a single point. A successful classifier will learn to distinguish between pattern
vectors measured under different mental states. In panel b, the classifier can operate on single voxels
because the response distributions (red and blue Gaussians) are separable within individual voxels. In panel
c, the two categories cannot be separated in individual voxels because the distributions are largely
overlapping. However, the response distributions can be separated by taking into account the combination
of responses in both voxels. A linear decision boundary can be used to separate these two-dimensional
response distributions. In panel d, to test the predictive power of a classifier, data are separated into training
and test data sets. Training data (red and blue symbols) are used to train a classifier, which is then applied
to a new and independent test data set. The proportion of these independent data that are classified either
correctly (open circle, 'correct') or incorrectly (filled circle, 'error') gives a measure of classification
performance. This figure is adapted from (Haynes and Rees, 2006).

116
Practically this is achieved by training a pattern classification algorithm with the pattern
of activity evoked by each image type. The classifier then attempts to blindly classify
subsequently acquired test measurements to the category that evoked the most similar
response pattern during the training phase (figure 6.5c). Accuracy is assessed by the
comparing the classifier output with known labels (figure 6.5d). There are many methods
that can be used to define the similarity between such distributed response patterns but
machine learning methods such as linear discriminant analyses or support vector
machines are effective and simple to implement. The steps required in this type of
multivariate analysis are schematically represented in figure 6.6.
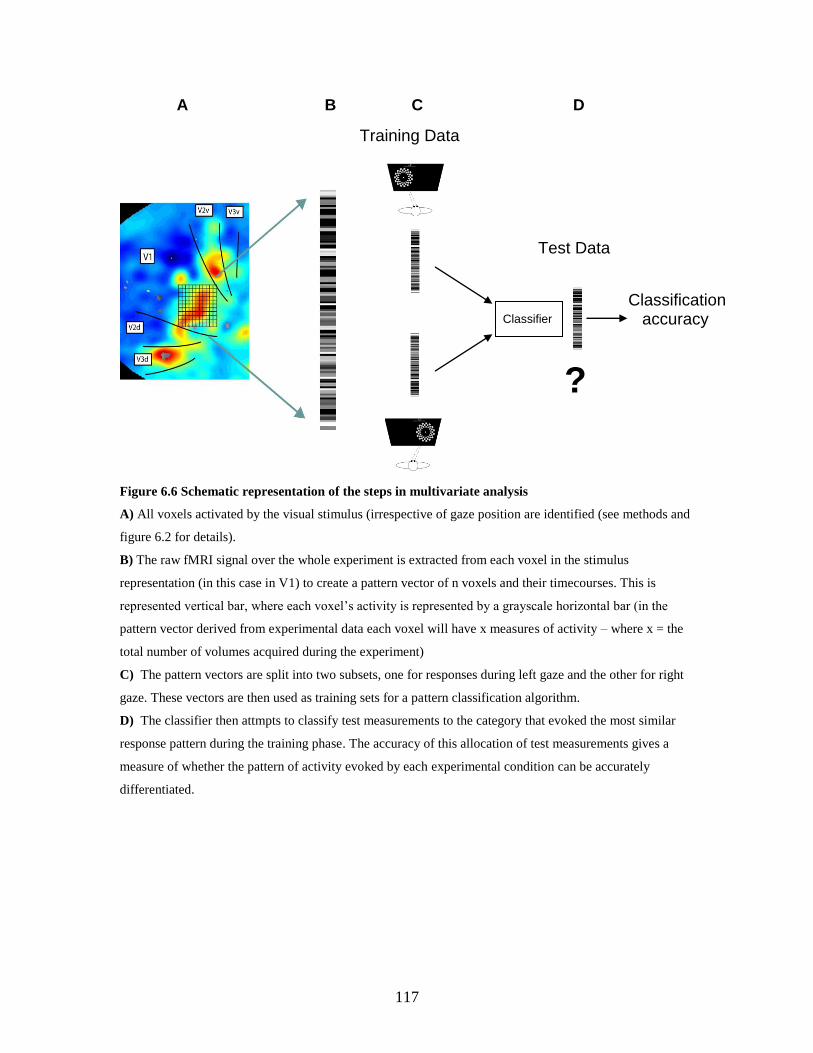
117
A B C D
Figure 6.6 Schematic representation of the steps in multivariate analysis
A) All voxels activated by the visual stimulus (irrespective of gaze position are identified (see methods and
figure 6.2 for details).
B) The raw fMRI signal over the whole experiment is extracted from each voxel in the stimulus
representation (in this case in V1) to create a pattern vector of n voxels and their timecourses. This is
represented vertical bar, where each voxel‟s activity is represented by a grayscale horizontal bar (in the
pattern vector derived from experimental data each voxel will have x measures of activity – where x = the
total number of volumes acquired during the experiment)
C) The pattern vectors are split into two subsets, one for responses during left gaze and the other for right
gaze. These vectors are then used as training sets for a pattern classification algorithm.
D) The classifier then attmpts to classify test measurements to the category that evoked the most similar
response pattern during the training phase. The accuracy of this allocation of test measurements gives a
measure of whether the pattern of activity evoked by each experimental condition can be accurately
differentiated.
Training Data
Classifier
Test Data
?
Classification accuracy
118
6.6 Multivariate pattern classification methods
The BOLD signal across each visual stimulation block of each condition (see main
methods) was extracted for n voxels within each ROI – V1, V2 and V3 (same voxels as
used for univariate analyses – see Figure 6.2), forming a set of pattern vectors a, which
can be considered as points in an n-dimensional Euclidean space. Pattern classification
was performed using linear support vector machines (SVM) (Christianini, 2000) in the
Gunn implementation (http://www.isis.ecs.soton.ac.uk/). A linear classifier finds a
hyperplane
wTx + b = 0
defined by weight vector w and offset b separating the training points x with two
different given labels. The principle of SVM is to find the optimally separating
hyperplane that maximises the margin (given by 2/||w||) with respect to both training
classes (see (Christianini, 2000;Vapnik, 1995) for detailed algorithm). Under the
presence of noise (as here) the response vectors of both stimuli might not be linearly
separable and a so-called “soft-margin classifier” can be used which allows for a certain
proportion of misclassifications by minimising
||w||/2 + C ξi
subject to
yi(wxi + b) 1 - ξi i = 1,2,...,N ξ 0
119
where ξi is a slack variable representing misclassification error for the ith pattern xi with
label yi{1,-1} and C a regularisation parameter determining the trade-off between
largest margin and lowest number of misclassifications.
In the analysis presented here, the optimal value for C was determined using a leave-one-
out cross-validation procedure that was independent of the actual SVM classification.
The data set of N pattern vectors per condition was subdivided into a training set of N-2
pattern vectors, a validation set (1 pattern vector), and a test set (1 pattern vector), with N
possible assignments of independent training, validation, and test data sets. The optimal
value of C was first determined for each planned pairwise comparison in each subject,
i.e., the value that produced the minimum classification error. To that end, the classifier
was iteratively trained on the N possible training sets and tested on the respective
validation sets using ten exponentially increasing values for C (C = ei for i = 0, 1, …10).
Classification errors were averaged across all different training and validation data
assignments. The optimal value of C derived from the cross-validation procedure varied
widely across subjects from 148 to 8103 with a median of 2981. Therefore the optimal
value of C for each subject was used in the SVM classification.
For SVM classification, the classifier was again iteratively trained on the N training data
sets, but this time tested on the respective test data set. As the test data set in each
iteration was different from the validation data set, the classification of the test data was
independent of the validation procedure that was used to optimize C. Classification
accuracies were averaged across all different training and test data assignments (Figure
6.6). The average classification accuracies from each participant were then for each
pairwise comparison subjected to two-tailed one-sample t-tests at the group level testing
for significant deviation from chance level (50 %).
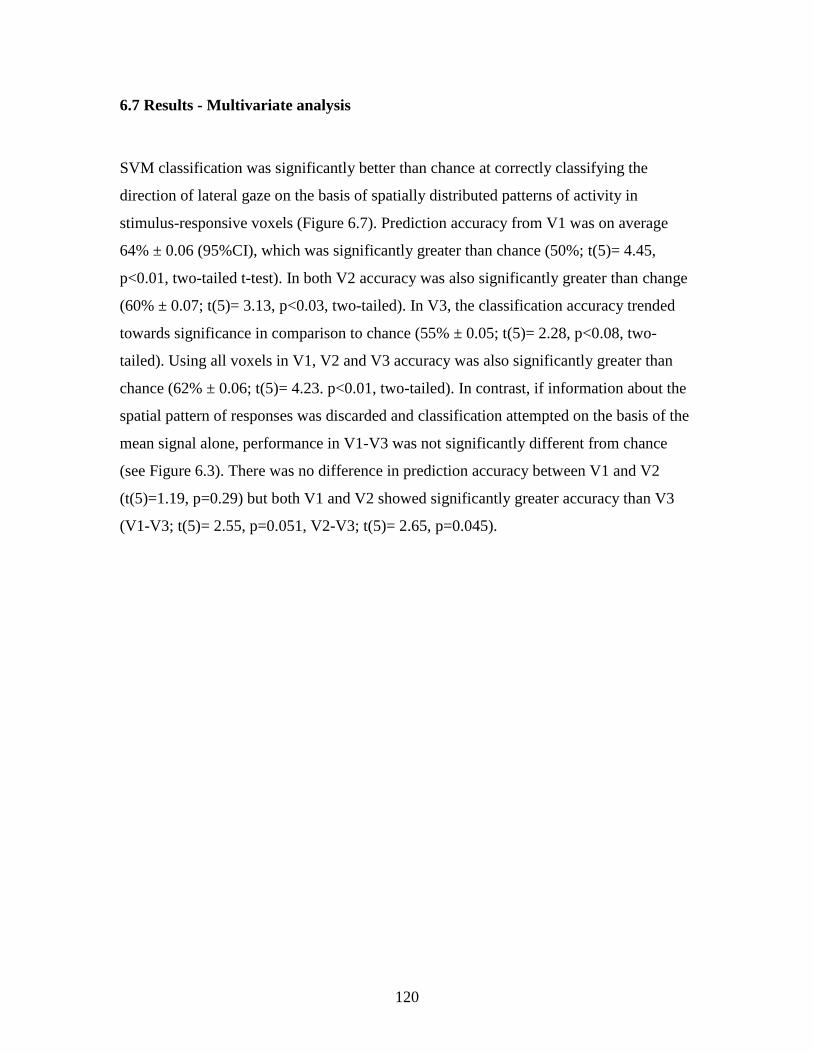
120
6.7 Results - Multivariate analysis
SVM classification was significantly better than chance at correctly classifying the
direction of lateral gaze on the basis of spatially distributed patterns of activity in
stimulus-responsive voxels (Figure 6.7). Prediction accuracy from V1 was on average
64% ± 0.06 (95%CI), which was significantly greater than chance (50%; t(5)= 4.45,
p<0.01, two-tailed t-test). In both V2 accuracy was also significantly greater than change
(60% ± 0.07; t(5)= 3.13, p<0.03, two-tailed). In V3, the classification accuracy trended
towards significance in comparison to chance (55% ± 0.05; t(5)= 2.28, p<0.08, two-
tailed). Using all voxels in V1, V2 and V3 accuracy was also significantly greater than
chance (62% ± 0.06; t(5)= 4.23. p<0.01, two-tailed). In contrast, if information about the
spatial pattern of responses was discarded and classification attempted on the basis of the
mean signal alone, performance in V1-V3 was not significantly different from chance
(see Figure 6.3). There was no difference in prediction accuracy between V1 and V2
(t(5)=1.19, p=0.29) but both V1 and V2 showed significantly greater accuracy than V3
(V1-V3; t(5)= 2.55, p=0.051, V2-V3; t(5)= 2.65, p=0.045).
121
Figure 6.7. Accuracy of prediction of gaze direction from visually active voxels in V1-3.
The performance of SVM classification of gaze direction (left or right) plotted as accuracy (% correct).
Data are taken from individual participant retinotopic analyses and based on SVM‟s using voxels activated
by visual stimulation (regardless of gaze direction) at a threshold of p<0.001, uncorrected, in each visual
area. Filled rectangles represent the accuracy averaged across six subjects (error bars = +/- 95% CI). The
open circles represent accuracy of classification for each individual subject. A prediction accuracy of 50%
represents chance performance. It is clear that the average accuracy in V1, V2, V3 and V1-3 is greater than
50%. This reached statistical significance in V1, V2 and V1-3, and trended towards significance in V3. The
„*‟ symbol represents p<0.05, two-tailed.
6.8 Discussion
6.8.1 Human visual cortex contains sufficient information to reconstruct horizontal
gaze direction
The data presented in Figure 6.7 demonstrate that the responses of retinotopically
mapped stimulus-responsive voxels in human V1-V3 contained information sufficient to
reconstruct horizontal gaze direction. This finding is consistent with gaze direction being
122
encoded in early visual areas, but there are other possible explanations that require
consideration. It is possible that successful classification of gaze direction relied on
neuronal responses to visual features other than the stimulus representation (for example,
the edge of the display - whose retinal position varied with gaze direction). However, this
is unlikely as only voxels that responded to the stimulus were used in this analysis (figure
6.2) and great care was taken to ensure that the only source of visual stimulation during
experimental runs was the experimental stimulus (through manually masking all parts of
the projection screen and scanning environment except the location at which the
experimental stimulus appeared).
Even with these measures, activity in „stimulus responsive voxels‟ could still be
influenced by remote areas of the visual field, through long range horizontal interactions
(Gilbert et al., 1996). Although the spatial extent of long range horizontal interactions in
humans is not clear, horizontal influences in monkey V1 occur over a maximal distance
of 6-8mm (in terms of cortical area), which equates to approximately 4° of the visual
field (see for example Stettler et al., 2002). However, as the edge of the screen in the
present experiment was greater than 4° away from all parts of the visual stimulus, remote
parts of the visual field are likely to exert only minimal influence on the activity of
stimulus responsive voxels.
Differences between the visual activity evoked during left and right gaze could also be
explained by systematic differences in the pattern of eye movements during the two gaze
conditions. For example, if during left gaze subjects‟ eyes drifted rightward towards the
midline and during right gaze subjects‟ eyes drifted leftward towards the midline, the
pattern of visual stimulation during left and right gaze would differ. If this were the case,
however, one would expect univariate analysis methods to show a difference between left
and right gaze. This was clearly not the case in this study (see Figure 6.3). In addition,
although eye movements were not recorded during scanning as the recording process
would necessarily confound any comparison of visual activity evoked in different gaze
positions (by providing visual stimulation that varied in retinal position according to gaze
direction), fixation accuracy was excellent when measured offline. Therefore the most
123
likely explanation for the results shown in Figure 6.7 is V1-3 contains sufficient
information to allow above chance correct classification of the direction of gaze.
6.8.2 Gaze representation is spatially distributed in visual cortex
Single cell recordings in monkey have repeatedly shown that gaze modulates visual
responses at many levels in the visual system. These areas include V1-3 (Rosenbluth and
Allman, 2002;Trotter and Celebrini, 1999;Weyand and Malpeli, 1993) in addition to later
visual and parietal regions. Although human fMRI studies have identified V5/MT
(DeSouza et al., 2000) and parietal cortex (DeSouza et al., 2000) as sites modulated by
gaze direction, these studies did not demonstrate gaze modulation of purely visual
responses. There is stronger evidence that gaze direction modulates visual responses in
earlier human visual areas. For instance both perceptual after effects (Nishida et al.,
2003), short latency evoked potentials ander (Andersson et al., 2004) which are thought
to arise from early visual cortical activity, are modulated by gaze position. The initial
univariate analysis of the current experiment showed no effects of gaze position on visual
responses in V1-3. This obviously contrasts strongly with the monkey single cell and
human psychophysical and evoked potential studies described above. The results of the
multivariate analysis partly resolve this apparent paradox, as they suggest that the
distributed spatial pattern of activity in these areas, reflecting weak biases of individual
voxels, encodes information about gaze direction (Figure 6.7). This information about
gaze direction is lost when the signal across the whole of V1-V3 is averaged in a
univariate analysis (Figure 6.6). This could explain why single cell recordings but not
univariate fMRI studies demonstrate gaze modulation in early visual areas. However, it is
not clear why evoked potentials, which reflect the activity of a larger neuronal population
than that sampled using fMRI, can be modulated by gaze position. It is conceivable that
EEG, which directly records neural activity, can identify gaze related signals not seen in
indirect measures of neural activity (such as the BOLD response).
As the BOLD contrast fMRI signal indirectly measures activity in large populations of
neurons, the source of the gaze signal cannot be precisely identified. For example, it is

124
possible that human V1 contains separate populations of neurons coding for retinotopic
location of a stimulus and gaze position; or a single population whose activity is jointly
modulated by stimulus and gaze. There is currently no evidence to suggest that gaze
effects are systematically mapped across the cortical surface (as in the case of orientation
preference, see Figure 6.5). Nevertheless, the successful reconstruction of horizontal gaze
direction from visual cortex activity using multivariate methods suggests that there are
reproducible gaze biases distributed throughout visual cortex. Further work could
examine whether these biases exhibit any spatial structure over visual cortex („gaze
mapping‟).
Given that strong gaze effects have been reported in parietal and late visual areas, it is
perhaps surprising that the ability to reconstruct gaze direction was significantly greater
in V1 and V2 compared to V3 (Figure 6.7). However, there are a number of
methodological considerations that could have contributed to this finding. First,
delineation of the outer border of V3 can be difficult using the retinotopic mapping
technique employed here. This could mean that voxels from other visual areas (that may
or may not encode gaze) could be defined as V3 and reduce classification accuracy when
used in a subsequent analyses. Second, the number of voxels significantly activated by
the experimental stimulus was often greater in V1/2 than V3. Reducing the number of
voxels entered into an SVM analysis can lead to a reduction in classification
performance. Therefore, although the difference between V1/2 and V3 may represent
differences in underlying physiology of these areas, the methodological points raised
must also be considered.
6.9 Conclusion
In conclusion, the results presented in this chapter are consistent with a distributed
representation of horizontal gaze direction being present at the earliest anatomical stages
of cortical processing (V1-3). However, it is not clear whether this representation is
functionally relevant and used to guide visiomotor behaviour. More generally, these
findings indicate that oculomotor behaviours that do not lead to disruption of visual

125
continuity still modulate visual processing. This suggests that although the visual and
oculomotor systems are spatially segregated in the brain, they show a high degree of
integration at the neural level. This is consistent with our everyday experience of the
visual world where frequent eye movements do not lead to disruption of visual
continuity. Finally these data demonstrate the ability of multivariate approaches to reveal
information in spatially localised patterns of activity that is not apparent in region-of-
interest analyses. Future work could apply this approach more generally to different
directions of gaze and head direction in order to uncover the neural substrate of
sensorimotor coordinate transformations in human vision and action.
126
CHAPTER 7: VISUAL RESPONSES IN HUMAN SUPERIOR COLLICULUS
SHOW TEMPORAL-NASAL ASYMMETRY
7.1 Introduction
The previous experiments in this thesis have demonstrated that even when visual
stimulation remains constant, oculomotor behaviours, such as saccadic eye movements
and alteration in static gaze direction, profoundly alter the pattern of activity in early
visual areas. This modulation presumably reflects tight coupling between the oculomotor
and visual systems, as under most circumstances eye movements result in altered visual
context, but it also has functional significance. For example, disruptive effects of
saccades on perceptual continuity are reduced by inhibition of visually evoked responses
in LGN and V1 (see Chapter 3 and 5). Furthermore, population encoding of visual stimuli
in gaze centred coordinates in V1, may contribute to successful visually guided action
(see Chapter 6). Rather than looking at the effect of eye movements on visual structures
when visual conditions remain constant, this chapter will examine the effect of altering
visual conditions on oculomotor structures when the eyes remain still and fixated
centrally. Specifically, it will focus on the visual responses of the superior colliculus
(SC). The SC is a key structure in the interaction between the visual and oculomotor
systems as it is intimately involved in the generation and execution of orienting eye (and
head) movements in response to visual information. The experiment outlined in this
chapter will examine whether the visual responses of the SC are consistent with biases in
visual orienting found behaviorally.
Behavioral studies have utilized eye patching to reverse which visual hemifield (left or
right) is temporal or nasal. With the right eye patched, the left hemifield becomes
temporal and the right nasal; while the reverse holds with the left eye patched. The use of
eye patching has uncovered temporal-nasal differences in several aspects of visual
behavior. For instance, newborns show pronounced advantages for orienting towards
visual stimuli in the temporal versus the nasal hemifield (Lewis and Maurer,
127
1992;Rothbart et al., 1990). While such biases are less absolute in adults, temporal
hemifield advantages are still detectable with more subtle measures such as saccadic
latencies (Kristjansson et al., 2004;Rafal et al., 1991) or choice saccades to bilateral
stimuli (Posner and Cohen., 1984). However, more recent studies showing that this bias
occurs even when S-cone stimuli, which are not thought to be processed by the SC, are
used (Bompas et al., 2008).
It has frequently been proposed (Rafal et al., 1991) that such behavioral results may
reflect a biased representation favoring the temporal hemifield in the retinotectal pathway
from retina to superior colliculus (SC), which may lead to a preference for the
contralateral hemifield of the contralateral eye in the SC (see figure 7.1). This might
account for the pronounced temporal-hemifield advantages found in infants, whose
retinotectal pathway is thought to mature prior to geniculostriate vision (Johnson, 1990).
It might also explain why these same temporal-hemifield advantages can still occur in
hemianopic adult patients (Dodds et al., 2002;Rafal et al., 1990), who retain intact
retinotectal pathways despite damage to the geniculostriate system. Although it must be
added that these results have not been replicated in a subsequent study (Walker et al.,
2000).
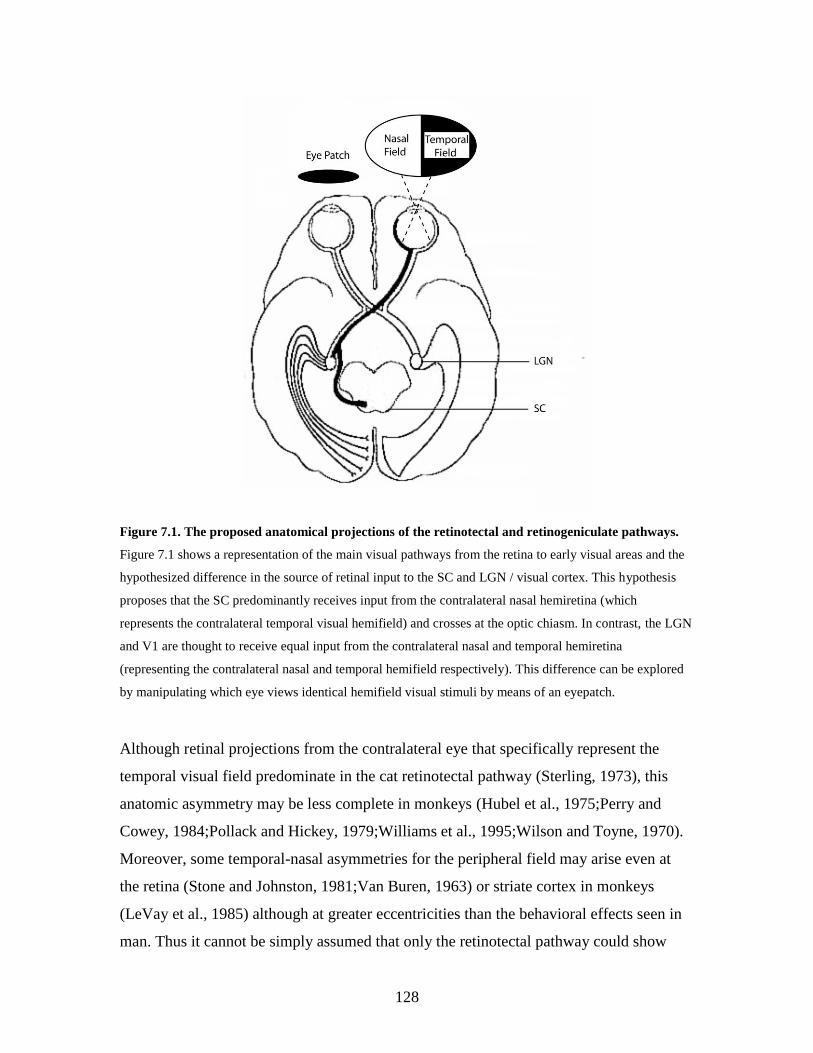
128
Figure 7.1. The proposed anatomical projections of the retinotectal and retinogeniculate pathways.
Figure 7.1 shows a representation of the main visual pathways from the retina to early visual areas and the
hypothesized difference in the source of retinal input to the SC and LGN / visual cortex. This hypothesis
proposes that the SC predominantly receives input from the contralateral nasal hemiretina (which
represents the contralateral temporal visual hemifield) and crosses at the optic chiasm. In contrast, the LGN
and V1 are thought to receive equal input from the contralateral nasal and temporal hemiretina
(representing the contralateral nasal and temporal hemifield respectively). This difference can be explored
by manipulating which eye views identical hemifield visual stimuli by means of an eyepatch.
Although retinal projections from the contralateral eye that specifically represent the
temporal visual field predominate in the cat retinotectal pathway (Sterling, 1973), this
anatomic asymmetry may be less complete in monkeys (Hubel et al., 1975;Perry and
Cowey, 1984;Pollack and Hickey, 1979;Williams et al., 1995;Wilson and Toyne, 1970).
Moreover, some temporal-nasal asymmetries for the peripheral field may arise even at
the retina (Stone and Johnston, 1981;Van Buren, 1963) or striate cortex in monkeys
(LeVay et al., 1985) although at greater eccentricities than the behavioral effects seen in
man. Thus it cannot be simply assumed that only the retinotectal pathway could show
129
temporal-nasal asymmetries in humans (just as one cannot assume that only the
retinotectal pathway mediates visual orienting, see Sumner et al., 2002). One
physiological method for examining any asymmetries in humans is to use fMRI to
compare visual responses elicited by temporal and nasal visual stimulation in the SC with
those of the lateral geniculate nucleus (LGN) and visual cortex.
Studies of macaque SC suggest that it is anatomically and functionally divided into
superficial and deep layers. Neurons in the deep layers are weakly visually responsive but
are primarily involved in orienting movements of the head and eyes in response to
sensory stimuli. In contrast, neurons in the superficial layers respond to a broad range of
stationary and moving visual stimuli apparently regardless of stimulus orientation, size,
shape, or velocity (Cynader and Berman 1972;Goldberg and Wurtz, 1972) and contain an
orderly map of the contralateral visual field (Cynader & Berman 1972). Most cells, apart
from those at the posterior pole representing the far temporal periphery (Hubel et al
1975), receive binocular input (Moors and Vendrik, 1979) and many show some tuning
for retinal disparity (Berman et al., 1975). Their main input is from the retinotectal
pathway (Schiller and Malpeli, 1977), but their response properties may also be
influenced by the geniculostriate pathway via from striate cortex (Wilson and Toyne,
1970) and extrastriate cortex (Fries, 1984). In contrast, the deep layers are primarily
influenced by corticotectal feedback projections (Schiller et al., 1974). Therefore cortical
influences on the deep SC are possibly better placed than retinal influences on superficial
SC to cause biases in orientating behaviour.
The human SC shows BOLD contrast responses to contralateral visual field stimulation,
and also some degree of retinotopy (Schneider and Kastner, 2005), If temporal-nasal
differences largely reflect retinotectal pathway contributions as previously proposed (see
above), then SC responses to monocular visual stimuli should presumably be greater for
temporal versus nasal hemifields; but those of structures in the geniculostriate pathway
should not. Accordingly, visual responses of the SC, LGN and retinotopic V1-V3 were
measured using fMRI, while independently manipulating two factors; which eye viewed
the stimuli, and which visual field was stimulated. Since reversing the stimulated eye
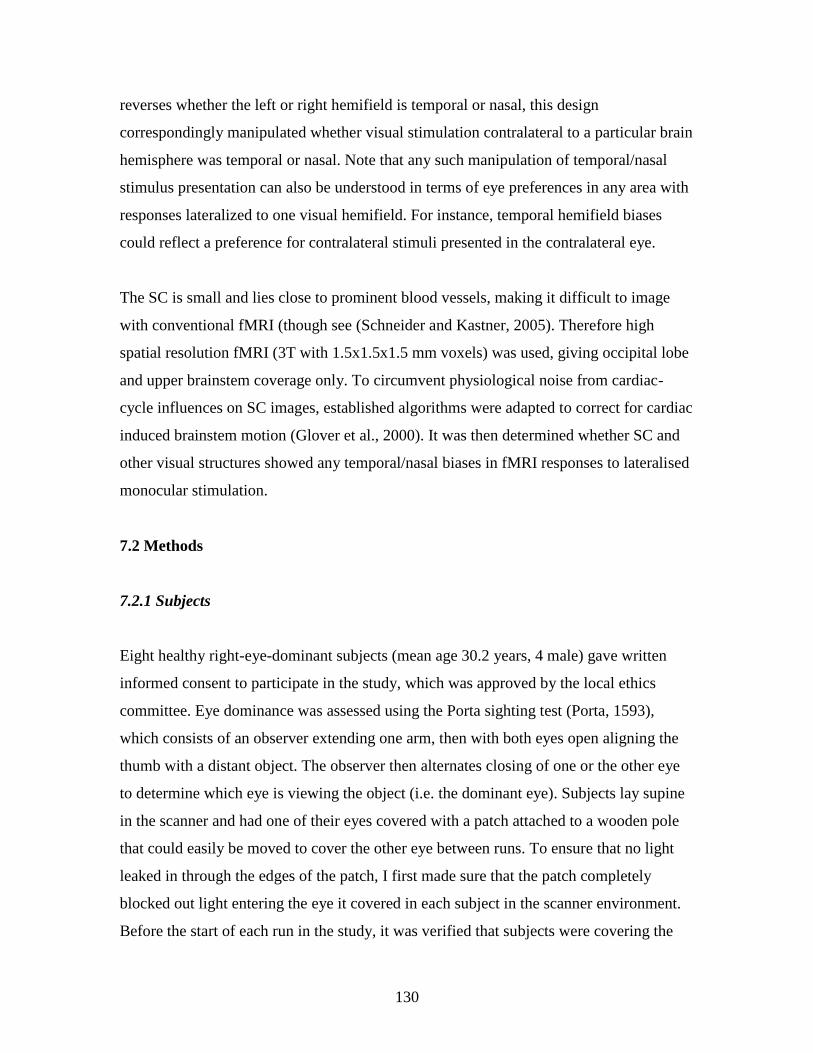
130
reverses whether the left or right hemifield is temporal or nasal, this design
correspondingly manipulated whether visual stimulation contralateral to a particular brain
hemisphere was temporal or nasal. Note that any such manipulation of temporal/nasal
stimulus presentation can also be understood in terms of eye preferences in any area with
responses lateralized to one visual hemifield. For instance, temporal hemifield biases
could reflect a preference for contralateral stimuli presented in the contralateral eye.
The SC is small and lies close to prominent blood vessels, making it difficult to image
with conventional fMRI (though see (Schneider and Kastner, 2005). Therefore high
spatial resolution fMRI (3T with 1.5x1.5x1.5 mm voxels) was used, giving occipital lobe
and upper brainstem coverage only. To circumvent physiological noise from cardiac-
cycle influences on SC images, established algorithms were adapted to correct for cardiac
induced brainstem motion (Glover et al., 2000). It was then determined whether SC and
other visual structures showed any temporal/nasal biases in fMRI responses to lateralised
monocular stimulation.
7.2 Methods
7.2.1 Subjects
Eight healthy right-eye-dominant subjects (mean age 30.2 years, 4 male) gave written
informed consent to participate in the study, which was approved by the local ethics
committee. Eye dominance was assessed using the Porta sighting test (Porta, 1593),
which consists of an observer extending one arm, then with both eyes open aligning the
thumb with a distant object. The observer then alternates closing of one or the other eye
to determine which eye is viewing the object (i.e. the dominant eye). Subjects lay supine
in the scanner and had one of their eyes covered with a patch attached to a wooden pole
that could easily be moved to cover the other eye between runs. To ensure that no light
leaked in through the edges of the patch, I first made sure that the patch completely
blocked out light entering the eye it covered in each subject in the scanner environment.
Before the start of each run in the study, it was verified that subjects were covering the

131
correct eye and that they could not see anything out of the patched eye. Subjects were
then instructed not to move the patch until the run ended and it was verified that the patch
had stayed in place before moving it over to the other eye (in preparation for the next
run).
7.2.2 Stimuli
Visual stimuli were projected from an LCD projector (NEC LT158, refresh rate 60 Hz)
onto a screen viewed by a mirror positioned within the MR head coil. All stimuli were
presented using MATLAB (Mathworks Inc.) and the COGENT 2000 toolbox
(www.vislab.ucl.ac.uk/Cogent/index.html). In addition to a 0.5° central fixation cross, the
visual stimuli comprised a 13° wedge with a 3 foveal cut-out, made up of alternating
black/white checks (scaled linearly with eccentricity) reversing contrast at 8Hz. This
stimulation was presented either to the left or to the right of fixation, at 3and
13eccentricity for the innermost and outermost edge respectively (see Figure 7.2 for a
diagram).
Each subject was scanned for four runs, alternating the unpatched eye on each successive
run (verified by the experimenter), in a manner that was counterbalanced across subjects.
In each run the wedge stimulus was presented eight times for 16s, with a 10s rest period
between presentations, and with these presentations alternating between left and right
hemifields. Subjects, who were all experienced psychophysical observers, were instructed
to maintain fixation and this was confirmed by online monitoring of video output from a
long-range infrared eyetracker (ASL 504LRO Eye Tracking System, Mass).
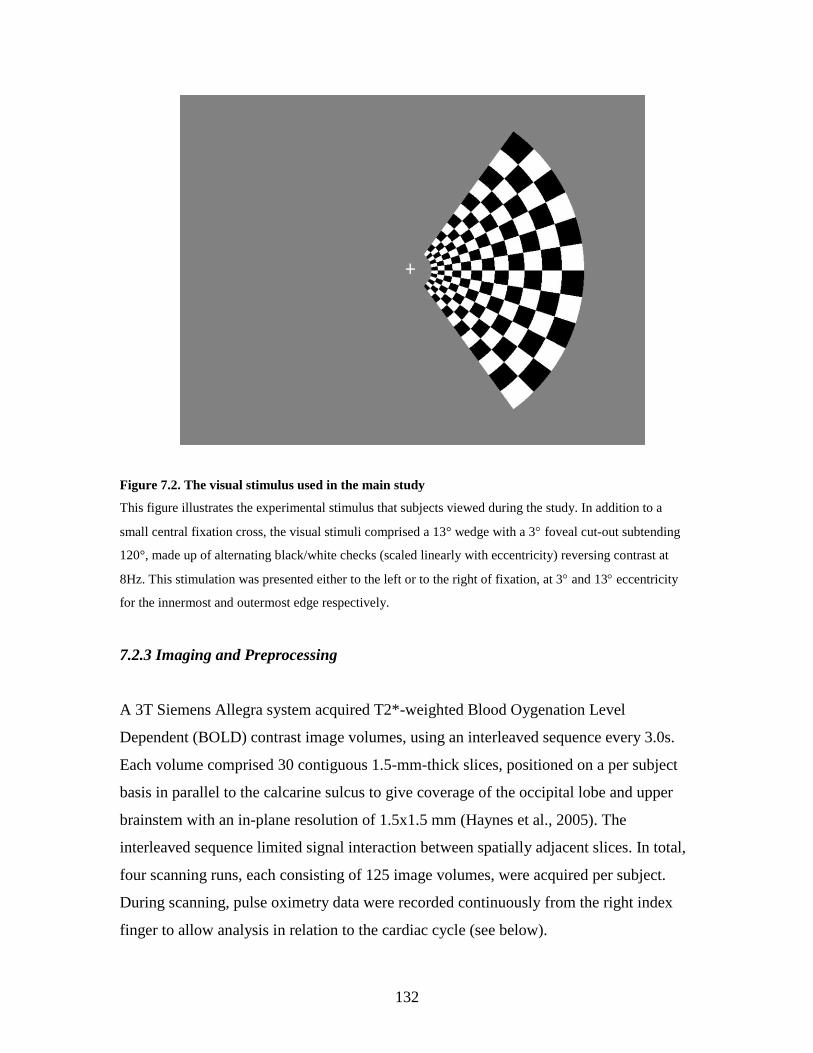
132
Figure 7.2. The visual stimulus used in the main study
This figure illustrates the experimental stimulus that subjects viewed during the study. In addition to a
small central fixation cross, the visual stimuli comprised a 13° wedge with a 3 foveal cut-out subtending
120°, made up of alternating black/white checks (scaled linearly with eccentricity) reversing contrast at
8Hz. This stimulation was presented either to the left or to the right of fixation, at 3and 13eccentricity
for the innermost and outermost edge respectively.
7.2.3 Imaging and Preprocessing
A 3T Siemens Allegra system acquired T2*-weighted Blood Oygenation Level
Dependent (BOLD) contrast image volumes, using an interleaved sequence every 3.0s.
Each volume comprised 30 contiguous 1.5-mm-thick slices, positioned on a per subject
basis in parallel to the calcarine sulcus to give coverage of the occipital lobe and upper
brainstem with an in-plane resolution of 1.5x1.5 mm (Haynes et al., 2005). The
interleaved sequence limited signal interaction between spatially adjacent slices. In total,
four scanning runs, each consisting of 125 image volumes, were acquired per subject.
During scanning, pulse oximetry data were recorded continuously from the right index
finger to allow analysis in relation to the cardiac cycle (see below).
133
Imaging data were analysed using SPM2 (www.fil.ion.ucl.ac.uk/spm). After discarding
the first five image volumes from each run to allow for T1 equilibration effects, image
volumes were realigned, manually coregistered to each subject‟s structural scan and
smoothed with an isotropic 2mm Gaussian kernel (Turner et al., 1998). Automated
coregistration with SPM was not employed, as it would lead to inaccuracies in
registration of the EPI and anatomical images, due to limited brain-coverage and minor
distortions in EPI images resulting from the high resolution sequence. Coregistration was
therefore performed carefully by hand, allowing exact coregistration of the calcarine
sulcus and superior colliculus on the EPI scans to each subject‟s structural scan.
Activated voxels in each experimental condition were identified using a statistical model
containing boxcar waveforms representing each of the four experimental conditions,
convolved with a canonical haemodynamic response function and mean-corrected
(Turner et al., 1998). Six head motion parameters defined by the realignment procedure,
plus twelve parameters related to the cardiac cycle derived from pulse oximetry data
(Glover et al., 2000;Josephs et al, 1997), were added to the model as eighteen separate
regressors of no interest. Multiple linear regression was then used to generate parameter
estimates for each regressor at every voxel. Data were scaled to the global mean of the
time series, and high-pass filtered (cut-off - 0.0083 Hz) to remove low-frequency signal
drifts.
The cardiac noise correction was implemented at the level of modeling the measured
signal and not at the level of image reconstruction, i.e., image data were not modified.
The underlying model used assumed that cardiac effects on a voxels signal depend on the
phase of the image slice acquisition within the cardiac cycle (Josephs et al, 1997). Sine
and cosine series (up to 3rd order) were used to describe the phase effect on a single
reference slice (passing through SC) creating six regressors. The phase for the adjacent
slice (acquired 0.5 TR later) was also used to create a second set of six sine and cosine
series, thus taking into account the increased temporal difference between adjacent slices
134
in the interleaved slice acquisition. As shown in Josephs et al (1997), the model is best
adapted to the slice of reference. However, the large coherent component in the cardiac
noise (due to only small variations in heart rate) can be corrected by a single set of
regressors and functions well for removal of physiological noise throughout the image.
This precluded the need for regressors related to the cardiac cycle to be generated for
each slice (or the need for any slice timing correction). Although this method is less
sensitive to incoherent noise components from throughout the image, as these will only
be modelled in areas where the regressors match the cardiac activity (i.e. the reference
slice), the influence of these components is minor (Josephs et al., 1997). As adjacent
slices were acquired 1.5s apart, using two models (one for the slice closest to the SC and
one for the slice spatially adjacent to this) captured noise related to the cardiac cycle
more effectively. This approach proved to be very effective in accounting for (and
thereby eliminating) variance related to the cardiac cycle, particularly in the region of the
upper brainstem (see Figure 7.3 for an illustrative subject).
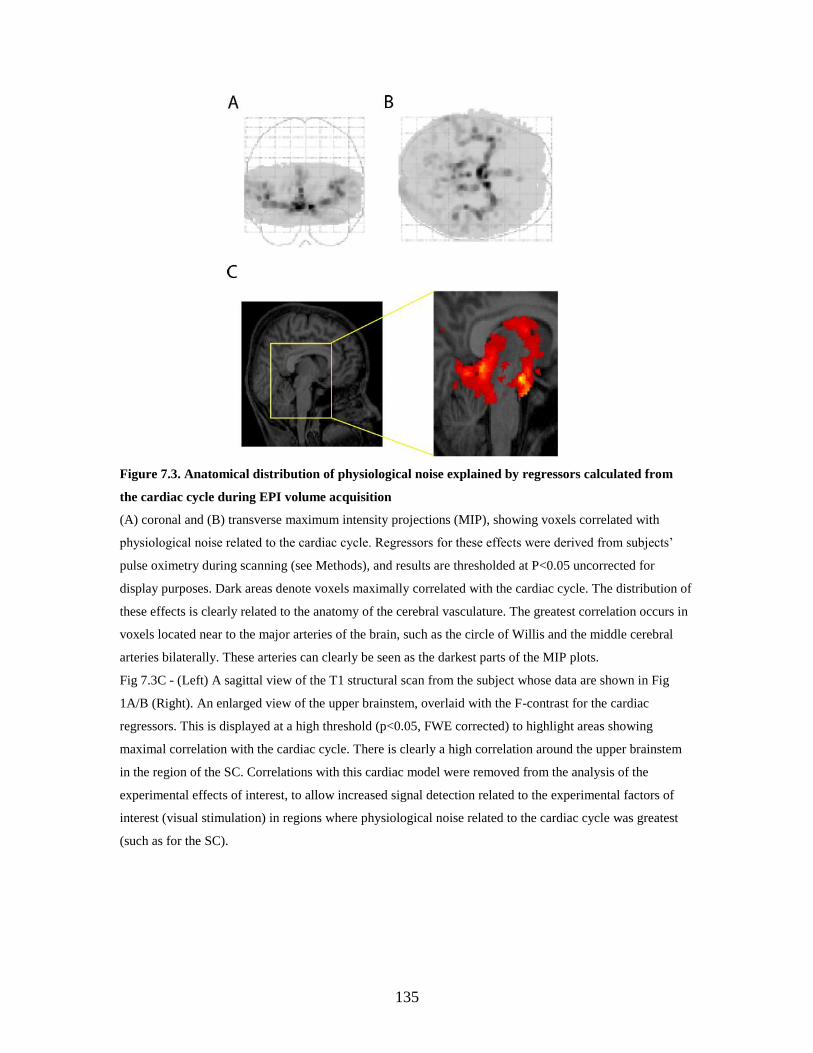
135
Figure 7.3. Anatomical distribution of physiological noise explained by regressors calculated from
the cardiac cycle during EPI volume acquisition
(A) coronal and (B) transverse maximum intensity projections (MIP), showing voxels correlated with
physiological noise related to the cardiac cycle. Regressors for these effects were derived from subjects‟
pulse oximetry during scanning (see Methods), and results are thresholded at P<0.05 uncorrected for
display purposes. Dark areas denote voxels maximally correlated with the cardiac cycle. The distribution of
these effects is clearly related to the anatomy of the cerebral vasculature. The greatest correlation occurs in
voxels located near to the major arteries of the brain, such as the circle of Willis and the middle cerebral
arteries bilaterally. These arteries can clearly be seen as the darkest parts of the MIP plots.
Fig 7.3C - (Left) A sagittal view of the T1 structural scan from the subject whose data are shown in Fig
1A/B (Right). An enlarged view of the upper brainstem, overlaid with the F-contrast for the cardiac
regressors. This is displayed at a high threshold (p<0.05, FWE corrected) to highlight areas showing
maximal correlation with the cardiac cycle. There is clearly a high correlation around the upper brainstem
in the region of the SC. Correlations with this cardiac model were removed from the analysis of the
experimental effects of interest, to allow increased signal detection related to the experimental factors of
interest (visual stimulation) in regions where physiological noise related to the cardiac cycle was greatest
(such as for the SC).

136
7.2.4 Cortical and Subcortical Visual Area Localisation
To identify the boundaries of primary visual cortex (V1) and extra-striate retinotopic
cortical areas V2 and V3, standard retinotopic mapping procedures were used (Sereno et
al., 1995). Checkerboard patterns covering either the horizontal or vertical meridian were
alternated with rest periods for 16 epochs of 26s over a scanning run lasting 165 volumes
(using a standard 3mm voxel sequence; note that only this localiser for determining the
borders of cortical areas used a 3mm resolution and the main experimental findings in
SC, LGN and V1-V3 all come from the 1.5x.1.5x1.5mm sequence described above).
Mask volumes for each region of interest (left and right V1, V2d, V2v, V3d, V3v) were
obtained by delineating the borders between visual areas using activation patterns from
the meridian localisers. Standard definitions of V1 together with segmentation and
cortical flattening in MrGray were followed (Wandell et al., 2000).
The locations of the SC and LGN in each subject were identified using an anatomical and
radiological brain atlas (Duvernoy, 1999) to find anatomical landmarks on each subject‟s
high-resolution structural scan. Next, functional data co-registered to the structural scan
were used to locate visually-responsive voxels within the previously defined anatomical
boundaries, using a contrast of contralateral greater than ipsilateral visual stimulation.
This method of localisation has previously been used successfully to investigate human
LGN responses with high resolution fMRI (Haynes et al., 2005). The LGN and superior
colliculi plus their response to ipsilateral and contralateral visual field stimulation are
shown for two illustrative subjects in Figures 7.4 & 7.5.
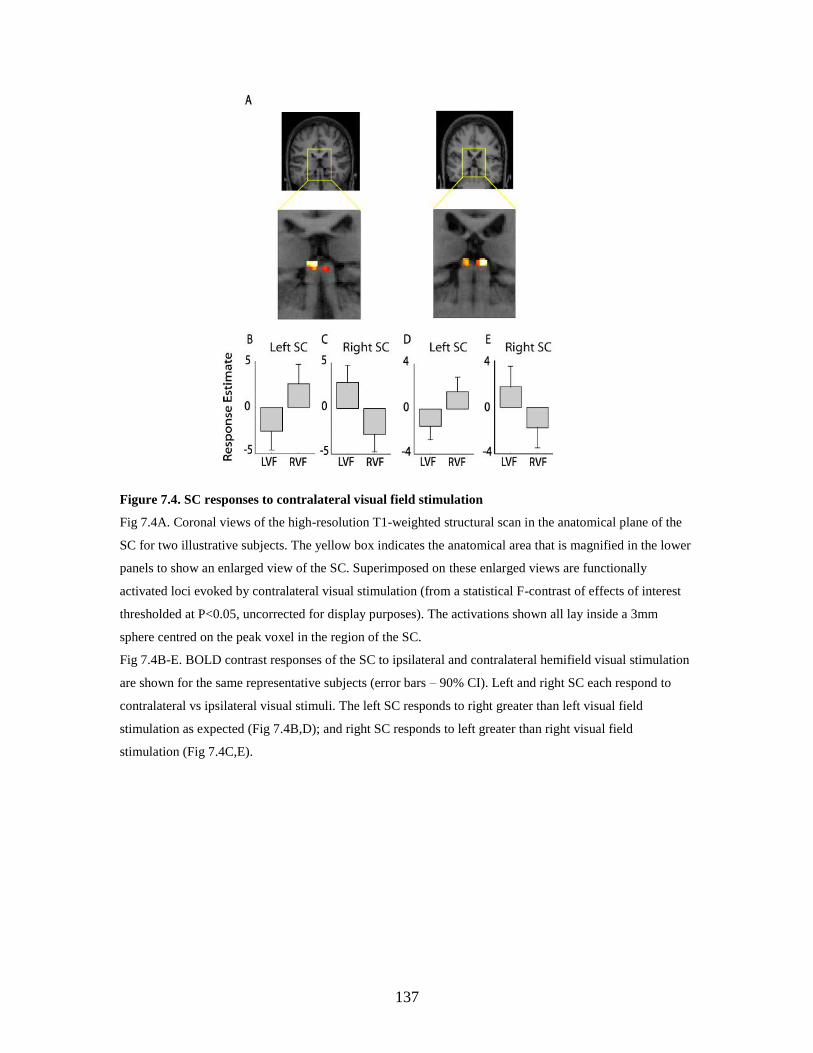
137
Figure 7.4. SC responses to contralateral visual field stimulation
Fig 7.4A. Coronal views of the high-resolution T1-weighted structural scan in the anatomical plane of the
SC for two illustrative subjects. The yellow box indicates the anatomical area that is magnified in the lower
panels to show an enlarged view of the SC. Superimposed on these enlarged views are functionally
activated loci evoked by contralateral visual stimulation (from a statistical F-contrast of effects of interest
thresholded at P<0.05, uncorrected for display purposes). The activations shown all lay inside a 3mm
sphere centred on the peak voxel in the region of the SC.
Fig 7.4B-E. BOLD contrast responses of the SC to ipsilateral and contralateral hemifield visual stimulation
are shown for the same representative subjects (error bars – 90% CI). Left and right SC each respond to
contralateral vs ipsilateral visual stimuli. The left SC responds to right greater than left visual field
stimulation as expected (Fig 7.4B,D); and right SC responds to left greater than right visual field
stimulation (Fig 7.4C,E).
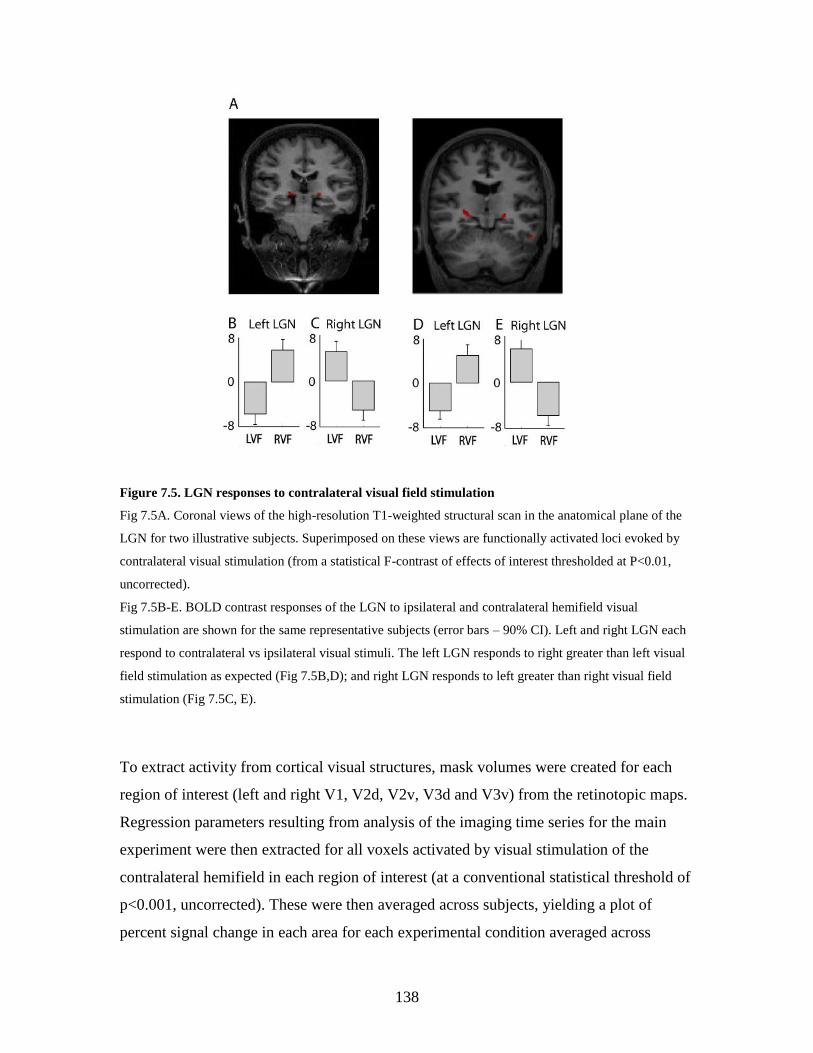
138
Figure 7.5. LGN responses to contralateral visual field stimulation
Fig 7.5A. Coronal views of the high-resolution T1-weighted structural scan in the anatomical plane of the
LGN for two illustrative subjects. Superimposed on these views are functionally activated loci evoked by
contralateral visual stimulation (from a statistical F-contrast of effects of interest thresholded at P<0.01,
uncorrected).
Fig 7.5B-E. BOLD contrast responses of the LGN to ipsilateral and contralateral hemifield visual
stimulation are shown for the same representative subjects (error bars – 90% CI). Left and right LGN each
respond to contralateral vs ipsilateral visual stimuli. The left LGN responds to right greater than left visual
field stimulation as expected (Fig 7.5B,D); and right LGN responds to left greater than right visual field
stimulation (Fig 7.5C, E).
To extract activity from cortical visual structures, mask volumes were created for each
region of interest (left and right V1, V2d, V2v, V3d and V3v) from the retinotopic maps.
Regression parameters resulting from analysis of the imaging time series for the main
experiment were then extracted for all voxels activated by visual stimulation of the
contralateral hemifield in each region of interest (at a conventional statistical threshold of
p<0.001, uncorrected). These were then averaged across subjects, yielding a plot of
percent signal change in each area for each experimental condition averaged across
139
subjects (Figure 7.6). Responses reported for the LGN and SC are taken from the average
of contiguous visually-responsive voxels within the anatomically defined boundaries. For
the SC the average cluster size for contiguous visually responsive voxels in each subject
was 10 voxels (SEM +/- 1) while in the LGN it was 45 voxels (SEM +/- 7).
7.3 Results
The main findings are presented in Figure 7.6. Across the group of eight subjects, all
visual areas studied showed robust and statistically significant responses to contralateral
visual field stimulation, as expected. The responses of subcortical structures LGN and SC
to contralateral visual field stimulation were numerically lower than for retinotopic
cortical areas, consistent with previous work (Kastner et al. 2004;Schneider and Kastner
2005). However, when examining responses to temporal or nasal monocular stimulation
independently, a strong difference was immediately apparent when comparing SC with
all other visual structures (Figure 7.6). Critically, the SC showed significantly increased
responses to contralateral temporal versus nasal stimulation; but the LGN, V1, V2 and
V3 did not.
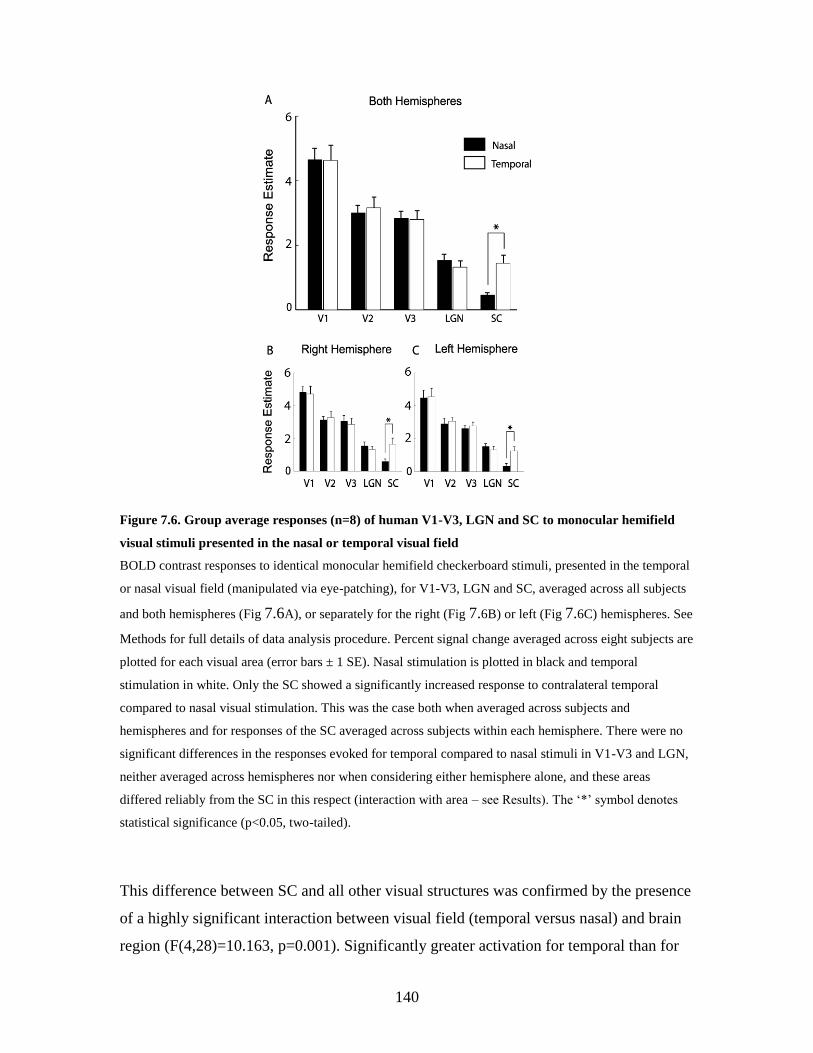
140
Figure 7.6. Group average responses (n=8) of human V1-V3, LGN and SC to monocular hemifield
visual stimuli presented in the nasal or temporal visual field
BOLD contrast responses to identical monocular hemifield checkerboard stimuli, presented in the temporal
or nasal visual field (manipulated via eye-patching), for V1-V3, LGN and SC, averaged across all subjects
and both hemispheres (Fig 7.6A), or separately for the right (Fig 7.6B) or left (Fig 7.6C) hemispheres. See
Methods for full details of data analysis procedure. Percent signal change averaged across eight subjects are
plotted for each visual area (error bars ± 1 SE). Nasal stimulation is plotted in black and temporal
stimulation in white. Only the SC showed a significantly increased response to contralateral temporal
compared to nasal visual stimulation. This was the case both when averaged across subjects and
hemispheres and for responses of the SC averaged across subjects within each hemisphere. There were no
significant differences in the responses evoked for temporal compared to nasal stimuli in V1-V3 and LGN,
neither averaged across hemispheres nor when considering either hemisphere alone, and these areas
differed reliably from the SC in this respect (interaction with area – see Results). The „*‟ symbol denotes
statistical significance (p<0.05, two-tailed).
This difference between SC and all other visual structures was confirmed by the presence
of a highly significant interaction between visual field (temporal versus nasal) and brain
region (F(4,28)=10.163, p=0.001). Significantly greater activation for temporal than for
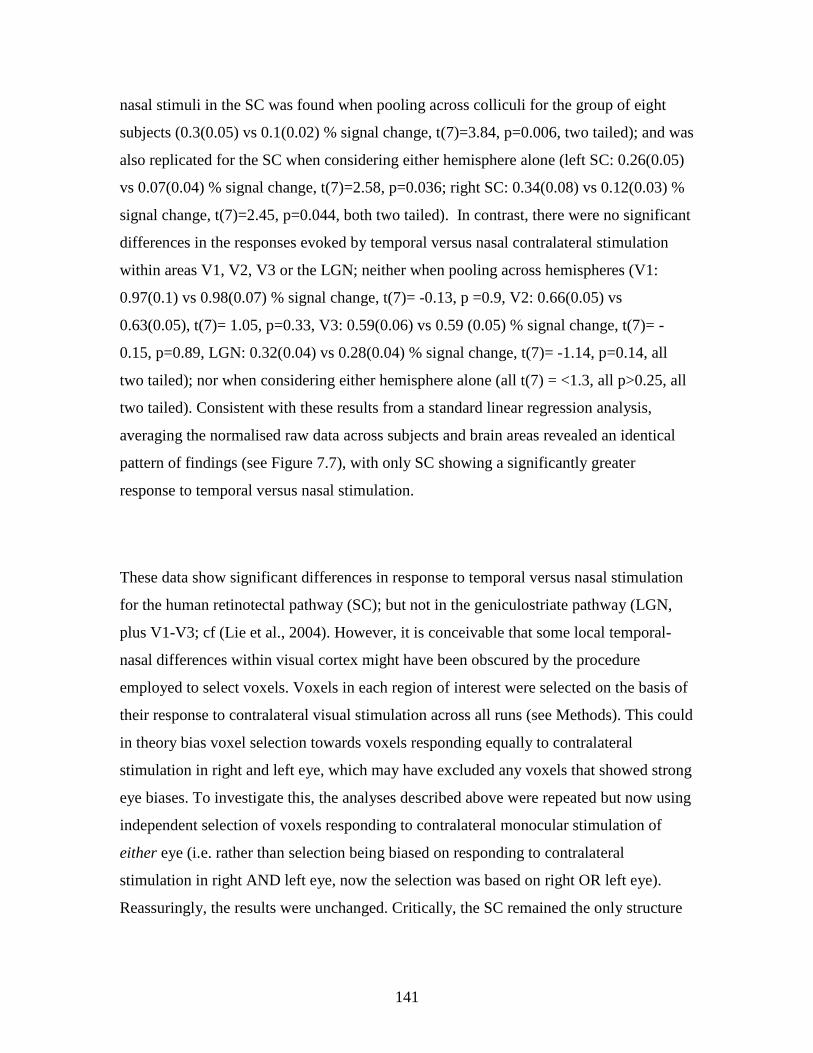
141
nasal stimuli in the SC was found when pooling across colliculi for the group of eight
subjects (0.3(0.05) vs 0.1(0.02) % signal change, t(7)=3.84, p=0.006, two tailed); and was
also replicated for the SC when considering either hemisphere alone (left SC: 0.26(0.05)
vs 0.07(0.04) % signal change, t(7)=2.58, p=0.036; right SC: 0.34(0.08) vs 0.12(0.03) %
signal change, t(7)=2.45, p=0.044, both two tailed). In contrast, there were no significant
differences in the responses evoked by temporal versus nasal contralateral stimulation
within areas V1, V2, V3 or the LGN; neither when pooling across hemispheres (V1:
0.97(0.1) vs 0.98(0.07) % signal change, t(7)= -0.13, p =0.9, V2: 0.66(0.05) vs
0.63(0.05), t(7)= 1.05, p=0.33, V3: 0.59(0.06) vs 0.59 (0.05) % signal change, t(7)= -
0.15, p=0.89, LGN: 0.32(0.04) vs 0.28(0.04) % signal change, t(7)= -1.14, p=0.14, all
two tailed); nor when considering either hemisphere alone (all t(7) = <1.3, all p>0.25, all
two tailed). Consistent with these results from a standard linear regression analysis,
averaging the normalised raw data across subjects and brain areas revealed an identical
pattern of findings (see Figure 7.7), with only SC showing a significantly greater
response to temporal versus nasal stimulation.
These data show significant differences in response to temporal versus nasal stimulation
for the human retinotectal pathway (SC); but not in the geniculostriate pathway (LGN,
plus V1-V3; cf (Lie et al., 2004). However, it is conceivable that some local temporal-
nasal differences within visual cortex might have been obscured by the procedure
employed to select voxels. Voxels in each region of interest were selected on the basis of
their response to contralateral visual stimulation across all runs (see Methods). This could
in theory bias voxel selection towards voxels responding equally to contralateral
stimulation in right and left eye, which may have excluded any voxels that showed strong
eye biases. To investigate this, the analyses described above were repeated but now using
independent selection of voxels responding to contralateral monocular stimulation of
either eye (i.e. rather than selection being biased on responding to contralateral
stimulation in right AND left eye, now the selection was based on right OR left eye).
Reassuringly, the results were unchanged. Critically, the SC remained the only structure
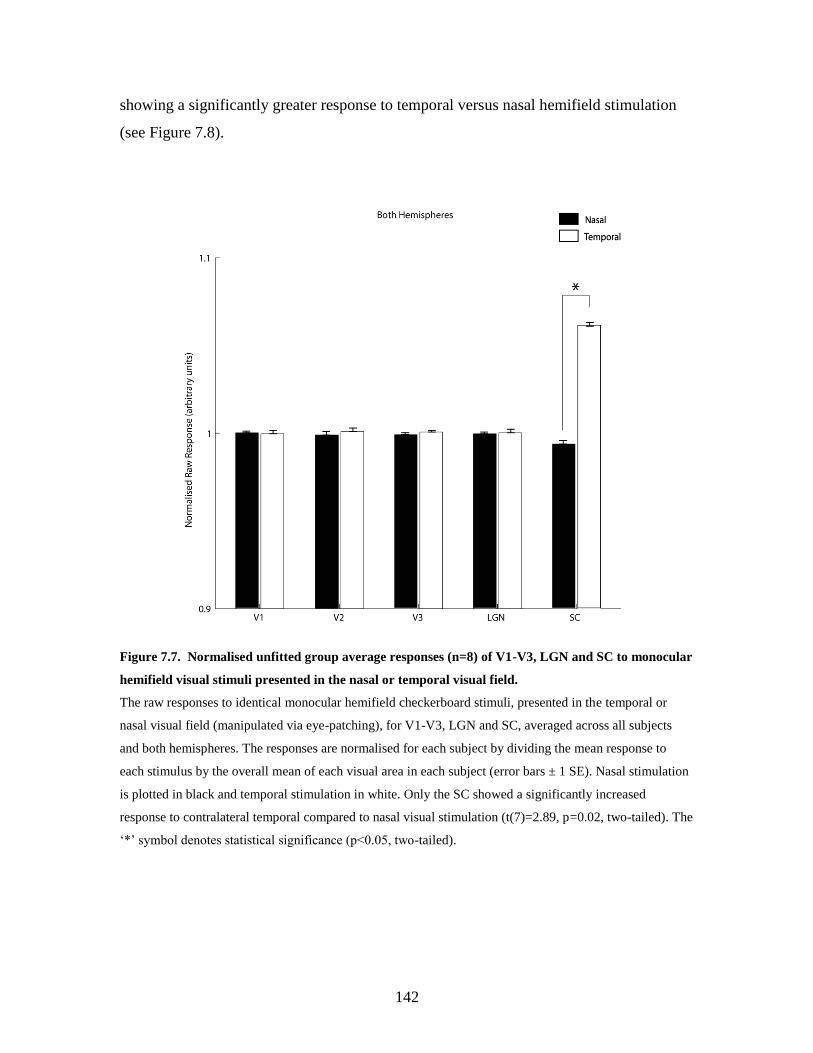
142
showing a significantly greater response to temporal versus nasal hemifield stimulation
(see Figure 7.8).
Figure 7.7. Normalised unfitted group average responses (n=8) of V1-V3, LGN and SC to monocular
hemifield visual stimuli presented in the nasal or temporal visual field.
The raw responses to identical monocular hemifield checkerboard stimuli, presented in the temporal or
nasal visual field (manipulated via eye-patching), for V1-V3, LGN and SC, averaged across all subjects
and both hemispheres. The responses are normalised for each subject by dividing the mean response to
each stimulus by the overall mean of each visual area in each subject (error bars ± 1 SE). Nasal stimulation
is plotted in black and temporal stimulation in white. Only the SC showed a significantly increased
response to contralateral temporal compared to nasal visual stimulation (t(7)=2.89, p=0.02, two-tailed). The
„*‟ symbol denotes statistical significance (p<0.05, two-tailed).
143
Figure 7.8. Group average responses (n=8) of V1-V3, LGN and SC to monocular hemifield visual
stimuli presented in the nasal or temporal visual field using voxels selected on the basis of response
to stimulation via the left OR right eye.
BOLD contrast responses to monocular hemifield stimulation, presented in the temporal or nasal visual
field (manipulated via eye-patching), for V1-V3, LGN and SC, averaged across all subjects and both
hemispheres, or separately for the right or left hemispheres. Percent signal change averaged across eight
subjects is plotted for each visual area (error bars ± 1 SE). Nasal stimulation is plotted in black and
temporal stimulation in white. Only the SC showed a significantly increased response to contralateral
temporal compared to nasal visual stimulation. This was the case both when averaged across subjects and
hemispheres (t (7)=2.89, p=0.023) and for responses of the SC averaged across subjects within each
hemisphere (right SC: t(6)=2.64, p=0.03, left SC: t(7)=3.09, p=0.02). There were no significant differences
in the responses evoked for temporal compared to nasal stimuli in V1-V3 and LGN, neither averaged
across hemispheres nor when considering either hemisphere alone. The „*‟ symbol denotes statistical
significance (p<0.05, two-tailed).
Another possible reason for the pattern of results presented above could be that the
(standard) procedure of averaging across populations of voxels within each area, if the
distribution of temporal/nasal preferences across those voxels within such areas was
distributed bimodally. Indeed, monocular structures such as the LGN might at
sufficiently high spatial resolution in theory show such a bimodal distribution reflecting
eye preference for lateralised stimulation (although note that previous studies of LGN
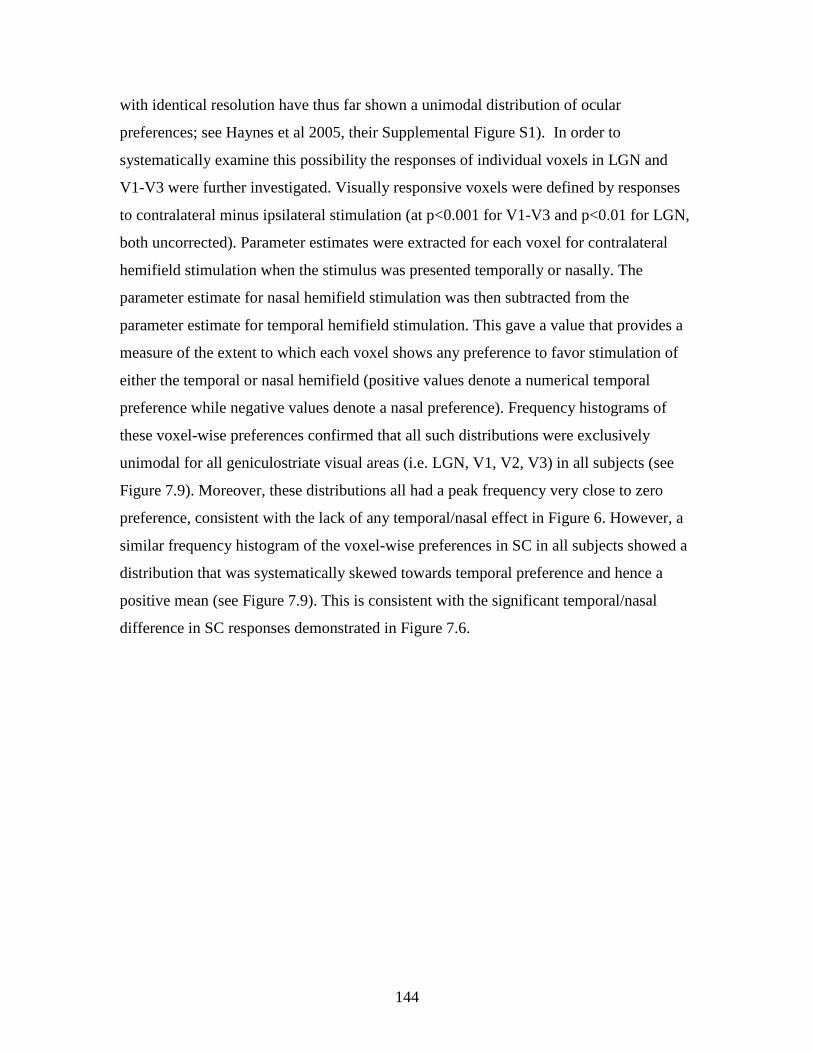
144
with identical resolution have thus far shown a unimodal distribution of ocular
preferences; see Haynes et al 2005, their Supplemental Figure S1). In order to
systematically examine this possibility the responses of individual voxels in LGN and
V1-V3 were further investigated. Visually responsive voxels were defined by responses
to contralateral minus ipsilateral stimulation (at p<0.001 for V1-V3 and p<0.01 for LGN,
both uncorrected). Parameter estimates were extracted for each voxel for contralateral
hemifield stimulation when the stimulus was presented temporally or nasally. The
parameter estimate for nasal hemifield stimulation was then subtracted from the
parameter estimate for temporal hemifield stimulation. This gave a value that provides a
measure of the extent to which each voxel shows any preference to favor stimulation of
either the temporal or nasal hemifield (positive values denote a numerical temporal
preference while negative values denote a nasal preference). Frequency histograms of
these voxel-wise preferences confirmed that all such distributions were exclusively
unimodal for all geniculostriate visual areas (i.e. LGN, V1, V2, V3) in all subjects (see
Figure 7.9). Moreover, these distributions all had a peak frequency very close to zero
preference, consistent with the lack of any temporal/nasal effect in Figure 6. However, a
similar frequency histogram of the voxel-wise preferences in SC in all subjects showed a
distribution that was systematically skewed towards temporal preference and hence a
positive mean (see Figure 7.9). This is consistent with the significant temporal/nasal
difference in SC responses demonstrated in Figure 7.6.
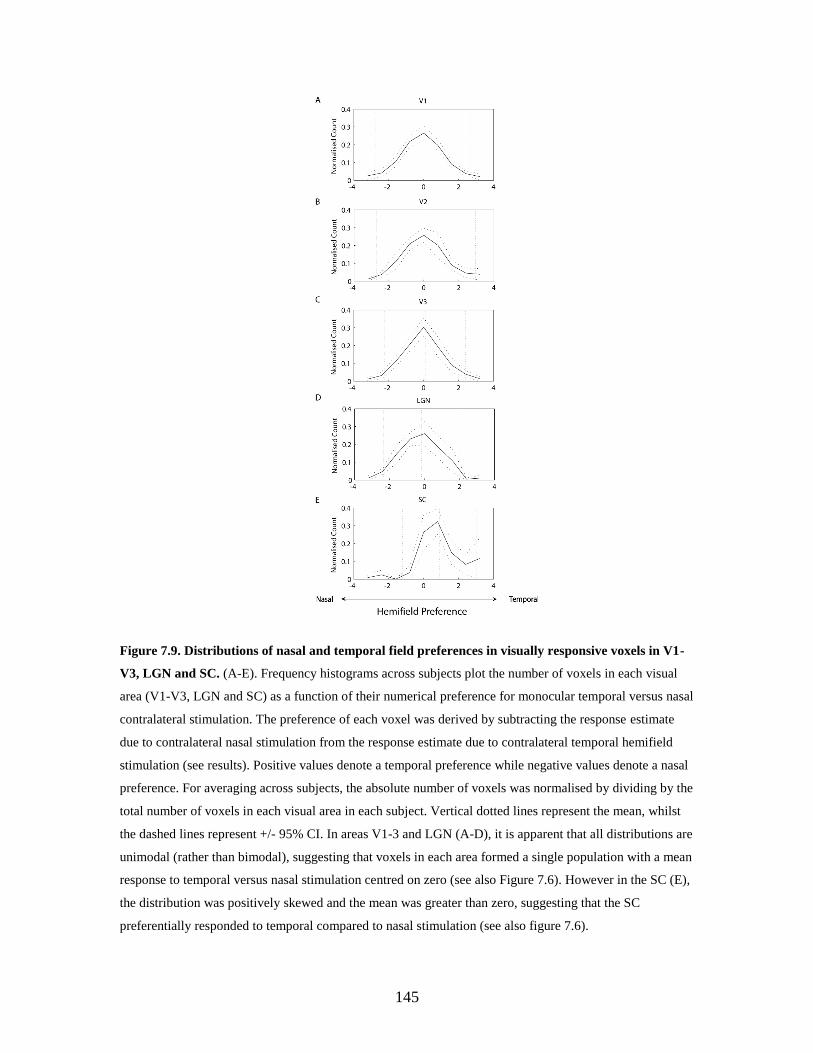
145
Figure 7.9. Distributions of nasal and temporal field preferences in visually responsive voxels in V1-
V3, LGN and SC. (A-E). Frequency histograms across subjects plot the number of voxels in each visual
area (V1-V3, LGN and SC) as a function of their numerical preference for monocular temporal versus nasal
contralateral stimulation. The preference of each voxel was derived by subtracting the response estimate
due to contralateral nasal stimulation from the response estimate due to contralateral temporal hemifield
stimulation (see results). Positive values denote a temporal preference while negative values denote a nasal
preference. For averaging across subjects, the absolute number of voxels was normalised by dividing by the
total number of voxels in each visual area in each subject. Vertical dotted lines represent the mean, whilst
the dashed lines represent +/- 95% CI. In areas V1-3 and LGN (A-D), it is apparent that all distributions are
unimodal (rather than bimodal), suggesting that voxels in each area formed a single population with a mean
response to temporal versus nasal stimulation centred on zero (see also Figure 7.6). However in the SC (E),
the distribution was positively skewed and the mean was greater than zero, suggesting that the SC
preferentially responded to temporal compared to nasal stimulation (see also figure 7.6).
146
Taken together, these data demonstrate directly for the first time that the human SC
responds more strongly to temporal than to nasal contralateral visual stimulation. In
contrast, no such difference was evident in the LGN or cortical areas V1-V3, which
differed significantly from the SC in this respect.
7.4 Discussion
These results show that human SC responses, but not those of the LGN, V1, V2 or V3,
were significantly greater for monocular visual stimuli presented in the temporal
hemifield than in the nasal hemifield. This provides strong and direct evidence for a
biased representation favoring the temporal hemifield within the human SC (although
whether this arises solely from retinotectal, or also reflects some corticotectal influences
upon the SC is not yet established). This bias may provide a neural substrate for
temporal-nasal asymmetries observed in prior purely behavioral studies that had sought
to examine putatively collicular-related aspects of visual behavior (e.g. saccades and
orienting, see Posner and Cohen, 1984).
7.4.1 FMRI of human superior colliculus
In non-human primates, single-cell recording has shown that individual neurons in the
superficial layers of the SC are highly responsive to visual stimuli and receive afferent
inputs from the retina (Schiller and Malpeli, 1977), striate cortex (Wilson and Toyne,
1970), extrastriate cortex (Fries, 1984) and frontal eye fields (Fries, 1984;Kuypers and
Lawrence, 1967). Within the superficial layers of each SC there is a systematic map of
the contralateral visual field (Cynader and Berman, 1972;Goldberg and Wurtz, 1972).
The central visual field is represented anteriorly while the periphery is represented
posteriorly. The upper fields are represented medially and the lower fields laterally. The
147
central ten degrees of the visual field is expanded to represent more than 30% of the
surface of the colliculus. The projection of the contralateral hemi-retina includes the
entire colliculus while the projection of the ipsilateral hemi-retina is represented only in
the anterior portion of the colliculus, leaving a monocular representation of the temporal
hemifield at the posterior pole (Hubel et al 1975).
As far as can be ascertained, human SC seems to follow a similar anatomical pattern
(Hilbig et al., 1999;Laemle, 1981;Tardif et al., 2005). However, it has been difficult to
study human SC responses using neuroimaging techniques until recently, because of the
small size of the SC, plus its deep location near to vascular structures that increase local
physiological noise (Guimaraes et al., 1998). Previous attempts to image the superficial
layers of the SC used cardiac triggering of image acquisition to reduce movement
artefacts related to nearby pulsatile blood vessels (DuBois and Cohen, 2000); or used
very high spatial resolution scanning (Schneider and Kastner, 2005). In this study both
methods were combined by using 1.5x1.5x1.5mm voxels for fMRI; plus twelve analysis
regressors related to the cardiac cycle (as measured with pulse oximetry) in order to
reduce physiological noise related to blood flow (Glover et al., 2000). The data confirm
(see also Schneider and Kastner, 2005) that neuroimaging of visual responses in the
human SC with fMRI is now feasible, although technically demanding. Moreover, the
present results reveal clear temporal-versus-nasal differences within the human SC for
the first time, while showing a significantly contrasting pattern for the LGN and for
visual cortex.
These findings can also be redescribed as reflecting a preference in the SC for stimulation
of the contralateral hemifield in the contralateral eye, but no overall eye preference for
the neuronal populations recorded from LGN or visual cortex. In those voxels in LGN
and V1 that showed an eye bias there were no systematic preferences in the overall
responses of either left or right LGN and V1 for stimulation of one eye compared to the
other (Figure 7.9). This contrasts with the findings in SC, where there were strong and
highly significant responses for stimulation of the contralateral hemifield in the
contralateral eye (equivalent to the temporal hemifield). Of note, there did not seem to be

148
any consistent clustering of such voxels preferring stimulation of one eye within SC
(Figure 7.10). However, caution is appropriate before concluding that human SC shows
no monocular structure, due to the small size of the SC and comparatively coarse fMRI
spatial resolution. In monkey, the SC largely comprises binocularly responsive neurons
(as discussed above) but there is a monocular region at the posterior pole (which
represents the far temporal periphery i.e. beyond 25 degrees). No consistent evidence for
a posterior region showing monocular preference within the human SC was found (Figure
7.10). However, the lateral extent of temporal visual field stimulation in the fMRI
scanner was limited by the head coil to 20 degrees. It may therefore have been unlikely
that this putative monocular region representing very eccentric visual locations was
stimulated. Further research with even higher spatial resolutions and visual stimulation at
much greater eccentricities may therefore be necessary to resolve this remaining issue
definitively.
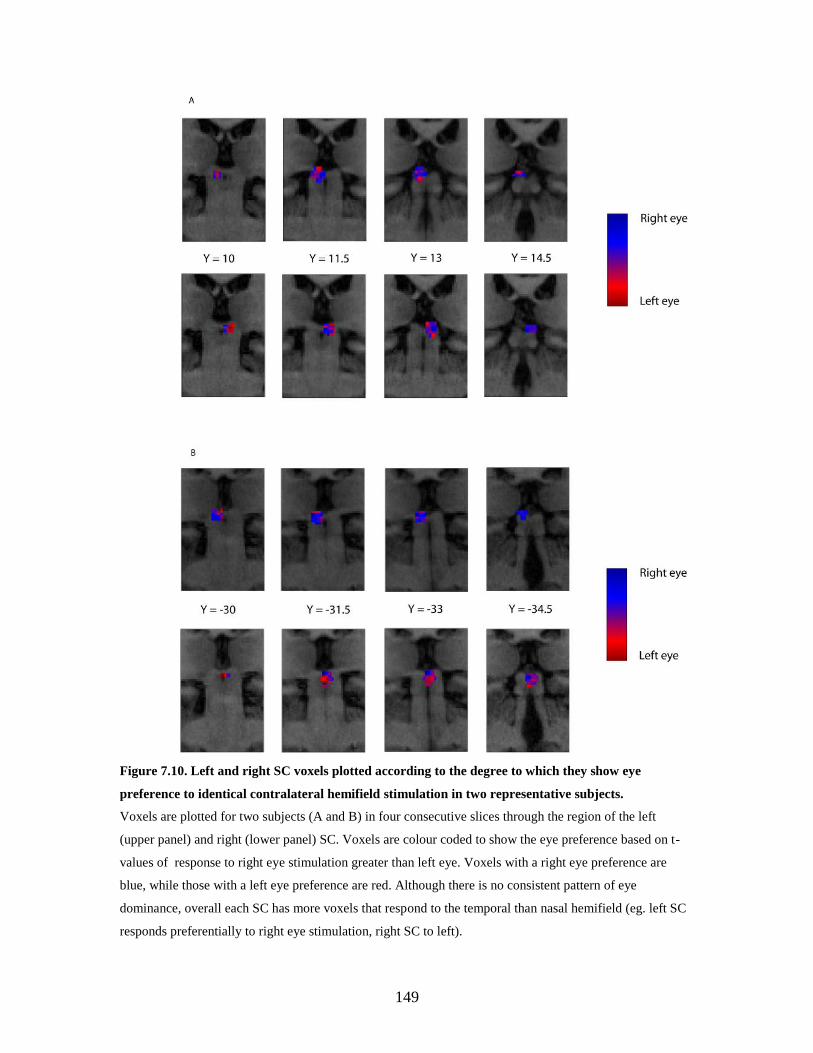
149
Figure 7.10. Left and right SC voxels plotted according to the degree to which they show eye
preference to identical contralateral hemifield stimulation in two representative subjects.
Voxels are plotted for two subjects (A and B) in four consecutive slices through the region of the left
(upper panel) and right (lower panel) SC. Voxels are colour coded to show the eye preference based on t-
values of response to right eye stimulation greater than left eye. Voxels with a right eye preference are
blue, while those with a left eye preference are red. Although there is no consistent pattern of eye
dominance, overall each SC has more voxels that respond to the temporal than nasal hemifield (eg. left SC
responds preferentially to right eye stimulation, right SC to left).
150
7.4.3 Possible neural substrate for behavioral temporal-hemifield advantages is
confirmed in the collicular pathway
The retinotectal pathway is phylogenetically ancient and predates the geniculostriate
system (see (Karten, 1989). It might have evolved to augment rapid orienting of the eyes
and head to salient peripheral stimuli. In species where the eyes are positioned on or
towards the side of the head, such a temporal hemifield advantage in the retinotectal
pathway could convey a survival advantage by reducing the time required to orient to
objects appearing in the periphery of vision. These data provide the first direct evidence
that human SC responses are greater for stimuli presented in the temporal versus nasal
visual field. The SC is considered intimately involved in orienting to salient stimuli
through target selection (Ignashchenkova et al., 2004;McPeek and Keller, 2004b) and
related shifts of visual attention (Muller et al., 2005a). Increased responses in the human
SC for temporal hemifield stimuli, as observed here, might thus explain temporal-
hemifield advantages previously observed in human visual orienting behavior (e.g.
(Kristjansson et al., 2004;Posner and Cohen, 1984;Rafal et al., 1990). Indeed, such
behavioral asymmetries have previously been tentatively attributed to the retintotectal
pathway. However, hitherto such proposals had all been based on indirect speculation
that temporal-nasal asymmetries might arise within the colliculus but not for the
geniculate-striate pathway. Without direct evidence the opposite proposal, that any
orientating biases arise from, could equally be made. Cortical influences on the deep SC
(which is directly involved in saccade generation) could be better placed than retinal
influences on the superficial SC (which has a largely sensory role) to cause biases in
orientating behaviour. This study confirms that these asymmetries seem to be mediated
by the retino-tectal but not the geniculo-striate pathway in the human brain for the first
time. It remains uncertain whether the temporal-nasal asymmetries shown behaviorally,
and now with fMRI, are merely a relic of evolution or continue to convey useful
advantages in primates.
This study (and indeed any non-invasive imaging study of any stimulus property in
humans) cannot distinguish whether any bias in fMRI responses evoked by a particular
stimulus arises from an increased number of neurons responding to that stimulus; or to a
151
larger gain associated with neuronal responses to one particular stimulus. There are
established anatomical asymmetries in temporal versus nasal hemifields in the retina
(Stone and Johnston, 1981;Van Buren, 1963) and striate cortex in monkeys (LeVay et al.,
1985), but only for retinal eccentricities of well beyond fifteen degrees. In the central
fifteen degrees of the visual field, where temporal hemifield behavioural advantages
occur (see Rafal et al 1991), and where the visual stimuli in this study were presented,
there is no evidence for any anatomical asymmetry in either the retina or the retinotectal
projection. In the macaque, there appears to be no numerical asymmetry in the temporal
versus nasal projection from the retina to the SC (Williams et al 1995). But the present
fMRI results accord with the human temporal nasal differences found behaviourally
(Rafal et al., 1991).
BOLD contrast fMRI signals more closely correlate with local field potentials than with
axonal spiking (Logothetis et al., 2001) and thus at a population level the BOLD signal
cannot clearly distinguish between the effect of feedforward and feedback influences on a
region. The temporal hemifield biases observed in SC responses could therefore in
principle reflect either retinotectal or corticotectal influences. However, there were no
differences in BOLD signal from V1 or other retinotopic cortical areas found when
comparing temporal and nasal hemifield stimulation. This lack of temporal/nasal
asymmetry in cortical structures may argue against the notion that the temporal biases
that were observed in SC originate from the corticotectal pathway (see also e.g. Fries
1984). However these data cannot exclude the influence of corticotectal feedback on the
SC. This might be examined in the future by imaging the SC in patients with cortical
lesions.
7.5 Conclusion
In conclusion, this study provides direct evidence for a bias in the visual response of the
human SC that favors the temporal over the nasal contralateral hemifield. No such bias is
apparent in the geniculostriate pathway (LGN, V1-V3), which differed significantly from
the SC in this respect. The collicular preference for the temporal hemifield shown here
152
may thus provide a neural substrate for analogous temporal-hemifield advantages in
visual behaviour. These findings demonstrate that the interaction between the oculomotor
and visual systems is reciprocal. Activity in early visual structures is profoundly
influenced by oculomotor behaviour and leads to modulation of visual perception. While
activity in oculomotor structures is influenced by visual conditions and this may lead to
biases in oculomotor behaviour. Visual influences on oculomotor structures are not
limited to the SC, indeed primate FEF encodes a visual salience map (Thompson and
Bichot, 2005) that contributes to rapid covert or overt shifts of attention to salient
locations in the visual field. However, the extent to which visual conditions modulate
oculomotor activity throughout the oculomotor system remains to be seen.
153
CHAPTER 8: GENERAL DISCUSSION
8.1 Introduction
The experimental studies outlined in this thesis demonstrate that there is a significant
interaction between visual and oculomotor processing at the neural level in the human
brain. This general discussion will review these findings and the implications they have
for our understanding of visual and oculomotor processing. In addition, I will explore the
extent to which these findings can shed light on other brain processes and indeed
abnormal visual perception or behaviour following damage to the brain. Finally, I will
discuss further experimental studies that would test hypotheses generated from the
experimental data presented in this thesis. The experimental studies can be grouped
according to whether they examine the effect of dynamic oculomotor behaviour
(Chapters 3,4,5) or static eye position (Chapter 6) on visual activity or the influence of
varying visual context on oculomotor activity (Chapter 7).
8.2 The effects of dynamic oculomotor behaviour on human visual processing
Dynamic oculomotor behaviour includes a range of eye movements including saccades,
microsaccades, smooth pursuit, accommodation, vergence and reflexes that limit retinal
slip (such as the VOR). Each of these behaviours leads to perceptual consequences that
potentially require compensation by the visual system. This issue is particularly important
in the context of saccade where the high velocity and large amplitude of the eye
movements leads to prolonged „gaps‟ in visual experience. Why these gaps are not
subjectively experienced has been the focus of much experimental research. While many
groups have found significant perisaccadic decreases in human visual sensitivity
154
(saccadic suppression), (Burr et al., 1982;Riggs et al., 1974;Zuber and Stark, 1966) the
precise nature and location of active saccadic influences on the human visual system are
not clear. In monkeys, saccades have been shown to significantly modulate visually
evoked neuronal responses in LGN, V1 and later visual areas (Duffy and Burchfiel,
1975;Ramcharan et al., 2001;Thiele et al., 2002) even when confounding visual effects of
saccades are eliminated (Reppas et al., 2002). Three experimental chapters in this thesis
were concerned with defining the neural substrates of saccadic modulation of visual
processing:
Chapter 3 examined the effects of saccades on human LGN and V1-3 responses using
BOLD contrast fMRI under a range of visual conditions (including darkness) in normal
subjects. The major finding was that saccades altered activity in LGN and retinotopic
visual cortex in two distinct ways. First, the presence (versus absence) of saccades was
associated with significant modulation of activity in both the LGN and V1 (although to a
significantly greater extent in LGN than V1). Second, this modulation differed depending
on whether saccades were made in the presence or absence of visual stimulation. Visually
evoked activity was reduced by saccades but in total darkness saccades led to increased
activity in the same visual brain areas.
Chapter 4 outlined the results of a new analysis of the data from Chapter 3 which was
carried out to characterize the underlying mechanisms that lead to saccadic modulation of
visual brain areas in more detail. DCM, a method for modelling effective connectivity
using fMRI data (Friston et al., 2003a), was used to examine changes in connectivity in a
network of visual and oculomotor brain areas during saccades. The results of this analysis
demonstrate that saccadic modulation of visual brain areas can be explained by changes
in the effective connectivity between LGN, V1 and FEF. Specifically, saccades modulate
LGN activity rather than later visual areas (which are modulated through decreased
feedforward effective connectivity). Second, the differential modulation of visual areas
during saccades made in darkness and light can be explained by changes in the effective
connectivity between FEF and V1 under these different states of visual stimulation.
155
Chapter 5 explored the nature of the increased activity seen in visual areas during
saccades in darkness by examining the effect of systematically manipulating the strength
of visual stimulation on saccadic modulation of LGN and V1 responses. The findings
suggest that the motor component of saccades alone can lead to increased activity in
retinotopic visual areas. This activity can be measured directly in darkness using fMRI,
but only inferred during visual stimulation (by the absence of suppression of visual
activity at low levels of visual stimulation).
Taken together, these findings provide insight into both the mechanisms of saccadic
suppression and more general principles concerning the neural basis of visual and
occulomotor interactions. Saccadic modulation of visual processing is a more complex
process than one might imagine. Saccadic effects are not confined to a single location and
do not only result in suppression of activity in visual structures. Instead saccades act on a
distributed network of subcortical and cortical visual areas and have different effects on
these structures depending on the concurrent state of visual stimulation (suppression of
visually evoked responses and increased activity in darkness representing a corollary
discharge). This differential effect is consistent with the notion that the perceptual
phenomenon of saccadic suppression results from an interaction of oculomotor and visual
signals (Diamond et al., 2000). My results also suggest that LGN has a crucial role in
relaying oculomotor information to later visual areas. LGN activity is modulated to a
greater extent than cortical visual areas and the connectivity analysis suggests that
modulation of cortical activity occurs because of changes in LGN activity. To examine
whether LGN is necessary for saccadic modulation of later visual areas one could
examine saccadic modulation of V1 in darkness using subjects with hemianopia due to
optic radiation damage. If modulation of V1 activity by saccades is dependant on LGN
then one would see modulation of V1 activity in the intact hemisphere but not in the
damaged hemisphere.
156
The mechanism for changes in human LGN activity during saccades is not clear but may
arise from areas involved in occulomotor planning and execution (such as FEF) directly
or via brainstem oculomotor structures that have direct connections to the LGN.
Intriguingly, concurrent single cell recordings at multiple sites within the pigeon visual
system suggest that saccadic effects on visual activity arise from modulation of visual
thalamus by oculomotor brainstem nuclei including omnipause and optinokinetic neurons
(Yang et al., 2008). It is tempting to speculate that a similar mechanism in humans can
account for the interaction between oculomotor structures and the LGN during saccades
(and given the range of brainstem structures involved also during other types of dynamic
oculomotor behaviour), but there is currently no direct evidence for this. Although
combined TMS / fMRI studies have shown that FEF stimulation can influence V1
activity (Ruff et al., 2006), exploring brainstem and subcortical interactions would be
very difficult given the current technology available.
There are a number of related areas that further studies could meaningfully address. First,
whether corollary discharge related to saccades in early visual cortex is functionally
relevant. If this extraretinal signal has a significant functional role, one would expect it to
encode information about the saccade metrics that lead to its generation (such as direction
and amplitude). Therefore one prediction that could be tested is that V1 activity related to
saccades made in darkness can be differentiated on the basis of saccade direction alone
(for example saccades to the left will cause a different pattern of V1 activity than those to
the right). Second, the perceptual phenomenon of peri-saccadic mislocalization (Ross et
al., 1997) could be explored. Here visual stimuli presented prior to saccade initiation are
mislocalized towards the target of the upcoming saccade. This phenomenon is thought to
arise from peri-saccadic remapping of visual receptive fields (although there is currently
no human physiological evidence for this assertion). If this is the case the early cortical
retinotopic maps may be altered prior to saccade onset and this could be examined by
defining the spatial pattern of V1 activity elicited by the presentation of brief visual
stimuli prior to saccade initiation. One might expect to see predictable differences in the
spatial pattern of activation from an identical stimulus prior to initiation of saccades of
157
different amplitude and direction if saccade if this interpretation of the psychophysiacal
results is correct.
8.3 The effects of static eye position on human visual processing
It is clear that dynamic oculomotor behaviour leads to significant modulation of activity
in visual brain areas. This modulation represents compensation for the disruptive visual
consequences of eye movements but also may contain information directly related to
oculomotor behaviour. While altering the direction of gaze fixation leads to minimal
disruption of perceptual continuity, extraretinal signals encoding eye position could
provide potentially useful information for the visual system. In particular, such
information could be used in the transformation of the contents of visual perception into a
form that could guide motor behaviour. Psychophysical studies have shown that static
eye position modulates human perception of stimuli that are processed early in the visual
system (Nieman et al., 2005;Nishida et al., 2003) and monkey V1 single cell responses
are modulated by gaze (Trotter and Celebrini, 1999). Therefore Chapter 6 examined
whether human V1 responses are modulated by gaze direction when the visual
environment is unchanged. The main finding was that gaze direction did not modulate
visual cortical activity when the data was analysed using conventional univariate
analysis. However, significant gaze effects were found when multivariate analysis was
used. This result is consistent with a distributed representation of horizontal gaze
direction being present at the earliest anatomical stages of cortical visual processing (V1-
3). Therefore, static in addition to dynamic oculomotor behaviour seems to modulate
activity in visual brain structures. However, this result raises important methodological
and conceptual issues.
From the methodological viewpoint, the use of multivariate rather than mass univariate
analysis requires further validation. The multivariate technique is a very sensitive method
158
for finding differences between sets of data, but the physiological basis and functional
significance of these differences is not yet clear. Further work to clarify the underlying
basis for this relatively new form of fMRI analysis is needed. My results suggest that it is
not just the retinal location of a stimulus that is encoded in visual cortex, but the study did
not distinguish between egocentric and world-centred representations which were both
altered in the two different gaze conditions. Additionally whether this information is
actually used by the brain in visiomotor transformations is uncertain. Finally, the source
of eye position signals in visual cortex is unknown. One possibility is that higher areas
involved in occulomotor control (such as parietal and frontal areas) send information
about gaze direction to visual cortex but equally proprioceptive information from the eye
itself could play a role.
8.4 The effect of varying visual stimulation on oculomotor brain responses
Rather than examining the effect of eye movements on visual structures when visual
conditions remain constant, the experiment outlined in Chapter 7 examined the effect of
altering visual conditions on oculomotor structures with the eyes fixated centrally.
Specifically monocular responses in the SC, a structure that receives both visual and
oculomotor input were examined when the visual hemifield that stimuli were presented in
was varied. The experiment utilized eye patching to reverse which visual hemifield (left
or right) is temporal or nasal, a technique that has uncovered pronounced behavioural
advantages for orienting towards visual stimuli in the temporal versus the nasal
hemifield, in newborns (Lewis and Maurer, 1992;Rothbart et al., 1990) and adults
(Kristjansson et al., 2004;Rafal et al., 1991). The results suggested that human SC
responses, but not those of the LGN or V1-V3, were significantly greater for monocular
visual stimuli presented in the temporal hemifield than in the nasal hemifield.
These results provide evidence for a biased representation favouring the temporal
hemifield within the human SC and may be the neural substrate for the behavioural
effects described above in both normals and hemianopic subjects with blindsight. Similar
behavioural biases have recently been shown audio-visual crossmodal integration (Bertini
159
et al., 2008), this could provide the basis for an interesting follow up study. However,
there is growing evidence that temporal/nasal biases in visual orientating may not be
mediated by the SC in either of these subject groups (Bompas et al., 2008;Walker et al.,
2000). Further studies are needed to asses the behavioural significance of the biased
hemifield representation found in SC. These would involve imaging studies of visual
orientating behaviour in addition to passive viewing of visual stimuli.
Animal studies using single cell recording or targeted lesions have found that the SC has
an important role in integrating visual and oculomotor information, and in behaviours
that utilize such information such as visual orientating and covert shifts of attention
(Ignashchenkova et al., 2004). The role of human SC in similar behaviours has not been
extensively studied, largely because its small size and location make it technically
difficult to study using non-invasive methods. The study presented in this thesis is one of
the first to successfully use fMRI to examine human SC responses directly by utilizing
ultra high resolution fMRI. Similar methods should allow the investigation of other roles
of human SC to be performed.
Visual influences on oculomotor structures are not limited to the SC, indeed primate FEF
encodes a visual salience map (Thompson and Bichot, 2005) that contributes to rapid
covert or overt shifts of attention to salient locations in the visual field. However, the
extent to which visual conditions modulate human oculomotor activity at other locations
within the oculomotor system remains to be seen. Further studies could examine visual
responses in higher oculomotor areas in parietal and frontal regions (such as FEF). One
method that may be usefully employed in such studies is cortical flattening which allows
precise delineation of functional brain areas and generation of accurate topographic maps
of function. This method is used to define retinotopic visual areas, but more recently has
been used in frontal cortex (Soon et al., 2008), although in a completely different
context. It would be interesting to examine whether visual responses in human FEF are
retinotopically organised and whether they show temporal/nasal asymmetry suggesting
top-down, rather than bottom-up influences drive the behavioural hemifield biases. In
addition, the neural basis for top down influences on visual orientating could be explored
using such methods.
160
8.5 Conclusion
In summary, my findings provide direct evidence of visual and oculomotor interactions
within human brain structures that are primarily thought of as either visual or oculomotor.
Activity in early visual structures, both subcortically (LGN) and cortically (V1-V3) is
profoundly influenced by different types of oculomotor behaviour. This interaction acts
to both compensate for the visual effects of oculomotor behaviour and also to transform
visual information into a form that can be used for action by the motor system. Saccadic
eye movements modulate early stages in visual processing (particularly LGN) through
the influence of an efference copy of the saccade motor plan (generated by oculomotor
planning structures such as FEF). My findings suggest that this limits the disruptive
perceptual effects of rapid eye movements. However, emerging animal evidence suggests
that signals from occulomotor structures directly modify the receptive field properties of
neurons in visual structures, a process that may mediate attentional shifts to salient
locations in the visual field. The use of effective connectivity modelling and/or
concurrent TMS/fMRI will allow these issues to be investigated in human subjects.
Whether other types of eye movement, such as smooth pursuit or microsaccades, lead to
similar modulation of visual structures has received minimal attention and could be
studied using similar methods to those presented in this thesis.
In addition to eye movements, static oculomotor behaviour, such as the direction of gaze
fixation also modulates human visual cortex. This may be important in the early stages of
transformation of visual information from retinotopic to egocentric coordinates that can
then guide motor behaviour. The underlying mechanisms that cause gaze modulation of
visual responses are not clear and require further study. Finally, I have demonstrated that
visual activity in an „oculomotor‟ structure, the SC, shows a significant bias towards the
periphery of the visual field. This may lead to biases in oculomotor behaviour that have
been consistently demonstrated in a range of normal and brain damaged subjects.
Additionally, the technical advances that enabled fMRI to be used in imaging SC can
now be implemented to further explore the varied functions of SC. These include
161
crossmodal integration, a putative role in reward based learning as well as a crucial role
in visual and occulomotor interactions.
The neural machinery that underpins human vision has been extensively studied. This
thesis started by asserting that visual processing does not occur in isolation, but takes
place within the context of dynamic oculomotor behaviour and then postulated that the
physiological processes underlying visual processing and oculomotor behaviour must be
highly integrated. The studies presented in this thesis add weight to this assertion. I have
demonstrated profound oculomotor influences in primarily visual brain structures and
visual influences in primarily oculomotor structures. The consequences of these
interactions and the underlying mechanisms require further study. However, the existence
of such interactions adds depth to models of the neural mechanisms of visual behaviour
and perception and should be considered carefully when looking at other areas of human
cognition that have traditionally been studied in isolation.
162
References
Adler R.J. (1981). The geometry of random fields (New York.
Andersen,R.A., Essick,G.K., and Siegel,R.M. (1985). Encoding of spatial location by
posterior parietal neurons. Science 230, 456-458.
Andersen,R.A., Essick,G.K., and Siegel,R.M. (1987). Neurons of area 7 activated by both
visual stimuli and oculomotor behavior. Exp. Brain Res. 67, 316-322.
Andersen,R.A., and Mountcastle,V.B. (1983). The influence of the angle of gaze upon
the excitability of the light-sensitive neurons of the posterior parietal cortex. J. Neurosci.
3, 532-548.
Anderson,T.J., Jenkins,I.H., Brooks,D.J., Hawken,M.B., Frackowiak,R.S., and
Kennard,C. (1994). Cortical control of saccades and fixation in man. A PET study. Brain
117 ( Pt 5), 1073-1084.
Andersson,F., Etard,O., Denise,P., and Petit,L. (2004). Early visual evoked potentials are
modulated by eye position in humans induced by whole body rotations. BMC. Neurosci.
5, 35.
Anstis,S.M. (1974). Letter: A chart demonstrating variations in acuity with retinal
position. Vision Res. 14, 589-592.
Ashburner,J., Neelin,P., Collins,D.L., Evans,A., and Friston,K. (1997). Incorporating
prior knowledge into image registration. Neuroimage. 6, 344-352.
Attwell,D., and Laughlin,S.B. (2001). An energy budget for signaling in the grey matter
of the brain. J Cereb Blood Flow Metab 21, 1133-1145.
Azzopardi,P., and Cowey,A. (1996). The overrepresentation of the fovea and adjacent
retina in the striate cortex and dorsal lateral geniculate nucleus of the macaque monkey.
Neuroscience 72, 627-639.
Baker,J.T., Donoghue,J.P., and Sanes,J.N. (1999). Gaze direction modulates finger
movement activation patterns in human cerebral cortex. J. Neurosci. 19, 10044-10052.
Bartlett,J.R., Doty,R.W., Lee,B.B., Sr., and Sakakura,H. (1976). Influence of saccadic
eye movements on geniculostriate excitability in normal monkeys. Exp. Brain Res. 25,
487-509.
Berman,N., Blakemore,C., and Cynader,M. (1975). Binocular interaction in the cat's
superior colliculus. J. Physiol 246, 595-615.
163
Berman,R.A., Colby,C.L., Genovese,C.R., Voyvodic,J.T., Luna,B., Thulborn,K.R., and
Sweeney,J.A. (1999). Cortical networks subserving pursuit and saccadic eye movements
in humans: an FMRI study. Hum. Brain Mapp. 8, 209-225.
Bertini,C., Leo,F., and Ladavas,E. (2008). Temporo-nasal asymmetry in multisensory
integration mediated by the Superior Colliculus. Brain Res.
Bisley,J.W., and Goldberg,M.E. (2003b). Neuronal activity in the lateral intraparietal area
and spatial attention. Science 299, 81-86.
Bisley,J.W., and Goldberg,M.E. (2003a). Neuronal activity in the lateral intraparietal area
and spatial attention. Science 299, 81-86.
Blatt,G.J., Andersen,R.A., and Stoner,G.R. (1990). Visual receptive field organization
and cortico-cortical connections of the lateral intraparietal area (area LIP) in the
macaque. J. Comp Neurol. 299, 421-445.
Bodis-Wollner,I., Bucher,S.F., and Seelos,K.C. (1999). Cortical activation patterns
during voluntary blinks and voluntary saccades. Neurology 53, 1800-1805.
Bodis-Wollner,I., Bucher,S.F., Seelos,K.C., Paulus,W., Reiser,M., and Oertel,W.H.
(1997). Functional MRI mapping of occipital and frontal cortical activity during
voluntary and imagined saccades. Neurology 49, 416-420.
Bompas,A., Sterling,T., Rafal,R.D., and Sumner,P. (2008). Naso-temporal asymmetry for
signals invisible to the retinotectal pathway. J. Neurophysiol.
Brainard,D.H. (1996). Cone contrast and opponent modulation color spaces. In Human
Color Vision, Kaiser and Boynton, ed. (Washington: Optical Siciety of America).
Brenner,E., Smeets,J.B., and van den Berg,A.V. (2001). Smooth eye movements and
spatial localisation. Vision Res. 41, 2253-2259.
Bridgeman,B., Hendry,D., and Stark,L. (1975). Failure to detect displacement of the
visual world during saccadic eye movements. Vision Res. 15, 719-722.
Bridgeman,B., and Stark,L. (1991). Ocular proprioception and efference copy in
registering visual direction. Vision Res. 31, 1903-1913.
Bristow,D., Haynes,J.D., Sylvester,R., Frith,C.D., and Rees,G. (2005). Blinking
suppresses the neural response to unchanging retinal stimulation. Curr. Biol. 15, 1296-
1300.
Brotchie,P.R., Andersen,R.A., Snyder,L.H., and Goodman,S.J. (1995). Head position
signals used by parietal neurons to encode locations of visual stimuli. Nature 375, 232-
235.

164
Bruce,C.J., and Goldberg,M.E. (1985). Primate frontal eye fields. I. Single neurons
discharging before saccades. J Neurophysiol. 53, 603-635.
Bruce,C.J., Goldberg,M.E., Bushnell,M.C., and Stanton,G.B. (1985). Primate frontal eye
fields. II. Physiological and anatomical correlates of electrically evoked eye movements.
J Neurophysiol. 54, 714-734.
Burr,D.C., Holt,J., Johnstone,J.R., and Ross,J. (1982). Selective depression of motion
sensitivity during saccades. J. Physiol 333, 1-15.
Burr,D.C., Morgan,M.J., and Morrone,M.C. (1999). Saccadic suppression precedes visual
motion analysis. Curr. Biol. 9, 1207-1209.
Burr,D.C., Morrone,M.C., and Ross,J. (1994). Selective suppression of the magnocellular
visual pathway during saccadic eye movements. Nature 371, 511-513.
Burr,D.C., and Ross,J. (1982). Contrast sensitivity at high velocities. Vision Res. 22, 479-
484.
Bushnell,M.C., Goldberg,M.E., and Robinson,D.L. (1981). Behavioral enhancement of
visual responses in monkey cerebral cortex. I. Modulation in posterior parietal cortex
related to selective visual attention. J. Neurophysiol. 46, 755-772.
Buxton,R.B., and Frank,L.R. (1997). A model for the coupling between cerebral blood
flow and oxygen metabolism during neural stimulation. J Cereb Blood Flow Metab 17,
64-72.
Campos,M., Cherian,A., and Segraves,M.A. (2006). Effects of eye position upon activity
of neurons in macaque superior colliculus. J. Neurophysiol. 95, 505-526.
Carpenter,R.H.S. (1988). Movements of the Eyes (London: Pion).
Castet,E., and Masson,G.S. (2000). Motion perception during saccadic eye movements.
Nat. Neurosci. 3, 177-183.
Cavanaugh,J., and Wurtz,R.H. (2004). Subcortical modulation of attention counters
change blindness. J. Neurosci. 24, 11236-11243.
Cholet,N., Seylaz,J., Lacombe,P., and Bonvento,G. (1997). Local uncoupling of the
cerebrovascular and metabolic responses to somatosensory stimulation after neuronal
nitric oxide synthase inhibition. J Cereb Blood Flow Metab 17, 1191-1201.
Christianini,N.S.-T.J. (2000). Support vector machines and other kernel based learning
methods (Cambridge: Cambridge University Press).
Colby,C.L., Duhamel,J.R., and Goldberg,M.E. (1996). Visual, presaccadic, and cognitive
activation of single neurons in monkey lateral intraparietal area. J Neurophysiol. 76,
2841-2852.

165
Connolly,J.D., Goodale,M.A., Goltz,H.C., and Munoz,D.P. (2005). fMRI activation in
the human frontal eye field is correlated with saccadic reaction time. J. Neurophysiol. 94,
605-611.
Connolly,M., and Van Essen,D. (1984). The representation of the visual field in
parvicellular and magnocellular layers of the lateral geniculate nucleus in the macaque
monkey. J Comp Neurol. 226, 544-564.
Cox,D.D., and Savoy,R.L. (2003). Functional magnetic resonance imaging (fMRI) "brain
reading": detecting and classifying distributed patterns of fMRI activity in human visual
cortex. Neuroimage. 19, 261-270.
Cynader,M., and Berman,N. (1972). Receptive-field organization of monkey superior
colliculus. J. Neurophysiol. 35, 187-201.
Darby,D.G., Nobre,A.C., Thangaraj,V., Edelman,R., Mesulam,M.M., and Warach,S.
(1996). Cortical activation in the human brain during lateral saccades using EPISTAR
functional magnetic resonance imaging. Neuroimage. 3, 53-62.
Davis,T.L., Kwong,K.K., Weisskoff,R.M., and Rosen,B.R. (1998). Calibrated functional
MRI: mapping the dynamics of oxidative metabolism. Proc Natl Acad Sci U S A 95,
1834-1839.
DeSouza,J.F., Dukelow,S.P., Gati,J.S., Menon,R.S., Andersen,R.A., and Vilis,T. (2000).
Eye position signal modulates a human parietal pointing region during memory-guided
movements. J. Neurosci. 20, 5835-5840.
DeSouza,J.F., Dukelow,S.P., and Vilis,T. (2002). Eye position signals modulate early
dorsal and ventral visual areas. Cereb. Cortex 12, 991-997.
Deubel,H., Bridgeman,B., and Schneider,W.X. (1998). Immediate post-saccadic
information mediates space constancy. Vision Res. 38, 3147-3159.
Deutschlander,A., Marx,E., Stephan,T., Riedel,E., Wiesmann,M., Dieterich,M., and
Brandt,T. (2005). Asymmetric modulation of human visual cortex activity during 10
degrees lateral gaze (fMRI study). Neuroimage. 28, 4-13.
Diamond,M.R., Ross,J., and Morrone,M.C. (2000). Extraretinal control of saccadic
suppression. J. Neurosci. 20, 3449-3455.
Dickinson,A.R., Calton,J.L., and Snyder,L.H. (2003). Nonspatial saccade-specific
activation in area LIP of monkey parietal cortex. J. Neurophysiol. 90, 2460-2464.
Dodds,C., Machado,L., Rafal,R., and Ro,T. (2002). A temporal/nasal asymmetry for
blindsight in a localisation task: evidence for extrageniculate mediation. Neuroreport 13,
655-658.

166
Dodge,R. (1905). The illusion of clear vision during eye movement. Psychological
Bulletin 3, 193-199.
Dougherty,R.F., Koch,V.M., Brewer,A.A., Fischer,B., Modersitzki,J., and Wandell,B.A.
(2003). Visual field representations and locations of visual areas V1/2/3 in human visual
cortex. J. Vis. 3, 586-598.
Dragoi,V., Sharma,J., and Sur,M. (2000). Adaptation-induced plasticity of orientation
tuning in adult visual cortex. Neuron 28, 287-298.
DuBois,R.M., and Cohen,M.S. (2000). Spatiotopic organization in human superior
colliculus observed with fMRI. Neuroimage. 12, 63-70.
Duffy,F.H., and Burchfiel,J.L. (1975). Eye movement-related inhibition of primate visual
neurons. Brain Res. 89, 121-132.
Duhamel,J.R., Colby,C.L., and Goldberg,M.E. (1992). The updating of the representation
of visual space in parietal cortex by intended eye movements. Science 255, 90-92.
Duhamel,J.R., Colby,C.L., and Goldberg,M.E. (1998). Ventral intraparietal area of the
macaque: congruent visual and somatic response properties. J Neurophysiol. 79(1):126-
36.
Dumoulin,S.O., Bittar,R.G., Kabani,N.J., Baker,C.L., Jr., Le,G.G., Bruce,P.G., and
Evans,A.C. (2000). A new anatomical landmark for reliable identification of human area
V5/MT: a quantitative analysis of sulcal patterning. Cereb. Cortex 10, 454-463.
Duvernoy,H.M. (1999). The Human Brain (New York.
Engel,S., Zhang,X., and Wandell,B. (1997). Colour tuning in human visual cortex
measured with functional magnetic resonance imaging. Nature 388, 68-71.
Engel,S.A., Rumelhart,D.E., Wandell,B.A., Lee,A.T., Glover,G.H., Chichilnisky,E.J.,
and Shadlen,M.N. (1994). fMRI of human visual cortex. Nature 369, 525.
Everling,S., and Munoz,D.P. (2000). Neuronal correlates for preparatory set associated
with pro-saccades and anti-saccades in the primate frontal eye field. J. Neurosci. 20, 387-
400.
Felisberti,F., and Derrington,A.M. (1999). Long-range interactions modulate the contrast
gain in the lateral geniculate nucleus of cats. Vis. Neurosci. 16, 943-956.
Felleman,D.J., and Van Essen,D.C. (1991). Distributed hierarchical processing in the
primate cerebral cortex. Cereb Cortex 1, 1-47.
Fischer,W.H., Schmidt,M., and Hoffmann,K.P. (1998). Saccade-induced activity of
dorsal lateral geniculate nucleus X- and Y-cells during pharmacological inactivation of
the cat pretectum. Vis. Neurosci. 15, 197-210.
167
Fjeld,I.T., Ruksenas,O. and Heggelund,P. (2002). Brainstem modulation of visual
response properties of single cells in the dorsal lateral geniculate nucleus of cat. J
Physiol. 1;543(Pt 2):541-54.
Fox,P.T., and Raichle,M.E. (1986). Focal physiological uncoupling of cerebral blood
flow and oxidative metabolism during somatosensory stimulation in human subjects.
Proc. Natl. Acad. Sci. U. S. A 83, 1140-1144.
Fox,P.T., Raichle,M.E., Mintun,M.A., and Dence,C. (1988). Nonoxidative glucose
consumption during focal physiologic neural activity. Science 241, 462-464.
Frassinetti,F., Angeli,V., Meneghello,F., Avanzi,S., and Ladavas,E. (2002). Long-lasting
amelioration of visuospatial neglect by prism adaptation. Brain 125, 608-623.
Fries,W. (1984). Cortical projections to the superior colliculus in the macaque monkey: a
retrograde study using horseradish peroxidase. J. Comp Neurol. 230, 55-76.
Friston,J.A. (1995). Spatial registration and normalization of images. Human Brain
Mapping 3, 165-189.
Friston,K.J., Buechel,C., Fink,G.R., Morris,J., Rolls,E., and Dolan,R.J. (1997).
Psychophysiological and modulatory interactions in neuroimaging. Neuroimage. 6, 218-
229.
Friston,K.J., Harrison,L., and Penny,W. (2003b). Dynamic causal modelling.
Neuroimage. 19, 1273-1302.
Friston,K.J., Harrison,L., and Penny,W. (2003a). Dynamic causal modelling.
Neuroimage. 19, 1273-1302.
Friston,K.J., Josephs,O., Rees,G., and Turner,R. (1998). Nonlinear event-related
responses in fMRI. Magn Reson. Med. 39, 41-52.
Friston,K.J., Mechelli,A., Turner,R., and Price,C.J. (2000). Nonlinear responses in fMRI:
the Balloon model, Volterra kernels, and other hemodynamics. Neuroimage. 12, 466-477.
Friston,K.J., Williams,S., Howard,R., Frackowiak,R.S., and Turner,R. (1996).
Movement-related effects in fMRI time-series. Magn Reson Med 35, 346-355.
Funke,K. and Eysel,U.T. (1998). Inverse correlation of firing patterns of single
topographically matched perigeniculate neurons and cat dorsal lateral geniculate relay
cells. Vis Neurosci. 15(4):711-29.
Garcia-Perez,M.A., and Peli,E. (2001). Intrasaccadic perception. J. Neurosci. 21, 7313-
7322.
Gauthier,G.M., Nommay,D., and Vercher,J.L. (1990). The role of ocular muscle
proprioception in visual localization of targets. Science 249, 58-61.

168
Gilbert,C.D., Das,A., Ito,M., Kapadia,M., and Westheimer,G. (1996). Spatial integration
and cortical dynamics. PNAS 93, 615-622.
Gilchrist,I.D., Brown,V., and Findlay,J.M. (1997). Saccades without eye movements.
Nature 390, 130-131.
Glover,G.H., Li,T.Q., and Ress,D. (2000). Image-based method for retrospective
correction of physiological motion effects in fMRI: RETROICOR. Magn Reson. Med.
44, 162-167.
Gnadt,J.W., and Andersen,R.A. (1988). Memory related motor planning activity in
posterior parietal cortex of macaque. Exp. Brain Res. 70, 216-220.
Goldberg,M.E., Bisley,J., Powell,K.D., Gottlieb,J., and Kusunoki,M. (2002). The role of
the lateral intraparietal area of the monkey in the generation of saccades and visuospatial
attention. Ann. N. Y. Acad. Sci. 956, 205-215.
Goldberg,M.E., and Wurtz,R.H. (1972). Activity of superior colliculus in behaving
monkey. I. Visual receptive fields of single neurons. J. Neurophysiol. 35, 542-559.
Goodale,M.A. (1998). Visuomotor control: Where does vision end and action begin?
Current Biology 8, R489-R491.
Grosbras,M.H., Laird,A.R., and Paus,T. (2005). Cortical regions involved in eye
movements, shifts of attention, and gaze perception. Hum. Brain Mapp. 25, 140-154.
Guimaraes,A.R., Melcher,J.R., Talavage,T.M., Baker,J.R., Ledden,P., Rosen,B.R.,
Kiang,N.Y., Fullerton,B.C., and Weisskoff,R.M. (1998). Imaging subcortical auditory
activity in humans. Hum. Brain Mapp. 6, 33-41.
Guitton D (1992). Control of saccadic eye and gaze movements by the superior colliculus
and basal ganglia. In Eye Movements, Carpenter RHS, ed. (London: Macmillan), pp.
244-276.
Hagler,D.J., Jr., and Sereno,M.I. (2006). Spatial maps in frontal and prefrontal cortex.
Neuroimage. 29, 567-577.
Hanes,D.P., Patterson,W.F., and Schall,J.D. (1998). Role of frontal eye fields in
countermanding saccades: visual, movement, and fixation activity. J Neurophysiol. 79,
817-834.
Hanes,D.P., and Wurtz,R.H. (2001). Interaction of the frontal eye field and superior
colliculus for saccade generation. J Neurophysiol. 85(2):804-15.
Hanes,D.P., and Schall,J.D. (1996). Neural control of voluntary movement initiation.
Science 274, 427-430.
169
Haynes,J.D., Deichmann,R., and Rees,G. (2005). Eye-specific effects of binocular rivalry
in the human lateral geniculate nucleus. Nature 438, 496-499.
Haynes,J.D., Lotto,R.B., and Rees,G. (2004). Responses of human visual cortex to
uniform surfaces. Proc. Natl. Acad. Sci. U. S. A 101, 4286-4291.
Haynes,J.D., and Rees,G. (2005). Predicting the orientation of invisible stimuli from
activity in human primary visual cortex. Nat. Neurosci. 8, 686-691.
Haynes,J.D., and Rees,G. (2006). Decoding mental states from brain activity in humans.
Nat. Rev. Neurosci. 7, 523-534.
Hilbig,H., Bidmon,H.J., Zilles,K., and Busecke,K. (1999). Neuronal and glial structures
of the superficial layers of the human superior colliculus. Anat. Embryol. (Berl) 200,
103-115.
Hoge,R.D., Atkinson,J., Gill,B., Crelier,G.R., Marrett,S., and Pike,G.B. (1999).
Investigation of BOLD signal dependence on cerebral blood flow and oxygen
consumption: the deoxyhemoglobin dilution model. Magn Reson Med 42, 849-863.
Holt,E.B. (1901). Eye-movement and central anaesthesia. Harvard Psychological Studies
1, 3-45.
Honda,H. (1993). Saccade-contingent displacement of the apparent position of visual
stimuli flashed on a dimly illuminated structured background. Vision Res. 33, 709-716.
Honda,H. (1995). Visual mislocalization produced by a rapid image displacement on the
retina: examination by means of dichoptic presentation of a target and its background
scene. Vision Res. 35, 3021-3028.
Hubel,D.H., LeVay,S., and Wiesel,T.N. (1975). Mode of termination of retinotectal
fibers in macaque monkey: an autoradiographic study. Brain Res. 96, 25-40.
Huerta,M.F., Krubitzer,L.A., and Kaas,J.H. (1986). Frontal eye field as defined by
intracortical microstimulation in squirrel monkeys, owl monkeys, and macaque monkeys:
I. Subcortical connections. J Comp Neurol. 253, 415-439.
Huerta,M.F., Krubitzer,L.A., and Kaas,J.H. (1987). Frontal eye field as defined by
intracortical microstimulation in squirrel monkeys, owl monkeys, and macaque monkeys.
II. Cortical connections. J Comp Neurol. 265, 332-361.
Hyder,F., Rothman,D.L., Mason,G.F., Rangarajan,A., Behar,K.L., and Shulman,R.G.
(1997). Oxidative glucose metabolism in rat brain during single forepaw stimulation: a
spatially localized 1H[13C] nuclear magnetic resonance study. J. Cereb. Blood Flow
Metab 17, 1040-1047.
Hyder,F., Shulman,R.G., and Rothman,D.L. (1998). A model for the regulation of
cerebral oxygen delivery. J Appl Physiol 85, 554-564.

170
Ignashchenkova,A., Dicke,P.W., Haarmeier,T., and Thier,P. (2004). Neuron-specific
contribution of the superior colliculus to overt and covert shifts of attention. Nat.
Neurosci. 7, 56-64.
Janssen,P., and Shadlen,M.N. (2005). A representation of the hazard rate of elapsed time
in macaque area LIP. Nat. Neurosci. 8, 234-241.
Johnson MH (1990). Cortical maturation and the development of visual attention in early
infancy. Journal of Cognitive Neuroscience 2, 81-95.
Josephs,O., Houseman,A.M., Friston,K., Turner,R. (1997). Physiological noise modelling
for multi-slice EPI fMRI using SPM. Proceedings, Fifth Annual Meeting of the ISMRM,
1682.
Kamitani,Y., and Tong,F. (2005). Decoding the visual and subjective contents of the
human brain. Nat. Neurosci. 8, 679-685.
Kamitani,Y., and Tong,F. (2006). Decoding seen and attended motion directions from
activity in the human visual cortex. Curr. Biol. 16, 1096-1102.
Karten,H.J.(1989). The origins of neocortex. Connections and laminations as distinct
events in evolution. Journal of Cognitive Neuroscience 1, 291-301.
Kastner,S., O'Connor,D.H., Fukui,M.M., Fehd,H.M., Herwig,U., and Pinsk,M.A. (2004).
Functional imaging of the human lateral geniculate nucleus and pulvinar. J.
Neurophysiol. 91, 438-448.
Kastner,S., De,W.P., Desimone,R., and Ungerleider,L.G. (1998). Mechanisms of directed
attention in the human extrastriate cortex as revealed by functional MRI. Science 282,
108-111.
King AJ. (2004). The superior colliculus. Curr Biol. 14(9):R335-8.
Kleiser,R., Seitz,R.J., and Krekelberg,B. (2004). Neural correlates of saccadic
suppression in humans. Curr. Biol. 14, 386-390.
Kristjansson,A., Vandenbroucke,M.W., and Driver,J. (2004). When pros become cons for
anti- versus prosaccades: factors with opposite or common effects on different saccade
types. Exp. Brain Res. 155, 231-244.
Kuypers,H.G., and Lawrence,D.G. (1967). Cortical projections to the red nucleus and the
brain stem in the Rhesus monkey. Brain Res. 4, 151-188.
Kwong,K.K., Belliveau,J.W., Chesler,D.A., Goldberg,I.E., Weisskoff,R.M.,
Poncelet,B.P., Kennedy,D.N., Hoppel,B.E., Cohen,M.S., Turner,R., and . (1992).
Dynamic magnetic resonance imaging of human brain activity during primary sensory
stimulation. Proc. Natl. Acad. Sci. U. S. A 89, 5675-5679.

171
Laemle,L.K. (1981). A Golgy study of cellular morphology in the superficial layers of
superior colliculus man, Saimiri, and Macaca. J. Hirnforsch. 22, 253-263.
Lamme,V.A., and Roelfsema,P.R. (2000). The distinct modes of vision offered by
feedforward and recurrent processing. Trends Neurosci 23, 571-579.
LeVay,S., Connolly,M., Houde,J., and Van Essen,D.C. (1985). The complete pattern of
ocular dominance stripes in the striate cortex and visual field of the macaque monkey. J.
Neurosci. 5, 486-501.
Lewis,T.L., and Maurer,D. (1992). The development of the temporal and nasal visual
fields during infancy. Vision Res. 32, 903-911.
Lie,C., Specht,K., RitzlA., Eickhoff,S., Stephan,K.E., Meinke,A., Ziles,K., Fink,G.R
(2004). fMRI delineates asymmetrical representation of nasotemporal visual hemifields
in human cortex - a neural substrate for functional lateralization in the visual system.
Proceedings 10th
Meeting OHBM.
Logothetis,N.K., Pauls,J., Augath,M., Trinath,T., and Oeltermann,A. (2001).
Neurophysiological investigation of the basis of the fMRI signal. Nature 412, 150-157.
Luck,S.J., Chelazzi,L., Hillyard,S.A., and Desimone,R. (1997). Neural mechanisms of
spatial selective attention in areas V1, V2, and V4 of macaque visual cortex. J.
Neurophysiol. 77, 24-42.
Luna,B., Thulborn,K.R., Strojwas,M.H., McCurtain,B.J., Berman,R.A., Genovese,C.R.,
and Sweeney,J.A. (1998). Dorsal cortical regions subserving visually guided saccades in
humans: an fMRI study. Cereb. Cortex 8, 40-47.
Lynch,J.C., Graybiel,A.M., and Lobeck,L.J. (1985). The differential projection of two
cytoarchitectonic subregions of the inferior parietal lobule of macaque upon the deep
layers of the superior colliculus. J. Comp Neurol. 235, 241-254.
Magistretti,P.J., and Pellerin,L. (1999). Cellular mechanisms of brain energy metabolism
and their relevance to functional brain imaging. Philos Trans R Soc Lond B Biol Sci 354,
1155-1163.
Malpeli,J.G., and Baker,F.H. (1975). The representation of the visual field in the lateral
geniculate nucleus of Macaca mulatta. J Comp Neurol. 161, 569-594.
Mateeff,S., Yakimoff,N., and Dimitrov,G. (1981). Localization of brief visual stimuli
during pursuit eye movements. Acta Psychol. (Amst) 48, 133-140.
McPeek,R.M., and Keller,E.L. (2004a). Deficits in saccade target selection after
inactivation of superior colliculus. Nat. Neurosci. 7, 757-763.
McPeek,R.M., and Keller,E.L. (2004b). Deficits in saccade target selection after
inactivation of superior colliculus. Nat. Neurosci. 7, 757-763.
172
Merriam,E.P., Genovese,C.R., and Colby,C.L. (2003). Spatial updating in human parietal
cortex. Neuron 39, 361-373.
Michels,L., and Lappe,M. (2004). Contrast dependency of sacadic compression and
suppression. Vision Res. 44, 2327-2336.
Milner,A.D., and Goodale,M.A. (1995). The Visual Brain in Action (Oxford: Oxford
University Press).
Mintun,M.A., Lundstrom,B.N., Snyder,A.Z., Vlassenko,A.G., Shulman,G.L., and
Raichle,M.E. (2001). Blood flow and oxygen delivery to human brain during functional
activity: theoretical modeling and experimental data. Proc Natl Acad Sci U S A 98, 6859-
6864.
Moore,T., and Armstrong,K.M. (2003a). Selective gating of visual signals by
microstimulation of frontal cortex. Nature 421, 370-373.
Moore,T., and Armstrong,K.M. (2003b). Selective gating of visual signals by
microstimulation of frontal cortex. Nature 421, 370-373.
Moore,T., and Fallah,M. (2001). Control of eye movements and spatial attention. Proc.
Natl. Acad. Sci. U. S. A 98, 1273-1276.
Moore,T., and Fallah,M. (2004). Microstimulation of the frontal eye field and its effects
on covert spatial attention. J. Neurophysiol. 91, 152-162.
Moors,J., and Vendrik,A.J. (1979). Responses of single units in the monkey superior
colliculus to stationary flashing stimuli. Exp. Brain Res. 35, 333-347.
Moran,J., and Desimone,R. (1985). Selective attention gates visual processing in the
extrastriate cortex. Science 229, 782-784.
Morrone,M.C., Ross,J., and Burr,D. (2005). Saccadic eye movements cause compression
of time as well as space. Nat. Neurosci. 8, 950-954.
Morrone,M.C., Ross,J., and Burr,D.C. (1997). Apparent position of visual targets during
real and simulated saccadic eye movements. J. Neurosci. 17, 7941-7953.
Movshon,J.A., and Lennie,P. (1979). Pattern-selective adaptation in visual cortical
neurones. Nature 278, 850-852.
Muller,J.R., Philiastides,M.G., and Newsome,W.T. (2005b). Microstimulation of the
superior colliculus focuses attention without moving the eyes. Proc. Natl. Acad. Sci. U. S.
A 102, 524-529.
Muller,J.R., Philiastides,M.G., and Newsome,W.T. (2005a). Microstimulation of the
superior colliculus focuses attention without moving the eyes. Proc. Natl. Acad. Sci. U. S.
A 102, 524-529.
173
Munoz,D.P., and Wurtz,R.H. (1993). Fixation cells in monkey superior colliculus. I.
Characteristics of cell discharge. J. Neurophysiol. 70, 559-575.
Munoz,D.P., Wurtz,R.H. (1993). Fixation cells in monkey superior colliculus. II.
Reversible activation and deactivation. J Neurophysiol. 70(2):576-89.
Munoz,D.P., & Wurtz,R.H. (1995a). Saccade-related activity in monkey superior
colliculus 1. Characteristics of burst and buildup cells. J Neurophysiol.
73(6), 2313-2333.
Munoz,D.P., & Wurtz,R.H. (1995b). Saccade-related activity in monkey superior
colliculus 2. Spread of activity during saccades. J Neurophysiol. 73(6),
2334-2348.
Murata,A., Gallese,V., Kaseda,M., and Sakata,H. (1996). Parietal neurons related to
memory-guided hand manipulation. J Neurophysiol. 75, 2180-2186.
Nieman,D.R., Hayashi,R., Andersen,R.A., and Shimojo,S. (2005). Gaze direction
modulates visual aftereffects in depth and color. Vision Res. 45, 2885-2894.
Nishida,S., Motoyoshi,I., Andersen,R.A., and Shimojo,S. (2003). Gaze modulation of
visual aftereffects. Vision Res. 43, 639-649.
O'Connor,D.H., Fukui,M.M., Pinsk,M.A., and Kastner,S. (2002). Attention modulates
responses in the human lateral geniculate nucleus. Nat. Neurosci. 5, 1203-1209.
Obermayer,K., and Blasdel,G.G. (1993). Geometry of orientation and ocular dominance
columns in monkey striate cortex. J Neurosci 13, 4114-4129.
Ogawa,S., Lee,T.M., Nayak,A.S., and Glynn,P. (1990). Oxygenation-sensitive contrast in
magnetic resonance image of rodent brain at high magnetic fields. Magn Reson. Med. 14,
68-78.
Pauling,L., and Coryell,C.D. (1936). The Magnetic Properties and Structure of the
Hemochromogens and Related Substances. Proc. Natl. Acad. Sci. U. S. A 22, 159-163.
Paus,T., Marrett,S., Worsley,K.J., and Evans,A.C. (1995). Extraretinal modulation of
cerebral blood flow in the human visual cortex: implications for saccadic suppression. J.
Neurophysiol. 74, 2179-2183.
Penny,W.D., Stephan,K.E., Mechelli,A., and Friston,K.J. (2004). Comparing dynamic
causal models. Neuroimage. 22, 1157-1172.
Perry,V.H., and Cowey,A. (1985). The ganglion cell and cone distributions in the
monkey's retina: implications for central magnification factors. Vision Res. 25, 1795-
1810.

174
Perry,V.H., and Cowey,A. (1984). Retinal ganglion cells that project to the superior
colliculus and pretectum in the macaque monkey. Neuroscience 12, 1125-1137.
Pisella,L., Rode,G., Farne,A., Boisson,D., and Rossetti,Y. (2002). Dissociated long
lasting improvements of straight-ahead pointing and line bisection tasks in two
hemineglect patients. Neuropsychologia 40, 327-334.
Platt,M.L., and Glimcher,P.W. (1999). Neural correlates of decision variables in parietal
cortex. Nature 400, 233-238.
Pollack,J.G., and Hickey,T.L. (1979). The distribution of retino-collicular axon terminals
in rhesus monkey. J. Comp Neurol. 185, 587-602.
Polyak,S.L. (1957). The vertebrate visual system. (Chicago: University of Chicago
Press).
Porta,J.B. (1593). De refractione optices parte: Libri novem. (Naples: Carlinum &
Pacem).
Posner M I Cohen Y (1984). Components of visual orientating. In Attention and
performance X, Douma H Bouwhuis D, ed. (London: Lawrence Erlbaum), pp. 531-556.
Powers,W.J., Hirsch,I.B., and Cryer,P.E. (1996). Effect of stepped hypoglycemia on
regional cerebral blood flow response to physiological brain activation. Am J Physiol
270, H554-H559.
Przybyszewski,A.W., Gaska,J.P., Foote,W., and Pollen,D.A. (2000). Striate cortex
increases contrast gain of macaque LGN neurons. Vis. Neurosci. 17, 485-494.
Rafal,R., Henik,A., Smith,J. (1991). Extrageniculate contributions to reflex visual
orientating in normal humans: A temporal hemifield advantage. Journal of Cognitive
Neuroscience 3, 322-328.
Rafal,R., Smith,J., Krantz,J., Cohen,A., and Brennan,C. (1990). Extrageniculate vision in
hemianopic humans: saccade inhibition by signals in the blind field. Science 250, 118-
121.
Raichle,M.E., MacLeod,A.M., Snyder,A.Z., Powers,W.J., Gusnard,D.A., and
Shulman,G.L. (2001). A default mode of brain function. Proc. Natl. Acad. Sci. U. S. A
98, 676-682.
Rambold,H., El,B., I, and Helmchen,C. (2004). Differential effects of blinks on
horizontal saccade and smooth pursuit initiation in humans. Exp. Brain Res. 156, 314-
324.
Ramcharan,E.J., Gnadt,J.W., and Sherman,S.M. (2001). The effects of saccadic eye
movements on the activity of geniculate relay neurons in the monkey. Vis. Neurosci. 18,
253-258.

175
Rees,G., Friston,K., and Koch,C. (2000). A direct quantitative relationship between the
functional properties of human and macaque V5. Nat Neurosci 3, 716-723.
Rees,G., Frith,C.D., and Lavie,N. (1997). Modulating irrelevant motion perception by
varying attentional load in an unrelated task. Science 278, 1616-1619.
Reppas,J.B., Usrey,W.M., and Reid,R.C. (2002). Saccadic eye movements modulate
visual responses in the lateral geniculate nucleus. Neuron 35, 961-974.
Reynolds,J.H., and Desimone,R. (2003). Interacting roles of attention and visual salience
in V4. Neuron 37, 853-863.
Riggs,L.A., Merton,P.A., and Morton,H.B. (1974). Suppression of visual phosphenes
during saccadic eye movements. Vision Res. 14, 997-1011.
Rizzolatti,G., Riggio,L., Dascola,I., and Umilta,C. (1987). Reorienting attention across
the horizontal and vertical meridians: evidence in favor of a premotor theory of attention.
Neuropsychologia 25, 31-40.
Robinson DL, McClurkin JW. (1989). The visual superior colliculus and pulvinar. Rev
Oculomot Res. 3:337-60.
Roitman,J.D., and Shadlen,M.N. (2002). Response of neurons in the lateral intraparietal
area during a combined visual discrimination reaction time task. J. Neurosci. 22, 9475-
9489.
Rosenbluth,D., and Allman,J.M. (2002). The effect of gaze angle and fixation distance on
the responses of neurons in V1, V2, and V4. Neuron 33, 143-149.
Ross,J., Morrone,M.C., and Burr,D.C. (1997). Compression of visual space before
saccades. Nature 386, 598-601.
Rossetti,Y., Rode,G., Pisella,L., Farne,A., Li,L., Boisson,D., and Perenin,M.T. (1998).
Prism adaptation to a rightward optical deviation rehabilitates left hemispatial neglect.
Nature 395, 166-169.
Rothbart,M.K., Posner,M.I., Boylan,A. (1990). Regulatory mechanisms in infant
development. In The development of attention: Research and theory, Enns J T, ed.
(Amsterdam: Elsevier), pp. 139-160.
Ruff,C.C., Blankenburg,F., Bjoertomt,O., Bestmann,S., Freeman,E., Haynes,J.D.,
Rees,G., Josephs,O., Deichmann,R., and Driver,J. (2006). Concurrent TMS-fMRI and
psychophysics reveal frontal influences on human retinotopic visual cortex. Curr. Biol.
16, 1479-1488.
Sato,M., and Uchikawa,K. (1999). Increment-threshold spectral sensitivity during
saccadic eye movements in uniform visual field. Vision Res. 39, 3951-3959.

176
Saul,A.B., and Cynader,M.S. (1989). Adaptation in single units in visual cortex: the
tuning of aftereffects in the spatial domain. Vis. Neurosci. 2, 593-607.
Schall,J.D., Morel,A., King,D.J., and Bullier,J. (1995). Topography of visual cortex
connections with frontal eye field in macaque: convergence and segregation of
processing streams. J Neurosci 15, 4464-4487.
Schall,J.D., and Thompson,K.G. (1999). Neural selection and control of visually guided
eye movements. Annu. Rev. Neurosci 22, 241-259.
Schiller,P.H., and Malpeli,J.G. (1977). Properties and tectal projections of monkey retinal
ganglion cells. J. Neurophysiol. 40, 428-445.
Schneider,K.A., and Kastner,S. (2005). Visual responses of the human superior
colliculus: a high-resolution functional magnetic resonance imaging study. J.
Neurophysiol. 94, 2491-2503.
Schneider,K.A., Richter,M.C., and Kastner,S. (2004). Retinotopic organization and
functional subdivisions of the human lateral geniculate nucleus: a high-resolution
functional magnetic resonance imaging study. J Neurosci 24, 8975-8985.
Schwartz,W.J., Smith,C.B., Davidsen,L., Savaki,H., Sokoloff,L., Mata,M., Fink,D.J., and
Gainer,H. (1979). Metabolic mapping of functional activity in the hypothalamo-
neurohypophysial system of the rat. Science 205, 723-725.
Segraves,M.A. (1992). Activity of monkey frontal eye field neurons projecting to
oculomotor regions of the pons. J Neurophysiol. 68, 1967-1985.
Segraves,M.A., and Goldberg,M.E. (1987). Functional properties of corticotectal neurons
in the monkey's frontal eye field. J Neurophysiol. 58, 1387-1419.
Sereno,M.I., Dale,A.M., Reppas,J.B., Kwong,K.K., Belliveau,J.W., Brady,T.J.,
Rosen,B.R., and Tootell,R.B. (1995). Borders of multiple visual areas in humans revealed
by functional magnetic resonance imaging. Science 268, 889-893.
Sereno,M.I., Pitzalis,S., and Martinez,A. (2001). Mapping of contralateral space in
retinotopic coordinates by a parietal cortical area in humans. Science 294, 1350-1354.
Sherman,S.M., and Guillery,R.W. (2002). The role of the thalamus in the flow of
information to the cortex. Philos. Trans. R. Soc. Lond B Biol. Sci. 357, 1695-1708.
Shulman,R.G., Hyder,F., and Rothman,D.L. (2001). Cerebral energetics and the glycogen
shunt: neurochemical basis of functional imaging. Proc Natl Acad Sci U S A 98, 6417-
6422.
Shulman,R.G., and Rothman,D.L. (1998). Interpreting functional imaging studies in
terms of neurotransmitter cycling. Proc Natl Acad Sci U S A 95, 11993-11998.

177
Sibson,N.R., Dhankhar,A., Mason,G.F., Rothman,D.L., Behar,K.L., and Shulman,R.G.
(1998). Stoichiometric coupling of brain glucose metabolism and glutamatergic neuronal
activity. Proc Natl Acad Sci U S A 95, 316-321.
Sillito,A.M., and Jones,H.E. (2002). Corticothalamic interactions in the transfer of visual
information. Philos. Trans. R. Soc. Lond B Biol. Sci. 357, 1739-1752.
Smith,A.T., Singh,K.D., Williams,A.L., and Greenlee,M.W. (2001). Estimating receptive
field size from fMRI data in human striate and extrastriate visual cortex. Cereb. Cortex
11, 1182-1190.
Snyder,L.H., Batista,A.P., and Andersen,R.A. (1997). Coding of intention in the posterior
parietal cortex. Nature 386, 167-170.
Sommer,M.A., and Tehovnik,E.J. (1997). Reversible inactivation of macaque frontal eye
field. Exp. Brain Res. 116, 229-249.
Sommer,M.A., and Wurtz,R.H. (1998). Frontal eye field neurons orthodromically
activated from the superior colliculus. J Neurophysiol. 80, 3331-3335.
Sommer,M.A., and Wurtz,R.H. (2001). Frontal eye field sends delay activity related to
movement, memory, and vision to the superior colliculus. J Neurophysiol. 85, 1673-
1685.
Sommer,M.A., and Wurtz,R.H. (2006). Influence of the thalamus on spatial visual
processing in frontal cortex. Nature. 16;444(7117):374-7.
Soon,C.S., Brass,M., Heinze,H.J., and Haynes,J.D. (2008). Unconscious determinants of
free decisions in the human brain. Nat. Neurosci. 11, 543-545.
Sparks,D.L. (2002). The brainstem control of saccadic eye movements. Nat. Rev.
Neurosci. 3, 952-964.
Sparks DL, Hartwich-Young R. (1989). The deep layers of the superior colliculus. Rev
Oculomot Res. 3:213-55.
Stanton,G.B., Bruce,C.J., and Goldberg,M.E. (1995). Topography of projections to
posterior cortical areas from the macaque frontal eye fields. J Comp Neurol. 353, 291-
305.
Stephan,K.E., Harrison,L.M., Penny,W.D., and Friston,K.J. (2004b). Biophysical models
of fMRI responses. Curr. Opin. Neurobiol. 14, 629-635.
Stephan,K.E., Harrison,L.M., Penny,W.D., and Friston,K.J. (2004a). Biophysical models
of fMRI responses. Curr. Opin. Neurobiol. 14, 629-635.
Sterling,P. (1973). Quantitative mapping with the electron microscope: retinal terminals
in the superior colliculus. Brain Res. 54, 347-354.

178
Stettler,D.D., Das,A., Bennett,J., and Gilbert,C.D. (2002). Lateral connectivity and
contextual interactions in macaque primary visual cortex. Neuron 36, 739-750.
Stone,J., and Johnston,E. (1981). The topography of primate retina: a study of the human,
bushbaby, and new- and old-world monkeys. J. Comp Neurol. 196, 205-223.
Sumner,P., Adamjee,T., and Mollon,J.D. (2002). Signals invisible to the collicular and
magnocellular pathways can capture visual attention. Curr. Biol. 12, 1312-1316.
Super,H., van der,T.C., Spekreijse,H., and Lamme,V.A. (2004). Correspondence of
presaccadic activity in the monkey primary visual cortex with saccadic eye movements.
Proc. Natl. Acad. Sci. U. S. A 101, 3230-3235.
Sylvester,R., Haynes,J.D., and Rees,G. (2005). Saccades differentially modulate human
LGN and V1 responses in the presence and absence of visual stimulation. Curr. Biol. 15,
37-41.
Tardif,E., Delacuisine,B., Probst,A., and Clarke,S. (2005). Intrinsic connectivity of
human superior colliculus. Exp. Brain Res. 166, 316-324.
Taylor,P.C., Nobre,A.C., and Rushworth,M.F. (2006). FEF TMS Affects Visual Cortical
Activity. Cereb. Cortex.
Tehovnik,E.J., Sommer,M.A., Chou,I.H., Slocum,W.M., and Schiller,P.H. (2000b). Eye
fields in the frontal lobes of primates. Brain Res. Brain Res. Rev. 32, 413-448.
Tehovnik,E.J., Sommer,M.A., Chou,I.H., Slocum,W.M., and Schiller,P.H. (2000a). Eye
fields in the frontal lobes of primates. Brain Res. Brain Res. Rev. 32, 413-448.
Teo,P.C., Sapiro,G., and Wandell,B.A. (1997). Creating connected representations of
cortical gray matter for functional MRI visualization. IEEE Trans. Med. Imaging 16, 852-
863.
Thiele,A., Henning,P., Kubischik,M., and Hoffmann,K.P. (2002). Neural mechanisms of
saccadic suppression. Science 295, 2460-2462.
Thilo,K.V., Santoro,L., Walsh,V., and Blakemore,C. (2004). The site of saccadic
suppression. Nat. Neurosci. 7, 13-14.
Thompson,K.G., and Bichot,N.P. (2005). A visual salience map in the primate frontal eye
field. Prog. Brain Res. 147, 251-262.
Tolias,A.S., Moore,T., Smirnakis,S.M., Tehovnik,E.J., Siapas,A.G., and Schiller,P.H.
(2001). Eye movements modulate visual receptive fields of V4 neurons. Neuron 29, 757-
767.
Trotter,Y., and Celebrini,S. (1999). Gaze direction controls response gain in primary
visual-cortex neurons. Nature 398, 239-242.

179
Turner,R., Howseman,A., Rees,G.E., Josephs,O., and Friston,K. (1998). Functional
magnetic resonance imaging of the human brain: data acquisition and analysis. Exp.
Brain Res. 123, 5-12.
Turner,R., Le,B.D., Moonen,C.T., Despres,D., and Frank,J. (1991). Echo-planar time
course MRI of cat brain oxygenation changes. Magn Reson. Med. 22, 159-166.
Ungerleider,L.G., and Mishkin,M. (1982). Two cortical visual systems. In Analysis of
Visual Behavior, D.J. Ingle, M.A. Goodale, and R.J.W. Mansfield, eds. (Cambridge,
Massachusetts: MIT Press), pp. 549-586.
Vafaee,M.S., and Gjedde,A. (2000). Model of blood-brain transfer of oxygen explains
nonlinear flow-metabolism coupling during stimulation of visual cortex. J Cereb Blood
Flow Metab 20, 747-754.
Vallines,I., and Greenlee,M.W. (2006). Saccadic suppression of retinotopically localized
blood oxygen level-dependent responses in human primary visual area V1. J. Neurosci.
26, 5965-5969.
Van Buren,J.M. (1963). The Retinal Ganglion Cell Layer (Springfield, IL: Charles C.
Thomas Publishers).
Van Essen,D.C., Newsome,W.T., and Maunsell,J.H. (1984). The visual field
representation in striate cortex of the macaque monkey: asymmetries, anisotropies, and
individual variability. Vision Res. 24, 429-448.
Vanzetta,I., and Grinvald,A. (1999). Increased cortical oxidative metabolism due to
sensory stimulation: implications for functional brain imaging. Science 286, 1555-1558.
Vapnik,V.N. (1995). The Nature of Statistical Learning Theory (New York.
Villringer,A., and Dirnagl,U. (1995). Coupling of brain activity and cerebral blood flow:
basis of functional neuroimaging. Cerebrovasc. Brain Metab Rev. 7, 240-276.
Volkmann,F.C. (1986). Human visual suppression. Vision Res. 26, 1401-1416.
Volkmann,F.C., Riggs,L.A., and Moore,R.K. (1980). Eyeblinks and visual suppression.
Science 207, 900-902.
Vuilleumier,P., and Schwartz,S. (2001). Modulation of visual perception by eye gaze
direction in patients with spatial neglect and extinction. Neuroreport 12, 2101-2104.
Waitzman,D.M., Ma,T.P., Optican,L.M., and Wurtz,R.H. (1991). Superior colliculus
neurons mediate the dynamic characteristics of saccades. J. Neurophysiol. 66, 1716-1737.
Walker,R., Mannan,S., Maurer,D., Pambakian,A.L., and Kennard,C. (2000). The
oculomotor distractor effect in normal and hemianopic vision. Proc. Biol. Sci. 267, 431-
438.
180
Wandell,B.A. (1995). Foundations of vision. Mass. Sinauer Associates.
Wandell,B.A. (1999). Computational neuroimaging of human visual cortex. Annu. Rev.
Neurosci. 22, 145-173.
Wandell,B.A., Chial,S., and Backus,B.T. (2000). Visualization and measurement of the
cortical surface. J. Cogn Neurosci. 12, 739-752.
Wardak,C., Ibos,G., Duhamel,J.R., and Olivier,E. (2006). Contribution of the monkey
frontal eye field to covert visual attention. J. Neurosci. 26, 4228-4235.
Wardak,C., Olivier,E., and Duhamel,J.R. (2002). Saccadic target selection deficits after
lateral intraparietal area inactivation in monkeys. J. Neurosci. 22, 9877-9884.
Weir,C.R., Knox,P.C., and Dutton,G.N. (2000). Does extraocular muscle proprioception
influence oculomotor control? Br. J. Ophthalmol. 84, 1071-1074.
Wenzel,R., Wobst,P., Heekeren,H.H., Kwong,K.K., Brandt,S.A., Kohl,M., Obrig,H.,
Dirnagl,U., and Villringer,A. (2000). Saccadic suppression induces focal
hypooxygenation in the occipital cortex. J. Cereb. Blood Flow Metab 20, 1103-1110.
Weyand,T.G., and Malpeli,J.G. (1993). Responses of neurons in primary visual cortex
are modulated by eye position. J. Neurophysiol. 69, 2258-2260.
Williams,C., Azzopardi,P., and Cowey,A. (1995). Nasal and temporal retinal ganglion
cells projecting to the midbrain: implications for "blindsight". Neuroscience 65, 577-586.
Wilson,M.E., and Toyne,M.J. (1970). Retino-tectal and cortico-tectal projections in
Macaca mulatta. Brain Res. 24, 395-406.
Wurtz,R.H., and Goldberg,M.E. (1972). Activity of superior colliculus in behaving
monkey. 3. Cells discharging before eye movements. J. Neurophysiol. 35, 575-586.
Yang,Y., Cao,P., Yang,Y., and Wang,S.R. (2008). Corollary discharge circuits for
saccadic modulation of the pigeon visual system. Nat. Neurosci. 11, 595-602.
Zuber,B.L., and Stark,L. (1966). Saccadic suppression: elevation of visual threshold
associated with saccadic eye movements. Exp. Neurol. 16, 65-79.