Embed Size (px)
Citation preview
1
The Interaction of Obesity Related Genotypes, Phenotypes, and Economics: An Experimental Economics Approach with Mice
George C. Davisa,b, Joanna Jacobb, and Deborah J. Goodb
Selected Paper for Presentation at the Agricultural and Applied Economics Association’s 2011 AAEA&NAREA Joint Annual Meetings, Pittsburgh, Pennsylvania, July 24-26, 2011
a Department of Agricultural and Applied Economics Virginia Polytechnic Institute and State 214 Hutcheson Hall Blacksburg, VA 24061 United States bDepartment of Human Nutrition, Foods, and Exercise Virginia Polytechnic Institute and State University 1020 Integrated Life Science Building 23 Blacksburg, VA 24061 United States Copyright © 2011 by George C. Davis. All rights reserved. Readers may make verbatim copies of this document for non-commercial purposes by any means, provided that this copyright notice appears on all such copies.
2
The Interaction of Obesity Related Genotypes, Phenotypes, and Economics: An Experimental Economics Approach with Mice
Abstract
Food intake is greatly influenced by economic factors. Consequently, neuroeconomics has been
identified as a new and important area for understanding the interaction between genotypes and
phenotypes related to food intake. A foundational element of economics is choice between
alternatives. Changing food choices are a central element in the explanation of the increasing
obesity rates in human populations. The purpose of this research is to incorporate the key
element of choice into the investigation of food intake and weight-related phenotypes for mice in
an operant chamber setting. Using normal mice, and mice with a mutation in the Tubby gene
(Tub-Mut) which results in adult onset obesity, this research will investigate different behavioral
responses among genotypes, as well as unexplored phenotype outcomes when mice are
confronted with a falling price of a high fat food relative to a low fat food. Results for both
genotypes indicate that as the price of the high fat food falls, consumption of that food increases,
but consumption of the low fat food does not decrease in a compensatory fashion. For both
genotypes, weight and body fat percentage increases with decreasing high fat food price, but
ghrelin and leptin levels do not significantly change. The Tub-Mut shows a significant increase
in the area under the glucose tolerance curve, suggestive of a diabetic state. These results show
that accounting for choice in neuroeconomic studies is important to understanding the complex
regulation of body weight and diabetes.
3
1. Introduction There is no debate that genetics and the environment interact in determining health outcomes in
individuals and yet we know very little about this interaction. Biological sciences have tended to
study genetic factors in isolation from environmental factors. Behavioral sciences, such as
economics, have tended to study the environment in isolation from genetics. Indeed, in health
economics, one could argue that all of the analysis of economic factors affecting health is done
within the ‘black box’ of reduced form analysis because we do not know the biological
mechanisms through which these effects occur. For example, the literature is replete with
analyses looking at the relationship between income, prices, and health indicators (mortality,
disease frequency) but we currently do not remotely understand how these economic factors
affect specific biological outcomes determining diseases (e.g., cortisol levels, cholesterol levels,
blood pressure). As Deaton [1] (2002 Health Affairs) states, “Policy cannot be intelligently
conducted without an understanding of mechanisms; correlations are not enough.”
Two of the main problems in understanding the economic-biological mechanism
connection in humans are the lack of sufficient data connecting economics and biology and,
more importantly, the insufficient control of confounding factors in observational human studies
that can distort causal inferences [1]. The nascent interdisciplinary field of neuroeconomics, that
integrates behavioral and biological analyses into a single overarching framework, is starting to
confront these issues, often employing operant chamber animal models. Operant chamber animal
models are appealing because confounding factors can be controlled through experimental
design and detailed biological data can be generated in response to changes in the economic
environment (e.g., at the organ level, tissue level, and even cellular level) in a relatively short
4
time. Given the biological sciences have for centuries studied animals to draw inferences about
humans, the initial main concern may be the proximity of the economic behaviors of animals
with humans. For basic economic principles, this is no concern. There is a substantial economic
literature, being published in some of the most prestigious economic journals, on the
transcendence of basic economic principles to other species (e.g. [2]).
The purpose of this research is to ask if food choice and genotype affect body weight-
related phenotypes in a food cost choice setting. The specific experiment reported here is
motivated by the common argument that the increased consumption of high energy-dense food
relative to low energy-dense food has been s a major contributor to the current obesity epidemic
[3-5]. Although there are numerous environmental factors affecting food consumption,
economic factors appear especially important [4, 6-9]. As stated by Vaughan and Rowland [10],
“There is a pressing need to understand at a fundamental level the interactions between genes
and economic change in the environment”, and, “economic decision-making is central to
understanding how much and when organisms eat” [11]. The nascent field of neuroeconomics
seeks to unravel the relationship between economic decision making, genotypes, and resulting
phenotypes and will offer novel insights connecting behavioral and biological sciences [11].
A key determinant in economic decisions is the cost, or price, of obtaining a good. As the
price of the good increases the quantity of the good consumed decreases; this is known as the
simple law of demand. Through novel experiments, several authors have demonstrated that mice
and other species follow this simple law of demand and that food intake will decrease as price
increases [10-14].
The simple law of demand is a special case of the more general law of demand that is based
on the cornerstone of economics: choice between alternatives [15]. Accounting for choice is
5
especially important for phenotypes related to food intake and obesity, because different foods
have different nutritional characteristics, which in turn can affect obesity-related phenotypes in
different ways. For example, if two foods are considered substitutes, as the price of one
increases, consumption of that food will decrease, but consumption of the other food will
increase in a compensatory or substitution fashion. Consequently, the weight of the animal could
decrease or increase depending on the relative consumption of the two foods and their nutritional
characteristics. Alternatively, if two foods are considered complements, as the price of one food
increases, the consumption of both foods will decrease and weight will decrease. Finally, if two
foods are considered independent, then the consumption of one food is not affected by the price
of the other. This does not imply weight will necessarily decrease if the price of a food is
increased. Consumption of the other food will not change and it may be consumption of this
other food that is contributing more to weight. The general law of demand accounts not only for
changes in consumption of the good whose price changed (called the own price effect), but also
how that change in price may have cross-over effects on the consumption of other goods via
choice (called the cross-price effect). Of course, similar to a single food case, in a two-food
setting there also may be differences between genotypes in behavioral responses that may lead to
differences in phenotypes.
This research therefore extends the current literature regarding mouse neuroeconomic
genotypes and food intake to ask if food choice and genotype affect body weight-related
phenotypes in a food cost choice setting. In addition to reporting on food intake (low fat, high
fat, total) and body weight, we also consider several phenotypes that have not been examined in
previous food cost studies: percentage of body fat, serum ghrelin levels, serum leptin levels, and
glucose tolerance. While earlier studies have considered economic choice experiments for other
6
species [2], this protocol has not been applied to mice. Similar to the studies of Vaughan and
Rowland [10] who use mice in single food economic studies, there is interest in whether this
protocol is applicable to mice as they are the most prevalent model for genetic research related to
food intake and body weight. We chose to investigate differences between mice with a mutation
in the Tubby gene (Tub-Mut) and normal mice, both of which are genotypes that have not been
compared in the literature of operant behavior and food intake. This mutant mouse model
displays adult-onset obesity with a phenotype of slight hypophagia and reduced overall physical
activity levels in an ad lib food setting, suggestive of a defect in behavioral motivation for food
or exercise [16]. Thus, the study will examine the effect of choice on body weight parameters, as
well as the effect of genotype in a mouse obesity model shown to have reduced behavioral
motivation for activities requiring work.
2. Materials and Methods
2.1 Animals and Environment
Six Tub Mutant (MUT) (Tub-Mutant C57BL/6) and four Wildtype (WT) (C57BL/6) female mice
were obtained from colonies maintained at Virginia Polytechnic Institute and State University,
from breeding pairs obtained through The Jackson Labs (Bar Harbor, ME). Mice were genotyped
using published procedures [17]. At 6-8 weeks of age all mice were moved to individual shoebox
cages with access to water and two jars of 20 mg pellets ad lib. One jar contained a low-fat (LF)
diet based on the AIN-93g formulation with 16.7% fat, 19.1% protein, and 64.2% carbohydrates
[18]. The other jar contained a modified high-fat (HF) diet (35.2% fat, 19% protein, and 45.8%
carbohydrates). The diets were formulated to be isocaloric to control for the potential
confounding effects of different calorie levels and were supplied by Bio-Serv. (Frenchtown, NJ).
7
Mice remained in the shoebox cages until they had adapted to the new food, which usually took
2-5 days. After a 12 hr fast, mice were then moved to individual operant chambers measuring 18
x 20 x 14 cm with a steel rod floor. Two levers protruded on one wall of the operant chamber
and, internal to the levers, two recessed food troughs. Small cue lights above each lever and each
trough indicated operational status (see below). Ad lib water was available from a spout centrally
located on the wall opposite the levers. Each operant chamber was housed within a sound
attenuated cubicle (77 x 50 x 49 cm) containing a ventilation fan and house light. Operant
chambers and housing cubicles, along with computer software, were made by LaFayette
Instrument Company (Lafayette, IN). The animals were supplied with a Shepherd Shack
(Shepherd Specialty Papers, Milford, NJ) and a neslet (Ancare, Bellmore, NY). Mice remained
in the operant chamber through the entirety of the experiments, with the exception of 30 minutes
at the end of each day when they were removed for cage cleaning and phenotypic measurements.
2.2 Shaping and Food Procurement Schedule
An argument for the increase in obesity in humans is that high fat foods have become cheaper
relative to low fat foods [6-8, 19-21]. The goal of this experiment was to mimic this change and
determine how the mice would respond as the price of high fat food decreased relative to the
price of low fat food. Consequently, mice first had to be acclimated to a high price level, which
for this study is 40 lever presses per pellet, also known as a consumatory fixed ratio (CFR). Food
levers and dispensers were operational from 5:00 PM until 9:00 AM everyday for a 16:8 hr
feeding/non-feeding cycle. During the feeding cycle, a purchase transaction proceeded as
follows. To begin, a cue light above each lever was on. Once the mouse engaged the lever for
the chosen food, the cue light of the other food turned off and the lever for that food became
inactive. Once the mouse completed all the lever presses required to dispense a pellet for the
8
chosen food, the cue light over the lever would turn off, the cue light over the associated trough
would turn on for two seconds, and the the pellet would be delivered. This would complete the
transaction and the system would reset with both lever cue lights turned back on, and the trough
lights turned off. Over a four week period, mice were progressed through equal CFR schedules
with equal cue light intensity until they reached a CFR of 40 lever presses per pellet for both the
low and high fat diets. Every time the prices were changed, the foods were rotated to discourage
lever bias (2). The weight and consumption of each mouse was monitored daily to ensure they
were eating and maintaining weight.
Once the mice reached the starting prices of 40-40, they were then progressed through the
following CFR schedules for the low fat and high fat foods, respectively: 40-40, 40-30, 40-20,
and 40-10 presses per pellet. Schedules were in place for 7-10 days and foods were rotated
weekly when prices changed. To help reduce learning time, the cue light for low fat high-priced
food was set at a slightly lower illumination intensity than the high fat low-priced food.
Software from Lafayette Instruments controlled the operant chambers and recorded the number
of presses and pellets released.
2.3 Outcome Procedures and Measures
In addition to daily intake and weight measures, body fat percentage was measured weekly with
a whole body magnetic resonant imaging (MRI) using a Bruker LF90 NMR analyzer (Bruker
Corporation, Billrica, MA). The MRI was conducted on the last day of each schedule (for the
starting schedule it was conducted the day before the starting schedule began). A glucose
tolerance test (GTT) was conducted on each mouse at the beginning of the 40-40 CFR schedule
and again at the end of the final 40-10 CFR schedule. Prior to the test, mice were food deprived
9
for 12 hours. Tail blood was taken for the fasted measurement and glucose (2g/kg in sterile PBS)
was injected intraperitoneally (IP). Tail blood was obtained at 15, 30, 60, 90 and 120 minutes
following the injection. Glucose in tail blood was measured using a glucometer (One-Touch
Basic, Lifescan, Milpitas CA). At the beginning of the 40-40 CFR schedule, at the end of the
final 40-10 CFR schedule, and one day prior to the day of the GTT, blood samples were
collected via the cheek pouch bleeding procedure [22]. Blood samples were processed to obtain
leptin and ghrelin levels using commerically available kits (Alpha Diagnostics Mouse Leptin
Elisa, San Antonio, TX; Millipore Mouse Total Ghrelin Elisa Kit, Billerica, MA). Vaginal
smears were taken daily for estrous cycle determination with no significant differences with
respect to stage of cycle and other measures noted (data not shown).
2.3 Data Analysis
For data analysis, measures were either daily (food intake and body weight), weekly (body fat
percentage), or beginning and ending (ghrelin, leptin, and GTT) for each mouse. Because intake
and weight were measured daily, we used the mean values over the last four days of each
schedule. Body fat percentage, ghrelin and leptin levels, and GTT were used as measured.
Parameters are estimated using repeated measurement two way and one way ANOVAs and post
hoc Tukey honestly significant difference (HSD) tests.
3. Results
3.1 Effect on food intake
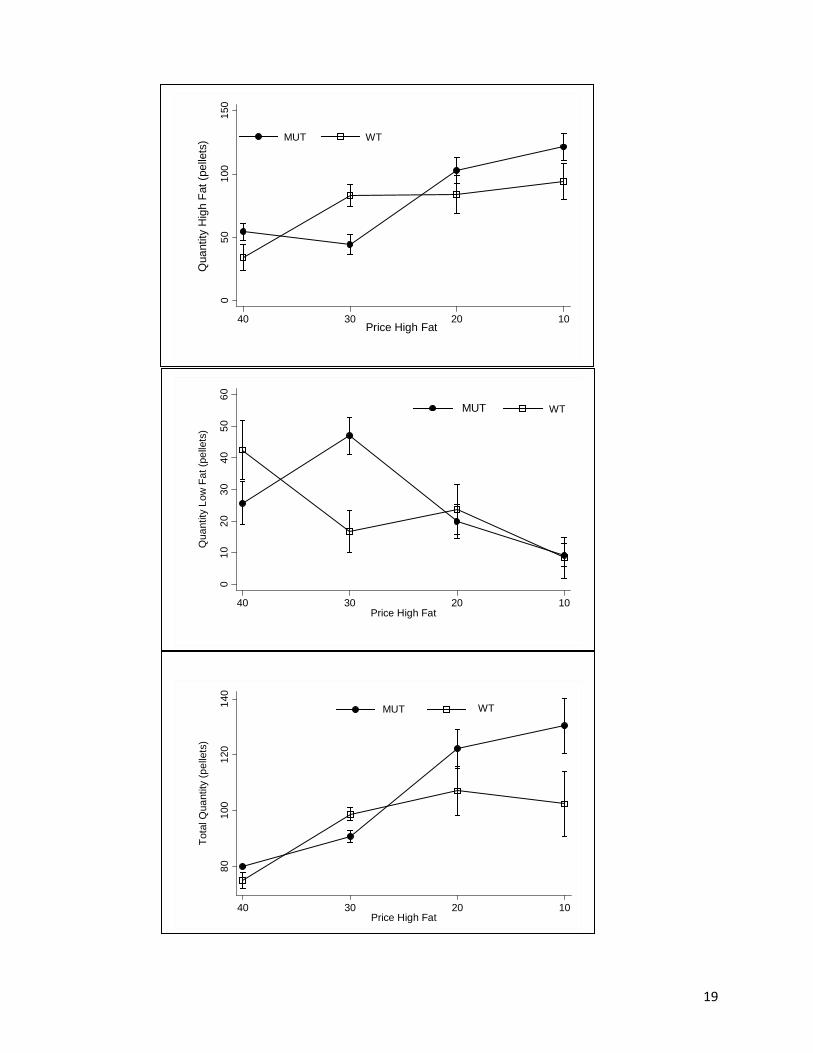
The effects of changing price on the quantity of high fat, low fat, and total pellets consumed are
shown in Fig. 1. The change in price of high fat diet on high fat consumption (the own price
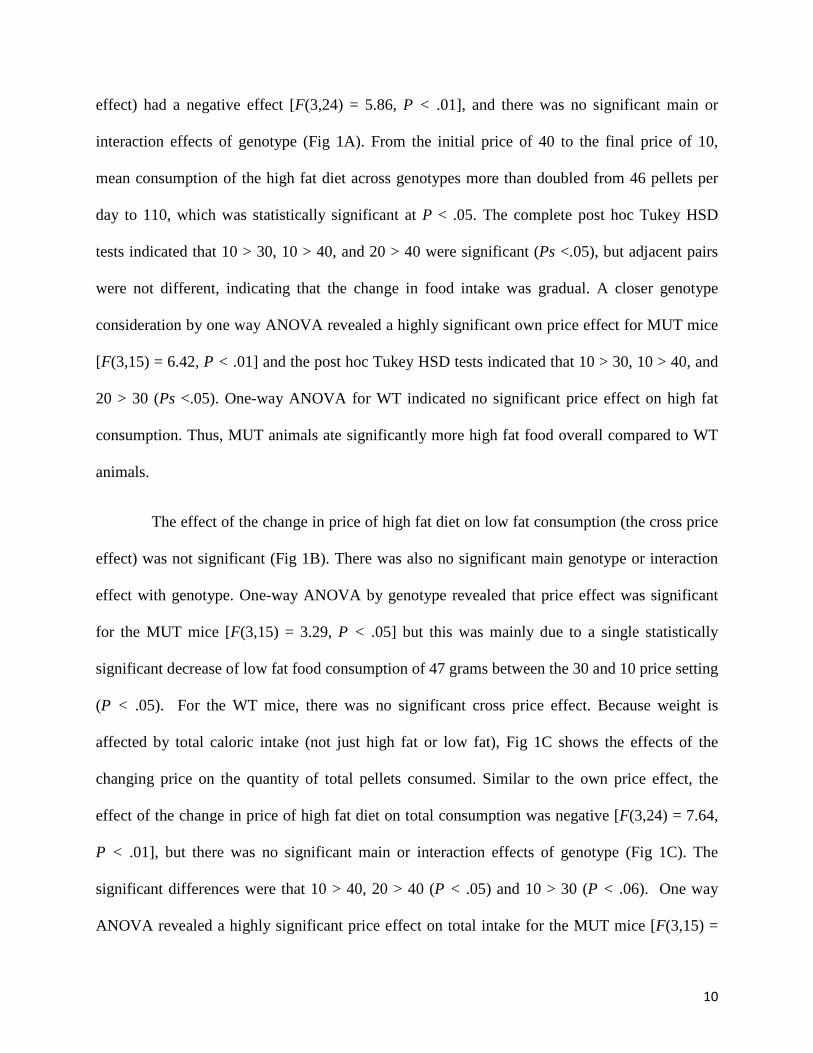
10
effect) had a negative effect [F(3,24) = 5.86, P < .01], and there was no significant main or
interaction effects of genotype (Fig 1A). From the initial price of 40 to the final price of 10,
mean consumption of the high fat diet across genotypes more than doubled from 46 pellets per
day to 110, which was statistically significant at P < .05. The complete post hoc Tukey HSD
tests indicated that 10 > 30, 10 > 40, and 20 > 40 were significant (Ps <.05), but adjacent pairs
were not different, indicating that the change in food intake was gradual. A closer genotype
consideration by one way ANOVA revealed a highly significant own price effect for MUT mice
[F(3,15) = 6.42, P < .01] and the post hoc Tukey HSD tests indicated that 10 > 30, 10 > 40, and
20 > 30 (Ps <.05). One-way ANOVA for WT indicated no significant price effect on high fat
consumption. Thus, MUT animals ate significantly more high fat food overall compared to WT
animals.
The effect of the change in price of high fat diet on low fat consumption (the cross price
effect) was not significant (Fig 1B). There was also no significant main genotype or interaction
effect with genotype. One-way ANOVA by genotype revealed that price effect was significant
for the MUT mice [F(3,15) = 3.29, P < .05] but this was mainly due to a single statistically
significant decrease of low fat food consumption of 47 grams between the 30 and 10 price setting
(P < .05). For the WT mice, there was no significant cross price effect. Because weight is
affected by total caloric intake (not just high fat or low fat), Fig 1C shows the effects of the
changing price on the quantity of total pellets consumed. Similar to the own price effect, the
effect of the change in price of high fat diet on total consumption was negative [F(3,24) = 7.64,
P < .01], but there was no significant main or interaction effects of genotype (Fig 1C). The
significant differences were that 10 > 40, 20 > 40 (P < .05) and 10 > 30 (P < .06). One way
ANOVA revealed a highly significant price effect on total intake for the MUT mice [F(3,15) =
11
7.42, P < .01], but an insignificant price effect on total intake for the WT mice. Thus, MUT mice
showed an overall higher total consumption compared to WT mice over the course of the study.
This higher total consumption was due to the higher consumption of the lower priced high fat
food and no significant change in the consumption of low fat food.
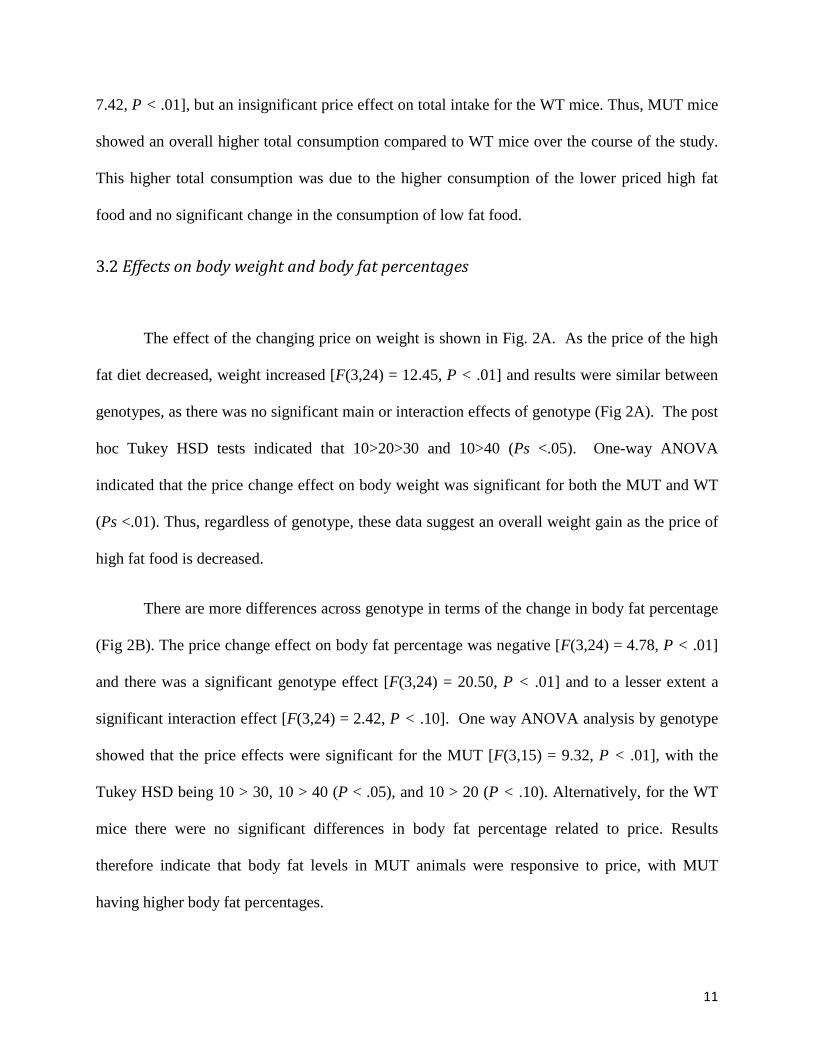
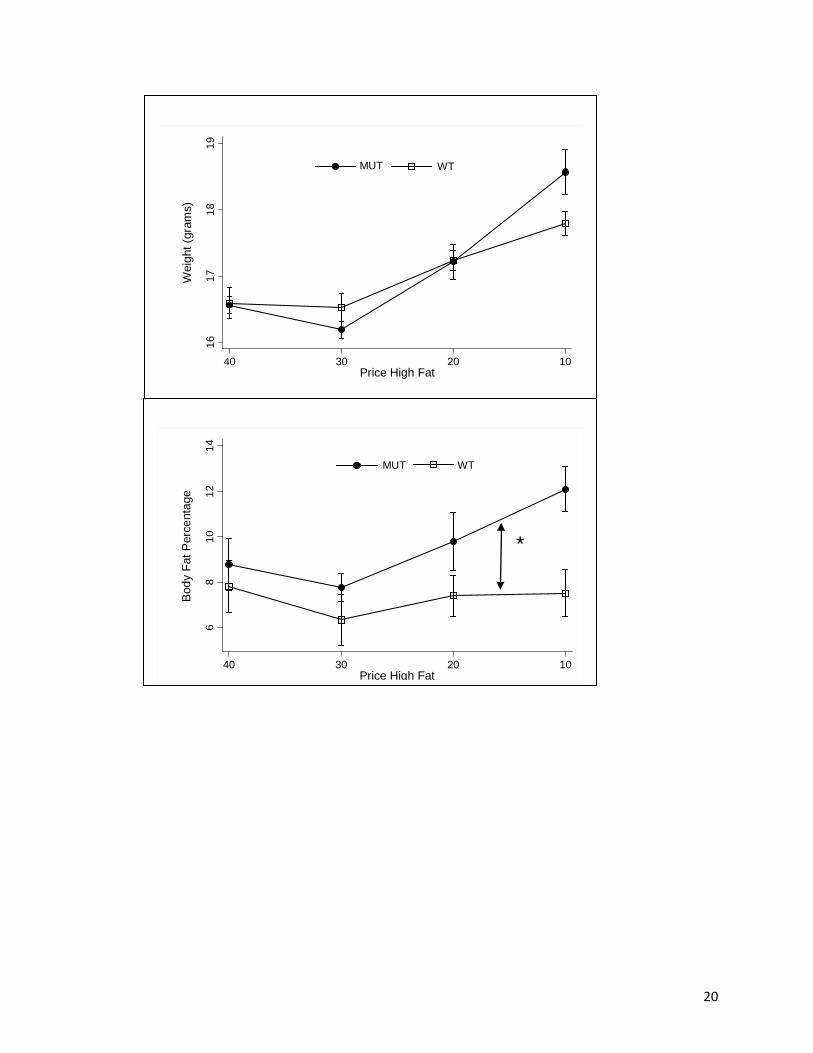
3.2 Effects on body weight and body fat percentages
The effect of the changing price on weight is shown in Fig. 2A. As the price of the high
fat diet decreased, weight increased [F(3,24) = 12.45, P < .01] and results were similar between
genotypes, as there was no significant main or interaction effects of genotype (Fig 2A). The post
hoc Tukey HSD tests indicated that 10>20>30 and 10>40 (Ps <.05). One-way ANOVA
indicated that the price change effect on body weight was significant for both the MUT and WT
(Ps <.01). Thus, regardless of genotype, these data suggest an overall weight gain as the price of
high fat food is decreased.
There are more differences across genotype in terms of the change in body fat percentage
(Fig 2B). The price change effect on body fat percentage was negative [F(3,24) = 4.78, P < .01]
and there was a significant genotype effect [F(3,24) = 20.50, P < .01] and to a lesser extent a
significant interaction effect [F(3,24) = 2.42, P < .10]. One way ANOVA analysis by genotype
showed that the price effects were significant for the MUT [F(3,15) = 9.32, P < .01], with the
Tukey HSD being 10 > 30, 10 > 40 (P < .05), and 10 > 20 (P < .10). Alternatively, for the WT
mice there were no significant differences in body fat percentage related to price. Results
therefore indicate that body fat levels in MUT animals were responsive to price, with MUT
having higher body fat percentages.
12
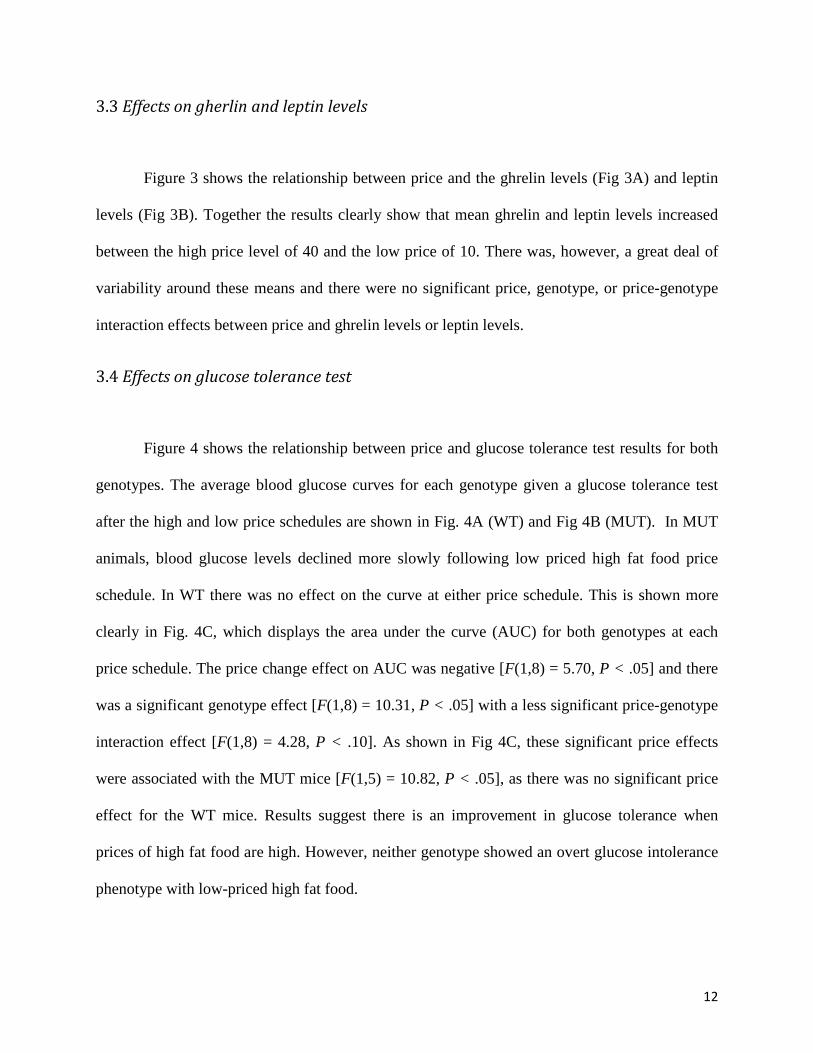
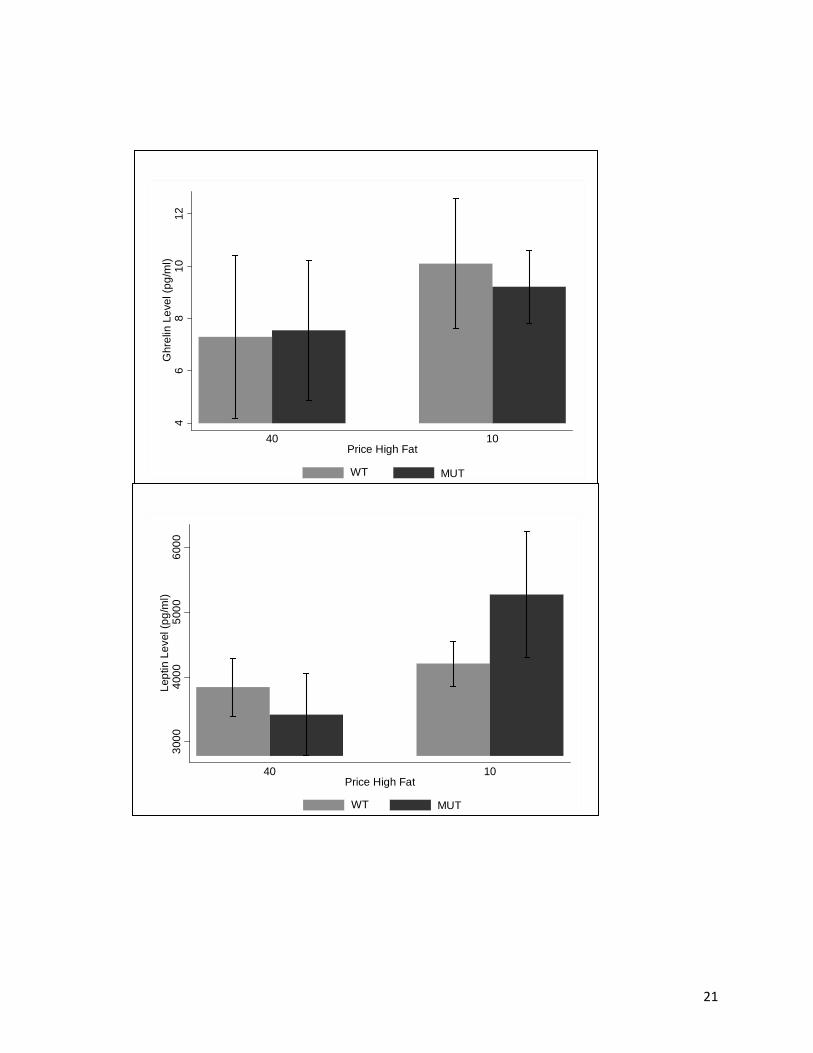
3.3 Effects on gherlin and leptin levels
Figure 3 shows the relationship between price and the ghrelin levels (Fig 3A) and leptin
levels (Fig 3B). Together the results clearly show that mean ghrelin and leptin levels increased
between the high price level of 40 and the low price of 10. There was, however, a great deal of
variability around these means and there were no significant price, genotype, or price-genotype
interaction effects between price and ghrelin levels or leptin levels.
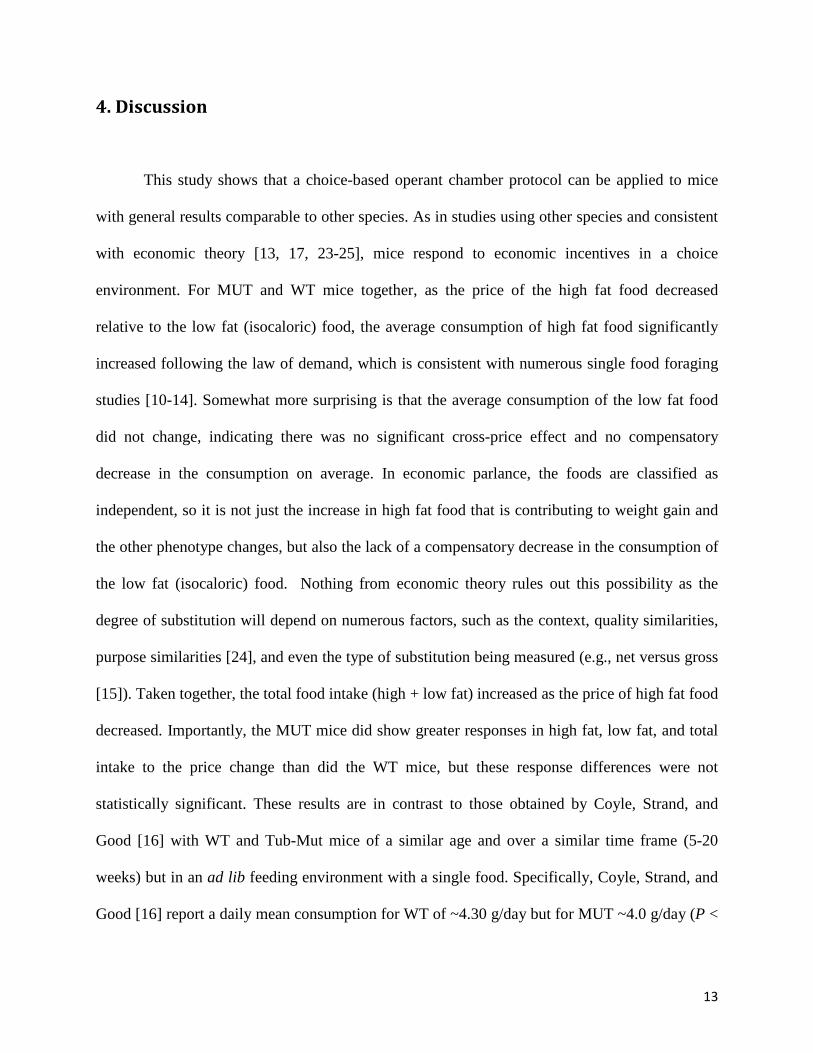
3.4 Effects on glucose tolerance test
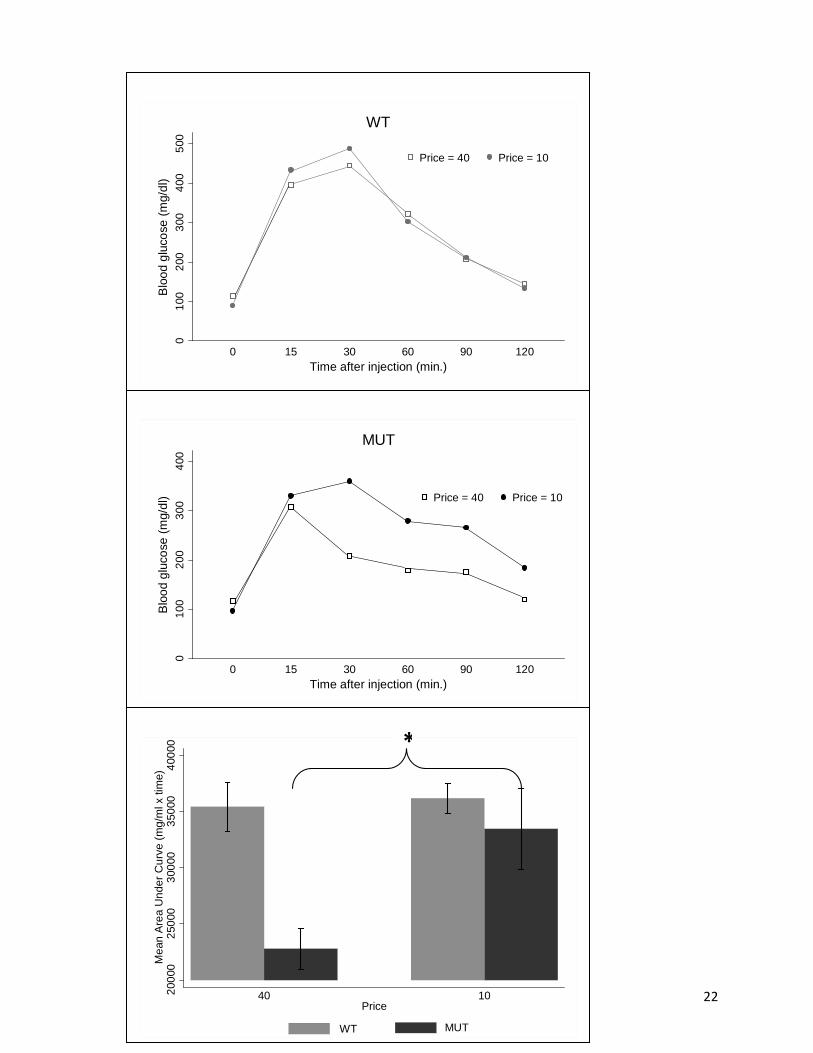
Figure 4 shows the relationship between price and glucose tolerance test results for both
genotypes. The average blood glucose curves for each genotype given a glucose tolerance test
after the high and low price schedules are shown in Fig. 4A (WT) and Fig 4B (MUT). In MUT
animals, blood glucose levels declined more slowly following low priced high fat food price
schedule. In WT there was no effect on the curve at either price schedule. This is shown more
clearly in Fig. 4C, which displays the area under the curve (AUC) for both genotypes at each
price schedule. The price change effect on AUC was negative [F(1,8) = 5.70, P < .05] and there
was a significant genotype effect [F(1,8) = 10.31, P < .05] with a less significant price-genotype
interaction effect [F(1,8) = 4.28, P < .10]. As shown in Fig 4C, these significant price effects
were associated with the MUT mice [F(1,5) = 10.82, P < .05], as there was no significant price
effect for the WT mice. Results suggest there is an improvement in glucose tolerance when
prices of high fat food are high. However, neither genotype showed an overt glucose intolerance
phenotype with low-priced high fat food.
13
4. Discussion
This study shows that a choice-based operant chamber protocol can be applied to mice
with general results comparable to other species. As in studies using other species and consistent
with economic theory [13, 17, 23-25], mice respond to economic incentives in a choice
environment. For MUT and WT mice together, as the price of the high fat food decreased
relative to the low fat (isocaloric) food, the average consumption of high fat food significantly
increased following the law of demand, which is consistent with numerous single food foraging
studies [10-14]. Somewhat more surprising is that the average consumption of the low fat food
did not change, indicating there was no significant cross-price effect and no compensatory
decrease in the consumption on average. In economic parlance, the foods are classified as
independent, so it is not just the increase in high fat food that is contributing to weight gain and
the other phenotype changes, but also the lack of a compensatory decrease in the consumption of
the low fat (isocaloric) food. Nothing from economic theory rules out this possibility as the
degree of substitution will depend on numerous factors, such as the context, quality similarities,
purpose similarities [24], and even the type of substitution being measured (e.g., net versus gross
[15]). Taken together, the total food intake (high + low fat) increased as the price of high fat food
decreased. Importantly, the MUT mice did show greater responses in high fat, low fat, and total
intake to the price change than did the WT mice, but these response differences were not
statistically significant. These results are in contrast to those obtained by Coyle, Strand, and
Good [16] with WT and Tub-Mut mice of a similar age and over a similar time frame (5-20
weeks) but in an ad lib feeding environment with a single food. Specifically, Coyle, Strand, and
Good [16] report a daily mean consumption for WT of ~4.30 g/day but for MUT ~4.0 g/day (P <
14
0.01), indicating MUT mice ate less than WT in their ad lib setting. Alternatively, in our operant
chamber economic setting, daily mean total intake for each genotype was about half of the
expected ad lib intake, and there were no significant differences between TUB-MUT and WT.
Specifically, at 20 mg per pellet, our daily mean total consumption over the length of this study
was ~2.16 g/day for MUT and ~1.92g/day for WT and these amounts were not statistically
different. Some of these discrepancies may be attributable to differences in kcals/gram. Our
pellets had 3.77kcals/gram, whereas the standard chow fed by Coyle, Strand, and Good [16] had
3.02 kcals/gram, but these differences do not contribute to the reversal in relative consumption
between genotypes. Thus, in our non ad libitum environment, hypophagia for the MUT mice
disappears, and there is an overall slight but non-significant increase in intake (0.95 kcal/day) for
the MUT mice relative to WT mice.
With respect to weight in a single food setting, the relationship between food price and
weight is expected to mimic the simple law of demand: as the price goes up (down) intake and
weight would therefore decrease (increase). In various settings, this result has been confirmed
[14, 26], although not universally [10]. However, once the important environmental attribute of
choice is allowed, the weight-price relationship is no longer clear even a priori because weight
will depend on total intake, which depends on consumption of both foods; that is the degree of
substitution and own and cross-price effects. In our experiments, we found that as the price of
high fat food decreased, total intake and weight increased for both TUB-MUT and WT, but there
were no significant differences between TUB-MUT and WT. This is in contrast to the results of
Coyle, Strand, and Good [16], where the TUB-MUT weighed significantly more compared to the
WT over the course of their study on ad lib feeding. Of note, those studies used male mice,
which generally weigh more than females. Females, on the other hand, generally have more body
15
fat, and our results in this area (discussed below) do indicate a genotype difference. Overall, the
weight response differences between TUB-MUT and WT in the ad lib setting versus a choice
cost setting underscore the importance of the economic environment and the role choices can
play in body weight related phenotypes.
Although we did not find any differences in weight between the TUB-MUT and WT,
there were significant differences in body fat percentage. The TUB-MUT responded significantly
to the change in price and therefore showed a substantially higher body fat percentage. This
outcome is consistent with the carcass fat content analysis performed by Coyle, Strand, and
Good in their ad lib setting [16].
The increasing body weight and body fat percentage, especially for the TUB-MUT, was
not accompanied by any change in leptin or ghrelin levels, though there was a significant
increase in the area under the glucose tolerance test curve for the TUB-MUT. As indicated in the
introduction, we are not aware of other foraging/cost experiments that have looked at leptin,
ghrelin, or glucose tolerance, but the diet-induced obesity literature has documented changes in
all three of these phenotypes in ad lib settings [27, 28], again underscoring the need for more
research on the interaction of economics, genotype responses, and phenotype outcomes.
This research has answered calls for more analysis on behavioral economics and genetics
by incorporating a key feature of economic decision-making: choice. Food choice is especially
important for biological outcomes, as the outcomes may depend more on the composition of
foods consumed rather than the actual intake of a single food. In addition, most choice/substitute
research has focused on behavioral issues and effects rather than biological outcomes. Moving to
studying the biological effects of economic factors is an important research area because many
16
government policies designed to fight obesity are economic policies, such as taxes on certain
foods [29, 30], and these policies not only have direct effects but can also have indirect effects
via their influence on the choices of alternative foods. The complete efficacy and effectiveness
of these policies in improving health cannot be fully appreciated until we understand not only the
behavioral but the biological influences of choice on obesity. In addition, neuroeconomic
research that incorporates choice will give us a better understanding of how choices are actually
made and the factors that affect choices.

17
Acknowledgements
This work was supported by a grant from the Fralin Life Science Institute and the Institute for
Society, Culture and Environment Obesity Grant Program. The authors would like to thank Ms.
Hiayan Zhang, Ms. Emily Hairfield, Ms. Tamima Hossain and the Integrated Life Sciences
Building Vivarium Animal Care staff for excellent technical assistance and Ms. Ellie Rahochik
for editorial assistance and manuscript critique.
18
Figure Legends
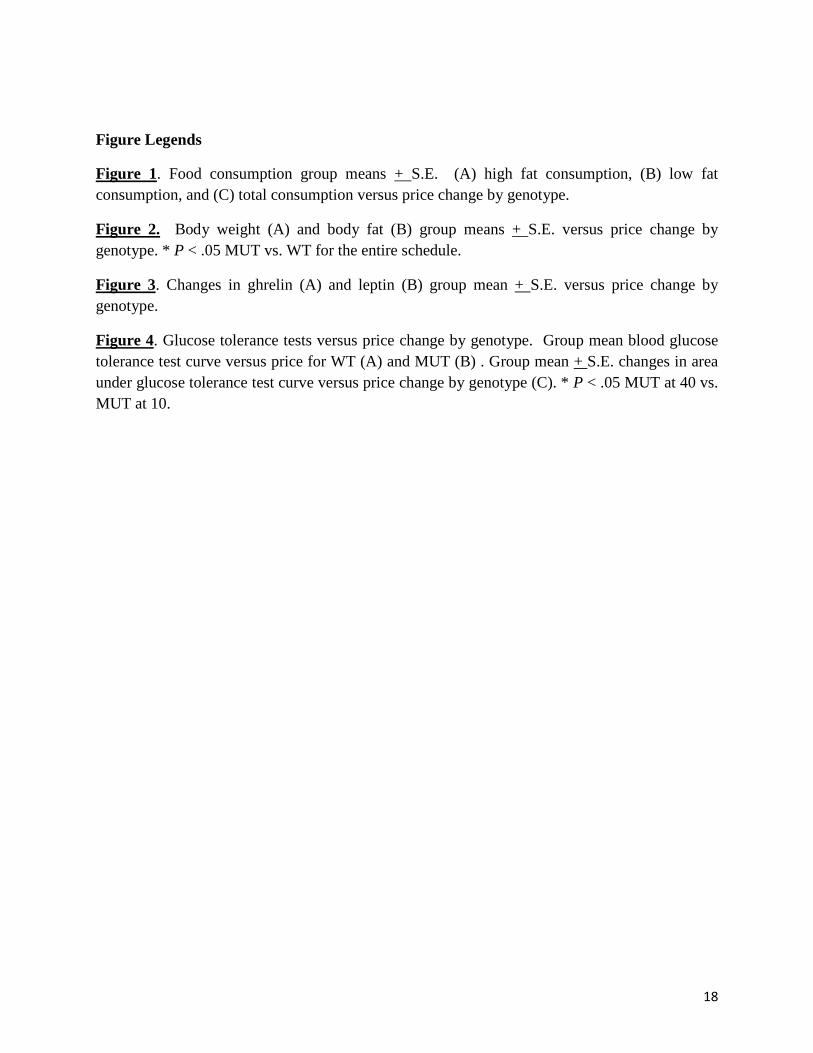
Figure 1. Food consumption group means + S.E. (A) high fat consumption, (B) low fat consumption, and (C) total consumption versus price change by genotype.
Figure 2. Body weight (A) and body fat (B) group means + S.E. versus price change by genotype. * P < .05 MUT vs. WT for the entire schedule.
Figure 3. Changes in ghrelin (A) and leptin (B) group mean + S.E. versus price change by genotype.
Figure 4. Glucose tolerance tests versus price change by genotype. Group mean blood glucose tolerance test curve versus price for WT (A) and MUT (B) . Group mean +
S.E. changes in area under glucose tolerance test curve versus price change by genotype (C). * P < .05 MUT at 40 vs. MUT at 10.
19
050
100
150
Qua
ntity
Hig
h Fa
t (pe
llets
)
10203040Price High Fat
MUT WT
010
2030
4050
60
Qua
ntity
Low
Fat
(pel
lets
)
10203040Price High Fat
MUT WT
8010
012
014
0
Tota
l Qua
ntity
(pel
lets
)
10203040Price High Fat
MUT WT
20
1617
1819
Wei
ght (
gram
s)
10203040Price High Fat
MUT WT
*
68
1012
14
Bod
y Fa
t Per
cent
age
10203040Price High Fat
MUT WT
21
4
68
1012
Ghr
elin
Lev
el (p
g/m
l)
1040Price High Fat
MUTWT
3000
4000
5000
6000
Lept
in L
evel
(pg/
ml)
1040Price High Fat
MUTWT
22
010
020
030
040
050
0B
lood
glu
cose
(mg/
dl)
0 15 30 60 90 120Time after injection (min.)
WT
Price = 40 Price = 10
010
020
030
040
0B
lood
glu
cose
(mg/
dl)
0 15 30 60 90 120Time after injection (min.)
MUT
Price = 40 Price = 10
2000
025
000
3000
035
000
4000
0M
ean
Are
a U
nder
Cur
ve (m
g/m
l x ti
me)
1040Price
MUTWT
*
23
References
[1] Deaton, A. Policy Implications of the Gradient of Health and Wealth. Health Affairs. March 2002 vol. 21 no. 2:13-30
[2] Kagel, J. H., Battalio, R. C., Green, L. Economic choice theory: An experimental analysis of animal behavior. New York: Cambridge University Press; 1995.
[3] Cordain, L., Eaton, S. B., Sebastian, A., Mann, N., Lindeberg, S., Watkins, B. A., et al. Origins and evolution of the Western diet: health implications for the 21st century. Am J Clin Nutr. 2005,81:341-54.
[4] Drewnowski, A. Fat and sugar: an economic analysis. J Nutr. 2003,133:838S-40S.
[5] Putnam, J., Allhouse, J., FKantor, L. S. U.S. per capita food supply trends: more calories, refined carbohydrates and fats. Food Review. 2002,25:2-15.
[6] Chou, S. Y., Grossman, M., Saffer, H. An economic analysis of adult obesity: results from the Behavioral Risk Factor Surveillance System. J Health Econ. 2004,23:565-87.
[7] Drewnowski, A., Darmon, N. Food choices and diet costs: an economic analysis. J Nutr. 2005,135:900-4.
[8] Finkelstein, E. A., Ruhm, C. J., Kosa, K. M. Economic causes and consequences of obesity. Annu Rev Public Health. 2005,26:239-57.
[9] Hill, J. O., Sallis, J. F., Peters, J. C. Economic analysis of eating and physical activity: a next step for research and policy change. Am J Prev Med. 2004,27:111-6.
[10] Vaughan, C. H., Rowland, N. E. Meal patterns of lean and leptin-deficient obese mice in a simulated foraging environment. Physiol Behav. 2003,79:275-9.
[11] Rowland, N. E., Vaughan, C. H., Mathes, C. M., Mitra, A. Feeding behavior, obesity, and neuroeconomics. Physiol Behav. 2008,93:97-109.
[12] Collier, G., Hirsch, E., Hamlin, P. H. The ecological determinants of reinforcement in the rat. Physiol Behav. 1972,9:705-16.
[13] Kaufman, L. W., Collier, G., Hill, W. L., Collins, K. Meal cost and meal patterns in an uncaged domestic cat. Physiol Behav. 1980,25:135-7.
[14] Vaughan, C. H., Moore, M. C., Haskell-Luevano, C., Rowland, N. E. Meal patterns and foraging in melanocortin receptor knockout mice. Physiol Behav. 2005,84:129-33.
[15] Nicholson, W. and Synder, C. microeconomic theory: basic principles and extensions. 10 ed. Mason, OH: South Western; 2008.
24
[16] Coyle, C. A., Strand, S. C., Good, D. J. Reduced activity without hyperphagia contributes to obesity in Tubby mutant mice. Physiol Behav. 2008,95:168-75.
[17] Maddatu, T., Naggert, J. K. Allele-specific PCR assays for the tub and cpefat mutations. Mamm Genome. 1997,8:857-8.
[18] Reeves, P. G., Nielsen, F. H., Fahey, G. C., Jr. AIN-93 purified diets for laboratory rodents: final report of the American Institute of Nutrition ad hoc writing committee on the reformulation of the AIN-76A rodent diet. J Nutr. 1993,123:1939-51.
[19] Duffey, K. J., Gordon-Larsen, P., Shikany, J. M., Guilkey, D., Jacobs, D. R., Jr., Popkin, B. M. Food price and diet and health outcomes: 20 years of the CARDIA Study. Arch Intern Med. 2010,170:420-6.
[20] Monsivais, P., Drewnowski, A. The rising cost of low-energy-density foods. J Am Diet Assoc. 2007,107:2071-6.
[21] Powell, L. M. Fast food costs and adolescent body mass index: evidence from panel data. J Health Econ. 2009,28:963-70.
[22] Golde, W. T., Gollobin, P., Rodriguez, L. L. A rapid, simple, and humane method for submandibular bleeding of mice using a lancet. Lab Anim (NY). 2005,34:39-43.
[23] Belke, T. W., Pierce, W. D., Duncan, I. D. Reinforcement value and substitutability of sucrose and wheel running: implications for activity anorexia. J Exp Anal Behav. 2006,86:131-58.
[24] Green, L., Freed, D. E. The substitutability of reinforcers. J Exp Anal Behav. 1993,60:141-58.
[25] Hursch, S. R. The economics of daily consumption controlling food and water reinforced responding. J Exp Anal Behav. 1978,29:475-91.
[26] Peck, J. W. Rats defend different body weights depending on palatability and accessibility of their food. J Comp Physiol Psychol. 1978,92:555-70.
[27] Dunn, G. A., Bale, T. L. Maternal high-fat diet promotes body length increases and insulin insensitivity in second-generation mice. Endocrinology. 2009,150:4999-5009.
[28] Lin, S., Thomas, T. C., Storlien, L. H., Huang, X. F. Development of high fat diet-induced obesity and leptin resistance in C57Bl/6J mice. Int J Obes Relat Metab Disord. 2000,24:639-46.
[29] Brownell, K. D., Frieden, T. R. Ounces of prevention--the public policy case for taxes on sugared beverages. N Engl J Med. 2009,360:1805-8.
[30] Kim, D., Kawachi, I. Food taxation and pricing strategies to "thin out" the obesity epidemic. Am J Prev Med. 2006,30:430-7.

25