Embed Size (px)
Citation preview

THE INTERACTION OF REINFORCED CONCRETE SKELETON SYSTEMS AND
ARCHITECTURAL FORM SUBJECTED TO EARTHQUAKE EFFECTS
A Thesis Submitted to The Graduate School of Engineering and Sciences of
Izmir Institute of Technology In Partial Fulfillment of the Requirements for the Degree of
MASTER OF SCIENCE
in Architecture
by Tuğba İNAN
July 2010 İZMİR

We approve the thesis of Tuğba İNAN
Assist. Prof. Dr. Koray KORKMAZ Supervisor
Assist. Prof. Dr. Mizan DOĞAN Co-Supervisor
Assist. Prof. Dr. Ahmet Vefa ORHON Committee Member
Assist. Prof. Dr. Cengiz ÖZMEN Committee Member
12 July 2010
Prof. Dr. H. Murat GÜNAYDIN Assoc. Prof. Dr. Talat YALÇIN Head of the Department of Architecture Dean of the Graduate School of
Engineering and Sciences

iii
ACKNOWLEDGMENTS
I am very much indebted to my supervisor Assist. Prof. Dr. Koray KORKMAZ
for his supervision and his constant encouragement and attention, for his patience and
efforts to broaden the horizon of this study and for providing a productive atmosphere
throughout. I would like to thank my co-advisor Assist. Prof. Dr. Mizan DOĞAN of the
Department of Civil Engineering at the Eskişehir OsmanGazi University for special
assistance. I thank the members of the thesis defense committee, Assist. Prof. Dr. Ahmet
Vefa ORHON of the Department of Architecture at Dokuz Eylul University and Assist.
Prof. Dr. Cengiz ÖZMEN of the Department of Interior Architecture at Çankaya
University. I am equally grateful to Assoc. Prof. Dr. Deniz ŞENGEL for her trust and
encouragement since her decrease. Also, I would like to express my special thanks to
İsmail Hakkı ÇAĞATAY of the Department of Civil Engineering at Çukurova
University for helpful suggestions. Thanks to my graduate colleagues Yusuf YILDIZ,
Funda YAKA and Feray MADEN, Research Assistants and PhD candidates in
architecture at İYTE, who has always been there with solutions.
Finally, I would like to express my gratitude to my parents Mehmet and Sultan
İNAN and my brother Zeynel İNAN for their encouragement, help, immense patience
and trust throughout my education and in every moment of my life.

iv
ABSTRACT
THE INTERACTION OF REINFORCED SKELETON SYSTEMS AND ARCHITECTURAL FORM SUBJECTED TO EARTHQUAKE EFFECTS
The interaction of architectural form and structural configuration has become a
serious issue in the building industry because of the poor seismic performance of
reinforced concrete buildings in Turkey. Therefore, it has a determinative role on
earthquake behaviour of buildings.
The study focuses on R/C skeleton systems which are commonly constructed in
building industry of Turkey. In this study, structural irregularities in plan and vertical
direction have been investigated in detail based on Turkish Earthquake Code, 2007.
Four main cases are generated based on each structural irregularity in plan. These cases
consist of 29 main parametric models and totally 265 models with sub models. They are
designed as to have symmetrical or asymmetrical plan geometry and regular or irregular
rigidity distribution. All models are analyzed by using the structural analyzing software,
IdeCAD Static 6.0055. The changes in the earthquake behaviour of buildings were
examined according to the number of stories, number of axes, configuration of
structural elements, floor openings, projections in plan and vertical direction.
Many findings are obtained and assessed as a result of the analysis for each
structural irregularity. The most remarkable result shows that structural irregularities
can be observed in completely symmetric buildings in terms of plan geometry and
rigidity distribution due to the inaccurate structural system selection. Moreover, it has
emerged that symmetry in the rigidity distribution is more important than the symmetry
in the plan geometry.

v
ÖZET
DEPREM ETKİLERİNE MARUZ KALAN BETONARME İSKELET SİSTEMLERİN VE MİMARİ FORMUN ETKİLEŞİMİ
Mimari form ve strüktürel konfigurasyonun etkileşimi Türkiye’deki betonarme
binaların kötü deprem davranışı nedeniyle inşaat sektöründe ciddi bir sorun haline
gelmiştir. Bu nedenle binaların deprem davranışları üzerinde belirleyici bir role sahiptir.
Bu çalışma Türkiye’de inşaat sektöründe yaygın olarak inşa edilen betonarme
iskelet sistemler üzerine odaklanmıştır. Plan düzlemindeki ve düşey doğrultudaki yapı
düzensizlikleri 2007 Türk Deprem Yönetmeliğine dayandırılarak detaylı bir biçimde
incelenmiştir. Plan düzlemindeki her yapı düzensizliği baz alınarak dört ana örnek
çalışma oluşturulmuştur. Bu örnek çalışmalar 29 ana parametrik model ve alt modelleri
ile beraber toplam 265 modelden oluşmaktadır. Modeller simetrik veya asimetrik plan
geometrisi ve düzenli veya düzensiz rijitlik dağılımına sahip olacak şekilde
tasarlanmıştır. Tüm modeller, IdeCAD Statik 6.0055 yapı analiz programı ile analiz
edilmiştir. Binaların, kat sayısı, aks sayısı, taşıyıcı elemanların konfigurasyonu, döşeme
açıklıkları, plan ve düşey doğrultudaki çıkma durumlarına göre deprem davranışları
incelenmiştir.
Yapı düzensizlikleri için yapılan analizlerin sonucunda birçok bulgu elde edilmiş
ve değerlendirilmiştir. En dikkat çekici sonuç, plan geometrisi ve rijitlik dağılımı
bakımından tamamen simetrik binalarda dahi, yanlış taşıyıcı sistem seçiminden dolayı
yapı düzensizlikleri görülebilmektedir. Ayrıca rijitlik dağılımındaki simetrinin, plan
geometrisindeki simetriden daha önemli olduğu ortaya çıkmıştır.
vi
TABLE OF CONTENTS
LIST OF FIGURES ......................................................................................................... ix
LIST OF TABLES ........................................................................................................... xi
LIST OF ABBREVIATIONS ........................................................................................ xiv
CHAPTER 1. INTRODUCTION ................................................................................... 17
1.1. Statement of the Problem...................................................................... 17
1.2. Objectives and Scope............................................................................ 20
1.3. Materials and Methodology .................................................................. 22
1.3.1. Selected Software for Analysis ....................................................... 23
1.4. Disposition ............................................................................................ 24
1.5. Review of Past Studies ......................................................................... 25
CHAPTER 2. EARTH AND EARTHQUAKES ............................................................ 30
2.1. Anatomy of Earthquake ........................................................................ 30
2.2. Types of Earthquakes ............................................................................ 32
2.2.1. According to the Origin................................................................... 32
2.2.2. According to the Focal Depth ......................................................... 32
2.2.3. According to the Distance from the Recording Device .................. 33
2.2.4. According to the Magnitude............................................................ 33
2.3. Types of Seismic Faults ........................................................................ 33
2.4. Types of Seismic Waves........................................................................ 34
2.4.1. Body Waves .................................................................................... 34
2.4.2. Surface Waves................................................................................. 36
2.5. Basic Terms ........................................................................................... 38
2.6. Earthquake Measurement Parameters ................................................... 39
2.6.1. Intensity........................................................................................... 39
2.6.2. Magnitude ....................................................................................... 41
2.7. Seismicity of the World......................................................................... 42
2.8. Seismicity of Turkey ............................................................................. 45

vii
CHAPTER 3. STRUCTURAL IRREGULARITIES AND SOLUTION
SUGGESTIONS...................................................................................... 47
3.1. Irregularities in Plan.............................................................................. 49
3.1.1. Torsional Irregularity (A1) ............................................................ 49
3.1.1.1. The Plan Geometry/Form ...................................................... 51
3.1.1.2. Rigidity Distribution.............................................................. 55
3.1.1.3. Solution Suggestions for Torsional Irregularity (A1) ............ 56
3.1.2. Floor Discontinuities (A2)............................................................... 61
3.1.2.1. Solution Suggestions for Floor Discontinuity (A2)............... 63
3.1.3. Projections in Plan (A3) .................................................................. 63
3.1.3.1. Solution Suggestions for Projections in Plan (A3) ................ 64
3.1.4. Non Parallel Axis (A4) .................................................................... 65
3.1.4.1. Solution Suggestions for Non Parallel Axis (A4).................. 65
3.2. Irregularities in Vertical Direction ........................................................ 66
3.2.1. Interstorey Strength Irregularity/Weak Storey (B1) ...................... 66
3.2.1.1. Solution Suggestions for Weak Storey (B1) .......................... 69
3.2.2. Interstorey Stiffness Irregularity/Soft Storey (B2) .......................... 71
3.2.2.1. Solution Suggestions for Soft Storey (B2) ............................ 73
3.2.3. Discontinuity of Vertical Structural Elements (B3)......................... 74
3.2.4. Short Column Effect ........................................................................ 76
3.2.4.1. Solution Suggestions for Short Column ................................ 78
3.2.5 Strong Beam-Weak Column ............................................................. 78
3.2.6. Seismic Pounding Effect.................................................................. 79
CHAPTER 4. EATHQUAKES ON REINFORCED CONCRETE STRUCTURES ..... 83
4.1. Characteristics of R/C and its Earthquake Behaviour........................... 83
4.2. Basic Principles of Earthquake Resistant Design ................................. 88
4.3. Analysis Rules of Earthquake Resistant Design ................................... 91
4.3.1. Definition of Elastic Seismic Loads: Spectral Acceleration
Coefficient A(T)............................................................................... 91
4.3.2. Effective Ground Acceleration Coefficient (Ao)............................. 91
4.3.3. Building Importance Factor (I)........................................................ 92
4.3.4. Spectrum Coefficient S(T)............................................................... 92
4.4. Analysis Methods................................................................................... 94

viii
4.4.1. Equivalent Seismic Load Method.................................................... 94
4.4.2. Mode-Combination Method ............................................................ 94
4.4.3. Analysis Methods in Time Domain ................................................. 95
4.4.4. Selection of Analysis Method .......................................................... 95
4.5. Effective Storey Drifts ........................................................................... 97
4.6. Second Order Effects ............................................................................. 98
CHAPTER 5. NUMERICAL ANALYSIS ..................................................................... 99
5.1. Case I: R/C Structural Systems: Symmetric Configuration (A1) ....... 100
5.1.1. Parametric Model Ia: Frame Systems ........................................... 101
5.1.2. Parametric Model Ib: Frame System + Rigid Core....................... 104
5.1.3. Parametric Model Ic: Shear-Frame System (1) ............................ 107
5.1.4. Parametric Model Id: Shear-Frame System (2) ............................ 110
5.1.5. Parametric Model Ie: Shear-Frame System (3)............................. 113
5.1.6. Parametric Model If: Shear-Frame System (4) ............................. 116
5.1.7. Discussion and Results of Case I .................................................. 119
5.2. Case II: R/C Structural Systems: Asymmetric Configuration (A1).... 122
5.2.1. Discussion and Results of Case II................................................. 126
5.3. Case III: Floor Discontinuity (A2)...................................................... 129
5.3.1. Parametric Model IIIa ................................................................... 130
5.3.2. Parametric Model IIIb................................................................... 132
5.3.3. Parametric Model IIIc ................................................................... 133
5.3.4. Parametric Model IIId................................................................... 135
5.3.5. Parametric Model IIIe ................................................................... 137
5.3.6. Parametric Model IIIf.................................................................... 139
5.3.7. Parametric Model IIIg................................................................... 141
5.3.8. Parametric Model IIIh................................................................... 143
5.3.9. Parametric Model IIIi.................................................................... 145
5.3.10. Discussion and Results of Case III ............................................. 147
5.4. Case IV: Projection in Plan (A3) ........................................................ 150
5.4.1. Parametric Model IVa: L Form ..................................................... 150
5.4.2. Parametric Model IVb: H Form .................................................... 152
5.4.3. Parametric Model IVc: T Form..................................................... 154
5.4.4. Parametric Model IVd: U Form .................................................... 155

ix
5.4.5. Parametric Model IVe: Square Form ............................................ 157
5.4.6. Discussion and Results of Case IV ............................................... 157
CHAPTER 6. CONCLUSIONS ................................................................................... 162
6.1. Conclusions ........................................................................................ 162
6.2. Recommendations for Further Studies ............................................... 166
REFERENCES .......................................................................................................... 167
x
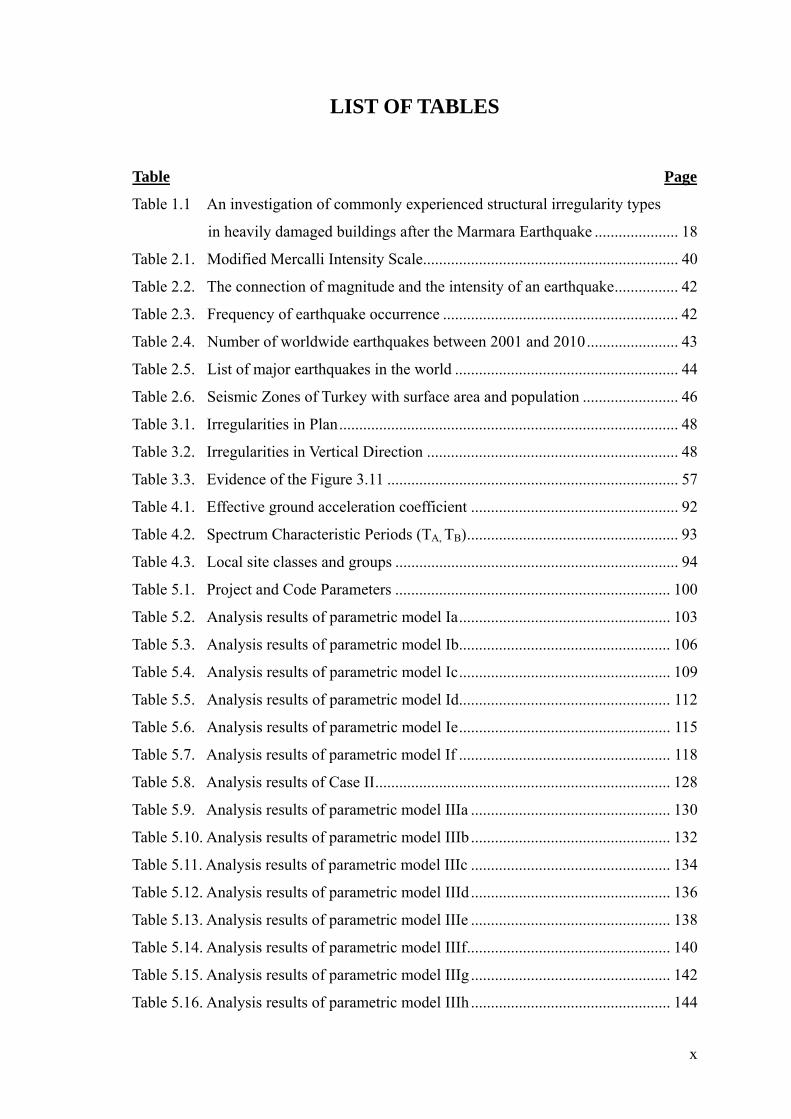
LIST OF TABLES
Table Page
Table 1.1 An investigation of commonly experienced structural irregularity types
in heavily damaged buildings after the Marmara Earthquake ..................... 18
Table 2.1. Modified Mercalli Intensity Scale................................................................ 40
Table 2.2. The connection of magnitude and the intensity of an earthquake................ 42
Table 2.3. Frequency of earthquake occurrence ........................................................... 42
Table 2.4. Number of worldwide earthquakes between 2001 and 2010....................... 43
Table 2.5. List of major earthquakes in the world ........................................................ 44
Table 2.6. Seismic Zones of Turkey with surface area and population ........................ 46
Table 3.1. Irregularities in Plan..................................................................................... 48
Table 3.2. Irregularities in Vertical Direction ............................................................... 48
Table 3.3. Evidence of the Figure 3.11 ......................................................................... 57
Table 4.1. Effective ground acceleration coefficient .................................................... 92
Table 4.2. Spectrum Characteristic Periods (TA, TB)..................................................... 93
Table 4.3. Local site classes and groups ....................................................................... 94
Table 5.1. Project and Code Parameters ..................................................................... 100
Table 5.2. Analysis results of parametric model Ia..................................................... 103
Table 5.3. Analysis results of parametric model Ib..................................................... 106
Table 5.4. Analysis results of parametric model Ic..................................................... 109
Table 5.5. Analysis results of parametric model Id..................................................... 112
Table 5.6. Analysis results of parametric model Ie..................................................... 115
Table 5.7. Analysis results of parametric model If ..................................................... 118
Table 5.8. Analysis results of Case II.......................................................................... 128
Table 5.9. Analysis results of parametric model IIIa .................................................. 130
Table 5.10. Analysis results of parametric model IIIb .................................................. 132
Table 5.11. Analysis results of parametric model IIIc .................................................. 134
Table 5.12. Analysis results of parametric model IIId .................................................. 136
Table 5.13. Analysis results of parametric model IIIe .................................................. 138
Table 5.14. Analysis results of parametric model IIIf................................................... 140
Table 5.15. Analysis results of parametric model IIIg .................................................. 142
Table 5.16. Analysis results of parametric model IIIh .................................................. 144

xi
Table 5.17. Analysis results of parametric model IIIi................................................... 146
Table 5.18. Analysis results of case IV......................................................................... 160

xii
LIST OF FIGURES
Figure Page
Figure 1.1. Distribution of building damage with the number of stories after 1999
earthquakes in Düzce. .................................................................................. 18
Figure 1.2. Flowchart of Structural Analysis Software, IdeCAD................................... 24
Figure 2.1. Types of Faults ............................................................................................. 34
Figure 2.2. Perspective view of P-wave ......................................................................... 35
Figure 2.3. Perspective view of S-wave ......................................................................... 36
Figure 2.4. Perspective view of L-wave ......................................................................... 37
Figure 2.5. Perspective view of R-wave......................................................................... 37
Figure 2.6. Basic Earthquake Terminology .................................................................... 38
Figure 2.7. Tectonic map of Turkey ............................................................................... 45
Figure 3.1. Torsional Irregularity (A1) ........................................................................... 49
Figure 3.2. Design Eccentricity ...................................................................................... 50
Figure 3.3. Working mechanism of the Gravity and Rigidity Centre ............................. 51
Figure 3.4. Different building forms............................................................................... 52
Figure 3.5. Rectangular form.......................................................................................... 52
Figure 3.6. Failures in circle form .................................................................................. 53
Figure 3.7. Behaviour of L-shaped structure against earthquake forces ........................ 54
Figure 3.8. Reentrant corners and notch points .............................................................. 55
Figure 3.9. Different collapses due to the torsion........................................................... 56
Figure 3.10. Seismic joints.............................................................................................. 56
Figure 3.11. Softening Reentrant corners ....................................................................... 57
Figure 3.12. Regular and irregular structural system configuration ............................... 59
Figure 3.13. Discontinuity of beams............................................................................... 60
Figure 3.14. Common Structural Failures....................................................................... 60
Figure 3.15. Floor discontinuity (A2) ............................................................................. 62
Figure 3.16. Projections in Plan (A3) ............................................................................. 63
Figure 3.17. Formation mechanism of Weak Storey (B1) .............................................. 67
Figure 3.18. Gravity centre in pyramidal configuration ................................................. 68
Figure 3.19. Maximum projection values ......................................................................... 68
Figure 3.20. Damage due to the heavy cantilevers ......................................................... 69

xiii
Figure 3.21. Solutions for Weak Storey .......................................................................... 70
Figure 3.22. Storey Drifts ............................................................................................... 71
Figure 3.23. The soft first storey failure mechanism ...................................................... 72
Figure 3.24. Common types of soft storey irregularity................................................... 73
Figure 3.25. Solutions for Soft storey irregularity (B2).................................................. 74
Figure 3.26. Types and solutions of B3 irregularity ....................................................... 75
Figure 3.27. Damage due to the gusset on columns........................................................ 75
Figure 3.28. Tall and Short Columns Behaviour ............................................................ 76
Figure 3.29. Formation of short columns........................................................................ 77
Figure 3.30. Damage due to the hollow-tile floor slab ................................................... 79
Figure 3.31. Pounding due to the torsion between adjacent buildings ........................... 80
Figure 3.32. Pounding from Marmara earthquake due to the liquefaction..................... 81
Figure 3.33. Dynamic pounding model for one-storey building..................................... 82
Figure 3.34. Dynamic pounding model for different floors............................................ 82
Figure 4.1. Components of concrete and Reinforced Concrete...................................... 84
Figure 4.2. Equivalent earthquake forces and base shear forces .................................... 85
Figure 4.3. Inertia forces................................................................................................. 86
Figure 4.4. Design acceleration spectrum....................................................................... 93
Figure 4.5. A sample for the different modes of the structure ........................................ 95
Figure 4.6. Selection of the method for seismic analysis ............................................... 97
Figure 4.7. Effective storey drifts ................................................................................... 98
Figure 5.1. Structural plans of parametric model Ia ..................................................... 102
Figure 5.2. Structural plans of parametric model Ib ..................................................... 105
Figure 5.3. Structural plans of parametric model Ic ..................................................... 108
Figure 5.4. Structural plans of parametric model Id ......................................................111
Figure 5.5. Structural plans of parametric model Ie ..................................................... 114
Figure 5.6. Structural plans of parametric model If...................................................... 117
Figure 5.7. Structural plans of parametric models in case II ........................................ 123
Figure 5.8. Structural plan and 3D view of parametric model IIIa............................... 130
Figure 5.9. Structural plan and 3D view of parametric model IIIb............................... 132
Figure 5.10. Structural plan and 3D view of parametric model IIIc............................. 134
Figure 5.11. Structural plan and 3D view of parametric model IIId............................. 136
Figure 5.12. Structural plan and 3D view of parametric model IIIe............................. 138
Figure 5.13. Structural plan and 3D view of parametric model IIIf ............................. 140

xiv
Figure 5.14. Structural plan and 3D view of parametric model IIIg............................. 142
Figure 5.15. Structural plan and 3D view of parametric model IIIh............................. 144
Figure 5.16. Structural plan and 3D view of parametric model IIIi ............................. 146
Figure 5.17. Structural plan and 3D view of parametric model IVa ............................. 151
Figure 5.18. Structural plan and 3D view of parametric model IVb ............................ 153
Figure 5.19. Structural plan and 3D view of parametric model IVc............................. 154
Figure 5.20. Structural plan and 3D view of parametric model IVd ............................ 156
Figure 5.21. Maximum torsional irregularity coefficients according to the different
storied sub models of case IV ................................................................... 158
xv
LIST OF ABBREVIATIONS
A Storey gross area
A1 Torsional Irregularity
A2 Floor Discontinuity
A3 Projections in Plan
A4 Nonparallel Axes
A(T) Spectral Acceleration Coefficient
Afo Floor opening area
AAfo The ratio of floor opening
ΣAe Effective Shear Area at any storey for the earthquake direction
considered
ΣAg Sum of section areas of structural elements at any storey
behaving as structural walls in the direction parallel to the
earthquake direction considered
ΣAk Sum of masonry infill wall areas (excluding door and window
openings) at any storey in the direction parallel to the
earthquake direction considered
Ao Effective Ground Acceleration Coefficient
ΣAw Sum of effective web areas of column cross sections
B1 Weak Storey
B2 Soft Storey
B3 Discontinuity of Vertical Structural Elements
Di Enlargement factor to be applied to ± 5 % additional
eccentricity at i’th storey of an irregular buildings in terms of
torsion
e eccentricity
ERD Earthquake Resistant Design
Fi Design seismic load acting at i’th storey in Equivalent Seismic
Load Method
g Acceleration of Gravity (9.81 m/s2)

xvi
Hi Height of i’th storey of building measured from the top
foundation level
JICA Japan International Cooperation Agency
L waves Love Waves
n Live Load Participation Elements
P waves Primary Waves
R waves Rayleigh Waves
R Structural Behaviour Factor
R/C Reinforced Concrete
S waves Secondary Waves
S(T) Spectrum Coefficient
Sae(T) Elastic spectral acceleration (m/s2)
T Building normal period
TA, TB Spectrum Characteristic Periods
TEC Turkish Earthquake Code
TS Turkish Standards
USGS United State Geological Survey
V Base shear force
Vt Total Equivalent Seismic Load acting on the building (base
shear) in the Earthquake Direction considered
wi Storey weight
Z1 A type of Local Site Class
∆i Reduced storey drift of i’th storey of building
(∆i)avg Average reduced storey drift of i’th storey of building
(∆i)max Maximum storey drift of i’th storey of building
(δi)max Maximum effective storey drift of i’th storey of building
ηbi Torsional irregularity Coefficient defined at i’th storey of
building
ηci Weak Storey irregularity Coefficient defined at i’th storey of
building
ηki Soft Storey irregularity Coefficient defined at i’th storey of
building
θi Second Order Effect indicator defined at i’th storey of building

17
CHAPTER 1
INTRODUCTION
This chapter includes the main statement and the aim of the thesis together with
the scope of the problem definition and the scientific methodology. It introduces the
background of the main argument, dispositions and finally the outline of the thesis.
1.1. Statement of the Problem
Turkey is situated in a seismically active region and suffers from earthquakes at
frequent intervals, which cause considerable loss of life and property, and has negative
impacts on the national economy (Öztekin & Yıldırım, 2007; Gönençen, 2000). It is
expected that it faces with earthquakes in the future as well which are presumably turn
to disasters by the collapses of the structures. Accordingly, it is too significant to design
earthquake resistant buildings in order to defend the structures against significant
earthquake loads. This statement supports the general objective of the study that
earthquake resistant design of buildings is a vital need for Turkey.
This study focuses on reinforced concrete (R/C) skeleton buildings which are
the mainstream construction system in Turkey. Many reasons can be asserted for this
condition such as its cheapness, availability, sufficiency in qualified personnel, etc. In
spite of containing various structural irregularities, today the vast majority of urban
population in Turkey living in multi-storey R/C apartment blocks. Furthermore, the
majority of the built environment consists of typical five storey R/C buildings. Düzce
Municipal Government conducted a building damage survey after 1999 Marmara
earthquakes on relating damage grade to building height. These results are illustrated in
Figure 1.1. It is evident that building vulnerability remarkably increases with the
number of stories. The percentages of damage grades are given for each total storey
number separately. Especially four and five story buildings appear to be more
vulnerable than the others (Sucuoğlu & Yılmaz, 2000).

18
0
10
20
30
40
50
60
70
80
1 2 3 4 5 6
Number of stories
Per
cent
age
of d
amag
ed b
uild
ings
Light / NoneModerateSevere / Collapsed
Figure 1.1. Distribution of building damage with the number of stories after 1999 earthquakes in Düzce (Source: Sucuoğlu & Yılmaz, 2000)
After the Marmara Earthquake, an investigation was made on ten heavily or
severe destroyed buildings in 1999, August 17, the Marmara earthquake in the province
of Düzce (Bakar, 2003). They have been investigated in terms of their structural
irregularities and it is observed that they are all multi-storey R/C skeleton buildings
which are commonly used for commercial or dwelling purposes. Based on Bakar’s
study the number of buildings which have the structural irregularity is summarized in
Table 1.1. The table draws attention to the (A1) torsional irregularity and (B2) soft
storey.
Table 1.1. An investigation of commonly experienced structural irregularity types in heavily damaged buildings after the Marmara Earthquake
Reviewed Project Number Non- existing Existing
A1 10 - 10 A4 10 2 8 B2 10 - 10
The structural irregularities are described in the Turkish Earthquake Code, 2007
(TEC, 2007). But, in practise it is quite significant and required to gain an
understanding of the problems in projects at least in terms of structural irregularity, and

19
then manage to solve the problems using problem-oriented solutions. Earthquake is a
common and significant research field ranging from social sciences to technical
sciences. However, the structural problems caused by an earthquake are generally seen
as an engineering problem even though they can be eliminated through the design
phase. Safety precautions should have a significant position in architectural design.
Bayulke (2001b) states that the safety of a building is strongly related to its architectural
design and its structural system. For this reason, architects should have an awareness of
the problems about structural irregularities in terms of both problems in plan and
structural configuration in order to achieve the reasonable and logical solutions.
Architecture is a profession which exists to solve the shelter problems of
humanity in a way that is in harmony with nature and the force of nature (Işık, 2003).
Producing safety built environment is one of the duties of architectural design. For that
reason, this study aims to explore architectural problems in ERD to underline and
understand architectural faults, and then its interaction with structural configuration to
develop basic knowledge and perspective. If earthquake effects on existing buildings
from the past destructive earthquakes are considered, it can be clearly seen that failures
on buildings start at the beginning of the architectural design phase. Therefore, there
exists a strong relationship between the architectural design of building and its
earthquake safety. Besides, all types of damages are partly rooted, to a greater or lesser
extent, in architectural design decisions.
Architectural design decisions have a significant effect on earthquake behaviour
of structure that influences the seismic performance of the building due to the
particularly building and structural system configuration issues. According to Erman
(2002), “earthquake resistant architectural principles are not the provisions that could be
inserted by the structural engineer after the completion of architectural design. They
should be applied to the project during the architectural design phase”(p.102).
Architectural design process plays an active role in the earthquake behaviour of
structures.
Regular configuration and appropriate design decisions should be developed to
provide better seismic behaviour, which means ideal or optimum configuration for
overcoming with devastating earthquake loads. Furthermore, these loads have to
calculate should be applied on both horizontal (plan) and vertical direction (Naeim,
2001). However, sometimes functional requirements, customer demands, environmental

20
factors, etc determine the design decisions. On the other hand, regularity does not mean
a symmetric and repetitive solution, which is limited by a series of principles. It
searches appropriate solutions for better seismic behaviour of buildings that are in
harmony with technological innovations (Mezzi, Parducci, & Verducci, 2004).
Architects are primary responsible from the overall picture observed after
earthquakes due to the being the designer of the buildings. It is important to underline
that ERD should not be seen just as an engineering calculation issue. Nevertheless,
there is still hope for earthquake resistant R/C structures. This thesis verifies that it is
possible to prevent structural irregularities without significant concessions.
1.2. Objectives and Scope
The main objective of this thesis is to explore the effective factors on structural
irregularities to develop a substantial guide for architects and students of architecture in
order to design earthquake resistant buildings. The earthquake resistance of a building is
strongly related to architectural design and its interaction with structural configuration.
In Turkey, the mainstream type of structural system is R/C. Therefore, in this study the
behaviour of the R/C skeleton buildings is investigated on the bases of the structural
irregularities that defined in the TEC (2007). Four cases having different structural
irregularities are created and analyzed by IdeCAD structural analysis software. From
the IdeCAD earthquake analysis reports, structural irregularities are obtained. The
analyses focus on three basic aims. The first aim of the analysis is to assess the effective
factors leading to structural irregularities. The second aim is to contribute to the general
understanding and perception of the architectural characteristics of the R/C structures
among architects and students of architecture based on TEC (2007). The third aim is to
develop a designer guide especially for using initial part of the design stage or in the
latter part for rapidly design control by architects or students of architecture.
The study presents a broad outline on structural irregularities in order to
emphasize the architectural design faults which are in fact wrong as we know true. It
describes basic problems in plan and structural system configuration which are
frequently encountered at the initial phase of design. Any kind of failure made in the
plan or the structural member’s configuration causes different structural behaviour
under earthquake loads.

21
Both architectural design and structural configuration have the same level of
importance. The interaction between both of them determines the behaviour of
structures against earthquake loads. Failures in the architectural design phase can not be
regulated by calculations or a detailed structural design done later by the structural
engineer (Ersoy, 1999). A seismically well-arranged architectural design is necessary in
order to overcome from the devastating earthquake loads.
The study mainly addresses to the architects, students of architecture and
researchers who are interested in this kind of subject to improve a perception about
ERD. There are many publications related to ERD, but they are generally written with
an engineering understanding or perception except providing awareness among
architects. When the effects of earthquake on structures are considered, the concept of
ERD is generally accepted as an engineering profession consisting with various stacks
of calculation, analysis, construction details, etc. As earthquake forces affect the whole
building, earthquake resistance of a building should be a major issue in the
responsibility of various professionals and people related to the building construction
(Zacek, 2005a). Each discipline has different responsibilities about their own roles in
ERD.
In this thesis, TEC (2007) is taken the basic resource and it is firstly translated
and developed in a visual presentation which is for clarifying the technical dimension
for architects. Then the numerical studies are performed in order to prove the illustrated
structural irregularity conditions to contribute to the development of awareness and
responsibility of earthquake resistant architectural design in Turkey.
1.3. Materials and Methodology
The study concentrates on the interaction between the architectural design and
structural configuration. This is a significant issue because it has come up with the same
damage picture after each earthquake, but then it has always been forgotten. The main
aim is to explore the effective factors on structural irregularities. In line with the aim of
the study, first of all a comprehensively survey is conducted on each structural
irregularities according to the TEC (2007), and then four cases are created including
each structural irregularity. Each case is designed as to have different number of sub-
models. All models are analyzed by IdeCAD Static 6.0055 which is three dimensional

22
structural analysis software. The models occupy wider space in the study because each
structural irregularity condition especially in plan defined in the TEC (2007) is
examined. The theoretical materials which are used for this study can be listed as
follows:
1. Survey of the master and doctoral thesis from the database of the the
Council of Higher Education of the Republic of Turkey.
2. Survey of the domestic and foreign publications related to the subject in the
Turkish Earthquake Code, books, articles, conference proceedings,
3. Survey of the publications that appeared after the recent-past earthquakes in
Turkey for a definition and analysis of common structural faults and
architectural faults.
4. Drawings for illustration of each structural irregularity
5. Photographs of building damage that appeared after the recent-past
earthquakes in Turkey.
Keeping the aims of the study in mind, the steps to be considered in achieving
the goals of the thesis can be listed as follows:
1. Investigation of the structure of Earth and Earthquakes
2. A comprehensive research on structural irregularities based on TEC (2007)
and solution suggestions
3. Examination of the earthquakes on R/C structures
4. Description of the earthquake resistant design principles and analysis
methods
5. Determination of the structural analysis software, IdeCAD Static 6.0055
6. The structural analysis of the interaction of architectural design decision
with R/C structural configuration under earthquake loads
• Demonstration of earthquake effect on each type of structural
irregularity through a number of cases consisting a sequence of
analytical models
• Analysis of cases consisting parametric models and their sub-models by
the structural software, IdeCAD Static 6.0055
• Discussion of the results of each cases

23
7. Discussion and Evaluation of the results obtained from the whole structural
analysis
• Explore the effective factors on structural irregularities
1.3.1. Selected Software for Analysis
IdeCAD structural software is an integrated, design and detailing software for
reinforced concrete structures and especially developed for structural engineers. It
covers from all stages related to reinforced concrete structures, from dynamic analyses
to design of reinforced concrete cross-sections. All the necessary controls are made
automatically in IdeCAD® Static 6 software which is compatible with TEC (2007) and
Turkish Standard, TS 500. Moreover, reinforcement details are automatically created.
IdeCAD Structural and IdeCAD Architectural use the same static components.
Object properties are compatible with each other. Thus, this characteristic provides
carrying out the design process in advance of static calculations. Static calculation and
reinforced-concrete measurements are carried out on the basis of the three-dimensional
calculation model. 3D representation provides visual control of the model. The
structural properties of all the components such as column, wall is given automatically
by software. The 3D frame structure consisting of components such as columns, beams
and walls can be analyzed both statically and dynamically.
In this study, IdeCAD structural software is chosen because, it presents a
common platform for collaboration between the structural engineers and architects.
Moreover, it is entirely compatible with Turkish Standard TS 500 and Turkish
Earthquake Code, 2007. The flowchart of the analysis software is given in the Figure
1.2.

24
Figure 1.2. Flowchart of structural analysis software, IdeCAD
1.4. Disposition
General outline of the thesis is presented in six chapters. Chapter 1, the
introduction, includes the main argument, the objectives of the thesis and general
background information about the research field with its disposition.
Chapter 2 is the structure of Earth and earthquakes. It presents comprehensive
information related to the phenomena of earthquake. A description of the seismic
characteristics of the world and Turkey is compared and discussed in order to gain basic
knowledge related to earthquake.
Chapter 3, a comprehensive research is made on structural irregularities in both
horizontal plan and vertical direction according to the TEC (2007). All architectural and
structural configuration problems are investigated. Moreover, suggestive solutions are
examined for each structural irregularity.
Chapter 4 starts with the description of the material characteristics of the R/C. In
the following, basic principles and analysis rules for earthquake resistant design are
Data Entry
Load Analysis of Structural Elements
TEC-Control
Calculation of Gravity and Rigidity Centre
Calculation of End Point Forces
Calculation of Node Points Displacement
R/C Calculation of Structural Elements
End off the Analysis

25
described. In the end of this chapter, the structural analysis software is introduced
which is used in the case models.
Chapter 5 is the numerical analysis. It presents structural irregularities which is
the main argument of the thesis. The study is specifically interested in the structural
irregularity in plan, for each building is generally designed by the replication of the
same storey plan. To examine each type of structural irregularity, a sequence of
analytical models are created and analyzed with the structural software, IdeStatic 6.001.
Totally, the chapter consists of four cases, and each case has a series of parametric
models. The main parameters such as torsional irregularity coefficient, soft storey
coefficient, effective storey drift, second order effect, etc affecting the structural
irregularity conditions are discussed in the final part of each case.
Chapter 6 is the final chapter. It comprises a summary of the previous
assessments and the discussion of the results of the case studies. The thesis ends with
recommendations for the further studies.
1.5. Review of Past Studies
Earthquake behaviour of reinforced concrete structures in order to prevent
structural irregularities has always been a remarkable subject and examined by many
researchers. Some of the significant studies related to the subject made up to now are
summarized as below:
Özmen (2004) investigated the conditions which cause torsional irregularity. In
order to achieve the goal of the study, a series of eight walled and framed sample
structures with different shear wall configuration is generated and their behaviour under
earthquake loading is investigated. It is concluded that maximum torsional irregularity
values are obtained when the both number of axes and the number of stories are low.
Moreover, when the structural walls were placed closer to the gravity centre, the
torsional irregularity increased.
Döndüren and Karaduman (2007) were investigated the torsional irregularities of
the constructions having different plan geometry or rigidity distribution were
investigated. All the models are asymmetric in terms of rigidity distribution according
to the X axes due to the placement of the rigid core. Moreover, the dimensions of the
frame in each model and the beam connections are not similar. To realize the aim of the

26
study, the behaviours of multi-storeyed (15 storied) buildings having seven different
forms of triangular, elliptical, square, rectangular, circular, L and T shaped geometries
were considered and investigated under seismic effects. Square form shows the best
seismic behaviour under earthquake loads.
Özmen (2008) made an investigation on cost analysis of earthquake resistant
structures. The specific type of the thesis focused on was the reinforced concrete
skeleton system. The parametric examples which were used in the thesis were chosen
among applied projects in the city of Bolu. It was concluded from the study that
designing earthquake resistant structures only resulted in an acceptable 4-8% rise in the
overall building cost.
Mendi (2005) examines awareness about the roles and responsibilities of
architects for earthquake resistance of structures for being the designers of them. It is
aimed to explore architecture-based issues related to earthquake resistant design and
evaluate awareness, interests or consciousness among architects about the subject.
Architects working in the architectural offices of Ankara, towards earthquake and
architecture-based seismic design issues is questioned and evaluated with a survey in
the form of questionnaires. The evaluation of the results is presented with the help of
statistical software, SPSS. It was inferred from the survey that incorporation of
architecture-based seismic design issues into architectural design process should be
enhanced among architects.
Dimova and Iliaalashki (2003) examined the effects of the additional torsion in
symmetric buildings. They made analytical and numerical analysis and on the bases of
these analyses it is concluded that even under small additional torsion the symmetric
buildings show irregular behaviour and the torsional moments cannot be exactly
described by the application of the static load calculation. A convenient coefficient
should be calculated for the design practice to estimate accurately the accidental
torsional effects on symmetric structures.
Gülay and Çalım (2003) investigated the torsional irregularity condition on ten
storey shear wall framed buildings. The torsional irregularity coefficients of the modals
evaluated according to the UBC 97 and TEC (97). The effects of absolute and relative
displacements are examined. It is observed that UBC coefficients are rather critic with
respect to the TEC (97) coefficients.
27
Güllü and Yerli (2004) investigated the TEC (97) and the A2 irregularity
condition in shear-walled structures. The effects of shear wall arrangements in the plan
are examined for improving the A2 irregularity condition.
Yulu (2003) examined the effects of floor discontinuity (A2) and Projections in
plan (A3) by taking into consideration of TEC (97).
Akıncı (2003), investigated the torsional irregularity in multi-storied shear-frame
system of R/C structures. The effects of axis number, plan geometry and rigidity
distribution were examined. The calculations were made by a program which was
created by using Visual Basic 5.0. Moreover, analyses of the models were also made by
the structural software called SAP, and the results were compared. It was observed in
the study that, the models which were irregular in terms of rigidity distribution showed
similar sismic performance with the irregular models in terms of both plan geometry
and rigidity distribution. Furthermore, the positions of shear walls were questioned, and
it was gained that the torsional irregularity coefficients reached high values when the
shear walls were placed at inner axis instead of at outer axis.
Evcil (2005) examined torsional irregularity (A1) in detail. The variations in
torsional irregularity coefficients according to the axis number and storey number were
investigated in depth.
Atımtay (2000) investigated the Turkish Earthquake Code in detail with
practical examples in his book called "Instructions and examples for Specification for
Buildings to be built in Seismic Zones"
Çağatay and Güzeldağ (2002) examined various parameters in TEC (97) such as
seismic analysis methods, structural irregularities, etc. In the study, a sequence of
models were created and evaluated in terms of structural irregularity. All models were
analyzed by the structural software called SAP.
Bayülke (2001) investigated comprehensively the earthquake resistant design in
his book called “Earthquake resistant reinforced and masonry structure design”
Building configuration in terms of earthquake resistance evaluated into two main part:
architectural design and structural element design. In the study, the characteristics of
earthquake forces and the phenomena of earthquake resistant design were emphasized.
Erman (2002) searched earthquake resistant design concepts in his book called
“Earthquake information and earthquake safety architectural design” The general effects
of earthquakes and its effects on structures were examined. The main concepts for

28
earthquake safety architectural design were evaluated in R/C, steel, masonry and timber
structure.
Tezcan (1998), examined the structural irregularities in his book called “An
architect logbook for earthquake resistant architectural design” In the book, various
damage photographs in structures were given which were observed after earthquakes
both in Turkey and in the world.
Tuna (2000), mentioned earthquake regulations and the effects of earthquake
forces on structures i in his book called “Earthquake resistant structure design”.
Moreover, the necessary things for earthquake resistant R/C skeleton system design and
what the damages are in the structures took large place in the book.
Zacek (2002), researched earthquake resistant structure design principles in his
book called “Earthquake resistant pre-project work”. In this book, the importance of
earthquake resistant structural design and architectural aspects were emphasized.
Moreover, some information was given related to what the architectural and structural
features should have been in order to perform in the pre-project phase.
Sezer (2006) investigated the parameters affecting the torsional irregularity of
structural systems. In this thesis, different shear wall configuration and varied number
of stories were examined under earthquake loading. It is inferred from the study that if
the storey number increase, the torsional irregularity coefficient decrease.
Doğan, Ünlüoğlu, and Özbaşaran (2007) examined the overhang dimension and
length in terms of earthquake behaviour. Based on these parameters, analyses are made
and various examples are given from existing buildings in Turkey. It was concluded
from the model analysis that if the length of the overhang increases, eccentricity
increases. Moreover, unit weight of materials used in overhangs affect the eccentricity
value.
Livaoğlu and Doğangün (2003) evaluated the behavior of elements placed on the
rigid and flexible sides. Accidental eccentricity and torsional irregularity condition are
investigated with six and twelve storey buildings. Mode-combination method is used for
the seismic analysis of structures. At the end of the study, it was concluded that if the
design eccentricity is small, internal forces of structural elements located on rigid sides
reach maximum values. Conversely, if it is high, internal forces of structural elements
located on flexible sides reach maximum values.

29
In this thesis, unlike the above mentioned studies, all the factors which affect on
structural irregularities are firstly determined for R/C structures. The commonly used
R/C skeleton system types were chosen and parametric models are generated according
to the determined factors which affects on structural irregularities. The study examines
structural irregularity conditions with the models having both symmetric plan geometry
and rigidity distribution. Approximately all of the studies, which previously have been
done related to structural irregularities, focus on asymmetric plan geometries with
irregular rigidity distribution. Apart from that type of studies, this thesis basically
focuses on completely symmetric buildings in terms of both plan geometry and rigidity
distribution. Because, the goal of the study is to determine the best one among the better
designs instead of better one among the poor designs. On the other hand, the study
investigates the buildings having regular plan geometry and irregular rigidity
distribution and irregular plan geometry and regular rigidity distribution.
The study examines all structural irregularities defined in the TEC (2007).
However, it was adopted that the structural irregularities begins in the initial part of the
design phase. For that reason, the structural irregularities in plan were investigated in
detail. It was deduced from the analysis that the structural irregularities can occur in
completely symmetric buildings.

30
CHAPTER 2
EARTH AND EARTHQUAKES
This chapter provides the basic mechanism of earthquakes. It includes the
definition of earthquake and earthquake types together with the types of seismic faults
and seismic waves. It introduces the earthquake parameters such as hypocenter,
epicenter, magnitude, etc. Finally, the distribution of seismicity in the world and
seismicity in Turkey are investigated.
2.1. Anatomy of Earthquake
The Earth where we are living on has witnessed lots of stages since its formation
period. The humanity has exposed to various natural disasters while the world passing
on these stages. For instance, earthquake is one of the natural events. It is a suddenly
released energy (Celep & Kumbasar, 1992). Earthquake is not a disaster of the nature. It
is an ordinary natural event such as hurricane, drought, landslide, etc (Erman, 2002).
The earthquake phenomenon has affected human life since the beginning of the planet
formation that we are living on it (Karaesmen, 2002).
The earthquake can be defined as broad-banded vibratory ground motions. It
occurs due to the a sudden slippage on a fault of the Earth’s crust and arises from a
number of causes such as tectonic ground motions, volcanism, landslides, and man-
made explosions (Karaesmen, 2002). Tectonic-related earthquakes are the most
common type among them. They occur by releasing of the elastic stresses (Erman,
2002). Besides, they are so hazardous, because they happen close to the Earth’s crust
They occurs due to the fracture and sliding of the rock along faults within the Earth’s
crust (Krinitzsky, 1993).
Earthquakes consist of vertical and horizontal (lateral) vibrations of the ground.
These vibrations occur randomly and create a dynamic impact in character (Doğan,
2007). Düzgün (2007) states that earthquake comes out without giving any stimulus and
also each type of earthquake has different features. It’s time or location cannot be
known before it happens.
31
The mechanism of an earthquake is closely related with the structure of the
earth. It depends on especially inner structure of the earth (Coburn & Spence, 1992).
The earth consists of three distinct parts. These are the crust at the outer part of the
earth, the core at the center part and the mantle in-between. Celep and Kumbasar (1992)
describe the structure of the earth with a core having a radius of 3500 km, has liquid
feature; with a mantle having 2900 km in thick, has semi-molten feature. Thickness of
the crust measure is approximately 5-10 km under oceanic parts and 25-70 km under
continental parts. (Yılmaz & Demirtaş, 1996).
Many theories put forward to determine the causes of earthquakes. Among these
theories, the plate tectonics theory is considered as the most realistic approach (Yılmaz
& Demirtaş, 1996). According to this theory, the earth’s crust divides into plates which
consist of oceans and continents.
The crust of the earth is cracked into seven large and many other smaller plates.
Their thicknesses are approximately 50 miles. Based on their movement and the
direction of the movement, they collide and give shape to the deep ocean trenches,
mountains, volcanoes. This event causes earthquakes.
The forces of tectonic plates have shaped the earth crust. The continents are
constantly in a motion. Hundreds of millions of years ago the continents were joined
together. However, they are dissipating ever slowly. The earth’s crust states on a
dynamic flux. This dynamic process is called as continental displacement or tectonic
plate movement (Charleson, 2008). The mechanism of this movement is very
complicated. The tectonic plates may go and return to each other. Moreover, one plate
may go under the other plate or move along the borders of the plates. Energy is
accumulated with these events. If this energy becomes stronger, it is released to the
nature as a ground shake or vibration. This suddenly released energy called as the
earthquake. Most earthquakes occur at the boundaries where the plates meet. However,
some earthquakes occur in the middle of plates (Celep & Kumbasar, 1992).
2.2. Types of Earthquakes
There are many types of earthquake such as volcanic earthquake, tectonic
earthquake, deep earthquake, etc. Earthquakes can be divided into four groups
according to their features (Pampal & Özmen, 2002). They can be categorized

32
according to the origin, the focal depth, the distance from recording device, and the
magnitude.
2.2.1. According to the Origin
Earthquakes can be classified into three groups based on the origin of the
earthquakes (Lindaburg & Baradar, 2001). These are tectonic earthquakes, volcanic
earthquakes, and subsidence earthquakes. Among to these earthquakes, the tectonic
earthquakes are widely observed in the world. They have come into being due to the
movement of the plates. The hundreds of years accumulated energy release because of
the stress and friction in the Earth’s crust. The most destructive earthquakes in Turkey
situated in this group. Volcanic and subsidence earthquakes are observed lesser than the
tectonic ones. While volcanic earthquakes have come into being nearby of volcanoes
due to the explosion of active volcanoes, the subsidence earthquakes have come into
being due to the collapses of mines and caves.
2.2.2. According to the Focal Depth
Earthquakes are classified into three groups according to the size of the focal
depth (Lindaburg & Baradar, 2001). These are shallow earthquake, intermediate
earthquake and deep earthquake. While the focal depth is less than 70 km in shallow
earthquakes, it is between 70 and 300 km deep in intermediate earthquakes. On the
other hand, it is between 300 and 700 km deep in the deep earthquakes.
2.2.3. According to the Distance from the Recording Device
The earthquakes according to the distance from the recording device can be
classified into four groups (Lindaburg & Baradar, 2001). These are local earthquakes,
near earthquakes, regional earthquakes and distant earthquakes. The distance from the
recording device is less than 100 km in local earthquakes. In near earthquakes that
distance is between 100 and 1000 km. On the other hand, that distance is between 1000

33
and 5000 km in regional earthquakes. In distant earthquakes, that distance is more than
5000 km
2.2.4. According to the Magnitude
The earthquakes can be classified into six groups according to the their
magnitude (Lindaburg & Baradar, 2001). These are very strong earthquakes, strong
earthquakes, medium earthquakes, small earthquakes, micro earthquakes, and ultra
micro earthquake. Very strong earthquakes have a magnitude greater than 8.0. Strong
earthquakes have a magnitude between 7.0 and 8.0. Medium earthquakes have a
magnitude range between 5.0 and 7.0. Small earthquakes have a magnitude range
between 3.0 and 5.0. Micro earthquakes have a magnitude range between 1.0 and 3.0. If
the magnitude of an earthquake is smaller than the magnitude of 1.0, this is called as
ultra micro earthquakes.
2.3. Types of Seismic Faults
Earthquakes occur on faults. A fault is a thin zone of crushed rock that it
separates blocks of the earth's crust. When an earthquake occurs on one of these faults,
the rocks which are located on one side of the fault slip relative to one another parallel
to the fracture (Lindeburg & Baradar, 2001). The fault surface can be vertical,
horizontal or a random angle with the surface of the earth. (Lagorio, 1990). Faults
extend deep into the earth and may or may not extend up to the earth's surface. Bayülke
(2001a) states that faults can be accepted as the results of earthquakes rather than causes
of them. The commonly encountered seismic faults are illustrated in Figure 2.1.

34
(a) (b) (c)
(d) (e)
Figure 2.1. Types of fault: (a) Subsidence faults,(b) Normal Fault, (c) Reverse Fault, (d) Strike-Slip Fault, (e) Horst Fault (Source: Barka, 2000)
2.4. Types of Seismic Waves
Seismic energy spreads from the earth’s crust with waves. There exists two main
type of elastic waves or seismic waves. These are body waves and surface waves. These
waves cause shaking that is felt in the nearby region where we live, and cause
dangerous and irreparable damages (Barka, 2000).
2.4.1. Body Waves
The body waves spread within a body of rock and strike firstly during an
earthquake. Body waves travel through the earth’s interior (Lindaburg & Baradar,
2001). There are two kinds of body waves. The faster of these body waves is called
Primary wave (P wave) or longitudinal wave or compressive wave. The slower one is
called Secondary wave (S wave) or shear wave or transverse wave. They are illustrated
in Figure 2.2 and in Figure 2.3.
P waves or Primary waves are the fastest kind among the body waves as
described formerly. The P waves, which reach the surface firstly, can travel through
solids, liquids and gases (Lindeburg & Baradar, 2001). Nelson states that P wave is
moving with an acoustic wave in the air that people usually report this sound as a train

35
before they feel the shake. P waves travel about 1.7 and 1.8 times faster than S waves or
secondary waves and 2 to 3 times faster than the surface waves. Its velocity is changed
between 1.5 and 8km/sn according to the earth’s crust.
Figure 2.2. Perspective view of P-wave (Source: Braile, 2006)
The S-waves or Secondary waves travel more slowly than the P-wave. It shears
the rock sideways at right angle to the direction of propagation. This wave can only
travel through solids. Therefore, it does not travel through the earth’s core.

36
Figure 2.3. Perspective view of S-wave (Source: Braile, 2006)
2.4.2. Surface Waves
The second main type of seismic wave is called body wave. It travels along the
earth’s surface (Lindeburg & Baradar, 2001). Surface waves can be classified into two
groups. These are Love waves and Rayleigh waves. The Love waves denoted as L, and
the Rayleigh waves as R. The L wave displays vibrations which are parallel to the plane
of the earth’s surface and perpendicular to the direction of wave propagation. On the
other hand, the R wave displays vibrations which are perpendicular to the plane of the
earth’s surface and exhibits an elliptic movement. They are illustrated in Figure 2.4 and
in Figure 2.5.

37
Figure 2.4. Perspective view of L-wave (Source: Braile, 2006)
Figure 2.5. Perspective view of R-wave (Source: Braile, 2006)

38
2.5. Basic Terms
The commonly encountered basic terms related to earthquake phenomena is
explained in this part such as origin time, hypocenter, epicenter, etc. The magnitude and
intensity which are the earthquake measurement parameters are comprehensively
investigated. They can be described as follows:
Origin Time: The precise time that an earthquake fracture occurs that is defined
according to the Greenwich hour.
Hypocenter: The hypocenter of an earthquake is the point below the earth’s
surface where the fault rupture begins (Figure 2.6).
Epicenter: The epicenter of an earthquake is the vertical projection of the
hypocenter on the ground surface. It can be described as the location of an earthquake
(Figure 2.6).
Focal depth: The distance from the focus to the point of observed ground motion
is called the focal distance or depth. In other words, it is the distance between the
epicenter and hypocenter.
Focal region: Seismic waves propagate from the focus through a limited region
of the surrounding of the earth. It is called as focal region (Figure 2.6).
Aftershock and foreshock: Earthquakes constitute a significant part of the life
due to the seismicity of the world. The largest earthquake type is called main shock. If
an earthquake occurs after a main shock, this is called as aftershock. On the other hand,
if earthquake occurs before the main shock, this is called as foreshock.
Figure 2.6. Basic Earthquake Terminology (Source: Lindeburg & Baradar, 2001)
39
2.6. Earthquake Measurement Parameters
The origin time of an earthquake still cannot be predicted. However, human
being has learned much about earthquakes as well as the Earth. They have learned how
to pinpoint the locations of earthquakes and how to accurately measure their sizes.
When an earthquake occurs, the elastic energy releases and sends out vibrations
that travel throughout the Earth as described formerly. These vibrations are called
seismic waves which can be recorded on a sensitive instrument called seismograph. The
record of ground shaking recorded by the seismograph called seismogram.
2.6.1. Intensity
Chen & Scawthorn (2002) describes intensity as a metric of the effect or the
strength of the earthquake hazard at a specific location. Murty (2007) defines it as a
qualitative measure of the the effects of an earthquake at a specific location. It is based
on human behaviour and structural damage level. Numerous intensity scales has been
developed. The widely used type is the Modified Mercalli Intensity Scale. It describes
the level of shaking at specific sites on a scale of I to XII (Table 2.1).

40
Table 2.1. Modified Mercalli Intensity Scale (Source: Lindeburg & Baradar, 2001)
Intensity Rank Observed Effects from Earthquakes
I Not felt Nonperceptible except by a very few under especially favorable conditions.
II Very Slight Felt only by a few persons at rest in house, especially on upper floors of buildings. Hanging objects may swing.
III Weak Slightly felt by people indoors, many of those do not recognize as an earthquake. Standing vehicles may rock slightly. Vibrations like to a passing truck. Duration estimated.
IV Largely
Observed Widely felt shake, Hanging objects swing. Door window and dish vibrations are detected, glasses clink, walls make creaking sound.
V Strong Felt nearly everyone. Many of them awakened. Buildings shake, glasses clink, some windows are broken. Unstable objects turned over.
VI Slightly
Damaging Felt by all. Most them are frightened and run outdoors. Soil cracks, Superficial fissuring of walls and chimney fall are monitored.
VII Damaging Everybody frightened and runs outside. Damage is observed in
buildings of bad design and construction. Falling of chimney and parapets, wall cracks are observed. Noticed by persons driving vehicles.
VIII Heavily Damaging
Slight damage in specially designed structures, notable damage in ordinary buildings with partial collapse, great damage in poorly designed and constructed buildings. Fall of chimneys, walls columns, monuments.
IX Destructive Notable damage in specially designed structures, significant damage in ordinary buildings, great damage and partially collapse in poor designed and constructed buildings.
X Very Destructive Large soil cracks, landslides observed. Many ordinary buildings
destroyed with their foundations, rails bent slightly.
XI Devastating None masonry structure remain standing. Large fissure in ground.
Rails bent greately. XII Wholly
Devastating Damage total. Nearly all structures, both above and below ground, are heavily damaged and destroyed. Waves seen on ground surfaces.

41
2.6.2. Magnitude
The size of an earthquake is measured by the strain energy which released along
the fault after an earthquake (Murthy, 2007). As Wakabayashi (1986) describes
magnitude is the quantitative measure of the size of an earthquake and it is about the
amount of energy released from the hypocenter of the Earth. It shows the real rate of an
earthquake. Various magnitude scales are in use. The most cost common magnitude
scale type in used is the Richter Magnitude Scale discovered by Professor Charles
Richter in 1935 and it is denoted as M or MI (Lagorio, 1990). Richter magnitude is a
logarithmic scale that one magnitude unit shows 10 times higher waveform amplitude
and approximately 31 times higher energy releases. For instance, the energy released
from a M 7.9 earthquake is about 31 times greater than released from a M 6.9
earthquake, and approximately 1000 (31*31) times greater than released from a M 5.9
earthquake. Doğan (2008) states that the energy released by a M 6.3 earthquake is
equivalent to the released by the Atom bomb thrown into Hiroshima. The large part of
the released energy converts to heat and cause fissurings in the rocks. Only a small part
of it goes into the seismic waves. However, it goes far distances what cause ground
shaking and damage in structures ( Lagorio, 1990).
Earthquakes which have similar Richter magnitudes may display a different
impact on the built environment. Because the devastating effects of earthquakes having
similar magnitudes depend on the geological features, and especially the depth of the
earthquake (Lagorio, 1990). For instance, a shallow earthquake type will be more
destructive than a deep earthquake type although they have similar magnitudes
(Bayülke, 1989).
There are some significant differences between magnitude and intensity. As
Lagorio (1990) states magnitude of an earthquake represents the measure of its size. It is
shown with a single value for a given earthquake. On the other hand, intensity is a
qualitative or quantitative measure of the severity of seismic ground motion at a specific
site (Dowrick, 1987). Intensity is based on observed effects on people, buildings, etc.
However, the intensity level of an earthquake can be changed according to the distance
from its epicenter. It can be clearly guessed that the severity of vibrations is higher near
the epicenter than farther away ones (Lindeburg & Baradar, 2001). Besides, intensity of
42
an earthquake is shown with roman numerals. The relationship between intensity and
magnitude is shown in Table 2.2.
Table 2.2. The connection between magnitude and the intensity of an earthquake (Source: Tuna, 2000)
Intensity I II III IV V VI VII VIII IX X XI XII Magnitude 1 - 3 3 3.9 4 4.5 5.1 5.6 6.2 6.6 7.3 7.8 8.4
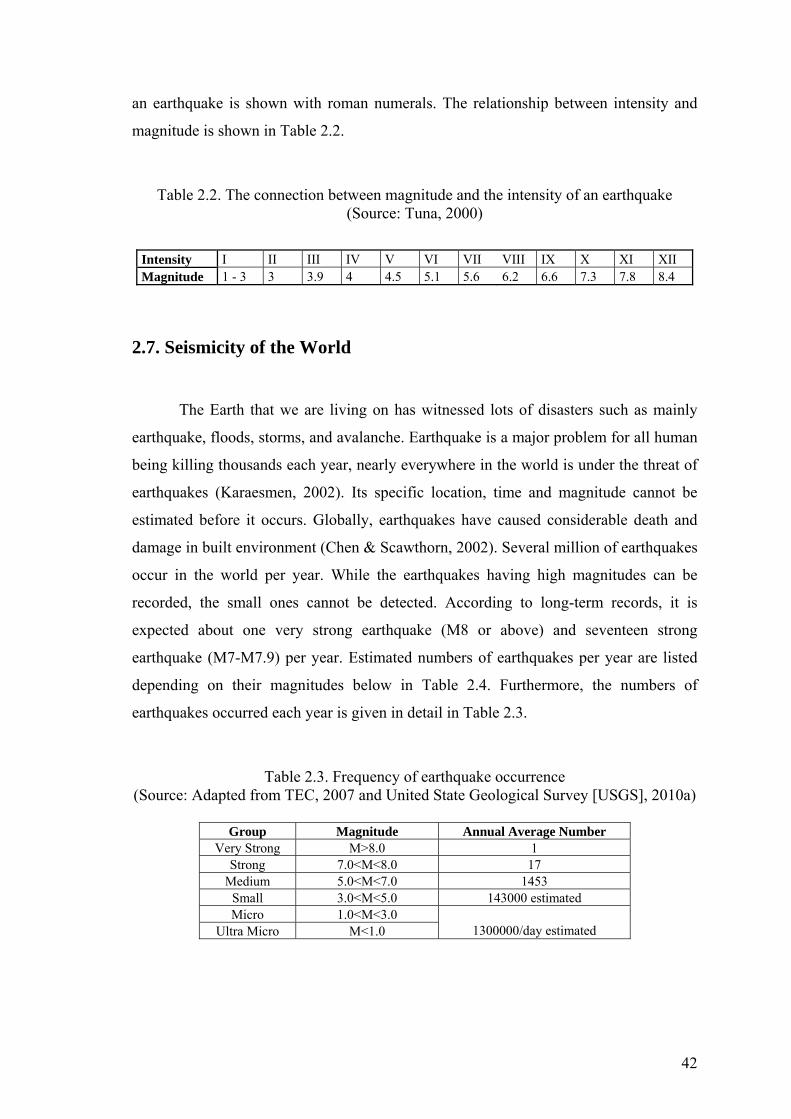
2.7. Seismicity of the World
The Earth that we are living on has witnessed lots of disasters such as mainly
earthquake, floods, storms, and avalanche. Earthquake is a major problem for all human
being killing thousands each year, nearly everywhere in the world is under the threat of
earthquakes (Karaesmen, 2002). Its specific location, time and magnitude cannot be
estimated before it occurs. Globally, earthquakes have caused considerable death and
damage in built environment (Chen & Scawthorn, 2002). Several million of earthquakes
occur in the world per year. While the earthquakes having high magnitudes can be
recorded, the small ones cannot be detected. According to long-term records, it is
expected about one very strong earthquake (M8 or above) and seventeen strong
earthquake (M7-M7.9) per year. Estimated numbers of earthquakes per year are listed
depending on their magnitudes below in Table 2.4. Furthermore, the numbers of
earthquakes occurred each year is given in detail in Table 2.3.
Table 2.3. Frequency of earthquake occurrence (Source: Adapted from TEC, 2007 and United State Geological Survey [USGS], 2010a)
Group Magnitude Annual Average Number
Very Strong M>8.0 1 Strong 7.0<M<8.0 17
Medium 5.0<M<7.0 1453 Small 3.0<M<5.0 143000 estimated Micro 1.0<M<3.0
Ultra Micro M<1.0
1300000/day estimated

43
Table 2.4. Number of worldwide earthquakes between 2001 and 2010 (Source: USGS, 2010a)
Magnitude 2001 2002 2003 2004 2005 2006 2007 2008 2009
2010
8.0-9.9 1 0 1 2 1 2 4 0 1 1 7.0-7.9 15 13 14 14 10 9 14 12 16 6 6.0-6.9 121 127 140 141 140 142 178 168 142 77 5.0-5.9 1224 1201 1203 1515 1693 1712 2074 1768 1725 849 4.0 to 4.9 7991 8541 8462 10888 13917 12838 12078 12291 6956 3713 3.0 to 3.9 6266 7068 7624 7932 9191 9990 9889 11735 2897 1379 2.0 to 2.9 4164 6419 7727 6316 4636 4027 3597 3860 3007 1074 1.0 to 1.9 944 1137 2506 1344 26 18 42 21 26 12 0.1 to 0.9 1 10 134 103 0 2 2 0 1 0 No magnitude 2807 2938 3608 2939 864 828 1807 1922 20
16
Total 23534 27454 31419 31194 30478 29568 29685 31777 14791 7127 Estimated deaths 21357 1685 33819 228802 82364 6605 712 88011 1787
225420
There are three prominent earthquake belts in the world. These are Pacific
earthquake belt, mid-Atlantic belt, and the third one is Alp Himalayan earthquake belt
which affects the seismicity of Turkey. Celep and Kumbasar (1992) observed that
nearly 17 % of the world’s major earthquakes occur at Alp Himalayan earthquake belt.
The 17 August 1999 M 7.4 Kocaeli and 12 August 1999 M 7.1 Düzce earthquakes can
be given as the most striking examples occurred at Alp Himalayan earthquake belt.
They cause indescribable casualties. Approximately, 18000 people died and 15400
building collapsed (Parsons, Toda, Stein, Barka, & Dieterich, 2000).
The destructive earthquakes observed in the world are listed with their
magnitudes in Table 2.5. China, Italy, Japon, The Soviet Union, The USA and Turkey
are major countries due to the losses rate passing 100000 lives in earthquakes.
The strongest earthquake in the world is recorded with a magnitude of 9.5 on
Richter scale in Valdicvia, Chile in 1960 that caused 20.000 fatalities. Second strongest
earthquake was measured with a magnitude of 9.3 on Richter scale in 2004. The
epicenter of this earthquake is Sumatra and Indonesia that caused 300.000 casualties.
The third one of the strongest earthquake is the Alaska earthquake that measured 9.2 on
Richter scale caused irreparable damage. The world’s deadliest earthquake occurred in
1556 in China, killing nearly 830.000 people (Charleson, 2008).

44
Table 2.5. List of major earthquakes in the world (Source: USGS, 2010b)
DATE LOCATION MAGNITUDE 1939 Erzincan, Turkey 7.9 1960 Chile 9.5 1964 Alaska 9.2 1976 China 7.5 1980 S.Italy 7.2 1985 Mexico 8,0 1985 El Salvador 8,0 1988 Adana, Turkey 6.2 1989 California 6.9 1994 Bolivia 7.7 1995 Sakhalin 7.5 1995 Kobe 7.2 1999 India 6.8 1999 İzmit, Turkey 7.4 1999 Taiwan 7.6 2001 El Salvador 7.7 2001 S. Peru 7.9 2001 Gujarat, India 8.1 2002 Iran 6.5 2002 Afyon, Turkey 6.5 2002 Afganistan 7.4 2002 Alaska 7.9 2003 Bingöl, Turkey 6.4 2003 Algeria 6.8 2003 Bam, Iran 6.6 2003 Mexico 7.6 2003 Japon 8.3 2004 Sumatra, Indonesia 9.3 2005 Kashmir, India 7.6 2005 Tarapaca 7.8 2005 Sumatra, Indonesia 8.7 2006 New Zeland 7.4 2006 Russia 8.3 2006 Java, Indonesia 7.7 2007 Chinta Alta 8.0 2007 Soloman Islands 8.1 2007 Sumatra 8.5 2008 Sichuan, China 7.9 2008 Indonesia 7.6 2009 Russia 7.4 2009 New Zeland 7.8 2009 Japon 7.1 2009 Haiti 7.0 2010 Japon 7.0 2010 Chile 8.8 2010 Elazığ 6.1 2010 Sumatra 7.8

45
2.8. Seismicity of Turkey
Turkey is located on Anatolian Peninsula on the Alp Himalayan earthquake
belt that is seismically active region in the world. As a result of this, a great deal of
destructive earthquakes has happened in Turkey. According to the seismic zone map
which was come into force in 1996 by the Turkish Ministry of Public Works,
approximately 96 % of its land is located on considerably risky earthquake zones and 80
% of its population is imposed upon to the large scale earthquakes (Doğan, 2007).
Turkey is separated on five earthquake zones (Table 2.6).
The seismic activity is quite complicated. Turkey expose to great compression
from Arabian, African and the Eurasian plate. The African and Arabian plates travel to
the North and make a compression to the North Anatolian Fault. After this event, North
Anatolian Fault begins to travel towards to the west of Turkey. It is shown in Figure 2.7.
Figure 2.7. Tectonic map of Turkey (Source: USGS, 2010c)
A large ratio of its area consists of Anatolian block. The block is surrounded by
the North Anatolian Fault in the north and by the East Anatolian Fault in the south-east
as shown in Figure 2.7. The North Anatolian Fault has a length of 1300 km and consists
of several shorter faults (Celep & Kumbasar, 1992). Bayülke (2001b) describes that the

46
most significant faults are North Anatolian Fault, South Anatolian Fault and West
Anatolian Horst Graben System and the most risky one is the North Anatolian Fault due
to the experienced earthquakes in the past.
Turkey is separated on five earthquake zones according to their risk conditions.
On the 1st and 2nd earthquake zones are accepted as the most hazardous ones due to the
existence of the high magnitude earthquakes in the past. However, moderate
earthquakes have occurred in the 3rd and 4th earthquake zones. They are also
dangerous. 5th earthquake zone is accepted as to have no risk. Only, the province of
Karaman and west part of the Aksaray is in the 5th earthquake zone. Besides, the
distribution of the surface area and the population to the seismic zones in Turkey are
shown in Table 2.6.
Table 2.6. Seismic Zones of Turkey with surface area and population
(Source: Japan International Cooperation Agency [JICA], 2004)
Seismic Zones Surface Area Population 1st degree seismic zone 42% 45% 2nd degree seismic zone 24% 26% 3rd degree seismic zone 18% 14% 4th degree seismic zone 12% 13% 5th degree seismic zone 4% 2%
Accordingly, earthquakes should be taken seriously and prepared for
earthquakes in Turkey. To reduce losses in life and property, earthquake resistant
buildings should be constructed. Any error in the design phase cause irreparable results
with earthquakes.

47
CHAPTER 3
STRUCTURAL IRREGULARITIES AND SOLUTION SUGGESTIONS
In this chapter, structural irregularities on Reinforced Concrete (R/C) structures
constituting the main subject of the thesis will be classified according to the Turkish
Earthquake Code, 2007 (TEC, 2007). All structural irregularity conditions have been
explained with drawings and supported with earthquake damage photographs in order to
increase the intelligibility in seismic design faults. Basic architectural principles and
structural issues related to earthquake resistant design (ERD) are investigated through a
literature review and various solutions are shown for the different structural irregularity
conditions.
Structural irregularities are described in section 2.3 of TEC (2007). They are
divided into two basic groups as irregularities in plan and vertical direction defined in
the TEC (2007). Irregularities in plan consist of four different type of structural
irregularity. These are torsional irregularity denoted as A1, floor discontinuities denoted
as A2, projections in plan denoted as A3, nonparallel structural member axes denoted as
A4. Types of irregularities in plan are given in Table 3.1. Irregularities in vertical
direction comprise of three type of structural irregularity. These are weak storey
denoted as B1, soft storey denoted as B2, discontinuity of structural elements denoted as
B3. Types of irregularities in vertical direction are given in Table 3.2.
Apart from the categorized structural irregularities in the TEC (2007), short
column effect, weak column-strong beam irregularity and seismic pounding effects are
investigated comprehensively under different sub-headings.
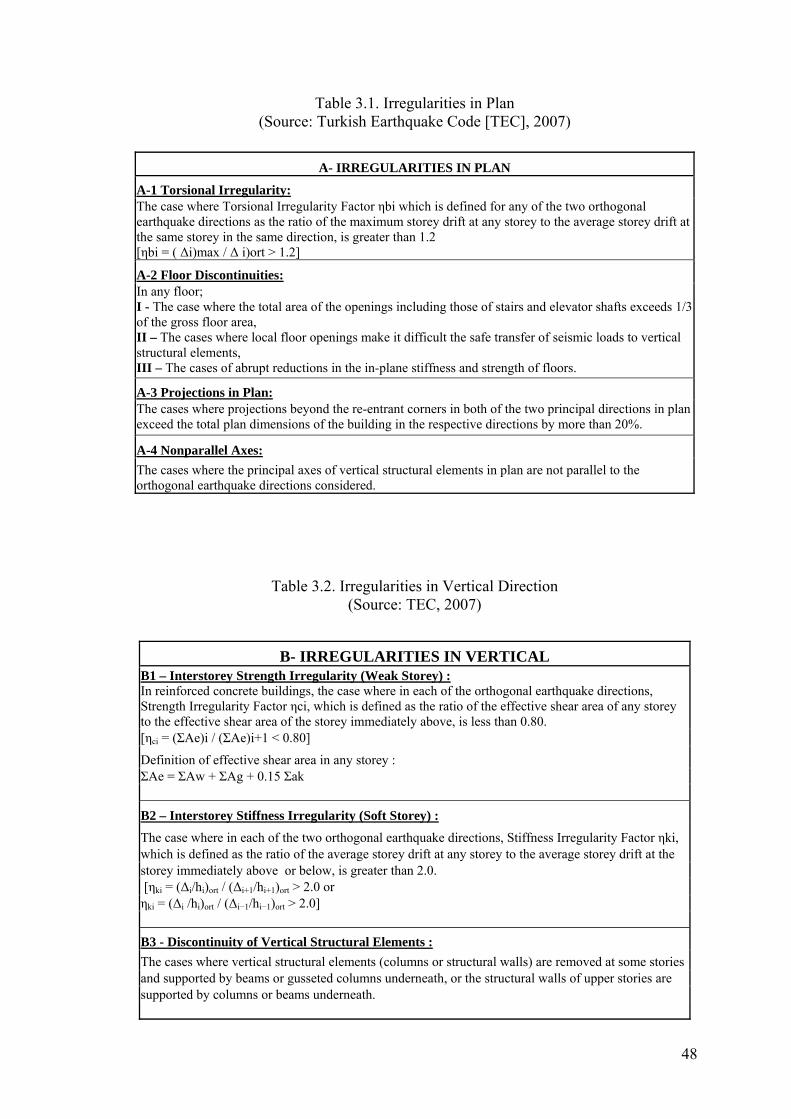
48
Table 3.1. Irregularities in Plan (Source: Turkish Earthquake Code [TEC], 2007)
A- IRREGULARITIES IN PLAN
A-1 Torsional Irregularity: The case where Torsional Irregularity Factor ηbi which is defined for any of the two orthogonal earthquake directions as the ratio of the maximum storey drift at any storey to the average storey drift at the same storey in the same direction, is greater than 1.2 [ηbi = ( ∆i)max / ∆ i)ort > 1.2]
A-2 Floor Discontinuities: In any floor; I - The case where the total area of the openings including those of stairs and elevator shafts exceeds 1/3 of the gross floor area, II – The cases where local floor openings make it difficult the safe transfer of seismic loads to vertical structural elements, III – The cases of abrupt reductions in the in-plane stiffness and strength of floors.
A-3 Projections in Plan: The cases where projections beyond the re-entrant corners in both of the two principal directions in plan exceed the total plan dimensions of the building in the respective directions by more than 20%.
A-4 Nonparallel Axes: The cases where the principal axes of vertical structural elements in plan are not parallel to the orthogonal earthquake directions considered.
Table 3.2. Irregularities in Vertical Direction (Source: TEC, 2007)
B- IRREGULARITIES IN VERTICAL B1 – Interstorey Strength Irregularity (Weak Storey) : In reinforced concrete buildings, the case where in each of the orthogonal earthquake directions, Strength Irregularity Factor ηci, which is defined as the ratio of the effective shear area of any storey to the effective shear area of the storey immediately above, is less than 0.80. [ηci = (ΣAe)i / (ΣAe)i+1 < 0.80]
Definition of effective shear area in any storey : ΣAe = ΣAw + ΣAg + 0.15 Σak
B2 – Interstorey Stiffness Irregularity (Soft Storey) :
The case where in each of the two orthogonal earthquake directions, Stiffness Irregularity Factor ηki, which is defined as the ratio of the average storey drift at any storey to the average storey drift at the storey immediately above or below, is greater than 2.0. [ηki = (∆i/hi)ort / (∆i+1/hi+1)ort > 2.0 or ηki = (∆i /hi)ort / (∆i−1/hi−1)ort > 2.0]
B3 - Discontinuity of Vertical Structural Elements : The cases where vertical structural elements (columns or structural walls) are removed at some storiesand supported by beams or gusseted columns underneath, or the structural walls of upper stories are supported by columns or beams underneath.
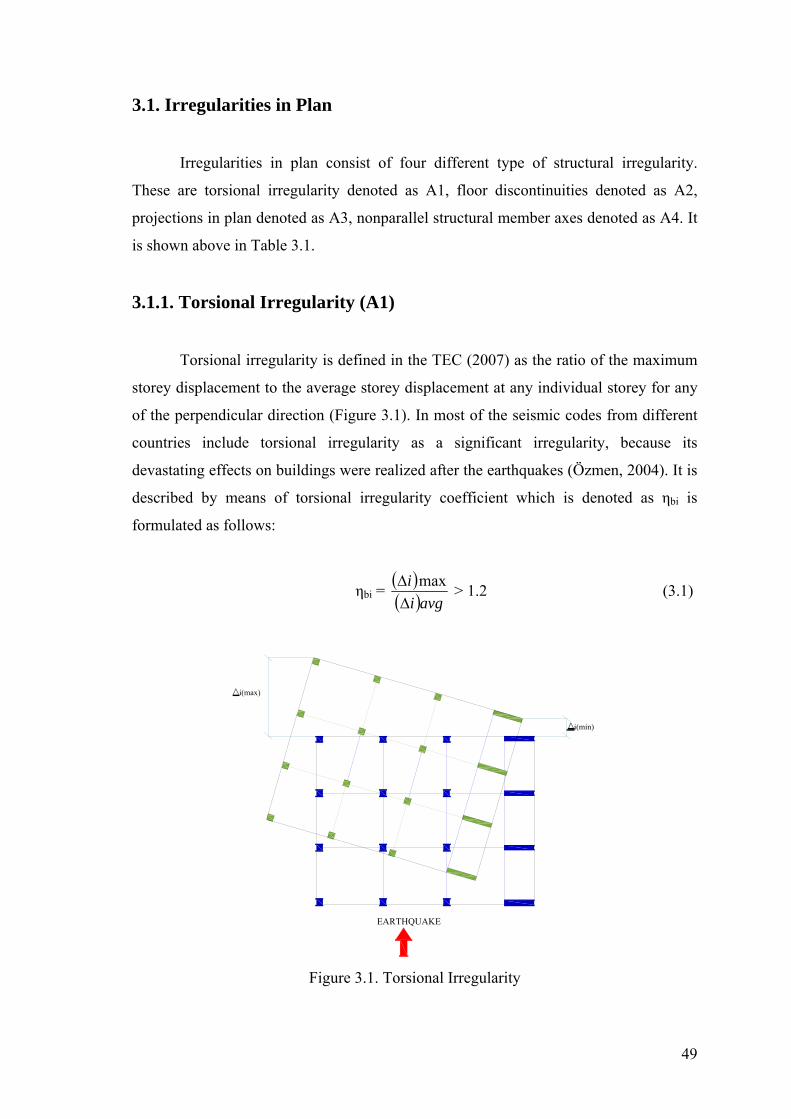
49
3.1. Irregularities in Plan
Irregularities in plan consist of four different type of structural irregularity.
These are torsional irregularity denoted as A1, floor discontinuities denoted as A2,
projections in plan denoted as A3, nonparallel structural member axes denoted as A4. It
is shown above in Table 3.1.
3.1.1. Torsional Irregularity (A1)
Torsional irregularity is defined in the TEC (2007) as the ratio of the maximum
storey displacement to the average storey displacement at any individual storey for any
of the perpendicular direction (Figure 3.1). In most of the seismic codes from different
countries include torsional irregularity as a significant irregularity, because its
devastating effects on buildings were realized after the earthquakes (Özmen, 2004). It is
described by means of torsional irregularity coefficient which is denoted as ηbi is
formulated as follows:
ηbi = ( )( )avgi
i∆∆ max > 1.2 (3.1)
EARTHQUAKE
i(min)
i(max)
Figure 3.1. Torsional Irregularity

50
In the case of the torsional irregularity coefficient (ηbi) is greater than 1.2 at any
storey of the structure, torsional irregularity occurs in that structure. The ± 5%
additional eccentricity is considered in the displacement computations on both
earthquake directions. The eccentricities which determine the torsional irregularity
coefficients are illustrated in Figure 3.2. The existing eccentricity of the system is
symbolized by es. In calculations, ± 5% additional coefficient is taken into consideration
in order to calculate the additional eccentricity. It is denoted as ead. This additional
eccentricity is firstly multiplied with the dimension of the building which is parallel to
the earthquake direction. Then, the result is summed with the existing eccentricity of the
system. This eccentricity is called as the design eccentricity and denoted as ed. The
torsional irregularity is calculated depending on this eccentricity. If the torsional
irregularity coefficient of ηbi is between 1.2 and 2, then the eccentricity is increased by a
factor as in the following formula denoted as Di and the earthquake analysis is repeated
(TEC, 2007).
GR es eadG'
ed
L
GR G'ed es
ead
L
(a) (b)
Figure 3.2. Design Eccentricity: (a) +5 % additional eccentricity, (b) -5 % additional eccentricity
D= (ηbi / 1.2)2 (3.2)
In any floor plan, the distance between the center of gravity and the centre of
rigidity should be kept as minimum as possible. The rigidity centre is described as the
centre of vertical structural elements. The gravity center is the centre of the whole
building. It covers slab, beam, wall and live loads except the vertical structural
elements. Doğan (2007) states that earthquake loads affect the center of gravity of the
structure, but the rigidity center of the structure respond these loads (Figure 3.3). If the
eccentricity between these two centers is great, a torsional moment will occur around

51
the center of rigidity and the structure begins to rotate around the rigidity axis. This
torsion moment creates additional shear forces. Because, seismic energy is largely
absorbed by shear walls and the remained seismic energy is transferred to the columns
(Atımtay, 2000).
Rigidity Center
exey
EARTHQUAKE LOAD
BX
By
R
G Gravity Center
STRENGTH STRENGTH
EARTHQUAKE LOAD
G and RM
Figure 3.3. Working mechanism of the Gravity and Rigidity Centre
The centers of gravity and rigidity should be coincided through regular
disposition of the vertical structural members. If the centers do not coincide, the
eccentricity should not exceed 5 % of the building dimension (Tuna, 2000; TEC, 2007).
It is generally accepted that torsional irregularity exists on a structure due to the
plan geometry or the structural member’s rigidity distribution (Özmen, 2004; Döndüren,
Karaduman, Çöğürcü, & Altın, 2007; Bayülke, 2001a). In order to prevent torsional
deformation, one should design providing symmetry both in the building form and
structure (Ambrose & Vergun, 1985).
In this section, the factors causing torsional irregularity are categorized
according to the widely adopted parameters which are defined as follows:
1. The Plan Geometry
2. Rigidity Distribution
3.1.1.1. The Plan Geometry/Form
Dowrick (1987) describes that design of a building is the geometrical
arrangement of all in architecture and structure and contents. The building design

52
should include both appropriate form and the structural arrangement. This should be
considered in the early design phase by architects.
The most appropriate form in terms of earthquake loads is circle and square due
to their symmetric and simple plan geometry. Besides, the rectangular form is a suitable
alternative solution owing to its simplicity and symmetry provided that the lengths of
both short and long edges are close to each other (Naeim, 2001). Doğan (2007) arranges
respectively the building form from better one to the worse as below in Figure 3.4:
(a)
(b)
Figure 3.4. Different building forms: (a) Simple building form, (b) Complex building
form
In the event that the axis numbers of the structure increase only in the long
direction, relative storey displacement which arises due to the torsion will increase as
the square of its length (Naeim, 2001). This is illustrated in Figure 3.5.
R GR G' '
X
R G R GR G
4
R G
16
2X 4X
' ''
'
Figure 3.5. Rectangular form

53
Ambrose and Vergun (1985) point out that the form of a building has great deal
with the determination of the effects of seismic activity on the building. It is easier to
understand the overall behavior of a simple structure under earthquake loading rather
than the complex one. For this reason, it should be taken into consideration in the
preliminary phase of the design.
Dogan (2007) specifies that the circle is the most regular form. Because, it reacts
the same inertia forces under earthquake loads coming from in every direction. On the
other hand, Zacek (2002) points out that circle form may be regular and has the same
bearing capacity in any direction, but it is not exactly accurate solution due to the
fragmentation of the curved walls under lateral earthquake loading (Figure 3.6.). The
danger of fragmentation increases directly with the open space on the building surface.
Figure 3.6. Failures in circle form
Structures which have asymmetric plan geometry have little energy absorbing
capacity due to the torsional effects and stress concentrations at notch points. The
energy which cannot be absorbed cause fractures in structures. On the other hand,
simple forms usually provide simple details in the design stage than complex ones
(Zacek, 2002). Naeim (2001) specifies that the complex shapes cause two major
problem:
• Variations of rigidity
• Torsion

54
Figure 3.7. Behaviour of L-shaped structure against earthquake forces
In case the earthquake loads come from the north-south direction as shown in
Figure 3.7., the wing which is located on the north-south direction incline to be stiffer
than the wing which is located on the opposite direction. Both of the wings display
different movements pushing and pulling each other at notch points. The buildings
which have complex forms cause torsion because the centre of gravity and the centre of
rigidity cannot geometrically coincide against all possible earthquake loads (Naeim,
2001; Arnold 2008).
The buildings, which have L, T, H, Y, U, and + plan geometry or a combination
of these forms and designed symmetric according to one or two direction, cause torsion
and stress concentration at notch points (Lagorio, 1990). This complex forms expose to
unpredicted earthquake forces. Thus, it is difficult to understand the forces and analyze
these types of buildings. The magnitude of the forces and severity of their results in the
buildings largely depend on the features of the ground motion, the mass of the building,
the structural system, the length of the wings and their ratios (length to width), and the
height of the wings and their ratios (height to depth) (Arnold, 2008).
In accordance with the coming together of the different blocks in the structure,
the building become susceptible against earthquake loads especially on the inside corner
connection points due to the torsion and stress concentration (Zacek, 2005b).While the
inside corner of a structure is called as reentrant corner, the connection point is called as
notch point (Figure 3.8.).

55
Figure 3.8. Reentrant corners and notch points
3.1.1.2. Rigidity Distribution
If the simplicity and regularity is not provided in the plan configuration, the
earthquake will create a great range of torsional effect. Earthquake loads which come to
the building during earthquake affect to the centre of gravity. Gravity centre can be
taken as the geometry centre and the rigidity centre is accepted as the gravity centre of
the vertical structural members such as columns and shear walls. Earthquake loads
rotate buildings around a vertical axis passing through the centre of rigidity (Bayülke,
2001a).
Variations in perimeter strength and stiffness cause torsion on buildings. This
problem usually occur in buildings having regular and symmetrical plan geometry.
Arnold and Reitherman (2002) states that a building’s seismic behavior is largely
impressed by the formation of the perimeter design. If there is a great variation in
strength and stiffness around the perimeter on a building, the center of gravity will not
coincide with the center of rigidity, and torsional moments will incline to cause the
rotation of the building around the center of rigidity.
Buildings are usually orientated towards to the scene such as beach-front
apartments which are designed with open frontage facing to the beach. This orientation
prevents the distribution of the strength and rigidity equally at the perimeter of the
buildings due to the left large openings towards to the scene. It causes unbalanced
perimeter resistance and major torsional moments. Bank halls, shops, and department
stores can be exemplified for these types of buildings in which large windows are
necessary for exhibition.

56
Atımtay (2001) specifies that it is difficult to change the centre of gravity of a
structure, but the centre of rigidity can be changed by modifying the location of the
structural elements or their cross sections. Infilled walls should be placed symmetrically
as possible due to the effects on changing the rigidity centre except from the columns
and shear walls (Ersoy, 1999). Torsion occurs around a vertical axis that can cause
collapses in the farthest edge or corner columns due to the distance between rigidity and
gravity centre (Aka, Keskinel, Çılı & Çelik, 2001; Bayülke, 2001b). This condition is
shown in Figure 3.9.
G
RM
M
GR
Collapse Collapse Figure 3.9. Different collapses due to the torsion
3.1.1.3. Solution Suggestions for Torsional Irregularity (A1)
In this part solution suggestions for the factors which cause A1 type of
irregularity are examined.
• To separate the complex forms into simple and compact forms by using
seismic separation joints (Figure 3.10.):
Figure 3.10. Seismic joints

57
It is emphasized before that simple and regular forms show better performance
than complex ones under earthquake loading. In cases the complex types of planning is
required due to the some architectural reasons or requirements, buildings should be
divided into simple and compact pieces without impairing its function by using seismic
separation joints. The rigidity center and gravity center should coincide as possible in
each piece of the building which adapted with its function. Load bearing system is
designed by taking into consideration of the additional torsional moments (Zacek,
2001).
• Softening of acute angle reentrant corners:
This solution suggestion involve that the wings of a building which is connected
with an angle of 90o or lower than the 90o should be combined with circular lines
(Figure 3.11). Thus, the wings of the building move as a whole during earthquake
(Zacek, 2002).
(a) (b)
Figure 3.11. Softening Reentrant corners: (a) Before softening, (b) After softening
Table 3.3. Evidence of the Figure 3.11
ηb (a) ηb (b)
3 1.21 1.192 1.19 1.181 1.18 1.17
Ground 1.17 1.16

58
• Strengthening of acute angle reentrant corners:
According to this solution the buildings, which have acute angle corners such as
the plan geometry of L and T type, are strengthened at weak points called notch points
by vertical structural members. This method is widely used in America and Japon
(Zacek, 2002).
• Strengthening of flexible sides:
This solution suggests that rigid cores or stability walls can be used for
preventing deformation between the wings of the building in case the rigidity center and
the gravity center of the building do not coincide due to the plan geometry of the
building (Zacek, 2002). For instance, open facades creates unbalanced perimeter in a
building. Moreover, this causes the formation of the rigid and flexible sides in a
building (Arnold, 2002). With this solution, flexible sides are made durable against
earthquake forces. Besides, additional shear walls can be added to the open facades in
order to reduce its flexibility (Arnold, 2002).
• Regular Configuration of Structural Elements:
Irregular arrangements of the structural elements cause torsional moments.
Regular configuration of structural elements cannot be mostly achieved due to the
irregular plan configuration (Bayülke, 2001a). According to Atımtay (2001) it is
difficult to change the centre of gravity of a structure, but the centre of rigidity can be
changed by modifying the location of the structural elements or their cross sections.
Some information related to the structural configuration is given as below:
a) The Vertical structural members should be ordered regularly both in all
directions. One should avoid from the irregularity in order not to meet any irregular and
unexpected stresses due to the seismic forces like in Figure 3.12. (Dowrick, 1987; Tuna
2000). It is desired that structural members should be arranged as to have equal cross
sections and equal or nearly to equal axis spans on similar each axis for providing equal
rigidity distribution in building (Figure 3.12). Besides, structural members are placed
perpendicular to the corners of the plan due to the most significant damages occur in the
corners (Tuna, 2000).

59
(a) (b)
Figure 3.12. Regular and irregular structural system configuration: (a) Irregular structural configuration, (b) Regular structural configuration
b) Standard spans and uniform cross sections of slabs are recommended for the
R/C structures. Because, any changes in the slab cross-sections makes it difficult to
estimate the distribution of earthquake loads in the structural members. Moreover,
construction costs will be very expensive (Dowrick, 1987; Zacek, 2005a).
c) The vertical structural members should be connected with beams to form a
rectangular frame and provide the continuity in rectangular frames (Figure 3.12).
Otherwise, flexible rectangular frame expose to more seismic forces than rigid frame
under earthquake loading (Bayülke, 2001b). Atımtay (2001) specifies that when the
beam is not continuous, lateral earthquake forces cannot be distributed evenly to the
vertical structural members. If this configuration is necessary the slab thickness can be
increased or a joist slab can be used. The depth of the beams should be arranged
according to the span of the columns. The more shallow beams should tie the columns
in order not to make any rigid area in the structure (Bayülke, 2001a). However, it is
necessary that the building should be designed as to have equal spans and uniform beam
sections to provide continuity and prevent unexpected earthquake deformations and
excessive formwork costs (Özmen, 2008).
d) It is desired that one should avoid from the beam-to-beam connection
(anchorage beam) without any vertical support (Figure 3.13). Such a configuration is
quite dangerous due to the lateral earthquake forces irregular distribution on the
structure. Critical moments are created in that connection points. Great rotations and
cracks occur on the beams. If this type of connection is necessary, the connection point
should be close to the support as possible. Because, stiffness is inversely proportional
with the length of the element. For instance, when the beam spans gets shorter, the
critical torsional moments gets higher (Tuna, 2000).

60
Beam
Anchorage Beam
Beam Beam
Beam
Correct
Incorrect
Figure 3.13. Discontinuity of beams
e) Slabs should work on both directions. Lateral forces are distributed to the
beams and columns by slabs. One-way slabs cause large deformations and unexpected
shear stresses on the structural members. Nevertheless, the disadvantages of
discontinuity between beams have harmful effects on the structure. In Turkey, over-
stretched one-way slabs are often used to generate corridors in the apartment block
projects (Figure 3.13). The mains aim is to provide the rhythm of the rooms. Thus, they
do not want to see a visual obstacle in the ceiling of the corridors. But, this visual
problem can be resolved with the construction of the suspended ceiling (Atımtay, 2001).
Anchorage Beam
Non-continuousBeam
Non-continuousBeam
Non-continuousBeam
Non-continuousBeam
Balcony
Side Beam
Balcony
ContinuousBeam
NonparallelAxis
Figure 3.14. Common Structural Failures
f) Cantilever slabs cause large deflections. Both open and closed cantilever
projections are widely constructed in Turkey. If it is necessary to use, the continuity
between the beams is to be provided under the cantilever slabs (Figure 3.14). Moreover,

61
a side beam should be designed to prevent critical displacement (Dowrick, 1987; Tuna,
2000; Doğan, Ünloğlu, & Özbaşaran, 2007).
g) Shear walls are the most effective method for preventing large displacements
and unpredictable torsional moments, because they increase the lateral rigidity. Shear
walls are more rigid members than columns. They show good seismic performance
under earthquake loading owing to their higher seismic energy absorbing capacity. If
lateral earthquake loads are carried by shear walls which are perpendicular to each
other, relative storey displacement will decrease and thus, damage probability will
decrease (Tezcan, 1998). But, the arrangement of shear walls should be made carefully
to reduce the distance between the rigidity and gravity center or to coincide both of
them, if it is possible. Otherwise, the rigidity of a structure is accumulated on one side
that causes torsional eccentricity (Gönençen, 2000).
h) Identical with the configuration of columns, shear walls should be arranged
according to an axial system in a symmetrical position. It must be considered that major
lateral earthquake forces come from in a line which is parallel to the width of the
structure (Bayülke, 2001a). For this reason, shear walls should be perpendicular to the
building façade in this direction (Atımtay, 2001). Shear walls are commonly hidden
around the staircases or elevators related to the architectural considerations. In this case,
the balance between the rigidity and flexibility should be provided. Otherwise, the
structure expose to the torsional effects due to the irregularity in rigidity distribution
(Bayülke, 2001a).
i) Rigid core, which were designed as the main load bearing member, should be
placed close to the gravity centre if it is necessary. However, at least two shear walls
should be designed on the outer axis of the structure to reduce torsional effect (Tuna,
2000).
3.1.2. Floor Discontinuities (A2)
According to the TEC (2007), type A2 irregularity which is called floor
discontinuities are described as follows:

62
In any floor;
I - The case where the total area of the openings including those of stairs and elevator
shafts exceeds 1/3 of the gross floor area,
II – The cases where local floor openings make it difficult the safe transfer of seismic
loads to vertical structural elements,
III – The cases of abrupt reductions in the in-plane stiffness and strength of floors.
Figure 3.15. Floor discontinuity (Source: TEC, 2007)
Some cases such as big holes in the slabs, the existence of the openings adjacent
to the vertical structural members, abrupt reduction in the slabs or improper local floor
holes prevent the regular distribution of the earthquake loads to the vertical structural
members (Bachman, 2003).

63
3.1.2.1. Solution Suggestions for Floor Discontinuities
Slabs are the structural members which transfers the earthquake loads to the
columns and shear walls. Therefore, it is important that slabs should be resistant against
earthquake loads. If the slabs are rigid, they move like a rigid diaphragm without
deformations, whereas the flexible diaphragms behave like exposed to torsional effects
and show deformations. The restrictions in order to prevent the floor discontinuities
(A2) are specified in the TEC (2007) (Figure 3.15).
If the ratio between the total areas of openings to the gross floor area is greater
than 1/3, the diaphragm should be divided into simple and regular forms to provide the
continuity in the distribution of the earthquake forces on slabs, and subsequently to the
columns and shear walls (Ambrose & Vergun, 1985).
The reinforcement around the corners and edges of the openings may contribute
to the continuity in floors (Arnold, 2002). Atımtay (2001) specifies that the rigidity of
the columns and beams around the openings should be increased or shear walls should
be placed around the openings to balance the rigidity between floors.
3.1.3. Projections in Plan (A3)
The projection ratio has significant role on earthquake behaviour of structures.
A3 irregularity which is called projections in plan is the cases where projections beyond
the re-entrant corners in both of the two principal directions in plan exceed the total plan
dimensions of the building in the respective directions by more than 20 % (TEC, 2007).
It is illustrated on the Figure 3.16 as below:
Figure 3.16. Projections in plan

64
The main aim of use of projections is to animate the building. Ersoy (1999)
points out that the buildings which have large projections seriously damaged from
earthquakes. There are two major reasons of this condition. The first is the projections
or the wings. They make different movements on different directions. This causes
torsion, and naturally rotation in the building. It inclines to distort the building form.
That’s why, torsional forces are so difficult to analysis and predict (Arnold, 2002). The
second is the stress concentration at the notch points in the reentrant corners. Therefore,
critical shear forces and moments occur in the reentrant corners where the projections
connect (Wakabayashi, 1986). It should not be forgotten that stress concentration has
occurred in the reentrant corners of the building. Therefore, one should avoid from
architectural configurations which create the reentrant corners (Ersoy, 1999).
It should be considered in the early design phase that there should not be
designed large height variations between the different blocks of the same building.
Because, the building, which has lower or higher block than the main building, expose
more lateral forces than expected (Bakar, 2003).
3.1.3.1. Solution Suggestions for Projections in Plan (A3)
There are two alternative solutions to prevent this type of irregularity. The first
is to divide building blocks into simple parts. The second is to tie the building wings
strongly with a linkage element to reduce torsion (Naeim, 2001). TEC (2007) described
the limit of projection in plan as 20 % of the dimensions of the building.
The cantilevers in buildings create great damage in earthquakes. Dogan (2007)
states that one should avoid from cantilever in buildings on earthquake zones as
possible or limit the size of cantilever as possible. If it is even applied, it should not
exceed 1.5 meters.
When the structure is surrounded on three sides of the cantilevers with beams, it
increases the earthquake resistance in structure. Placing columns or shear walls in the
end of the cantilever is another solution way for preventing this type of irregularity
(Kaplan, 1999). If it is possible, the structure should be divided into several sections
with seismic joints (Atımtay, 2000).
65
3.1.4. Nonparallel Axis (A4)
The TEC (2007) describes the A4 type of irregularity which is called
Nonparallel Axes of Structural Elements as the cases where the principal axes of
vertical structural elements in plan are not parallel to the considered orthogonal
earthquake directions (Figure 3.14).
Ünay and Özmen (2007) states that a structural system can be succesful as long
as the structural engineer is able to make realistic predictions on behaviour of structure
under earthquake loads. If the system have non-paralel axis, it becomes increasingly
difficult to estimate the loads realistically.
This type of irregularity is commonly seen as a result of the street intersections
or requirements of the space organization in design. Architects, who are the designer of
the buildings, generally begin planning as to abide by the parcel form. Their main goal
for doing this is to take advantage of the maximum parcel area in line with owner
requirements. The structures consisting of non-parallel axis will be created such as this
requirements.
Favorable solutions should be developed in order to reduce the negative effects
of torsion on this type of building. Beam connections with nonparallel axes are not
safety in terms of lateral earthquake loads. They cause additional torsional moments.
Nevertheless, one should avoid from the creation of a short and over-rigid beam,
because excessive torsional irregularity occur in there (Özmen, 2002).
3.1.4.1. Solution Suggestions for Nonparallel Axis
In this irregularity, the load-bearing system is not connected with right angle
(Figure 3.14). This does not mean that all buildings should be composed of right angles.
If it is necessary to construct a building with different angles, two different solution
method can be applied described as follows:
1. To separate the buiding to the regular and simple parts by using sesimic
separation joints.
2. Increasing the internal force values.
It is described before in A1 irregularity called torsional irregularity that simple
and regular forms show better seismic performance than complex and irregular forms

66
under earthquake loading. Buildings should be separated on simple and regular parts by
using seismic separation joints where building direction changes to minimize the
damage level and prevent the excessive damage on the axes where the building
direction has changed (Erman, 2002).
Internal forces in vertical structural member can be increased as if the
earthquake forces come from the both direction (Tezcan, 1998). It is defined in the 2007
Turkish Earthquake Code that under the combined effects of independently acting x and
y direction earthquakes to the structural system, internal forces in element principal axes
a and b shall be obtained by Eq. 3.2 such that the most unfavourable results used in
design.
Ba= ± Bax± 0.30 Bay or Ba= ± 0.30Bax ± Bay
Bb= ± Bbx± 0.30 Bby or Bb= ± 0.30Bbx
± Bby (3.2)
3.2. Irregularities in Vertical Direction
Irregularities in vertical direction consist of three different type of structural
irregularity. These are interstorey strength irregularity or weak storey denoted as B1,
interstorey stiffness irregularity or soft storey denoted as B2, discontinuity of vertical
structural elements denoted as B3. It is shown in Table 3.2. Uniformity in distribution of
the masses, strength, and stiffness are demanded in the vertical direction of the building
in order to provide regularity of structure.
3.2.1. Interstorey Strength Irregularity/Weak Storey (B1)
B1 type of irregularity is defined in the TEC (2007) that in reinforced concrete
buildings, the case where in each of the orthogonal earthquake directions, Strength
Irregularity Factor ηci, which is defined as the ratio of the effective shear area of any
storey to the effective shear area of the storey immediately above, is less than 0.80
(Figure 3.17). If the ratio is between 0.8 and 0.6, there exists weak storey irregularity in
structure. But, if it is less than 0.6, the structure must be redesigned until appropriate
range of values are gained.

67
Figure 3.17. Formation mechanism of Weak Storey (B1)
ΣAe = ΣAw + ΣAg + 0.15 ΣAk (3.3)
Definition of effective shear area in any storey:
ηci = (ΣAe)i / (ΣAe)i+1 < 0.80 (3.4)
Arnold (2002) describes that a weak storey is a type of vertical configuration
problem in which there is a major reduction in strength when it is compared with above.
Although it is so dangerous when it occurs at the first storey due to the greatest loads
accumulation at this storey, it can be seen at any storey of a building. This irregularity
generally occurs due to the lesser strength or major flexibility between stories. If all
stories of the building are nearly equal in terms of strength or stiffness, earthquake
forces can be distributed nearly equal to each storey under earthquake loading.
However, architectural requirements in usage of a building restrict that type of planning.
For instance, while the upper stories are used for housing, the ground floors are used as
shops almost all residential buildings in Turkey. Shops are designed as to have large
window openings due to the function of the space. Therefore, the ground floors have
less strength than the upper floors. This problem, which is most common type of
planning in Turkey, is called as interstorey strength irregularity or weak storey and
denoted as B1 in TEC (2007).
Earthquake loads are directly proportional with the mass. Overturning moments
will increase if the gravity center moves from ground to the upper levels (Figure 3.18).
Therefore, one should especially avoid from the inverted pyramidal configuration for
preventing the formation of overturning moments.

68
G
G d1
d2
Figure 3.18. Gravity centre in pyramidal configuration
There are many factors leading to the weak storey irregularity. For instance,
buildings with vertical setbacks are one of them. A setback can be defined as an abrupt
and major change of strength and stiffness. For that reason, it prepares both soft and
weak storey irregularity on the ground floor. It can be visualized like a building having
vertical reentrant corners. The building having vertical setbacks suffers from damages
in the line of the setback or notch point due to the great stress concentration. The
vertical setbacks in the building start making different displacement due to the different
natural period of vibration between the typical storey and the storey with setbacks
(Ambrosse and Vergun, 1985). Their earthquake behaviour is quite complex to predict.
That’s why Zacek (2005c) states that all storeys should have the same plan geometry.
Even though setback exists in a single building block, it can also occur in adjacent
buildings having different heights due to the deficiency in the amount of seismic
separation joint or having no seismic separation joint.
Projections which are made in order to animate the facades of a building cause
considerable damage due to the earthquake forces (Zacek, 2002). Bayülke (2001a)
indicates maximum projection dimensions in vertical as below in Figure 3.19.
A
L LA A
A A
A /L < 0.25 A /L < 0.15 A /L < 0.10L
Figure 3.19. Maximum projection values

69
Figure 3.20.Damage due to the heavy cantilevers (Source: Darılmaz, 1999)
The building shown above in Figure 3.20 subjected to great earthquake damage
due to the insufficient cross sections of columns at ground floor. Besides, it has
considerable closed overhangs. For this reason, the columns break at the ground floor
level and then, fell down toward back side. When the earthquake damages are
investigated, it can be easily seen that the structures having overhangs are heavily
damaged that the others. In Turkey, approximately 70 or 80 % of buildings have
constructed with overhangs (Doğan, Ünlüoğlu, & Özbaşaran, 2007).
The ratio between the height and width of a building or the height and length of
a building is great, which is called as the slenderness ratio, the building will create high
overturning moments. It will also cause additional major forces on the corner columns.
Moreover, the structure is usually designed as to have different strength on both
earthquake direction of the structure which cause weak storey (Bayülke, 1998).
Dowrick (1987) specify that the slenderness ratio of a building should not
exceed about 3 or 4, if it is not, it exposes to additional shear forces and overturning
moments under earthquake loading. Overturning moments will increase if the gravity
center of the building is away from the ground. On the other hand, Zacek (1999) states
that the ratio of the sides to one to another should be greater than 3.

70
3.2.1.1. Solution Suggestions for Weak Storey (B1)
There are various alternative solutions to reduce or eliminate the negative effects
of the weak storey irregularity on buildings (Figure 3.21). They can be listed as follows:
• To create partly setbacks as pyramidal configuration (Figure 3.18)
• To create seismic separation joints
• To provide equal strength between stories
• To leave joint between column and wall
• To make isolation
(a) (b)
(c) (d)
Figure 3.21. Solutions for Weak Storey: (a) Add walls, (b) Increase cross-sections of columns, (c) Add steel bars, (d) Isolation gaps
If setbacks are created, the plan area should expand towards up to down like a
pyramidal configuration, it can be an alternative solution to increase the earthquake
durability of buildings. Moreover, it also increases the rigidity and reduces the natural
period of the building. Thus, it prevents creation of the acute angle corners.
Seismic separation joints are necessary in formed of different masses with
complex geometry of the buildings so that the different blocks of the building can move

71
independently which cause great damage due to the different behaviour of the blocks
under earthquake loading.
Strengthening of the flexible stories to balance the rigidity distribution between
stories can contribute to prevent the weak storey irregularity. For instance, if the ground
floor of a building is designed as an opening floor, it fails under earthquake loads. To
balance the strength between stories, the cross sections of the columns can be increased
or diagonal steel bars can be added to the ground floor. Moreover, the wall areas can be
increased in the ground floor. Besides, in each floor, same kind of material should be
used to provide continuity of the material in vertical direction.
Unlike the other three suggestion, isolation method is not based on strengthen of
the building against earthquake. It bases on protection of the building from earthquake
loads. This method can be applied in a very few building in our country due to the high
building cost. These buildings are determined according to the building importance
factor which is defined in the TEC (2007).
3.2.2. Interstorey Stiffness Irregularity (Soft Storey) (B2)
B2 type of irregularity is defined in the TEC (2007) as the case where in each of
the two orthogonal earthquake directions, Stiffness Irregularity Factor ηki , which is
defined as the ratio of the average storey drift at any storey to the average storey drift at
the storey immediately above or below, is greater than 2.0 (Figure 3.22). Moreover,
storey drifts should be calculated by considering the effects of ± %5 additional
eccentricities.
Figure 3.22. Storey Drifts

72
[ηki = (∆i/hi)ort / (∆i+1/hi+1)ort > 2.0 or ηki = (∆i /hi)ort / (∆i−1/hi−1)ort > 2.0] (3.5)
The building codes distinguish between “soft” and “weak” stories. Soft stories
are less stiff, or more flexible, than the story above; weak stories have less strength. Soft
storey causes a significant decrease in lateral stiffness (Naeim, 1998).
There are various parameters that cause soft storey irregularity. For instance, a
discontinuity between the ground and first floor cause critical conditions on earthquake
behaviour of building (Arnold, 2002). The height difference between the floors is a
remarkable one among them (Figure 3.23). The ground floor of a building is generally
designed as higher than the upper floors due to the user requirements. This causes
stiffness losses and more displacement in the ground storey. Because, the cross sections
of the columns are kept in same size in the ground floor even though there is a height
difference is created between the two floors. Therefore, it causes a difference in rigidity
or stiffness between the floors. This type of floors is called as the soft storey. It usually
occurs due to the architectural requirements. For instance, using open ground storey
such as shops, meeting rooms, banking halls create severe damage. Because, while a
great storey drift occurs in the ground floor, the upper floors move like a diaphragm.
High stress concentration occurs along the connection line between the ground and first
floor that leads to distortion or collapse in structures (Arnold, 2002).
overstresses
drift drift
plastic hingein columns
plastic hingein beams
(a) (b)
Figure 3.23. The soft first storey failure mechanism: (a) Plastic hinge in columns, (b) Plastic hinge in beams
Soft storey irregularity does not only depend on the difference between the
storey height, but also an abrupt change in stiffness or rigidity between stories cause

73
soft storey irregularity despite the same storey height among the stories of the building.
For instance, excessive usage of infilled walls in upper floors increases the stiffness in
those floors. They are not usually used in the ground floors due to the commercial
purposes. The reason is to provide visual perception with large window openings. Thus,
soft storey irregularity has been created again.
The soft storey irregularity may be created by an open ground floor. It carries
heavy structural or nonstructural walls which is located on upper floors. This turns into
quite critical condition if the continuity in the vertical structural elements is not
provided. For instance, the columns in upper floors sometimes have not been continued
to the ground floor due to the requirements of large spans. Thus, this condition will also
create the soft storey irregularity (Figure 3.24).
Figure 3.24. Common types of soft storey irregularity
(Source: Arnold, 2002)
3.2.2.1. Solution Suggestions for Soft Storey (B2)
The conditions causing soft storey irregularities are described in previous part.
To prevent this irregularity, the solution suggestions can be listed as follows:
a) Add bracing elements which stiffen the columns up to a level
b) Add additional columns at ground storey to increase the stiffness
c) Increase the cross-sections of the columns at first storey.
d) Add external buttresses (Figure 3.25)
e) Create vaults on the ground floor (Figure 3.25)

74
(a) (b)
Figure 3.25. Solutions for Soft Storey irregularity: (a) Vaults, (b) External buttresses
3.2.3. Discontinuity of Vertical Structural Elements (B3)
B3 type of irregularity is described as the case where vertical structural elements
are positioned wrongly. The factors causing B3 type of irregularity are visualized in
Figure 3.15. Conditions related to the irregular buildings with type B3 irregularity are
given as follows:
a) Gusseted columns or the columns which rest on cantilever beams are
prohibited as illustrated in Figure 3.26 and Figure 3.27.
b) In the case where a column rest on a beam supported with columns at both
ends, all internal forces consisting vertical loads and seismic loads from the
earthquake direction shall be increased by 50 % at all sections of the all
beams and the columns which are adjacent to the beam (Figure 3.26).
c) In no case the shear walls should be allowed to rest under the columns
(Figure 3.26).
d) In no case the shear walls should be allowed to rest on the beams (Figure
3.26).

75
(a) (b)
(c) (d)
Figure 3.26. Types and solutions of B3 irregularity (Source: TEC, 2007)
Figure 3.27. Damage due to the gusset on columns
(Source: Çiftçi, 1999)
The gusset on the ground floor column, which is made for ornamentation, cause
damages where connects with column. It is prohibited in TEC (2007).

76
3.2.4. Short Column Effect
When a building has both long and short columns in the same storey, the
columns expose to different shear forces due to their height differences. The lateral
loads firstly come to the long and flexible columns, and then go towards to the short
column and accumulate in there (Figure 3.28). Due to the excessive accumulation of the
seismic energy, shear cracks occurs at both ends of the columns (Doğan, 2002). Murthy
(2004) states that the long and short column having the same cross section show the
same displacement (∆) under earthquake loads. However, the short columns are more
stiff or rigid as it compared with the long column and expose greater earthquake forces
than short columns. If they are not adequately designed for such a large force, it can
suffer from significant damages during an earthquake. This behaviour is called short
column effect and it must be accounted in the initial design phase (Murthy, 2004). The
damage in these short columns is often in the form of X-shaped cracking that occurs due
to shear failures.
Tal
l
Shor
t
Figure 3.28. Tall and Short Columns Behaviour
The conditions causing short column can be listed as follows and illustrated in
Figure 3.29:
a) Mezzanine floors
b) Mechanical floors
c) Hillside sides
d) Graded foundation
e) Adjacent columns to the openings
f) Stair landing
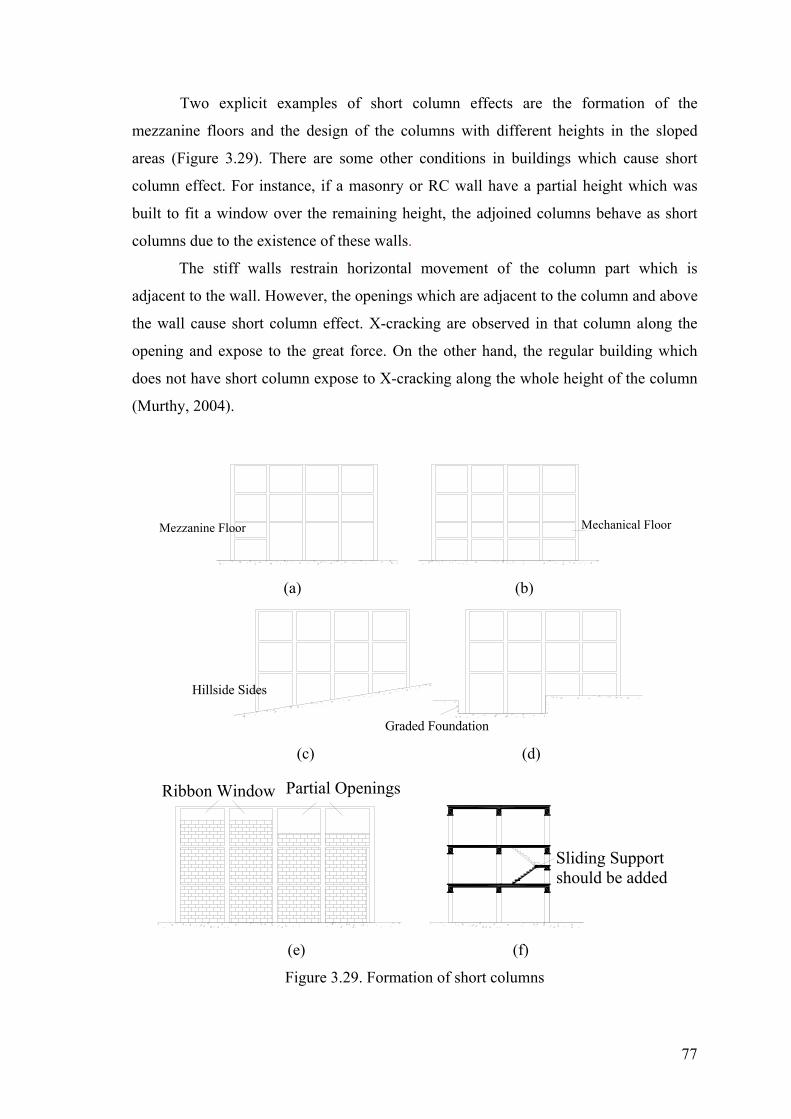
77
Two explicit examples of short column effects are the formation of the
mezzanine floors and the design of the columns with different heights in the sloped
areas (Figure 3.29). There are some other conditions in buildings which cause short
column effect. For instance, if a masonry or RC wall have a partial height which was
built to fit a window over the remaining height, the adjoined columns behave as short
columns due to the existence of these walls.
The stiff walls restrain horizontal movement of the column part which is
adjacent to the wall. However, the openings which are adjacent to the column and above
the wall cause short column effect. X-cracking are observed in that column along the
opening and expose to the great force. On the other hand, the regular building which
does not have short column expose to X-cracking along the whole height of the column
(Murthy, 2004).
Mezzanine Floor Mechanical Floor
(a) (b)
Hillside Sides
Graded Foundation (c) (d)
Ribbon Window Partial Openings
Sliding Supportshould be added
(e) (f)
Figure 3.29. Formation of short columns

78
3.2.4.1. Solution Suggestions for Short Column
As it is required for all other irregularities, short column effect should be
prevented as possible during architectural design phase. Although it is difficult to
change short columns in the architectural design phase, this effect must be arranged in
structural design (Murty, 2004).
Horizontal bracing throughout the height and into column above can be accepted
as an alternative solution for preventing or reducing the short column effect. This
solution provides regular distribution in stiffness among the columns. It can be used
short column due to the mechanical floors, adjacent openings to the columns and in stair
landing. Heavy non-structural walls play a major role on short column. For that reason,
heavy non-structural walls must be isolated from the columns to prevent the formation
of the short column (Naeim, 2001).
The foundation of a structure should be located on the same plane surface. This
is taken into consideration in hillside sides and one should avoid from designing graded
foundations. To prevent short column due to the stair landing, sliding support should be
placed between the steps on the intermediate landing.
3.2.5. Strong Beam-Weak Column
In a structure, it is desired that beams should begin deforming before columns.
Failure in a column can affect the stability of the overall building. However, beams
deformation partly affects the building (Bayülke, 1998). For that reason, beams need to
be made ductile rather than the columns. Sufficient ductility is ensured in the structural
members where the damage is estimated to happen under earthquake loads.
Plastic hinging at both ends of the columns may initiate a storey displacement or
even leading to the overall collapse of the building (Bayülke, 1999). The beams should
have weakest links instead of columns to prevent plastic hinging in columns. This
condition can be provided by correctly sizing the structural members and using
sufficient amount of steel in them (Murthy, 2004).

79
Figure 3.30. Damage due to the hollow-tile floor slab (Source: Çiftçi, 1999)
The building shown above in Figure 3.30 exposes to great damage in earthquake
due to the hallow-tile slab. Hollow-tile slab is usually used in projects to prevent
visibility of beams. But, it increases the building weight. Thus, it increases the
earthquake forces simultaneously due to the direct proportion between the building
mass and earthquake forces.
3.2.6. Seismic Pounding Effect
Pounding is a damage type in two buildings or different parts of the same
building under earthquake loads. It causes hitting the buildings one another (Naeim,
2001). It commonly occurs due to the insufficient seismic gap or no gap between two
adjacent buildings (Doğan, 2002). A seismic gap is a seismic separation which is left
depending on predicted seismic drifts of stories. If the size of the seismic gap is
insufficient based on the expected storey drifts, pounding between adjacent structures
may occur.
There are various parameters causing irregularity of pounding in structures.
They can be listed as follows:
a) Soft ground floors
b) Irregular plan geometry
c) Setbacks
d) Liquefaction

80
The soft ground floors lead to extreme displacement or even collapse in
structures. Adjacent buildings with irregular plan geometry expose to torsional effects
under earthquake loads and pounding is observed due to the less seismic joint gaps
(Figure 3.31). Moreover, the setbacks cause stress concentration and the blocks hit each
other due to the different vibrations of blocks in structure. The soil type where the
structure is constructed affects the seismic behaviour of the structure. In poor quality
soil, the liquefaction can occur and the structures usually overturn to one side without
big damages in upper floors. If there is a structure next to that, the event of pounding
happens. In Turkey, the pounding widely occurs due to the insufficient seismic joint
between the adjacent structures. Moreover, in adjacent structures if the floors are not in
the same level, the amount of damage increases in structures which are constructed like
that type.
Figure 3.31. Pounding due to the torsion between adjacent buildings (Source: İstanbul Büyüksehir Belediyesi Devlet Arsivi, 1999)
The building shown in above Figure 3.31 expose to damage in earthquake due to
the inadequate seismic joints. This condition causes of torsion in the building which is
located in the middle among three of them. Besides, shop storey in the ground floor is
completely collapsed due to the weak storey condition. Therefore, the building is
heavily damaged under earthquake forces.

82
3.34). If the floors are not in the same level between two adjacent building, hammering
occur at pounding point as shown in Figure 3.34.
m1 m2 m1 m2
Figure 3.33. Dynamic pounding model for one-storey building
m1
m1
m1
m1
Figure 3.34. Dynamic pounding model for different floors
Minimum size of the seismic gaps should be 30 mm up to 6 m height. From
thereon a minimum 10 mm shall be added for every 3 m height increment. The
construction of dilatation joints is not easy in terms of protecting the gaps from any
objects. Gaps should be protected against filling with any objects by flexible materials
such as twisted metal plate or rubber accordion. Removable moulds or simple concrete
moulds can be used in the construction of the dilatation joints (Zacek, 2002).
The sizes of gaps to be left in the seismic joints between building blocks or
between the old and newly constructed buildings should be determined with respect to
the following conditions. Sizes of gaps should not be less than the square root of sum of
squares of average storey displacements multiplied by the coefficient α specified below:
a) α = R / 4 should be taken if all floor levels of adjacent buildings or building
blocks are the same.
b) α = R / 2 should be taken if any of the floor levels of adjacent buildings or
building blocks are not the same.
Hammering
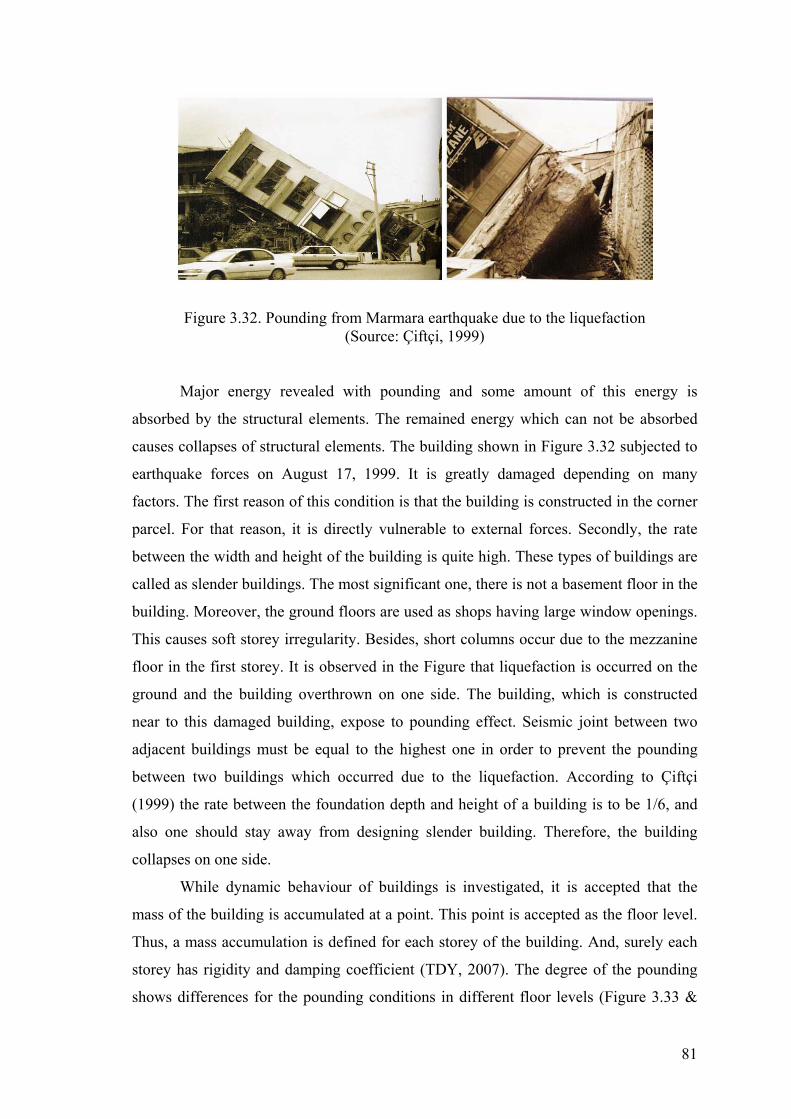
81
Figure 3.32. Pounding from Marmara earthquake due to the liquefaction (Source: Çiftçi, 1999)
Major energy revealed with pounding and some amount of this energy is
absorbed by the structural elements. The remained energy which can not be absorbed
causes collapses of structural elements. The building shown in Figure 3.32 subjected to
earthquake forces on August 17, 1999. It is greatly damaged depending on many
factors. The first reason of this condition is that the building is constructed in the corner
parcel. For that reason, it is directly vulnerable to external forces. Secondly, the rate
between the width and height of the building is quite high. These types of buildings are
called as slender buildings. The most significant one, there is not a basement floor in the
building. Moreover, the ground floors are used as shops having large window openings.
This causes soft storey irregularity. Besides, short columns occur due to the mezzanine
floor in the first storey. It is observed in the Figure that liquefaction is occurred on the
ground and the building overthrown on one side. The building, which is constructed
near to this damaged building, expose to pounding effect. Seismic joint between two
adjacent buildings must be equal to the highest one in order to prevent the pounding
between two buildings which occurred due to the liquefaction. According to Çiftçi
(1999) the rate between the foundation depth and height of a building is to be 1/6, and
also one should stay away from designing slender building. Therefore, the building
collapses on one side.
While dynamic behaviour of buildings is investigated, it is accepted that the
mass of the building is accumulated at a point. This point is accepted as the floor level.
Thus, a mass accumulation is defined for each storey of the building. And, surely each
storey has rigidity and damping coefficient (TDY, 2007). The degree of the pounding
shows differences for the pounding conditions in different floor levels (Figure 3.33 &

83
CHAPTER 4
EARTHQUAKES ON REINFORCED CONCRETE STRUCTURES
This chapter consists of three main parts. In the first part, a review of the
material properties of reinforced concrete (R/C) is practiced by taking into consideration
of the Turkish Standard TS 500, the earthquake load and its mechanism are described in
order to understand the seismic behavior of buildings. In the second part, basic
principles of earthquake resistant design criterions are described. Finally, in the third
part, earthquake load calculation methods are described according to the Turkish
Earthquake Code, 2007 (TEC, 2007).
4.1. Characteristics of Reinforced Concrete (R/C) and its Earthquake
Behaviour
Turkey is located on a highly seismic region and approximately whole of its area
located on the first earthquake zone as previously mentioned. For that reason, it suffers
from earthquakes frequently and expose to many life and property loses. Most of the
buildings in Turkey have been constructed with reinforced concrete (R/C) material and
the buildings which expose to more damage in earthquakes are even so the R/C
buildings. For this reason, it is quite important that characteristics of the concrete
material and earthquake behaviour of R/C should be known.
R/C material is the preeminent building material in Turkey. This condition
depends on the economic reasons (Atımtay, 2000). The raw of the concrete material
which comprised of carbonate, calcium, aggregates and water, is abundant in the nature.
Moreover, it is cheaper to gain than the other materials such as steel. The percentage of
steel which is used in R/C is approximately 1 % (Bayülke, 2001b). Besides, lacking of
the experienced workforce in other materials cause commonly usage of the concrete
material.
Some basic knowledge related to the material properties of R/C should be
known in order to have an understanding of R/C buildings behaviour under earthquake

84
loads. R/C is a composite material. It constitutes a structural system type. R/C is formed
by adding the steel bars with circular cross sections in concrete material (Figure 4.1).
These bars are called as reinforcing bars. While concrete material can resist to the
compression forces, steel can resist tension forces rather than compression forces. In the
result of caracteristics of these two materials, they can support to each other in order to
withstand to the earthquake loads.
CONCRETE
CEMENT AGGREGATE WATER
R/C
CONCRETE STEEL
Figure 4.1. Components of concrete and Reinforced Concrete
The rules for providing the earthquake resistance of buildings are given in the
TEC (2007). Furthermore, the requirements for the production of R/C are subjected to
the Turkish Standard, TS 500 called Requirements for design and construction of
Reinforced Concrete Structures. This code and standard determine the minimum
requirements of the materials. The aim is to reduce the life and property losses as
minimum as possible.
There are various concrete class and reinforcing steel types defined in the
Turkish Standard TS 500. According to TS 500 concrete quality must be a certain level
in order to provide the required earthquake durability in buildings. Concrete classes are
categorized based on their characteristic strength (fck) and denoted by C (XX). On the
other hand, steel types are categorized based on their characteristic yielding stress (fyk)
and denoted by S (XXX). For instance, C (20) means that characteristic strength of that
structure is 20 Mpa N/mm2) and S420 means that characteristic yielding stress of that
steel is 420 Mpa (N/mm2). Furthermore, it is defined in the TEC (2007) that merely C20
or higher concrete class and S420 or lower steel class can be used in all R/C buildings in
Turkey (Özmen, 2008).
R/C buildings are constituted by a carcass skeleton system which can change its
form before collapsing. This carcass skeleton system comprise of structural elements
such as column, beam and slab which are carrying elements in R/C structures. Walls are
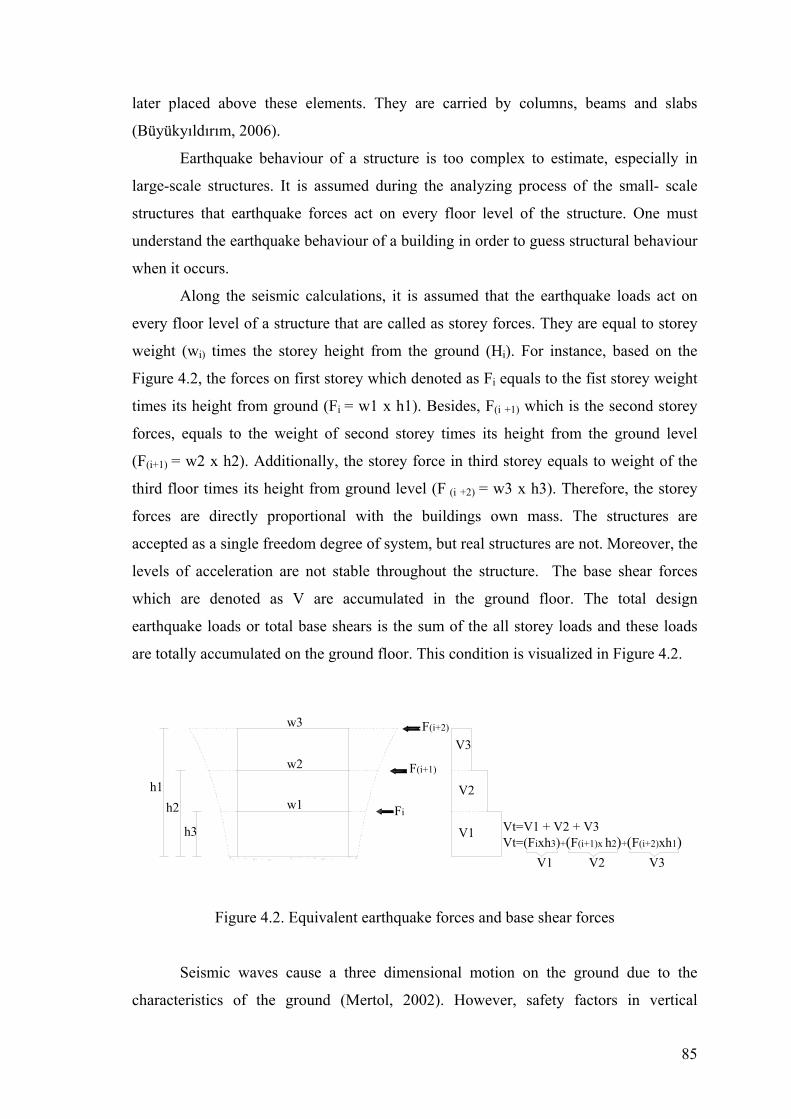
85
later placed above these elements. They are carried by columns, beams and slabs
(Büyükyıldırım, 2006).
Earthquake behaviour of a structure is too complex to estimate, especially in
large-scale structures. It is assumed during the analyzing process of the small- scale
structures that earthquake forces act on every floor level of the structure. One must
understand the earthquake behaviour of a building in order to guess structural behaviour
when it occurs.
Along the seismic calculations, it is assumed that the earthquake loads act on
every floor level of a structure that are called as storey forces. They are equal to storey
weight (wi) times the storey height from the ground (Hi). For instance, based on the
Figure 4.2, the forces on first storey which denoted as Fi equals to the fist storey weight
times its height from ground (Fi = w1 x h1). Besides, F(i +1) which is the second storey
forces, equals to the weight of second storey times its height from the ground level
(F(i+1) = w2 x h2). Additionally, the storey force in third storey equals to weight of the
third floor times its height from ground level (F (i +2) = w3 x h3). Therefore, the storey
forces are directly proportional with the buildings own mass. The structures are
accepted as a single freedom degree of system, but real structures are not. Moreover, the
levels of acceleration are not stable throughout the structure. The base shear forces
which are denoted as V are accumulated in the ground floor. The total design
earthquake loads or total base shears is the sum of the all storey loads and these loads
are totally accumulated on the ground floor. This condition is visualized in Figure 4.2.
w3
w2
w1h1
h2
h3
F(i+2)
F(i+1)
FiVt=V1 + V2 + V3
V2
V3
Vt=(Fixh3)+(F(i+1)x h2)+(F(i+2)xh1)V1 V2 V3
V1
Figure 4.2. Equivalent earthquake forces and base shear forces
Seismic waves cause a three dimensional motion on the ground due to the
characteristics of the ground (Mertol, 2002). However, safety factors in vertical

86
direction are kept high level in R/C structures. Therefore, the earthquake forces in z
direction can be neglected (Atımtay, 2000).
Earthquake is a release of the accumulated energy. This energy firstly reaches to
the foundation of the structure and causes movement in all directions. When the seismic
waves reach the foundation of the building, it causes a vibration. But, the structure tries
to respond the vibration. This is called the dynamic behaviour of the structure. It
depends on many factors such as plan geometry, rigidity distribution or configuration of
structural members, the total building mass and its distribution in horizontal and vertical
direction. Heavier buildings expose to larger earthquake forces than lighter buildings
under the same earthquake loads (Özmen & Ünay, 2007). For instance, R/C structures
are heavier than steel and timber buildings and subjected to great forces when
earthquake happens.
Inertia forces occur as a result of dynamic behaviour. Inertia can be described as
a tendency for an object at rest to remain at rest, or in motion to remain in motion. This
is a general physical property of matter. It maintains its existing condition of rest or
motion unless an external force is applied (Bayülke, 2001a). Inertia forces stand against
those external forces. For instance, when a car is accelerating, the passenger feel
himself pushed backward, for the inertial force on the body acts opposite direction of
the acceleration. If the vehicle is decelerating or breaking, the passenger may be thrown
forward in his location points (Figure 4.3). The buildings behaviour against earthquake
loads is similar with this behaviour.
inertial forceson building or person
acceleration
Figure 4.3. Inertia forces
Magnitude of the inertia forces of a building against earthquake loads depend on
various factors as follows (Mertol, 2002):
1. Dynamic properties of the building (Period, absorbing capacity)

87
2. Characteristics of the seismic waves
3. Total mass of the building
4. The distribution of the mass between floors
5. Plan geometry of the building
6. Arrangements of the structural elements
7. The type of load-bearing system
8. The characteristics of the soil where the building is constructed
9. Epicentral distance
Earthquakes send out seismic waves that travel in every direction of the earth.
These waves accord horizontal and vertical forces on buildings. The vertical forces
generally cause to move up and down safely with the ground. However, horizontal
forces vibrate the building back and forth during an earthquake, and cause lateral
displacements in buildings. The period of vibration is one of the most significant factors
determining how a structure will respond to ground shaking. The time which takes to
vibrate back and forth one complete cycle is known as its period of vibration. Besides,
periods of vibration depend on weight and height of the building.
Turkey has a great number of building stocks consisting of R/C structures due to
the economical circumstances. However, reinforced concrete buildings subjected to
major damages due to the various failures. The most significant damage level was
observed in middle-storied structures which are constructed at last twenty year (Gülkan,
2000). When the damages in R/C buildings are investigated, the same failures can be
observed as follows:
1. Slender buildings
2. No basement floor
3. The difference in the storey height between the ground and upper floors
(Soft storey)
4. The difference in strength between the floors (Weak storey)
5. Columns with gusset (prohibited in TEC, 2007)
6. Arrangement of structural elements only on one direction along the all axis.
7. Adjacent buildings with different storey height connections
8. Usage of hollow-tile floor slab
9. Projections in plan (A3)
10. Heavy projection in vertical direction
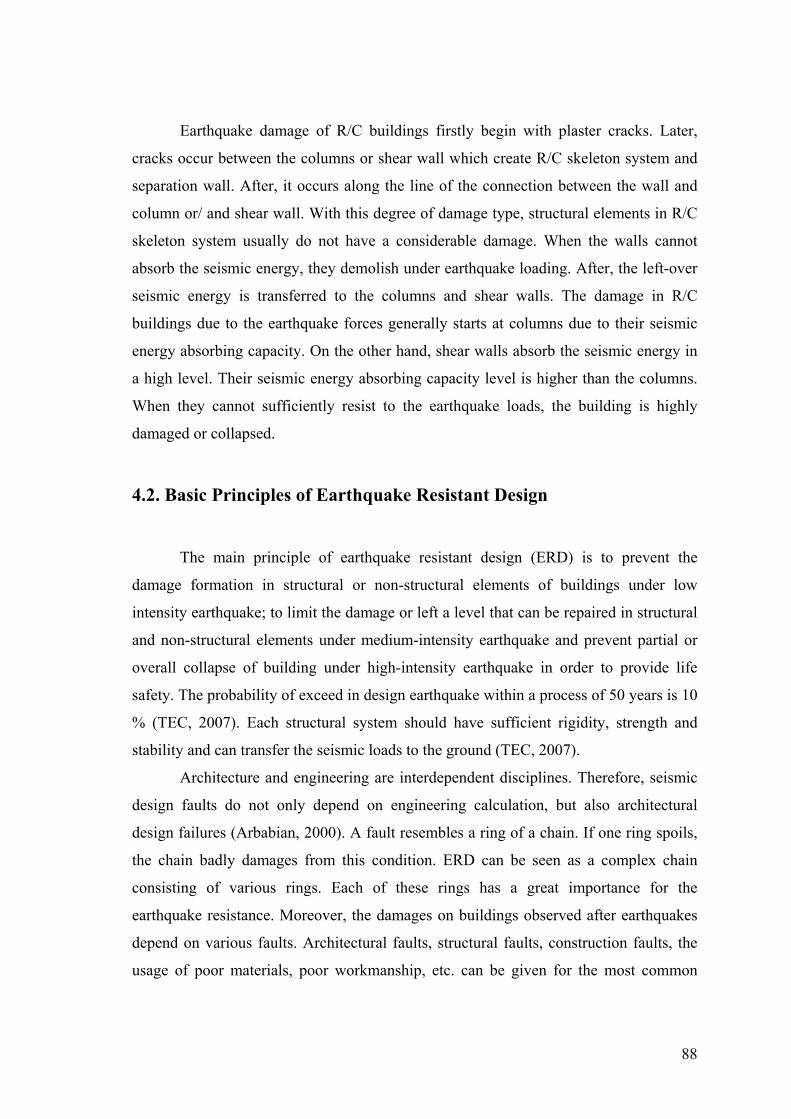
88
Earthquake damage of R/C buildings firstly begin with plaster cracks. Later,
cracks occur between the columns or shear wall which create R/C skeleton system and
separation wall. After, it occurs along the line of the connection between the wall and
column or/ and shear wall. With this degree of damage type, structural elements in R/C
skeleton system usually do not have a considerable damage. When the walls cannot
absorb the seismic energy, they demolish under earthquake loading. After, the left-over
seismic energy is transferred to the columns and shear walls. The damage in R/C
buildings due to the earthquake forces generally starts at columns due to their seismic
energy absorbing capacity. On the other hand, shear walls absorb the seismic energy in
a high level. Their seismic energy absorbing capacity level is higher than the columns.
When they cannot sufficiently resist to the earthquake loads, the building is highly
damaged or collapsed.
4.2. Basic Principles of Earthquake Resistant Design
The main principle of earthquake resistant design (ERD) is to prevent the
damage formation in structural or non-structural elements of buildings under low
intensity earthquake; to limit the damage or left a level that can be repaired in structural
and non-structural elements under medium-intensity earthquake and prevent partial or
overall collapse of building under high-intensity earthquake in order to provide life
safety. The probability of exceed in design earthquake within a process of 50 years is 10
% (TEC, 2007). Each structural system should have sufficient rigidity, strength and
stability and can transfer the seismic loads to the ground (TEC, 2007).
Architecture and engineering are interdependent disciplines. Therefore, seismic
design faults do not only depend on engineering calculation, but also architectural
design failures (Arbabian, 2000). A fault resembles a ring of a chain. If one ring spoils,
the chain badly damages from this condition. ERD can be seen as a complex chain
consisting of various rings. Each of these rings has a great importance for the
earthquake resistance. Moreover, the damages on buildings observed after earthquakes
depend on various faults. Architectural faults, structural faults, construction faults, the
usage of poor materials, poor workmanship, etc. can be given for the most common
89
faults observed after earthquakes. Accordingly, the main parameters affecting the
earthquake resistance of buildings can be ordered as follows:
• Building geometry
• Continuity in structural members
• Building weight
• Strength
• Ductility
• Fragility
• Stiffness
Building geometry affects the earthquake behaviour. An important feature is
regularity and symmetry in the overall plan geometry of the building. The type of plan
geometry is investigated comprehensively in Chapter 3 with its size, proportion and the
other characteristics. The more suitable plan geometry in terms of earthquake resistance
is determined with comparing the worse ones.
Continuity in structural members is described in Chapter 3. Discontinuity in a
structural member cause the irregularity type of B3 which is a sub-category of structural
irregularity defined in the TEC (2007). Continuity in structural elements provides
stability in building.
Building weight is proportional with the earthquake forces. Therefore, the
vibration effects get greater if the mass of the building increase. It is verified in the
equation below, the forces of earthquake (F) is calculated by the multiplication of the
building mass with acceleration created by the earthquake (Eq 4.1).
F= m x a (4.1)
There are two methods in order to decrease the building mass. One is to use light
materials, and the other is to design according to earthquake resistant design criteria.
Unbalanced mass distribution cause irreparable damage on buildings. One should
abstain from that condition.
Strength is a resistance condition to the internal forces which occurred due to the
earthquake loading. Structural elements should have a certain level of resistance.
Moreover, it is identical with the load carrying capacity of the structure which is the

90
limit value of load bearing capacity. Strength is the ability of a material to withstand an
applied force without damage (Özmen & Ünay, 2008).
Ductility is a kind of structural elements behaviour against loads. Ductility is the
ability of the building to bend, sway, and deform by large amounts without collapse. In
ductile buildings, deformations occur without any great decrease in the load bearing
capacity or strength of structural elements (Bachman, 2003). Seismic energy is
consumed in ductile buildings as deformation which exceeds the elastic limit. With this
deformation, the building changes its condition from ductile condition to the fragile
condition (Erman, 2002). Beam deflection under a load can be given as an example of
this condition. Maximum deflection occurs in the middle of the beam.
Fragility is the opposite condition of ductile behavior. In ductile buildings, the
deformations are made without any decrease in the load carrying capacity of the
structural elements. On the other hand, in fragile buildings, major shear cracks occur
which creates stiffness changes suddenly. Ductile buildings usually provide substantial
advantages when it is compared with fragile buildings. Ductile material gets great
longer or shorter before buckling or crushing (Bachman, 2003).
Rigidity or stiffness can be described as the resistance of structural elements
against torsional moments and excessive displacements (Özmen & Ünay, 2008). The
rigidity of a building along the vertical direction should be distributed uniformly.
Previously, low stiffness and more flexibility are preferred for a good seismic
performance in buildings. However, later from the lived earthquakes it is witnessed that
buildings expose to more damage due to the less stiffness in buildings. Mertol (2002)
states that rigid buildings should be made without any neglect in the ductility
conditions. Because, the building should show flexible behavior under earthquake
forces during the vibration occurs. These vibrations prevent collapses in buildings.
The structural members of a building should be designed as to have sufficient
strength, rigidity and stability. The seismic loads should be transferred uninterrupted
and safely (TEC, 2007).
Elasticity is non-rigid condition of the building which resist to the deformation
of the earthquake loads. The important quality of various structural materials is their
ability to reacquire their original form after a force affects. These types of materials are
called elastic. For instance, the material of reinforced concrete is not as elastic as steel.

91
4.3. Analysis Rules of Earthquake Resistant Design
In this part, the parameters which are necessary for earthquake analysis of
buildings are described in accordance with TEC (2007). Moreover, calculation methods
which are used in earthquake analysis of buildings are given.
4.3.1. Definition of Elastic Seismic Loads: Spectral Acceleration
Coefficient A(T)
The Spectral Acceleration Coefficient which is denoted as A(T) is considered as
the main parameter for determination of the earthquake loads (Eq 4.2). The elastic
spectral acceleration, Sae(T), which is defined as the ordinate of the 5 % damped elastic
acceleration spectrum, equals spectral acceleration coefficient times acceleration of
gravity, g (TEC, 2007).
A(T) = Ao I S(T) Sae(T) = A(T) g
4.3.2. Effective Ground Acceleration Coefficient (Ao)
The effective ground acceleration coefficient, which is denoted as Ao, is shown
in equation 4.2. This coefficient shows the condition of earthquake hazard in different
region. Turkey is divided into five earthquake zones as 1o, 2o, 3o, 4o and 5o, earthquake
zone (Table 4.1). The 5o earthquake zone does not rest under the influence of earthquake
hazard. For why, effective ground acceleration coefficient is classified for the first four
zone except 5o earthquake zone.
Table 4.1.Effective ground acceleration coefficient
Seismic Zone Ao 1 0.4
2 0.3
3 0.2
4 0.1
(4.2)

92
4.3.3. Building Importance Factor (I)
The building importance factor, I, which is given in equation 4.2, varies between
1.0 and 1.5. The maximum building importance factor of 1.5 is taken in buildings which
are required to be utilized immediately after an earthquake. For instance, hospitals,
health wards, fire fighting buildings, telecommunication facilities, transportation
stations, governmental buildings and the buildings containing explosive materials are
situated in this category. The building importance factor of 1.4 is taken in buildings
which are intensively and long term occupied. Educational buildings, museums, prisons
and military barracks can be given as examples of this group. The building importance
factor of 1.2 is taken in buildings which are intensively but short-term occupied
buildings such as cinemas, theatre, sport facilities, concert halls, etc. The minimum
building importance factor of 1.0 is taken in hotels, residential and office buildings
(TEC, 2007).
4.3.4. Spectrum Coefficient S(T)
Spectrum Coefficient, S(T) which is given in Equation 4.3 will be calculated by
depending on local site conditions and natural period of the building, T (Figure 4.4).
S(T) =1+1.5AT
T (0 ≤ T ≤ TA)
S(T) = 2.5 (TA < T≤ TB)
S(T) = 2.5 )(TTB 0.8 (TB < T)
Spectrum Characteristic Periods, TA and TB, described in Eq. (4.3) are shown in
Table 4.3, depending on local site classes which are divided into four types (Table 4.2).
4.3

93
Table 4.2. Spectrum Characteristic Periods (TA, TB)
Local Site Class TA (second) TB(second)Z1 0.10 0.30 Z2 0.15 0.40 Z3 0.15 0.60 Z4 0.20 0.90
These periods (TA, TB) include the interaction between the characteristics of
local soil and characteristics of building vibration. Earthquakes cause ground motions
under the buildings. These motions should be defined numerically in order to design the
building. It is shown in Figure 4.4.
Figure 4.4. Design acceleration spectrum
Soil types are divided into four main groups (Table 4.3). These are denoted as A,
B, C and D (TEC, 2007). The soil group, A, consists of firm massive volcanic rocks,
strong metamorphic rocks, firm sedimentary rock with cement, more dense sand,
aggregate, and hard and silty clay. The soil group, B, consists of crumbly rock, dense
sand and aggregate, and more hard and silty clay. The soil group, C, consists of soft
metamorphic rocks, medium level of dense sand and aggregate, and hard and silty clay.
The soil group, D, consists of soft and thick alluvium layer, loose sand, and soft and
silty sand.

94
Table 4.3. Local site classes and groups
Local Site Class
Site Group and Thickness of Top Layer (h1)
Z1 (A) Site group, h ≤ 15m (B) Site group
Z2 h1 > 15 m (B) Sitel group h1≤ 15 m (C) Site group
Z3 15m < h1≤ 50m (C) Site group h1≤ 10m (D) Site group
Z4 h1 >50 m (C) Site group h1> 10 m (D) Site group
4.4. Analysis Methods
There are three methods for the linear seismic analysis of buildings and
building-like structures defined in the TEC (2007). These are described as follows:
1. Equivalent Seismic Load Method (Static)
2. Mode-Combination Method (Dynamic)
3. Time Domain Method (Dynamic)
4.4.1. Equivalent Seismic Load Method
Equivalent seismic load method is a kind of static analyses method. It can be
used when the conditions described in Figure 4.6 are provided. Earthquake loads are
accepted as the lateral loads which affect buildings on floor levels and on both
earthquake directions. The cross section impacts are calculated (TEC, 2007).
4.4.2. Mode-Combination Method
Mode-Combination method is a kind of dynamic analyses method that the
building mass is considered to have collected in the floors. In this method, maximum
internal forces and displacements are defined by the statistical combination of
maximum contributions obtained from each of the adequate number of natural vibration
modes which is considered (TEC, 2007). A sample for the different modes of the
building is displayed on Figure 4.5.

95
Figure 4.5. A sample for the different modes of the structure (IdeCAD Analysis Report)
4.4.3. Analysis Methods in Time Domain
Analysis method in time domain is a kind of dynamic analyses method used in
various research. The inelastic effect of the building is considered in this method to
understand the general behavior of the building. Turkish Earthquake Code (2007)
suggests this method only for so important building because this analysis method is too
time-consuming. Artificially generated, previously recorded or simulated earthquake
ground motions can be used in this method for seismic analysis of buildings.
4.4.4. Selection of Analysis Method
Earthqauke calculation method of the building depends on three main factors.
The first one is the earthquake zones. The second one is building height, and finally the
third one is the structural irregularity types, A1 and B2. Earthquake calculation can be
made with two different method by taking into consideration these factors. Each
structure’s earthquake calculation can be made with one of the dynamic method.
In the first and second earthquake zones, if the storey height is higher than 40
meter, dynamic earthquake analysis is compulsory to be applied. If it is lower than 25
meter, torsional irregularity check must be made. In the event that the torsional
irregularity coefficient is higher than 2.0, dynamic analysis must be made. On the other
hand, if the building height is between 25 and 40meter, firstly soft storey (B2)
irregularity check must be applied, and then the torsional irregularity (A1) check must

96
be examined. If the B2 coefficient is greater than 2.0, dynamic analysis is compulsory.
However, the B2 coefficient is lower than 2.0, at this time torsional irregularity checks
are applied. If the A1 coefficient is greater than 2.0, dynamic analysis must be made. On
the other conditions, static methods are applied. Moreover, in the third and fourth
degree earthquake zones, if the building height is greater than 40 meter, dynamic
analysis is compulsory without A1 or B2 irregularity check. Besides, static analysis is
applied without B2 irregularity check if the building height is lower than 40 meter
(TEC, 2007). Moreover, if the value of ηbi ≤ 2, then equivalent static method for the
seismic analysis can be applied for buildings up to 40 m in height provided that there is
no B2 type of structural irregularity. A1 and B2 type of irregularities are approved as
the determinative irregularities in the selection of the seismic analysis method.
Methods to be used for the earthquake analysis of the existing structures or the
newly designed structures are determined according to the application limits of the
factors. The choice of the earthquake analysis method between the static or dynamic
method is represented in Figure 4.6.
Mode-combination method is used in all the cases of Chapter 5. Although mode-
combination method is not compulsory, it is chosen for the earthquake analysis of the
models due to its reliable results.

97
Figure 4.6. Selection of the method for seismic analysis
4.5. Effective Storey Drifts (δi)max
The reduced storey drift, ∆i, of any column or structural wall shall be
determined by Eq.(4.4) as the difference of displacements between the two consecutive
stories. In Eq.(4.4) di and di−1 represent lateral displacements obtained from the
analysis at the ends of any column or structural wall at stories i and (i - 1) under reduced
seismic loads (Figure 4.7). Effective storey drift , δi , of columns or structural walls at
the i’th storey of a building shall be obtained for each earthquake direction by Eq.(4.5).
The maximum value of effective storey drifts, (δi)max, obtained for each earthquake
B2 CONTROL Х B2 CONTROL √
A1 [ηbi] CONTROL ηki > 2.0 ηki ≤ 2.0
ηbi >2 [A1] A1 [ηbi] CONTROL
ηbi >2[A1]
HN ≤ 25 m 25m < HN ≤ 40 m HN > 40 m
DINAMIC [MODE]
DINAMIC [MODE-TIME]
DINAMIC [MODE]
DINAMIC [MODE]
1o. and 2o. EARTHQUAKE
1.2<ηbi ≤ 2
STATIC [EQUIVALENT]
ηbi >1. 2
[e=±0.05] [e=±0.05D] 1.2<ηbi ≤ 2
STATIC
ηbi >1. 2
[e=±0.05] [e=±0.05D]
1.2<ηbi ≤ 2
STATIC
ηbi >1. 2
[e=±0.05] [e=±0.05D]
HN ≤ 40 m HN > 40 m
DINAMIC [MODE-TIME]
3o. and 4o. EARTHQUAKE ZONE

98
direction by Eq.(4.5) at columns or structural walls of a given i’th storey of a building
shall satisfy the condition given by Eq.(4.6). In the case where the condition given by
Eq.(4.6) is not satisfied at any storey of the building, the seismic analysis shall be
repeated with increased stiffness of the structural system.
∆ =d i - d i-1 (4.4)
δi = R ∆i (4.5)
≤ih
i max)(δ0.02 (4.6)
di+1
di
di-1
h1
Figure 4.7. Effective storey drifts
4.6. Second Order Effects (θi)
The second order effect indicates the nonlinear behaviour of the structural
elements. Its limit coefficient, which is denoted as θi is formulized in Eq. (4.7). Less
stiffness causes augmentation in the second order effects in buildings. Second order
effects occur due to the excessive displacement in buildings which can cause the total
collapses in buildings (Doğan, 2007). In the case the condition is not satisfied, the
rigidity of the structural elements should be increased and the seismic analysis should
be repeated.
θi = ii
N
ijorti
hV
wj∑=
∆ )(≤ 0.12 (4.7)

99
CHAPTER 5
NUMERICAL ANALYSIS
The theoretical information related to the earthquake resistant design (ERD) of
reinforced concrete (R/C) buildings in terms of structural irregularities was described in
Chapter 3. As previously mentioned, the main objective of this thesis is to determine the
effective factors on structural irregularities to develop a substantial guide for architects
and students of architecture. This can be succeeded with proving the failures which are
commonly recurring by architects. Therefore, previously mentioned rules related to
structural irregularities are tested in a simple visual and analytical style to demonstrate
the earthquake effects on structures.
This chapter comprises of 4 cases. Case I consists of six main parametric
models. Additionally, it totally consists of 144 models with various R/C structural
system type, the number of storey and the number of structural axis options. The R/C
system types which are commonly used in Turkey are compared. Case II totally consists
of 9 parametric models having twenty stories. The effects of irregular rigidity
distribution despite the symmetric plan geometry are investigated. Additionally, the
effects of overhang direction on earthquake behaviour of structure are examined. Case
III comprises of 9 main models, and totally 72 models with various numbers of stories
and structural configuration. The floor opening rate, its location in the plan and its
interaction with structural configuration are investigated. Case IV consists of 5 main
models and in total with sub models it has 40 models. Square plan geometry is chosen
to analyze the earthquake behaviour of structures in all cases except case IV due to its
regularity in plan geometry and symmetry condition. The earthquake behaviours of
different plan geometries are investigated in case IV by holding constant of the floor
area of the models.
The square model has 5 axis or 4 bays with 5 m beam span in both X and Y
direction. Thus, the dimension of square model is 20 m × 20 m. Floors consist of R/C
slabs of 15 cm in thickness except the void floors in case III. Floor heights are taken as
2.80 m in every storey. The models are assumed to be in the first degree earthquake
zone. Besides, they are designed by using C30 class concrete and S420 class steel.

100
Project and TEC (2007) parameters which are used in the cases are described in the
Table 5.1 as follows:
Table 5.1 Project and TEC parameters
Project Parameters of the models 2007 Turkish Earthquake Code
Parameters
Maximum Storey Number: 20 Earthquake Zone:1
Storey Height: 2.80 m Soil Class: Z2
Maximum Building Height (Hn): 56 m Earthquake Zone Factor: 0.4
Beam Span: 5 m Building Importance Factor: 1
Beams: 30/60 cm Concrete Class: C30
Columns: 60/60 cm Steel Class: S420
Shear Wall: 25/500 cm Ductility Level: High, R: 6.00
Slab thickness: 15 cm Live Load Factor : 0.3
In this chapter, structural irregularities constituting the main subject of the thesis
will be evaluated according to the TEC (2007). With this aim, many parametric studies
are developed. A series of model is generated for each defined structural irregularity.
The changes in the parameters such as torsional irregularity coefficient, stiffness
irregularity coefficient, maximum effective storey drift, interstorey drift and second
order effect will be compared in each parametric model.
5.1. Case I: R/C Structural Systems: Symmetric Configuration (A1)
The case consists of 6 main models and totally consists of 144 models with sub
models. All models are designed to have both symmetrical and regular plan geometry
and rigidity distribution. It is aimed to explore that despite the symmetrical plan
geometry and rigidity distribution, structural elements type, their location in the plan
and their sufficiency in terms of rigidity, strength and stability according to the each
system defined above play the most effective role in determining the earthquake
behaviour of structures. All models are generated based on defined variables and their

101
earthquake behaviour is compared on the basis of structural irregularities. Then,
obtained results are discussed.
In this case, various certain R/C structures are chosen to examine the earthquake
behaviour of structures on basis structural irregularities in detail. Therefore, the R/C
structural system types, which are commonly used in Turkey, are grouped based on R/C
structural systems as follows:
1. Frame System
2. Frame System + Rigid Core
3. Shear-Frame System
4. Shear-Frame System + Rigid Core
For each selected R/C structural system type, three models which have a
dimension of 20 m x 20 m, 20 m x 30 m, and 20 m x 50 m are generated by increasing
the number of axis along the X direction. These main models are coded differently in
each parametric model without changing dimensions. The main variables can be listed
as follows:
• R/C structural system type
• The number of axis
• The number of storey (1S, 3S, 5S, 8S, 10S, 12S, 15S, 20S)
5.1.1. Parametric Model Ia: Frame Systems
In this model, the structure has been designed as a frame system. Each beam
span has a length of 5 meter. The model has both a symmetrical and regular plan
geometry and also rigidity distribution. There is no A3 irregularity (projections in plan).
The parametric models of Ia are shown in Figure 5.1 and it consists of three sub models
as Ia 20x20, Ia 20x30, and Ia 20x50. Earthquake behaviour of frame systems is
investigated by changing the number of storey and axis. The analysis results which are
shown in Table 5.2 are discussed by comparing each result of Ia 20x20, Ia 20x30 and Ia
20x50.

102
(a)
(b)
(c)
Figure 5.1. Structural plans of parametric model Ia a) Ia 20x20, b) Ia 20x30, c) Ia 20x50.

103
Table 5.2. Analysis results of parametric model Ia
Storey
(δi)max
δ max/hi≤0.02 θ≤0.12
ηbi<1.2 ηki<2.00
1S 1.38 0.0005 0.0004 1.11 -
3S 4.90 0.0018 0.0015 1.11 1.52
5S 9.27 0.0034 0.0032 1.11 1.67
8S 13.02 0.0048 0.0057 1.11 1.64
10S 14.07 0.0052 0.0073 1.11 1.57
12S 14.88 0.0055 0.0090 1.11 1.53
15S 15.84 0.0059 0.0116 1.11 1.54
Ia 2
0x20
20S 17.38 0.0064 0.0162 1.10 1.56
1S 1.50 0.0006 0.0004 1.16 -
3S 5.33 0.0020 0.0016 1.16 1.53
5S 10.07 0.0037 0.0033 1.16 1.70
8S 13.93 0.0052 0.0059 1.16 1.69
10S 15.04 0.0056 0.0076 1.16 1.64
12S 15.91 0.0059 0.0094 1.16 1.58
15S 16.95 0.0063 0.0121 1.15 1.54
Ia 2
0x30
20S 18.55 0.0069 0.0169 1.15 1.55
1S 1.63 0.0006 0.0004 1.21 -
3S 5.79 0.0021 0.0016 1.21 1.55
5S 10.94 0.0041 0.0034 1.21 1.72
8S 14.94 0.0055 0.0061 1.21 1.73
10S 16.13 0.0060 0.0079 1.21 1.71
12S 17.06 0.0063 0.0097 1.21 1.67
15S 18.19 0.0067 0.0125 1.21 1.59
Ia 2
0x50
20S 19.91 0.0074 0.0174 1.21 1.55
Based on the structural irregularities report, the maximum value of effective
storey drift is changing depending on parametric models. While the maximum values of
effective storey drift in model Ia 20x20 is17.38 mm, it is 19.91 mm in Ia 20x50. The
limit values of interstorey drifts and second order effect in above models have not been
exceeded. These values also gradually increase from one storey model up to twenty
storey model. Besides, they are gradually increase from the ground floors to the upper
floors of model Ia 20x20, Ia 20x30, and Ia 20x50.

104
The maximum torsional irregularity coefficient (ηbi) is obtained 1.11 in Ia
20x20, 1.16 in Ia 20x30, and 1.21 in Ia 20x50. It is observed that if the number of storey
of the parametric models in Ia increase, the maximum torsional irregularity coefficient
will decrease. Furthermore, it is noticed that the torsional irregularity coefficients
gradually decrease from the ground floor to upper floors within the own stories of each
different storied parametric models of Ia. Besides, torsional irregularity coefficients
increase from parametric model Ia 20x20 to Ia 20x50. It can be concluded that if the
number of axis increase in parametric model Ia, the torsional irregularity coefficients
will increase. Though there is not torsional irregularity in Ia 20x20 and Ia 20x30, there
is torsional irregularity in Ia 20x50. The maximum torsional irregularity coefficient is
obtained as 1.21 in Ia 20x50.
Stiffness irregularity coefficient (ηki) is between normal ranges in parametric
model Ia. It changes between 1.52 and 1.67 in Ia 20x20, 1.53 and 1.70 in Ia 20x30, 1.55
and 1.73 in Ia20x50. There is an increase in the stiffness irregularity coefficient from Ia
20x20 to Ia 20x50. There is not stiffness irregularity in parametric models of Ia. The
maximum stiffness irregularity coefficient is found as 1.73 in eight storey sub model of
Ia 20x50. Furthermore, it is observed that if the number of storey in the parametric
model Ia increases, it does not create a regular increase or reduction in the maximum
soft storey coefficients. On the other hand, it is observed that stiffness irregularity
coefficient is higher when this coefficient is calculated based on below storey.
5.1.2. Parametric Model Ib: Frame System+ Rigid Core
In this model, the structure has been designed as a frame system. Apart from the
parametric model Ia, a rigid core placed in the centre of the structure to maintain the
symmetry. The model has both a regular plan geometry and rigidity distribution. There
is not any projection in plan. The parametric models of Ib, which have three sub models
as Ib 20x20, Ib 20x30 and Ib 20x50, are drawn in Figure 5.2. The effects of the central
rigid core in terms of earthquake behaviour of a structure are investigated by changing
the number stories and axis. The analysis results shown in Table 5.3 will be evaluated
by comparing each results obtained from Ib 20x20, Ib 20x30 and Ib 20x50.

105
(a)
(b)
(c)
Figure 5.2. Structural plans of parametric model Ib a) Ib 20x20, b) Ib 20x30, c) Ib 20x50

106
Table 5.3. Analysis results of parametric model Ib
Storey
(δi)max
δ max/hi≤0.02 θ≤0.12
ηbi<1.2 ηki<2.00
1S 0.58 0.0002 0.0001 1.27 -
3S 2.37 0.0009 0.0007 1.24 1.51
5S 4.97 0.0018 0.0015 1.23 1.71
8S 9.78 0.0036 0.0033 1.22 1.83
10S 11.07 0.0041 0.0046 1.21 1.87
12S 12.35 0.0046 0.0062 1.21 1.90
15S 14.08 0.0052 0.0087 1.20 1.93
Ib 2
0x20
20S 16.82 0.0062 0.0136 1.20 1.96
1S 0.78 0.0003 0.0002 1.35 -
3S 1.01 0.0005 0.0022 1.32 1.46
5S 6.11 0.0023 0.0018 1.31 1.66
8S 11.12 0.0041 0.0037 1.29 1.76
10S 12.50 0.0046 0.0052 1.29 1.80
12S 13.78 0.0051 0.0069 1.28 1.83
15S 15.47 0.0057 0.0095 1.28 1.86
Ib 2
0x30
20S 18.18 0.0067 0.0145 1.27 1.89
1S 1.04 0.0004 0.0002 1.40 -
3S 3.90 0.0014 0.0010 1.38 1.42
5S 7.52 0.0028 0.0022 1.37 1.59
8S 12.71 0.0047 0.0043 1.35 1.69
10S 14.21 0.0053 0.0059 1.35 1.73
12S 15.39 0.0057 0.0076 1.35 1.75
15S 17.12 0.0063 0.0104 1.34 1.77
Ib 2
0x50
20S 19.67 0.0073 0.0156 1.34 1.79
Based on the earthquake analysis report of structural irregularities, while the
maximum value of effective storey drift in parametric model Ib 20x20 is obtained as
16.82 mm, it is 18.18 mm in parametric model Ib 20x30 and 19.67 mm in Ib 20x50. The
limit irregularity values of interstorey drifts and second order effect have not been
exceeded in parametric model Ib. All that values gradually increase from one storey
model to twenty storey model of Ib. Moreover, they are all increase toward upper floor
within the own stories of each different storied parametric model Ib.

107
The maximum torsional irregularity coefficient (ηbi) is 1.27 in Ib 20x20, 1.35 in
Ib 20x30 and 1.40 in Ib 20x50. It is noticed that if the number of storey in parametric
model Ib increase, the maximum torsional irregularity coefficient will decrease.
Moreover, the torsional irregularity coefficients gradually decrease toward upper floors
within the own stories of each different storied parametric models of Ib 20x20, Ib20x30
and Ib 20x50. Additionally, the torsional irregularity coefficients increase gradually
from parametric model Ib 20x20 to Ib 20x50. It can be said that if the number of axis
increase in parametric model Ib, the torsional irregularity coefficients will gradually
increase. There is torsional irregularity in each sub models of Ib. Rigid core cause a
considerable increase in the torsional irregularity coefficients because it is near to the
gravity centre.
Stiffness irregularity coefficient (ηki) is under the limit value in parametric
models of Ib. The range varies between 1.51 and 1.96 in Ib 20x20, 1.46 and 1.89 in Ib
20x30 and 1.42 and 1.79 in Ib 20x50. There is a decrease in the maximum stiffness
irregularity coefficient from Ib 20x20 to Ib 20x50. There is no stiffness irregularity in
parametric model Ib. However, there are high stiffness irregularity coefficients which
close to the limit coefficient for the stiffness irregularity. The maximum stiffness
irregularity coefficient is obtained as 1.96 in twenty storey parametric model of Ib
20x20. Furthermore, it is concluded that if the number of storey in parametric model Ib
increase, the maximum soft storey coefficient will gradually increase in each parametric
model of Ib. On the other hand, it is realized that the stiffness irregularity coefficient
calculated according to the below storey shows higher values than the values calculated
based on above storey.
5.1.3. Parametric Model Ic: Shear-Frame System (1)
The parametric model Ic has been designed as a shear-frame system. Apart from
the parametric model Ib, four shear walls having L-shape are placed on the corners of
the structure (Figure 5.3). The rigid core is not removed. The effects of shear walls
located on the corner of the structure are examined with its rigid core in terms of
earthquake behaviour.

108
(a)
(b)
(c)
Figure 5.3. Structural plans of parametric model Ic a) Ic 20x20, b) Ic 20x30, c) Ic 20x50

109
Table 5.4. Analysis results of parametric model Ic
Obtained from the earthquake analysis report of structural irregularities, while
the maximum value of effective storey drift in parametric model Ic 20x20 is 18.51 mm,
it is 19.08 mm in Ic 20x30 and 20.16 mm in Ic 20x50. Interstorey drifts and second
order effect coefficients defined in the TEC (2007) have not been exceeded. These
values gradually increase from one storey structure to twenty storey structure (Table
5.4).
Storey
(δi)max
δ max/hi≤0.02 θ≤0.12
ηbi<1.2 ηki<2.00
1S 0.25 0.0001 0.0001 1.08 -
3S 1.32 0.0005 0.0004 1.09 1.64
5S 3.47 0.0013 0.0011 1.09 1.92
8S 8.23 0.0030 0.0027 1.10 2.08
10S 10.19 0.0038 0.0040 1.10 2.14
12S 11.78 0.0044 0.0057 1.10 2.18
15S 14.21 0.0053 0.0086 1.09 2.23
Ic 2
0x20
20S 18.51 0.0069 0.0147 1.09 2.28
1S 0.34 0.0001 0.0001 1.11 -
3S 1.68 0.0006 0.0005 1.13 1.61
5S 4.23 0.0016 0.0013 1.14 1.86
8S 9.48 0.0035 0.0030 1.15 2.00
10S 11.10 0.0041 0.0044 1.15 2.06
12S 12.67 0.0047 0.0061 1.15 2.09
15S 15.04 0.0056 0.0090 1.14 2.13
Ic 2
0x30
20S 19.08 0.0071 0.0150 1.13 2.18
1S 0.49 0.0002 0.0001 1.15 -
3S 2.22 0.0008 0.0007 1.17 1.56
5S 5.24 0.0019 0.0016 1.20 1.78
8S 10.65 0.0039 0.0034 1.22 1.90
10S 12.40 0.0046 0.0050 1.23 1.95
12S 12.67 0.0047 0.0061 1.15 2.09
15S 16.37 0.0061 0.0097 1.22 2.02
Ic 2
0x50
20S 20.16 0.0075 0.0154 1.19 2.05
110
The maximum torsional irregularity coefficient (ηbi) is obtained as 1.10 in
parametric model Ic 20x20, 1.15 in Ic 20x30 and 1.23 in Ic 20x50. Moreover, an
increase in the number of storey does not create a regular change in the maximum
torsional irregularity coefficients between stories. It is noticed that the torsional
irregularity coefficients increase gradually from ground floor to the upper floors within
the own stories of each different storied sub models of Ic. Besides, torsional irregularity
coefficients increase from parametric model Ic 20x20 to Ic 20x50. It can be concluded
that if the number of axis increase in parametric model Ic, the torsional irregularity
coefficients will increase. While there is no torsional irregularity in Ic 20x20 and Ic
20x30, there is torsional irregularity in Ic 20x50. The torsional irregularity is started to
exceed the limit coefficient in five storey sub model of Ic 20x50.
Stiffness irregularity coefficient (ηki) shows great values in the parametric
models of Ic. The range varies between 1.64 and 2.28 in Ic 20x20, 1.61 and 2.18 in Ic
20x30 and 1.56 and 2.05 in Ic 20x50. There is a decrease in the maximum stiffness
irregularity coefficient from Ic 20x20 to Ic 20x50. There is stiffness irregularity in all
parametric models of Ic. The maximum stiffness irregularity coefficient is obtained as
2.28 in twenty storey sub model of Ic 20x20. Furthermore, it is realized that if the
number of storey in parametric model Ic increases, the maximum soft storey coefficient
will gradually increase from one storey model to twenty storey model. Also, the
stiffness irregularity coefficient calculated based on storey above or below are
compared, it is observed that stiffness irregularity coefficient has higher values for the
ratio below than the ratio above. Besides, it is noticed that stiffness irregularity or soft
storey irregularity was observed on the first storey of each parametric models of Ic
which have different number of storey and axis.
5.1.4. Parametric Model Id: Shear-Frame System (2)
In this model, the structure has been designed as a shear-frame system like in the
parametric model Ic. Apart from the parametric model Ic, four I-shaped shear walls are
placed in the middle of the outer axis of the structures as illustrated in Figure 5.4.
Besides, the rigid core is not removed. The contributions of shear walls located in the
middle of the outer axis are examined in terms of earthquake behaviour with its rigid
core.

111
(a)
(b)
(c)
Figure 5.4. Structural plans of parametric model Id a) Id 20x20, b) Id 20x30, c) Id 20x50

112
Table 5.5. Analysis results of parametric model Id
Storey
(δi)max
δ max/hi≤0.02 θ≤0.12
ηbi<1.2 ηki<2.00
1S 0.27 0.0001 0.0001 1.08 -
3S 1.44 0.0005 0.0004 1.09 1.66
5S 3.74 0.0014 0.0012 1.10 1.93
8S 8.79 0.0033 0.0029 1.11 2.09
10S 10.70 0.0040 0.0043 1.12 2.15
12S 12.43 0.0046 0.0061 1.12 2.19
15S 15.07 0.0056 0.0092 1.12 2.24
Id 2
0x20
20S 19.70 0.0073 0.0155 1.12 2.28
1S 0.36 0.0001 0.0001 1.12 -
3S 1.81 0.0007 0.0005 1.13 1.63
5S 4.50 0.0017 0.0014 1.15 1.87
8S 9.87 0.0037 0.0032 1.16 2.01
10S 11.57 0.0043 0.0047 1.17 2.06
12S 13.27 0.0049 0.0065 1.18 2.10
15S 15.79 0.0058 0.0095 1.18 2.14
Id 2
0x30
20S 20.06 0.0074 0.0156 1.17 2.18
1S 0.51 0.0002 0.0001 1.15 -
3S 2.36 0.0009 0.0007 1.18 1.57
5S 5.51 0.0020 0.0016 1.21 1.79
8S 10.99 0.0041 0.0036 1.23 1.91
10S 12.84 0.0048 0.0052 1.24 1.95
12S 14.52 0.0054 0.0070 1.25 1.99
15S 16.94 0.0063 0.0101 1.25 2.02
Id 2
0x50
20S 20.82 0.0077 0.0159 1.23 2.05
According to the earthquake analysis report of structural irregularities shown in
Table 5.5, it is observed that the maximum coefficient of effective storey drift in
parametric model Id 20x20 is 19.70 mm, 20.06 mm in Id 20x30 and 20.82 mm in Id
20x50. The interstorey drifts coefficients and second order effect coefficients have not
been exceeded. All that values gradually increase from one storey structure to twenty
storey structure. Furthermore, they are all increase towards upper floors within the own
stories of each different storied parametric models of Id 20x20, Id 20x30 and Id 20x50.

113
The maximum torsional irregularity coefficient (ηbi) is 1.12 in Id 20x20, 1.18 in
Id 20x30 and 1.25 in Id 20x50. Besides, it is noticed that if the number of storey in
parametric models of Id increases, the maximum torsional irregularity coefficients and
the coefficients within each different storied sub models of Id gradually increase from
ground floor to upper floor. Besides, torsional irregularity coefficients increase from
parametric model Id 20x20 to Id 20x50. Therefore, it can be concluded that if the
number of axis increase in parametric model Id, the torsional irregularity coefficients
will increase. While there is not torsional irregularity in Id 20x20 and Id 20x30, the
parametric model Id 20x50 has torsional irregularity. The torsional irregularity started
to exceed the limit coefficient in five storey sub model of Id 20x50.
Stiffness irregularity coefficient (ηki) shows large ranges in the parametric
models of Id. The range varies between 1.66 and 2.28 in Id 20x20, 1.63 and 2.18 in Id
20x30 and 1.57 and 2.05 in Id 20x50. There is a decrease in the maximum stiffness
irregularity coefficient from Id 20x20 to Id 20x50. There is stiffness irregularity in all
parametric models of Id. The maximum stiffness irregularity coefficient is gained as
2.28 in twenty storey parametric model of Id 20x20. As a result, if the number of storey
in parametric model Id increases, the maximum soft storey coefficient will gradually
increase in each parametric model of Id. In addition, when the stiffness irregularity
coefficient calculated by the storey above or below is compared, it is observed that
stiffness irregularity coefficient has higher values for the ratio below than the ratio
above. Besides, it is found that this irregularity was seen on the first storey of each sub
models of Id.
5.1.5. Parametric Model Ie: Shear-Frame System (3)
In this model, the structure has been designed as a shear-frame system like the
parametric models Ic and Id. Apart from the parametric model Ic, the rigid core is
removed in parametric model Ie. Shear walls having L-shape are located on the corners
of the structure (Figure 5.5). The effects of shear walls which are located on the corners
of the structure are investigated without a central rigid core. The behaviour of the
structure against earthquake loads are evaluated on basis of the structural irregularity
coefficients.

114
(a)
(b)
(c)
Figure 5.5. Structural plans of parametric model Ie a) Ie 20x20, b) Ie 20x30, c) Ie 20x50

115
Table 5.6. Analysis results of parametric model Ie
Storey
(δi)max
δ max/hi≤0.02 θ≤0.12
ηbi<1.20 ηki<2.00
1S 0.33 0.0001 0.0001 1.06 -
3S 1.65 0.0006 0.0005 1.07 1.62
5S 4.17 0.0015 0.0013 1.08 1.87
8S 9.21 0.0034 0.0031 1.09 2.01
10S 10.78 0.0040 0.0046 1.10 2.06
12S 12.31 0.0046 0.0063 1.10 2.10
15S 14.60 0.0054 0.0093 1.10 2.14
Ie 2
0x20
20S 18.46 0.0068 0.0152 1.09 2.18
1S 0.44 0.0002 0.0001 1.08 -
3S 2.03 0.0008 0.0006 1.10 1.58
5S 4.91 0.0018 0.0016 1.12 1.80
8S 10.06 0.0037 0.0034 1.15 1.93
10S 11.69 0.0043 0.0050 1.16 1.98
12S 13.29 0.0049 0.0067 1.16 2.01
15S 15.53 0.0058 0.0098 1.16 2.04
Ie 2
0x30
20S 19.17 0.0071 0.0156 1.13 2.08
1S 0.61 0.0002 0.0002 1.11 -
3S 2.68 0.0010 0.0008 1.14 1.52
5S 6.05 0.0022 0.0019 1.17 1.72
8S 11.37 0.0042 0.0040 1.22 1.84
10S 13.14 0.0049 0.0057 1.23 1.88
12S 14.71 0.0054 0.0076 1.24 1.91
15S 17.01 0.0063 0.0106 1.23 1.94
Ie 2
0x50
20S 20.51 0.0076 0.0165 1.20 1.97
According to the structural irregularities report, while the maximum value of
effective storey drift in parametric model Ie 20x20 is 18.46 mm, it is 19.17 mm in Ie
20x30 and 20.51 mm in Ie 20x50. The limit values in terms of interstorey drifts and
second order effect have not been exceeded. All that values gradually increase from one
storey structure up to twenty storey structure.
The maximum torsional irregularity coefficient (ηbi) obtained as 1.10 in Ie
20x20, 1.16 in Ie 20x30 and 1.24 in Ie 20x50. It is observed that if the number of storey
116
in parametric models Ie increases, the maximum torsional irregularity coefficients and
the coefficients in each storey for different storied parametric models of Ie gradually
increase from ground floor to upper floors. Besides, torsional irregularity coefficients
increase from parametric model Ie 20x20 to Ie 20x50. Accordingly, it can be deduced
from the analysis that if the number of axis increases in parametric model Ie, the
torsional irregularity coefficients will increase. While there is not torsional irregularity
in Ie 20x20 and Ie 20x30, it is observed in Ie 20x50.
Stiffness irregularity coefficient (ηki) shows large value range in the parametric
models of Ie. The range varies between 1.62 and 2.18 in Ie 20x20, 1.58 and 2.08 in Ie
20x30 and 1.52 and 1.97 in Ie 20x50. There is a decrease in the maximum stiffness
irregularity coefficient from Ie20 to Ie50. As evidence, while there is stiffness
irregularity in Ie 20x20 and Ie 20x30, there is not stiffness irregularity in any parametric
model of Ie 20x50. The maximum stiffness irregularity coefficient obtained as2.18 in
twenty storey parametric model of Ie 20x20. As results, if the number of storey in
parametric model Ie increases, the maximum soft storey coefficient will gradually
increase in each parametric model of Ie. On the other hand, the stiffness irregularity
coefficient based on the calculation with above storey shows lesser soft storey
irregularity coefficients than the calculation with below storey. At the same time, it is
realized that this irregularity was seen on the first storey of each parametric model of Ie.
The value ranges depending on the comparison parameters are given comprehensively
in Table 5.6.
5.1.6. Parametric Model of If: Shear-Frame System (4)
The parametric model If has been designed as a shear-frame system like
parametric model Id. The only difference between the parametric model Id and If is the
central rigid core. It is removed from the parametric model If (Figure 5.6). I-shaped
shear walls are located in the middle of the outer axis of the structure. Earthquake
behaviour of these kinds of systems is investigated by changing the number of stories
and the number of axis in X direction. Analysis results which are shown in Table 5.7 are
discussed by reviewing each result of If 20x20, If 20x30 and If 20x50.

117
(a)
(b)
(c)
Figure 5.6. Structural plans of parametric model If a) If 20x20, b) If 20x30, c) If 20x50

118
Table 5.7. Analysis results of parametric model If
Storey
(δi)max
δ max/hi≤0.02 θ≤0.12
ηbi<1.20 ηki<2.00
1S 0.36 0.0001 0.0001 1.06 -
3S 1.84 0.0007 0.0006 1.07 1.65
5S 4.56 0.0017 0.0015 1.08 1.89
8S 9.72 0.0036 0.0034 1.10 2.02
10S 11.39 0.0042 0.0050 1.12 2.07
12S 13.09 0.0048 0.0068 1.13 2.11
15S 15.55 0.0058 0.0100 1.14 2.15
If 2
0x20
20S 19.65 0.0073 0.0162 1.15 2.19
1S 0.47 0.0002 0.0001 1.08 -
3S 2.26 0.0008 0.0007 1.10 1.61
5S 5.41 0.0020 0.0017 1.12 1.83
8S 10.70 0.0040 0.0038 1.15 1.95
10S 12.51 0.0046 0.0056 1.17 2.00
12S 14.25 0.0053 0.0075 1.18 2.03
15S 16.71 0.0062 0.0108 1.19 2.07
If 2
0x30
20S 20.58 0.0076 0.0170 1.19 2.10
1S 0.64 0.0002 0.0002 1.11 -
3S 2.87 0.0011 0.0009 1.15 1.54
5S 6.37 0.0024 0.0020 1.19 1.73
8S 11.75 0.0044 0.0042 1.24 1.84
10S 13.50 0.0050 0.0058 1.26 1.88
12S 15.14 0.0056 0.0078 1.27 1.90
15S 17.42 0.0065 0.0108 1.28 1.93
If 2
0x50
20S 20.87 0.0077 0.0165 1.26 1.96
Depending on the obtained coefficients from the earthquake analysis report of
structural irregularities, though the maximum value of effective storey drift in
parametric model If 20x20 varies between 0.36 and 19.65 mm, it varies between 0.47
and 27.58 mm in If 20x30 and 0.64 and 20.87 mm in If 20x50. The limit values of
interstorey drifts and second order effect have not been exceeded. These values also
gradually increase from one storey structure to twenty storey structure. Moreover, they

119
are all increase from ground floor to upper floors in parametric models of If 20x20, If
20x30 and If 20x50 (Table 5.7).
The maximum torsional irregularity coefficient (ηbi) is 1.15 in If 20x20, 1.19 in
If 20x30 and 1.28 in If 20x50. It is observed that if the number of storey of the
parametric models in If increases, the maximum torsional irregularity coefficients will
increase. Besides, it increases from parametric model If 20x20 to If 20x50. As results, it
can be concluded that if the number of axis increase in parametric model of If, the
torsional irregularity coefficients will increase. While there is not torsional irregularity
in If 20x20 and If 20x30, there is torsional irregularity in If 20x50.
Stiffness irregularity coefficient (ηki) has considerable coefficients in parametric
models of If. The coefficients vary between 1.65 and 2.19 in If 20x20, 1.61 and 2.10 in
If 20x30 and 1.54 and 1.96 in If 20x50. There is a decrease in the maximum stiffness
irregularity coefficient from If 20x20 to If 20x50. While there is stiffness irregularity in
If 20x20 and If 20x30, there is not observed stiffness irregularity in If 20x50. The
maximum stiffness irregularity coefficient is obtained as 2.19 in twenty storey sub
model of If 20x20. Furthermore, it is noticed that if the number of storey in parametric
model of If increase, the maximum soft storey coefficient will gradually increase in
each parametric model of If. On the other hand, it is observed that the stiffness
irregularity coefficient has higher values for the ratio below than the ratio above.
Besides, it is realized that the stiffness irregularity was occurred on the first storey in
sub models if having soft storey irregularity.
5.1.7. Discussion and Results of Case I
In this case, a set of 6 main models and their sub-models which were generated
by changing the number of axis number, storey and the RC structural system type were
analyzed in terms of earthquake behaviour on bases of the structural irregularities. All
models were created as to have both symmetric plan geometry and rigidity distribution.
The aim of this case was to investigate the seismic behaviour of completely symmetrical
structures in terms of plan geometry and rigidity distribution. R/C structural system
types which are commonly constructed in Turkey are grouped and the models are
created for each type. The results were discussed according to the several criteria
containing torsional irregularity coefficient, soft storey coefficient, effective storey

120
drifts, interstorey drifts and second order effects. On the basis of the carried out
numerical analysis in case I for the different type of R/C models the following
conclusions could be drawn up:
• If the number of axis increases, the torsional irregularity coefficients
increase in all parametric models and their sub models in case I. On the other
hand, it is observed that while the torsional irregularity shows a regular
increase between the own stories of each different storied parametric models,
in contrast in some models it shows a regular decrease or an unbalanced
increase or decrease under earthquake loading.
• The parametric model Ic which consists of a central rigid core and L-shaped
shear walls on the corners of the building show similar seismic performance
with the parametric model Id which have I-shaped shear walls in the middle
of the outer axis of the structure. While the maximum torsional irregularity
coefficient is obtained 1.23 in parametric model Ic, it is 1.25 in parametric
model Id. On the other hand, both of the models have the same maximum
soft storey irregularity coefficient, 2.28. Moreover, the parametric model Ie
which consists of L-shaped parametric model without a central rigid core
behaves similarly against earthquake loads with the parametric model If
which consists of I-shaped shear walls in the middle of the outer axis of the
structure without a central rigid core.
• The direction of the vertical structural member’s has a significant effect on
the earthquake behaviour of the structures. There is no doubt if the rigidity
distributions in the system arranged randomly in both of the earthquake
direction, the structure will failure on the flexible side. Distributions of the
structural member’s regularly in both earthquake directions improve the
seismic behaviour of the structure (Case II).
• It can be deduced from the analysis that shear-frame systems with a central
rigid core show better seismic performance than the shear-frame systems
without a central rigid core.
• It is observed that the models designed as frame systems (parametric model
Ia) shows acceptable torsional irregularity coefficients. However, a central
rigid core added to the system, the structures expose to high torsional
irregularity coefficients like in sub models of Ib.

121
• The models which have shear walls on the corner of the structure shows
better seismic performance rather than the models which have shear walls in
the middle of the outer axis.
• It is gained that except the models consisting only frame systems, the soft
storey irregularity coefficient will increase if the number of axis in models
increases.
• While the lowest soft storey irregularity coefficient is observed in sub
models of parametric model Ia, the critical ones are observed in Ic and Id.
On the other hand, the parametric model Ie and If show similar earthquake
behaviour in terms of soft storey irregularity. While the sub models of Ie
20x20, Ie 20x30, If 20x20 and If 20x30 have soft storey irregularity, there is
not observed soft storey irregularity in sub models of Ie 20x50 and If 20x50.
• The limit values for effective storey drifts and second order effects have not
been exceeded in all the models of case I.
• Increasing rigidity in the structure is not enough by itself to provide
earthquake resistance in structures. The usage of shear walls significantly
support the earthquake behaviour of structures provided that they are
correctly placed in the structure even placed symmetrical. For instance,
although the parametric model Ia has not torsional irregularity, the model Ib
expose to the torsion due to the incorrectly placed shear walls. The rigid core
is located in the centre of the structure in symmetrical structure close to the
gravity centre. Therefore, it causes the torsional irregularity. Shear walls
should be located on the outer axis of the structures or distant from the
gravity centre as possible.
• Sufficiency in rigidity of a structure can change according to the number of
storey and axis of the structure. Therefore, excessive usage of shear walls
does not an indicator of excessive resistant structure against earthquake
loads in other words it does not mean the best earthquake resistant building.
• Despite the symmetrical plan geometry and rigidity distribution, structural
elements type, their location in the plan and their sufficiency in terms of
rigidity, strength and stability according to the each system created in Case I
play the most effective role in earthquake behaviour of structures.

122
5.2. Case II: R/C Structural Systems: Asymmetric Configuration (A1)
In this case, the effects of asymmetric rigidity distribution on torsional
irregularity coefficients were examined. It was questioned that how they affect the
torsional irregularity coefficients despite the regular plan geometry. Besides, the effects
of overhangs on earthquake behaviour of structures were investigated depending on
their direction.
The models were chosen from the case I which has regular rigidity distribution
and plan geometry. Among the parametric models of case I, only the square plan
geometry consisting shear-frame systems (Ic 20x20, Id 20x20, Ie 20x20 and If 20x20)
was chosen in order to discuss the effects of torsional irregularity. All models are
accepted as having 20 stories with 2.80 m in height. The dimension of the overhang is
1.50 m. Square plan geometry was chosen due to its better seismic performance under
earthquake loads than rectangular plan geometry. It shows the same inertia forces
against the earthquake loads that come from any earthquake direction. In these models,
the shear walls which are placed at the 1 axis are removed.
Apart from the mentioned models above, the model Ic 20x20 was chosen and
designed as having closed one-sided overhang denoted as IIe, asymmetric two-sided
overhang denoted as IIf, symmetric two sided overhang denoted as IIg, three-sided
overhang denoted as IIh, and four-sided overhang denoted as IIi (Figure 5.7). In this
way, the effects of overhangs were taken into consideration in the earthquake analysis.
The parametric model Ic 20x 20 was chosen due to the its best earthquake behaviour. It
was investigated that how overhangs can change the earthquake behaviour.

123
a) IIa
b) IIb
c) IIc
Figure 5.7. Structural plans of parametric models in case II
(Cont. on next page)
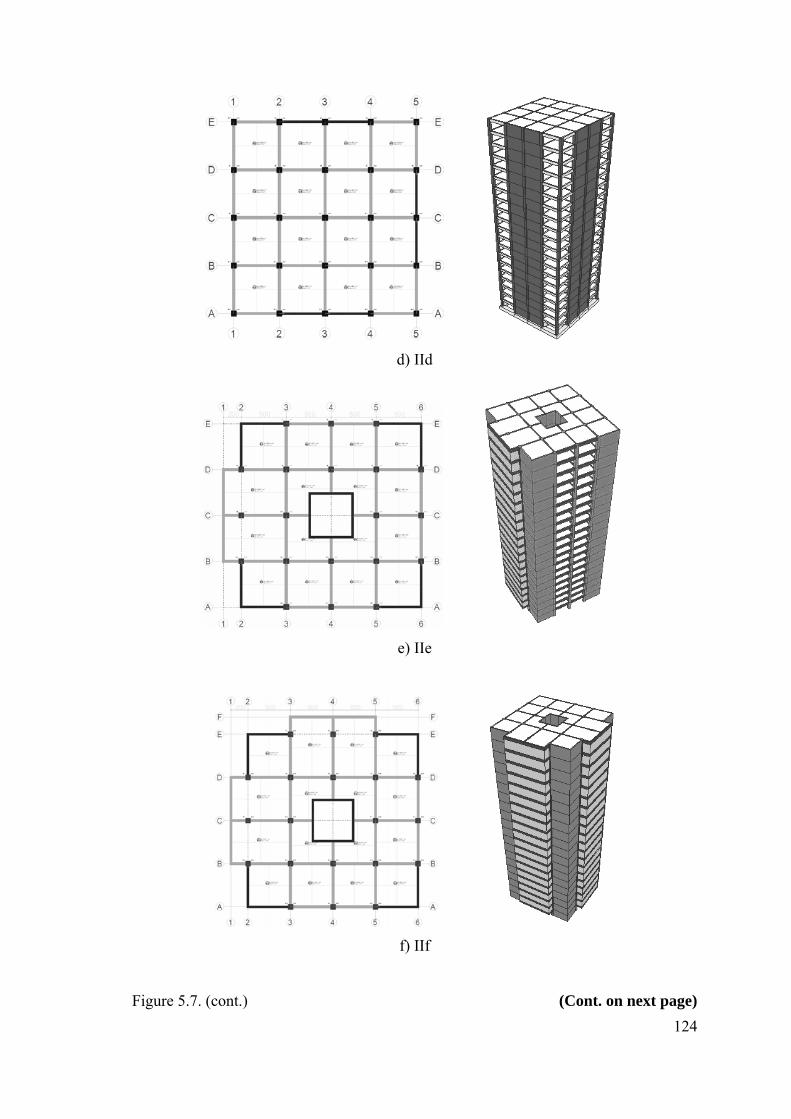
124
d) IId
e) IIe
f) IIf
Figure 5.7. (cont.) (Cont. on next page)
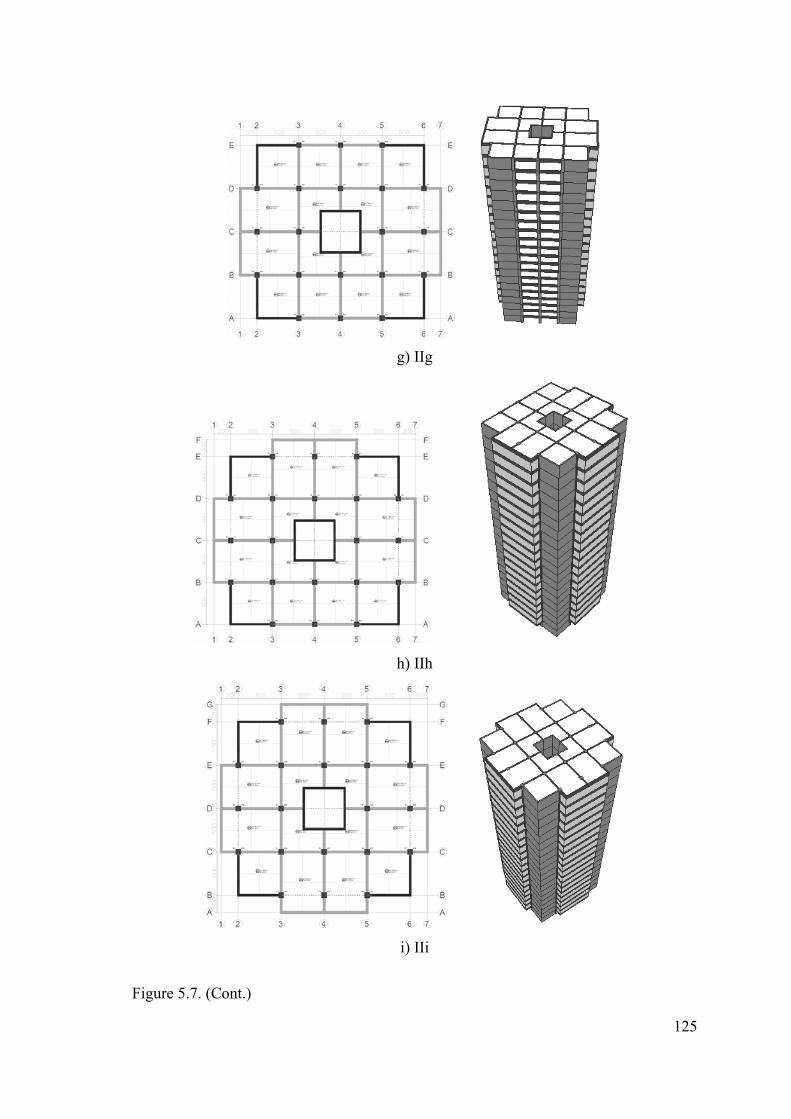
125
g) IIg
h) IIh
i) IIi
Figure 5.7. (Cont.)

126
5.2.1. Discussion and Results of Case II
A set of 9 models, 4 of which had irregular rigidity distribution and 5 of which
had different sided overhangs were analyzed during the case II. The case focused on
two main aims. The first one was to research the effects of irregular rigidity distribution
on torsional irregularity coefficient despite the simple and symmetric plan geometry.
The second one was to evaluate the effects of overhangs on torsional irregularity. The
changes in the torsional irregularity coefficient were examined for the same plan
geometry and different R/C structural configuration. On the basis of the attained results
of numerical analysis in case II the following conclusions could be drawn up: (Table
5.8)
• The models which have regular rigidity distribution show lower torsional
coefficients than the models which have irregular rigidity distribution.
• Torsional irregularity coefficients get very high level on irregular structures
in terms of rigidity distribution.
• While there is not observed any torsional irregularity in all models which
have regular rigidity distribution, On the other hand, there is torsional
irregularity in all models which have irregular rigidity distribution.
• The structure shows favorable results against earthquake loads coming from
symmetry direction of the structure rather than the earthquake loads coming
from asymmetry direction. For instance, the earthquake direction of Y is the
unfavorable direction for the models of IIa, IIb, IIc, and IId.
• Shear walls should be positioned symmetrically in order to provide similar
rigidity distribution on both earthquake directions.
• The locations of shear walls affect the torsional irregularity coefficient
although both of the structure have similar rigidity rate. For instance, while
the model of IIa has a value of 1.61 torsional irregularity coefficients, the
model of IId has a value of 2.65 torsional irregularity coefficients. There is a
great difference between the two models in the torsional irregularity
coefficients although they have similar rigidity rate.
• The lowest torsional coefficient was observed in model Ic 20x20 which have
regular rigidity distribution. On the other hand, the highest torsional

127
irregularity coefficient was observed in model IId. Because, it has lower and
irregular rigidity rate due to the asymmetrical distribution.
• It is attained from the analysis that regular rigidity distribution has a
significant role on the torsional irregularity coefficient rather than the simple
plan geometry.
• The building mass is proportional with earthquake loads. If overhangs added
to the structure, the buildings mass increase. Therefore, it can be asserted
that heavier buildings are exposed to greater earthquake loads than lighter
buildings during the same earthquake.
• Overhang direction is quite important in terms of torsional irregularity
coefficient. The minimum torsional irregularity coefficient among the
models having overhangs was observed in model IIg which have two-sided
symmetrical overhangs.
• The model IIe has lower building mass than IIg. However, it is symmetric
according to only one axis. For this reason, it has higher torsional
irregularity coefficient than the model IIg.
• The model IIf expose to higher torsional irregularity coefficient than the
model IIg although they both have two-sided overhangs. Because, the model
IIf has asymmetrical overhangs.
• The model IIi has four-sided overhangs. It is symmetrical according to the
both earthquake direction. Therefore, it has lower torsional irregularity
coefficients than the models having asymmetrical overhangs.
• The maximum torsional irregularity was observed in model IIh. Because it
has both high building mass and asymmetrical three-sided overhangs.
• It is noticed from the analysis that there is no torsional irregularity in models
of IIg and IIi which are symmetrical according to the both X and Y
earthquake direction. On the other hand, there exists torsional irregularity in
the models which have asymmetrical overhangs. The interaction between the
direction of overhangs in terms of symmetry and building mass has a
significant role on the torsional irregularity.

128
Table 5.8. Analysis results of case II
Irregular rigidity distribution Regular rigidity distribution Overhangs
Storey IIa IIb IIc IId Ic 20x20 Id 20x20 Ie 20x20 If 20x20 IIe IIf IIg IIh IIi 19 1.61 2.33 2.43 2.65 1.07 1.12 1.09 1.15 1.22 1.26 1.12 1.30 1.17 18 1.43 1.71 1.96 2.43 1.07 1.12 1.09 1.15 1.21 1.25 1.12 1.28 1.17 17 1.40 1.62 1.82 2.32 1.08 1.12 1.09 1.14 1.21 1.25 1.12 1.28 1.17 16 1.35 1.46 1.49 1.57 1.08 1.12 1.09 1.14 1.20 1.23 1.12 1.26 1.17 15 1.26 1.37 1.31 1.43 1.08 1.12 1.09 1.13 1.20 1.23 1.12 1.26 1.17 14 1.26 1.36 1.31 1.41 1.08 1.12 1.09 1.13 1.20 1.22 1.12 1.25 1.17 13 1.27 1.35 1.31 1.39 1.08 1.12 1.09 1.13 1.20 1.22 1.12 1.25 1.17 12 1.27 1.34 1.30 1.38 1.08 1.12 1.09 1.12 1.19 1.22 1.12 1.25 1.17 11 1.27 1.33 1.30 1.36 1.08 1.12 1.09 1.12 1.19 1.22 1.13 1.24 1.16 10 1.27 1.32 1.30 1.34 1.08 1.11 1.09 1.12 1.19 1.21 1.13 1.24 1.16 9 1.27 1.30 1.30 1.32 1.09 1.11 1.09 1.11 1.19 1.21 1.13 1.23 1.16 8 1.26 1.29 1.29 1.30 1.09 1.11 1.08 1.11 1.19 1.21 1.13 1.23 1.16 7 1.26 1.28 1.28 1.28 1.09 1.11 1.08 1.11 1.19 1.21 1.13 1.23 1.16 6 1.25 1.26 1.27 1.26 1.09 1.11 1.08 1.11 1.18 1.20 1.13 1.22 1.16 5 1.25 1.24 1.25 1.23 1.09 1.11 1.08 1.10 1.18 1.20 1.13 1.22 1.16 4 1.23 1.22 1.22 1.20 1.09 1.11 1.08 1.10 1.18 1.19 1.13 1.21 1.15 3 1.22 1.20 1.19 1.16 1.09 1.11 1.08 1.10 1.17 1.19 1.13 1.20 1.15 2 1.19 1.17 1.14 1.11 1.09 1.10 1.08 1.09 1.17 1.18 1.13 1.20 1.15 1 1.16 1.13 1.07 1.05 1.09 1.10 1.08 1.09 1.16 1.17 1.13 1.19 1.15
Ground 1.09 1.06 1.04 1.03 1.09 1.10 1.07 1.08 1.15 1.16 1.12 1.17 1.14
128

129
5.3. Case III: Floor Discontinuity (A2)
In this case, TEC (2007) has been studied in terms of floor discontinuity (A2).
The effect of A2 irregularity condition is examined according to the variety in the floor
space rate and different location of shear walls. It is essential to understand the simple
idealized mathematical model for understanding the behavior of a real complex building
against earthquake loads.
The case consists of 9 main models and with sub-models it totally composes of
72 models. The parametric models comprise of both low-storied R/C structure such as
three-storied, five- storied, eight-storied and multi-storied R/C structure such as ten-
storied, twelve-storied, fifteen-storied and twenty-storied buildings.
The plan has 4 bays with 5 m span in both directions. Floors consist of R/C slabs
of 0.15 m in thickness, except the floor openings which are differently placed to the
floors to represent the effect of the gallery space, stairs and elevator in the building.
Floor heights are taken as 2.8 m at all floors although in Turkey the bottom floors are
typically used as shops having high storey height. In this way, it is aimed to only
compare the effects of A2 floor discontinuity by holding constant the other variables as
possible. The building is assumed to be in the first degree earthquake zone and located
in the Z2 soil class defined in the TEC (2007) (Table 4.2 & Table 4.3). The structural
elements in parametric models of case 3 are designed by using C25 class concrete and
S420 class steel described in the TS-500 standard. The project and TEC (2007)
parameters of the models are given in detail at the beginning of Chapter 5 (Table 5.1).
All models were examined according to the comparison criteria of structural
irregularities described in Chapter 3 and 4. These are listed as structural irregularity
coefficients such as torsional irregularity coefficient and soft storey coefficient,
effective storey drifts, interstorey drifts and second order effects.
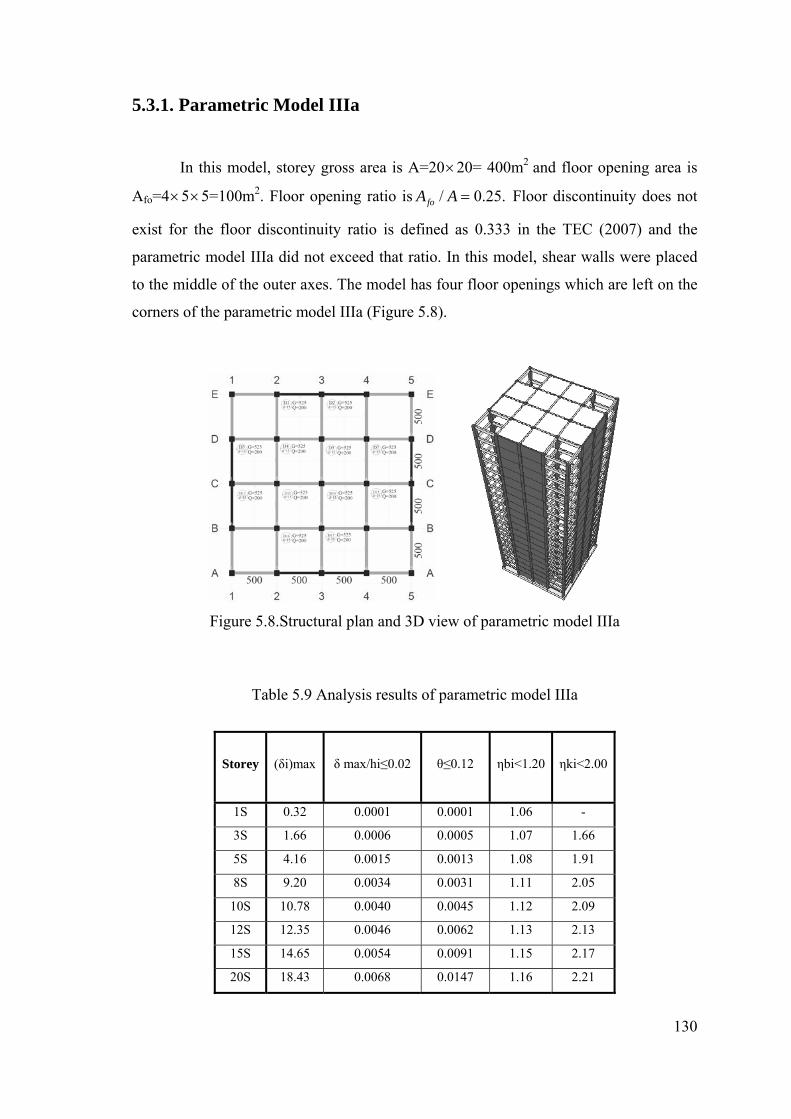
130
5.3.1. Parametric Model IIIa
In this model, storey gross area is A=20×20= 400m2 and floor opening area is
Afo=4×5×5=100m2. Floor opening ratio is .25.0/ =AAfo Floor discontinuity does not
exist for the floor discontinuity ratio is defined as 0.333 in the TEC (2007) and the
parametric model IIIa did not exceed that ratio. In this model, shear walls were placed
to the middle of the outer axes. The model has four floor openings which are left on the
corners of the parametric model IIIa (Figure 5.8).
Figure 5.8.Structural plan and 3D view of parametric model IIIa
Table 5.9 Analysis results of parametric model IIIa
Storey
(δi)max
δ max/hi≤0.02 θ≤0.12
ηbi<1.20 ηki<2.00
1S 0.32 0.0001 0.0001 1.06 -
3S 1.66 0.0006 0.0005 1.07 1.66
5S 4.16 0.0015 0.0013 1.08 1.91
8S 9.20 0.0034 0.0031 1.11 2.05
10S 10.78 0.0040 0.0045 1.12 2.09
12S 12.35 0.0046 0.0062 1.13 2.13
15S 14.65 0.0054 0.0091 1.15 2.17
20S 18.43 0.0068 0.0147 1.16 2.21

131
Based on the earthquake analysis report, maximum value of effective storey drift
in parametric model IIIa is obtained between 0.32 and 18.43mm. The limit values in
terms of interstorey drifts and second order effect have not been exceeded. All that
coefficients gradually increase from one storey structure to twenty storey structure.
Moreover, they evenly increase for each storey of the parametric models of IIIa (Table
5.9).
Following the analysis, it is observed that the most negative torsional
irregularity coefficient (ηbi) is 1.16 in twenty storey sub model of IIIa. Therefore, the
torsional irregularity coefficient is under the limit value of 1.20. For this reason, there is
no torsional irregularity in sub models of parametric model IIIa. It is inferred from the
analysis that the maximum torsional irregularity coefficient will gradually increase from
one storey model to twenty storey model. Besides, it takes greater coefficients toward
upper floors within the own stories of each sub models of IIIa.
Stiffness irregularity coefficient or soft storey irregularity coefficient (ηki) shows
considerable value range in parametric models of IIIa. The range varies between 1.66
and 2.21 from three storey building to twenty storey building. There is an available soft
storey coefficient in the three storey and five storey sub models of IIIa because the limit
value for soft storey irregularity coefficient, 2.0 defined in the TEC (2007) has not been
exceeded. It began to be exceeded in eight storey parametric model of IIIa and gradually
increase toward twenty storey sub model of IIIa. The most critical soft storey coefficient
is calculated as 2.21 in twenty storey sub model of IIIa. Moreover, it was usually
observed on the first and second storey of each parametric model of IIIa.
Stiffness irregularity coefficient is the ratio of average storey drifts to the
average storey drift at the storey above or below. When this two ratio is compared it is
observed that stiffness irregularity coefficient has higher values based on the calculation
with below than the ratio above storey. For instance, although the most critical soft
storey coefficient created by the ratio with below storey is calculated as 2.21, the soft
storey coefficient created by the ratio with above is calculated under the limit value of
2.00.

132
5.3.2. Parametric Model IIIb
In this model, storey gross area, floor opening area and the location of the floor
opening area are kept as the same size with the parametric model of IIIa. Floor opening
area is preserved as 25%. The only difference created in the model is to change the
location of the shear walls. The shear walls are removed from the middle of the A-A, E-
E, 1-1 and 5-5 axes to the corners of the structure where the floor openings are placed
(Figure 5.9). Floor discontinuity (A2) does not exist in the model because floor
discontinuity ratio did not exceed the coefficient of 0.333 defined in the TEC (2007).
Figure 5.9 Structural plan and 3D view of parametric model IIIb
Table 5.10 Analysis result of parametric model IIIb
Storey
(δi)max
δ max/hi≤0.02 θ≤0.12
ηbi<1.20 ηki<2.00
1S 1.63 0.0006 0.0005 1.13 -
3S 5.97 0.0022 0.0018 1.14 1.50
5S 11.31 0.0042 0.0038 1.13 1.66
8S 14.90 0.0055 0.0068 1.13 1.62
10S 16.13 0.0060 0.0088 1.13 1.54
12S 17.07 0.0063 0.0108 1.13 1.55
15S 18.24 0.0068 0.0139 1.13 1.57
20S 19.97 0.0074 0.0196 1.13 1.58

133
Depending on the earthquake analysis report, the maximum value of effective
storey drift in parametric model IIIb is obtained a value range between 1.63 and 19.97
mm. The limit values in terms of interstorey drifts and second order effect have not
been exceeded defined in the TEC (2007). These values gradually increase from one
storey structure up to twenty storey structure.
The maximum torsional irregularity coefficients (ηbi) in parametric model IIIb is
obtained as 1.14. It is less than the limit value of 1.20. For that reason, there is no
torsional irregularity in sub models of IIIb. Additionally, it is realized that if the storey
number of the parametric model of IIIb increase, the maximum torsional irregularity
coefficient will increase in each different storied sub models of IIIb (Table 5.10).
Stiffness irregularity coefficient or soft storey irregularity coefficient (ηki) shows
normal ranges in parametric models of IIIb. The range varies between 1.50 and 1.62
from three storey building to twenty storey building. There is a favorable soft storey
coefficient in all sub models of IIIb, for the limit value of 2.00 defined in the TEC
(2007) has not been exceeded. The highest soft storey coefficient is calculated as 1.66 in
five storeyed parametric model of IIIb. There is not a balanced increase or decrease in
the maximum soft storey coefficient among sub models of IIIb.
The stiffness irregularity coefficient takes higher values for the calculation by
above storey than the below storey. The maximum soft storey coefficient calculated
with below storey is 1.45 in five storey parametric model of IIIb. The highest
coefficient is 1.66. It is under the limit coefficient of 2.00.Consequently, there is no soft
storey irregularity.
5.3.3. Parametric Model IIIc
In this model, the location of the shear walls is designed as similar with the
parametric model IIIa. Different from the parametric model IIIa, a rigid core is joined to
the center of the structure in parametric model IIIc (Figure 5.10). This naturally leads to
an increase in the floor opening area. Storey gross area is kept as the same size with
other models. Floor opening area increases from 25% to 31%. Because, the floor
opening ratio is 31.0400/125/0 ==AAf . However, this increase does not cause floor
discontinuity (A2), for floor discontinuity ratio did not exceed the coefficient of 0.333
defined in the TEC (2007).

134
Figure 5.10.Structural plan and 3D view of parametric model IIIc
Table 5.11. Analysis results of parametric model IIIc
Storey
(δi)max
δ max/hi≤0.02 θ≤0.12
ηbi<1.20 ηki<2.00
1S 0.24 0.0001 0.0001 1.08 -
3S 0.49 0.0005 0.0004 1.09 1.67
5S 3.39 0.0013 0.0010 1.10 1.95
8S 8.07 0.0030 0.0026 1.11 2.11
10S 10.13 0.0038 0.0039 1.12 2.17
12S 11.75 0.0044 0.0055 1.13 2.21
15S 14.20 0.0053 0.0083 1.13 2.25
20S 18.46 0.0068 0.0141 1.13 2.30
Following the analysis, the maximum value of effective storey drift in
parametric model IIIc is obtained between 0.24 and 18.46 mm. The limit values in terms
of interstorey drifts and second order effect have not been exceeded. All that values
gradually increase from one storey structure to twenty storey structure (Table 5.11).
The unfavorable torsional irregularity coefficient is noticed as 1.13 in parametric
model IIIc. It is under the limit value of 1.20. As a result, there is no torsional
irregularity in parametric model IIIc. Furthermore, it is realized that if the number of
storey in parametric model IIIc increase, the maximum torsional irregularity coefficient
will gradually increase in each different storied sub models of IIIc. Besides, it increases

135
from ground floor to upper floors within the own stories of each different storied sub
models of parametric model IIIc.
Stiffness irregularity coefficient or soft storey irregularity coefficient (ηki) shows
considerable coefficients in parametric model IIIc. There is a value range between 1.67
and 2.30 from three storey building to twenty storey building. There is an agreeable soft
storey coefficient in three storey and five storey sub models of IIIc since the limit value
for soft storey irregularity, 2.00 defined in the TEC (2007) has not been transcended. It
begins to be exceeded in eight storey sub model of IIIc and gradually increase towards
twenty storey sub model of IIIc. The most critical soft storey coefficient is calculated as
2.30 in twenty storey sub model of IIIc.
The stiffness irregularity coefficients depending on the below storey take higher
values as compared with above storey. Based on the soft storey checks, it is noticed that
while the parametric model IIIc have soft storey according to the calculation with below
storey, there is no soft storey calculated with above storey. Moreover, the soft storey
irregularity is discovered on the first storey in sub models of IIIc which have soft storey
irregularity. Additionally, it is realized that if the storey number of the parametric model
of IIIc increase, the maximum soft storey coefficient will gradually increase in each
different storied sub models of IIIc.
5.3.4. Parametric Model IIId
In parametric model IIId, the shear walls are placed on the corners of the model
as in parametric model IIIb. As distinct from the parametric model IIIb, a rigid core is
added to the center of the structure (Figure 5.11). This application does not naturally
cause any change in the floor opening area as it is compared with the model IIIc. It has a
value of 31 % floor opening area which does not cause floor discontinuity. Storey gross
area has same size with other models.

136
Figure 5.11.Structural plan and 3D view of parametric model IIId
Tablo 5.12. Analysis results of parametric model IIId
Storey
(δi)max
δ max/hi≤0.02 θ≤0.12
ηbi<1.20 ηki<2.00
1S 0.63 0.0002 0.0001 1.35 -
3S 2.62 0.0010 0.0007 1.31 1.54
5S 5.66 0.0021 0.0017 1.29 1.75
8S 10.83 0.0040 0.0036 1.28 1.87
10S 12.38 0.0046 0.0053 1.27 1.92
12S 13.83 0.0051 0.0071 1.26 1.95
15S 15.96 0.0059 0.0102 1.26 1.99
20S 19.50 0.0072 0.0162 1.25 2.03
Concerning on the earthquake analysis, the maximum value of effective storey
drift in parametric model IIId is obtained between 0.63 and 19.50 mm. The limit values
in terms of interstorey drifts and second order effect have not been exceeded. These
values gradually increase from one storey structure to twenty storey structure.
The most critic torsional irregularity coefficient is found as 1.35 in one storey
sub model of IIId. It transcends the limit value of 1.20. Therefore, there is torsional
irregularity in parametric model IIId. Moreover, it is observed that if the number of
storey in parametric model IIId increase, the maximum torsional irregularity coefficient
137
will gradually decrease from one storey sub model IIId to twenty storey sub model of
IIId
Stiffness irregularity coefficient (ηki) shows significant value ranges in
parametric model IIId. The range varies between 1.54 and 2.03 from three storey sub
models to twenty storey sub models. The soft storey coefficient is not exceeded the limit
value of 2.00 except twenty storey sub model of IIId. It is calculated as 2.03 in twenty
storey sub model of IIId. Moreover, it is noticed that the soft storey irregularity
observed in the first storey of twenty storey sub model of IIId. Besides, it gradually
increases towards twenty storey sub models of IIId.
The calculations for the stiffness irregularity made with above storey show
lower soft storey coefficients than the calculations with below storey. They take values
which are under the limit value of 2.00. The highest soft storey coefficient calculated
with above storey is 1.14. Besides, it is observed that if the number of storey in
parametric model IIId increase, the maximum soft storey coefficient will gradually
increase towards upper floors. On the other hand, it gradually decreases toward upper
floors within the own stories of each different storied sub models of IIId (Table 5.12).
5.3.5 Parametric Model IIIe
In this model, the locations of shear walls are designed as parametric model IIIa.
Apart from parametric model IIIa, floor openings are placed in front of the shear walls
which are located in the middle of the outer axes of the structure in parametric model
IIIe. It is shown in Figure 5.12. The rate of floor opening area is increased from 25 % to
50 %. This condition creates floor discontinuity in the parametric model because the
limit value for floor discontinuity defined in the TEC (2007) as 33% is exceeded.
Excessive openings in the floors are left in this model. Through this model, the effects
of floor openings rate to the A2 irregularity are investigated. Storey gross area is kept as
same size with other models.
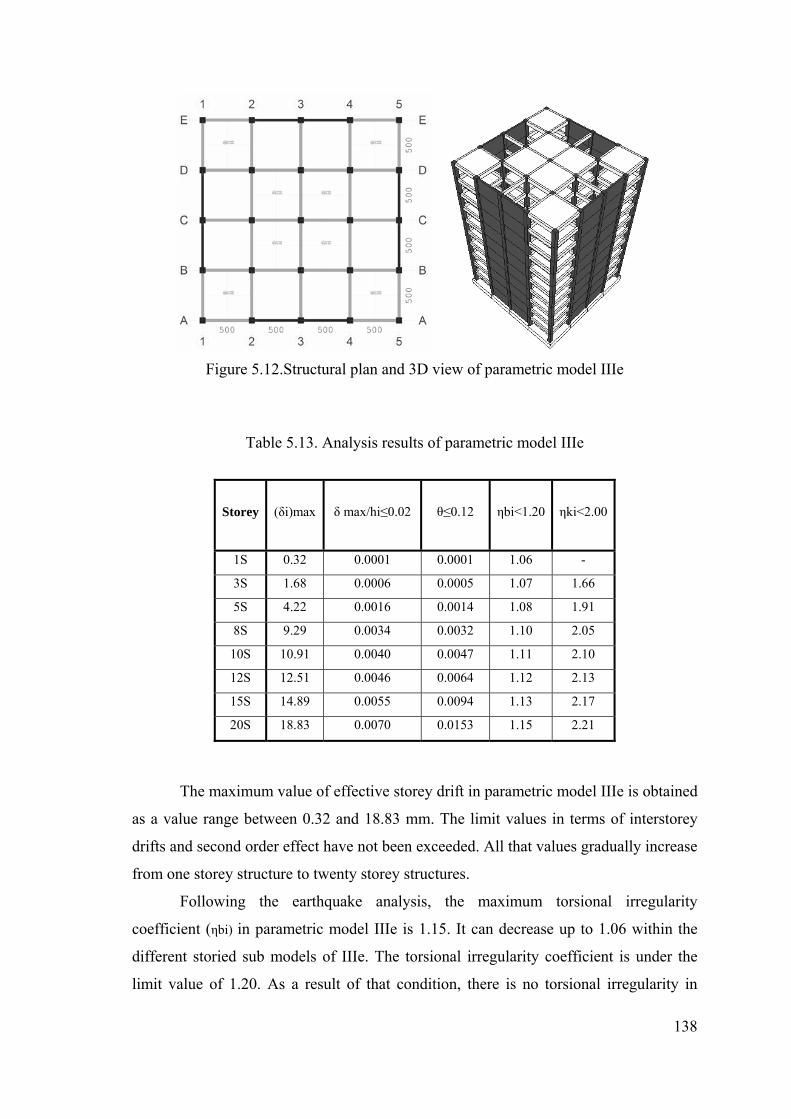
138
Figure 5.12.Structural plan and 3D view of parametric model IIIe
Table 5.13. Analysis results of parametric model IIIe
Storey
(δi)max
δ max/hi≤0.02 θ≤0.12
ηbi<1.20 ηki<2.00
1S 0.32 0.0001 0.0001 1.06 -
3S 1.68 0.0006 0.0005 1.07 1.66
5S 4.22 0.0016 0.0014 1.08 1.91
8S 9.29 0.0034 0.0032 1.10 2.05
10S 10.91 0.0040 0.0047 1.11 2.10
12S 12.51 0.0046 0.0064 1.12 2.13
15S 14.89 0.0055 0.0094 1.13 2.17
20S 18.83 0.0070 0.0153 1.15 2.21
The maximum value of effective storey drift in parametric model IIIe is obtained
as a value range between 0.32 and 18.83 mm. The limit values in terms of interstorey
drifts and second order effect have not been exceeded. All that values gradually increase
from one storey structure to twenty storey structures.
Following the earthquake analysis, the maximum torsional irregularity
coefficient (ηbi) in parametric model IIIe is 1.15. It can decrease up to 1.06 within the
different storied sub models of IIIe. The torsional irregularity coefficient is under the
limit value of 1.20. As a result of that condition, there is no torsional irregularity in

139
parametric model IIIe. Moreover, it is observed that if the number storey in parametric
model of IIIe increases, the maximum torsional irregularity coefficient will gradually
increase in each different storied sub models of IIIe. Besides, it increases toward upper
floors within the own stories of each different storied parametric models of IIIe. It is
listed in Table 5.13.
Soft storey irregularity coefficient (ηki) shows large ranges in parametric model
IIIe. The range varies between 1.66 and 2.21 from three storey models to twenty storey
models. There is a favorable soft storey coefficient in three storey and five storey sub
models of IIIe. However, it starts taking high soft storey irregularity coefficients in eight
storeyed sub model of IIIe, which exceeds the limit value of 2.00 for the soft storey
irregularity. The most crucial coefficient for the soft storey irregularity is calculated as
2.21 in twenty storey sub model of IIIe.
Based on the analysis, the stiffness irregularity coefficient takes higher values
with the calculation made by above storey than the below storey. The soft storey
coefficient created by the ratio with above is calculated under the limit value of 2.00.
The maximum soft storey coefficient calculated with above storey is 1.08. However,
there is soft storey irregularity in the model due to the significant coefficients taken
from the calculations with below storey. It supports the view that, while the parametric
model IIIe have soft storey calculated by the ratio with below storey, there is no soft
storey calculated with above storey. Moreover, the soft storey irregularity is observed
on the first storey in models having soft storey irregularity. Additionally, it is concluded
that if the number of storey in parametric model IIIe increase, the maximum soft storey
irregularity coefficient will gradually increase from one storey model to twenty storey
model. On the other hand, it gradually decreases from ground floor to upper floor within
the own stories of each different storied sub models of IIIe.
5.3.6. Parametric Model IIIf
In this model, the locations of shear walls are placed on the corners of the model
as in parametric model IIIb. Apart from the parametric model IIIb, the floor opening
area is placed on the center of the model with the same floor opening ratio of 25%
(Figure 5.13). It is under the limited value of 0.33. Therefore, the parametric model IIIf
does not include the irregularity of floor discontinuity defined in the TEC (2007). The

140
aim of this parametric model is to examine the effects of a central floor opening to the
floor discontinuity. Therefore, the floor opening rate is preserved as 25%. Storey gross
area is kept as the same size with other models.
Figure 5.13.Structural plan and 3D view of parametric model IIIf
Tablo 5.14. Analysis results of parametric model IIIf
Storey
(δi)max
δ max/hi≤0.02 θ≤0.12
ηbi<1.20 ηki<2.00
1S 0.29 0.0001 0.0001 1.06 -
3S 1.46 0.0005 0.0005 1.07 1.62
5S 3.70 0.0014 0.0012 1.08 1.88
8S 8.35 0.0031 0.0028 1.09 2.02
10S 10.06 0.0037 0.0041 1.10 2.08
12S 11.46 0.0042 0.0057 1.10 2.11
15S 13.60 0.0050 0.0084 1.10 2.15
20S 17.19 0.0064 0.0138 1.08 2.20
According to the analysis report shown in Table 5.14, the maximum value of
effective storey drift in parametric model IIIf is obtained between 0.29 and 17.19 mm.
The limit values in terms of interstorey drifts and second order effect have not been

141
exceeded. All that values gradually increase from one storey structure up to twenty
storey structures.
The highest torsional irregularity value is 1.10 in parametric model IIIf. It is
under the limit value of 1.20. Therefore, there is no torsional irregularity in parametric
model IIIf. Moreover, it is realized that an increase in the number of storey of
parametric model IIIf affects negatively the torsional irregularity coefficients. It
increases from one storey model to twenty storey model. On the other hand, the
torsional irregularity coefficients gradually increase towards upper floors within each
different storied sub models of parametric model IIIf (Table 5.14).
Stiffness irregularity coefficient (ηki) shows large value ranges in parametric
model IIIf. The range varies between 1.62 and 2.20 from three storey building to twenty
storey building. There is a favorable soft storey irregularity coefficient in three storey
and five storey parametric models of IIIf because the limit value of 2.00 has not been
transcended. It begins passing the limit value in eight storey sub model IIIf and
gradually increase up to twenty storey sub models of IIIf. The most critical soft storey
coefficient is calculated as 2.20 on the first storey of a twenty storey sub model of IIIf.
Based on the analysis report shown in Table 5.14, the stiffness irregularity
coefficient takes higher values for the calculation by below storey than the above storey.
The maximum soft storey irregularity coefficient calculated with above storey is 1.08.
Moreover, the soft storey irregularity is observed on the first storey of twenty storey sub
model of IIIf. It can be concluded that if the number of storey in parametric model IIIf
increase, the maximum soft storey irregularity coefficient will gradually increase in
each different storied sub models of IIIf. On the other hand, it gradually decreases
toward upper floors in each different storied sub models of IIIf.
5.3.7. Parametric Model IIIg
In this model, shear walls are placed in the middle of the outer axes of the model
as in parametric model IIIa. Apart from the parametric model IIIa, floor opening area is
placed on the center of the model with the same floor opening ratio of 25%. It is
illustrated in Figure 5.14. Hence, the parametric model IIIg does not involve the

142
irregularity of floor discontinuity defined in the TEC (2007). Storey gross area is kept as
the same size with other models.
Figure 5.14.Structural plan and 3D view of parametric model IIIg
Table 5.15. Analysis results of parametric model IIIg
Storey
(δi)max
δ max/hi≤0.02 θ≤0.12
ηbi<1.20 ηki<2.00
1S 0.32 0.0001 0.0001 1.06 -
3S 1.63 0.0006 0.0005 1.07 1.65
5S 4.06 0.0015 0.0013 1.08 1.90
8S 9.08 0.0034 0.0030 1.10 2.04
10S 10.67 0.0040 0.0045 1.11 2.09
12S 12.24 0.0045 0.0062 1.12 2.13
15S 14.57 0.0054 0.0091 1.13 2.17
20S 18.45 0.0068 0.0148 1.14 2.21
The maximum value of effective storey drift in parametric model IIIg is
obtained as a range between 0.32 and 18.45 mm. The limit values in terms of interstorey
drifts and second order effect have not been exceeded. These values gradually increase
from one storey model up to twenty storey models.

143
Following the earthquake analysis, the maximum torsional irregularity
coefficient (ηbi) is noticed as 1.14 in twenty storey sub model of IIIg. It is under the
limit value of 1.20. Therefore, there is no torsional irregularity in the parametric model
IIIg. Moreover, it is realized that if the number of storey in parametric model IIIg
increase, the maximum torsional irregularity coefficient will gradually increase towards
twenty storey sub model of IIIg. Besides, the torsional irregularity coefficient gradually
increase from the ground floor to upper floors within the own stories of each different
storied sub models of IIIg (Table 5.15).
Soft storey irregularity coefficients (ηki) show a large value range between 1.65
and 2.21 from three storey building to twenty storey building. There is an available soft
storey irregularity coefficient in the three storey and five storey sub models of IIIg
because the limit value of 2.00 has not been exceeded. It starts passing the limit
coefficient in eight storey sub model of IIIg and gradually increase up to twenty storey
sub models of IIIg. The most critical soft storey irregularity coefficient is calculated as
2.21 in twenty storey sub model of IIIg.
The soft storey calculations which depend on below storey show higher
irregularity coefficients than the calculations depending on above storey. The maximum
soft storey coefficient calculated with above storey is 1.08. As a result of soft storey
irregularity checks, it is realized that while the parametric model IIIg has soft storey
irregularity calculated by the ratio with below storey, there is no soft storey calculated
with above storey. Moreover, the soft storey irregularity is noticed on the first storey in
sub models of IIIg which have soft storey irregularity.
5.3.8. Parametric Model IIIh
In this model, the shear walls are located on similar parts of the model with
parametric model IIIa and IIIe. Floor opening area is same with IIIa as 0.25 %. Apart
from the parametric model IIIa and IIIe, floor openings are placed asymmetrically to the
model (Figure 5.15). However, the model does not have floor discontinuity because the
limit floor discontinuity coefficient is under the defined coefficient. The aim of this
model is to explore the effects of asymmetric floor openings to the earthquake
behaviour of structure. It is examined that despite the symmetric plan geometry, how

144
asymmetrical configuration of floor openings affects the earthquake behaviour of
structure. Storey gross area is kept as same size with other models.
Figure 5.15.Structural plan and 3D view of parametric model IIIh
Table 5.16. Analysis results of parametric model IIIh
Storey
(δi)max
δ max/hi≤0.02 θ≤0.12
ηbi<1.20 ηki<2.00
1S 0.71 0.0003 0.0002 1.19 -
3S 2.98 0.0011 0.0009 1.17 1.66
5S 5.91 0.0022 0.0020 1.15 1.90
8S 10.25 0.0038 0.0040 1.28 2.04
10S 12.17 0.0045 0.0057 1.53 2.09
12S 13.97 0.0052 0.0076 1.99 2.14
15S 16.47 0.0061 0.0109 2.10 2.21
20S 20.49 0.0076 0.0171 2.24 2.28
According to the earthquake analysis report, the maximum value of effective
storey drift in parametric model IIIh varies between 0.71 and 20.49 mm. The limit
values in terms of interstorey drifts and second order effect have not been exceeded. All
that values gradually increase from one storey model up to twenty storey model.

145
Based on the earthquake analysis report, the maximum torsional irregularity
coefficient (ηbi) is obtained as 2.24 in twenty storey sub model of IIIh. The limit value
of 1.20 is exceeded. Therefore, there is torsional irregularity in parametric model IIIh.
Furthermore, it is observed that if the number of storey in parametric model IIIh
increase, the maximum torsional irregularity coefficient will gradually increase in each
different storied sub models of IIIh.
Stiffness irregularity coefficient or soft storey irregularity coefficient (ηki) has a
large value ranges in sub models of IIIh. The range varies between 1.66 and 2.28 from
three storey structure to twenty storey structure. There is a favorable soft storey
irregularity coefficient in the three storey and five storey sub models of IIIh because the
limit value of 2.00 has not been exceeded. The most critical soft storey irregularity
coefficient is calculated as 2.28 in twenty storey sub model of IIIh (Table 5.16).
When the stiffness irregularity coefficients calculated by the storey above or
below are compared it is observed that stiffness irregularity coefficient has higher
values for the ratio below than the ratio above. The maximum soft storey coefficient
calculated with above storey is 1.08. Moreover, the soft storey irregularity is observed
on the first storey of each sub models of IIIh except one, three and five storey structure.
An increase in the number of stories cause increase in the soft storey irregularity
coefficients. Besides, soft storey irregularity coefficient gradually decreases towards
upper floors within the own stories of each different storied sub models of IIIh.
5.3.9. Parametric Model IIIi
In this model, the shear walls are designed on the corners of the structure as in
the parametric model IIIb and IIIf. Therefore, the floor opening area is 0.25 %. The
model does not have floor discontinuity because it is under the defined limit value. The
only difference between parametric model IIIh and IIIi is the positions of the shear
walls. (Figure 5.16). The interaction between the locations of floor openings and
structural elements are examined. Storey gross area is kept as same size with the others.

146
Figure 5.16. Structural plan and 3D view of parametric model IIIi
Tablo 5.17. Analysis result of parametric model IIIi
Storey
(δi)max
δ max/hi≤0.02 θ≤0.12
ηbi<1.20 ηki<2.00
1S 0.66 0.0002 0.0002 1.22 -
3S 2.67 0.0010 0.0008 1.19 1.56
5S 5.18 0.0019 0.0018 1.16 1.77
8S 11.02 0.0041 0.0037 1.63 1.82
10S 12.37 0.0046 0.0054 1.79 2.10
12S 14.02 0.0052 0.0072 2.00 2.18
15S 16.49 0.0061 0.0104 2.17 2.24
20S 20.69 0.0077 0.0167 2.28 2.31
Following the analysis, it is obtained that the maximum value of effective storey
drift in parametric model IIIi shows variety between 0.66 and 20.69 mm. The limit
values in terms of interstorey drifts and second order effect have not been transcended.
They gradually increase from one storey structure up to twenty storey structure.
Based on the analysis report shown in Table 5.17, it is realized that the
maximum torsional irregularity coefficient (ηbi) is obtained as 2.28 in twenty storey sub
model of IIIi. The limit value of 1.20 is exceeded. Excessive torsional irregularity is

147
noticed in parametric model IIIi. Moreover, it is realized that there is not a balanced
decrease or increase within the all sub models of IIIi. (Table 5.17).
Stiffness irregularity coefficient or soft storey irregularity coefficient (ηki) takes
a large value ranges in the sub models of IIIi. The range varies between 1.56 and 2.31
from three storey model to twenty storey model. There is a favorable soft storey
irregularity coefficient in three storey and five storey sub models of IIIi, for the limit
value of 2.00 has not been exceeded. It began to be exceeded in eight storey sub model
of IIIi. The most critical soft storey irregularity coefficient is calculated as 2.31 in
twenty storey sub model of IIIi.
When the stiffness irregularity coefficient calculated by the storey above or
below is compared it is observed that stiffness irregularity coefficient has higher values
for the ratio below than the ratio above. The maximum soft storey coefficient calculated
with above storey is gained as 1.14. For that reason, it is realized from the soft storey
checks that while the parametric model IIIi has soft storey irregularity calculated by the
ratio with below storey, there is no soft storey irregularity calculated with above storey.
Moreover, the soft storey irregularity is observed on the first and second storey of the
sub models of IIIi except three storey and five storey sub models of IIIi. Furthermore, it
is observed that the maximum soft storey irregularity coefficient gradually increase
from one storey structure to twenty storey structure.
With this type of configuration, the structure behaves like a complex structure
against earthquake loads despite the symmetrical plan geometry and symmetrical
configuration of columns and shear walls. Consequently it can be said that asymmetrical
configurations of floor openings cause excessive changes in coefficients which
describes the earthquake behaviour of structures. When the last two models (IIIh and
IIIi) which have asymmetrical floor openings are compared with the other models in
case III, it is noticed that these two models expose to higher earthquake forces and
shows significant irregularity coefficients than the other models. This demonstrates that
symmetry in both horizontal and vertical direction supports to regularity in earthquake
behaviour of structures.

148
5.3.10. Discussion and Results of Case III
A set of 9 models, 8 of which had no A2 floor discontinuity and 1 of which had
floor discontinuity were analyzed during the case III. The aim of this case was to verify
that location of the floor openings in the floors has primary importance rather than the
amount of the floor openings. In the TEC (2007), a limit value of 0.33 was given for the
floor discontinuity irregularity. The models were created according to the basis
specified in Chapter 3 and 4. The results were evaluated according to the several criteria
containing torsional irregularity coefficient, soft storey coefficient, effective storey
drifts, interstorey drifts and second order effects. On the bases of the carried out
numerical analysis in Case III for the floor discontinuity, the following conclusions
could be drawn up:
• In the case of A2 irregularity exists in the structure, the structure shows
favorable results under earthquake loads coming from symmetry direction
of the structure rather than the earthquake loads coming from asymmetry
direction.
• The locations of shear walls and floor openings within the structure are
significant factors affecting the earthquake behavior of overall structure
rather than the amount of floor openings. The distribution of rigidity
according to the location of floor openings should be arranged properly.
• Despite the regular plan geometry, it is noticed that when the floor
openings were placed asymmetrically on the floors, the structure would fail
under the earthquake loads arrived from the weakest direction. Moreover, it
leads to a significant increase in the torsional irregularity coefficient. On
the other hand, a central floor opening in the structure provides better
earthquake behavior than the structures which are asymmetrically or
improperly arranged with shear walls.
• The location of shear walls and its interaction with floor openings have a
significant effect in terms of the earthquake behavior of the structure. For
instance, if the floor openings are placed symmetrically on the corners of
the structure, shear walls should be placed in the middle of the outer axis of
the structure (IIIa) instead of on the corners of the structure (IIIb) in order
to balance of the rigidity and support load distributions.

149
• Buildings having shear walls and buildings having shear walls and
additionally a central rigid core are evaluated in terms of A2 irregularity. It
is observed that shear walls should be placed distant from the centre of
gravity as far as if possible, towards to the exterior of the structure. For
instance, when the parametric model IIIb and IIId are compared, it is
observed that parametric model IIIb shows better earthquake behaviour
than the parametric model IIId. Because rigidity core cause increase in the
structural irregularity coefficient in parametric model IIId like in parametric
model IIIc.
• The changes in the location of shear walls are particularly effective on the
torsional irregularity coefficients. Therefore, it is inevitable that if the shear
walls are located asymmetrically, structure exposes to large earthquake
loads on the weakest direction. They should be positioned symmetrically to
provide similar rigidity on both earthquake directions.
• It is observed that if a structure has a central rigid core, additional shear
walls should be designed in the middle of the outer axes instead of the
corner of the structure to balance the rigidity.
• It is noticed that if the structure has a central floor opening, shear walls
should be positioned on the corners of the structure instead of in the middle
of the outer axis of the structure as in model IIIf.
• It is gained from the analysis that when the floor openings are placed
asymmetrically, the soft storey coefficients directly increase.
• If the floor openings area increases, the building mass decreases. However,
the floor openings placed asymmetrically in the structure, the building mass
accumulated in one side of the structure. Although building mass decrease,
the torsional irregularity occurs again in those structures.
• It is concluded from the case that location of the floor openings have a
significant role rather than the floor opening ratio. For this reason, there
should be made a sanction in the TEC (2007) where floor openings should
be left. Alternative solutions for different plan geometries and with
different arrangements of floor openings should be considered.

150
5.4. Case IV: Projection in Plan (A3)
This case consists of 5 parametric models. In this case, TEC (2007) has been
studied and the effects of A3 irregularities in other words excessive projection
dimensions which cause irregular plan geometry is examined according to the chosen
irregular plan geometry consisting L-shaped, H-shaped, T-shaped and U-shaped
models. These models are generated to have the same storey gross area with different
number of storey. Additionally, the sub model from parametric model Ia which is coded
as Ia20x20 is taken in order to compare its earthquake behaviour with the models in
case IV. Case IV consists of irregular plan geometries. However, the model which
coded as Ia20x20 has regular plan geometry owing to the square plan geometry.
The main aim of case IV is to compare the regular plan geometry and irregular
plan geometry in terms of earthquake behaviour on the basis of structural irregularities.
The structures are all designed consisting of frame system. All parametric models are
based on both low-storey R/C structure such as single-storey, three-storey, five-storey,
eight-storey and multi-storey R/C structure such as ten-storey, twelve-storey, fifteen-
storey and twenty-storey buildings. Moreover, all models have different projection
dimensions. The beam span on both directions is 5 meter. Floors consist of R/C slabs of
0.15m in thickness. Floor heights are taken as 2.8 m in all floors. In this way, it is aimed
to evaluate the effects of A3 or excessive projection in plan by minimizing the other
variables. The structure is assumed to be in the first degree earthquake zone and located
in Z2 soil class according to TEC (2007). The columns in all parametric models are
designed using C25 class concrete and S420 class steel described in the TS-500
standard.
5.4.1. Parametric Model IVa: L Form
In this model, storey gross area is 400m2 and the plan geometry of the structure
has been designed as frame system to have L-shaped plan geometry. Each beam span
has a length of 5 meter. A3 irregularity or projections in plan is described in the TEC
(2007) as the cases “where the projections in both of the two directions exceed the total
plan dimensions of the structure in the respective directions by more than 20%”. In L-
shaped parametric model, the plan geometry has the same projection dimensions in both

151
of the axes. The projection dimension is 15 meter and the total plan dimensions are 25
meter. A3 ratio in L-shaped parametric model is calculated as 60 %. A3 irregularity or
in other words excessive plan projection in both directions exists in the model, because
A3 irregularity coefficient is defined as 20 % in the TEC (2007) and the L-shaped
parametric model exceed that ratio. Moreover, it is not symmetrical according to any
horizontal or vertical axis. It has only a diagonal symmetry axis passing through the
intersection of 1-1 and A-A axis between 6-6 and F-F axis.
Figure 5.17. Structural plan and 3D view of parametric model IVa
According to the earthquake analysis report of structural irregularities, the
maximum value of effective storey drift in L-shaped parametric model is obtained
between 1.68 and 34.85 mm. The limit values in terms of interstorey drifts and second
order effect have not been exceeded defined in the TEC (2007). It is noticed that all that
values gradually increase from one storey model up to twenty storey sub model of IVa.
Based on the analysis, the torsional irregularity coefficient (ηbi) varies between
1.14 and 1.24 for the maximum torsional irregularity coefficients of L-shaped sub
models. The most critical value is noticed as 1.24 in twenty storey sub model. Thus, the
limit value of 1.20 is exceeded. Therefore, there is torsional irregularity in the L-shaped
parametric model. Moreover, it is observed that if the number of storey in L-shaped
parametric model increase, the maximum torsional irregularity coefficient will

152
gradually increase from one storey sub model to twenty storey sub model of L-shaped
parametric model (IVa). Additionally, the torsional irregularity coefficient gradually
increase from ground floor to upper floors within the own stories of each different
storied parametric models of L-shaped structure (Table 5.18).
Stiffness irregularity coefficient or soft storey irregularity coefficient (ηki) shows
normal ranges in the L-shaped parametric model. The range varies between 1.50 and
1.67. There is a favorable soft storey irregularity coefficient because the coefficients
remain under the limit coefficient of 2.00. The highest soft storey irregularity
coefficient is calculated as 1.67 in five storey sub model of L-shaped structure (IVa).
Moreover, the highest soft storey coefficient is observed on the first storey of the L-
shaped parametric model. Besides, it is realized that there is not a balanced decrease or
increase in the maximum soft storey coefficients and within the own stories of each
different storied sub models of L-shaped structure.
5.4.2. Parametric Model IVb: H Form
In this model, storey gross area is 400 m2 and the plan geometry of the structure
has been designed as frame system to have H-shaped plan geometry shown in Figure
5.18. Each beam span has a length of 5 meter. In H-shaped parametric model, the plan
geometry has 15 meter projection dimension on X-axis and there is not any projection
on Y-axis. For that reason, there is not a projection ratio on Y-axis. The total plan
dimensions are 35 meter on X-axis and 20 meter on Y-axis. A3 ratio in H-shaped
parametric model is calculated as approximately 43 % on X-axis. In results, there is A3
irregularity in the structure according to the X-axis because the projection dimension on
X-axis exceeds the limit ratio of 20 %. Furthermore, the H-shaped parametric model is
exactly symmetrical both X and Y earthquake direction.
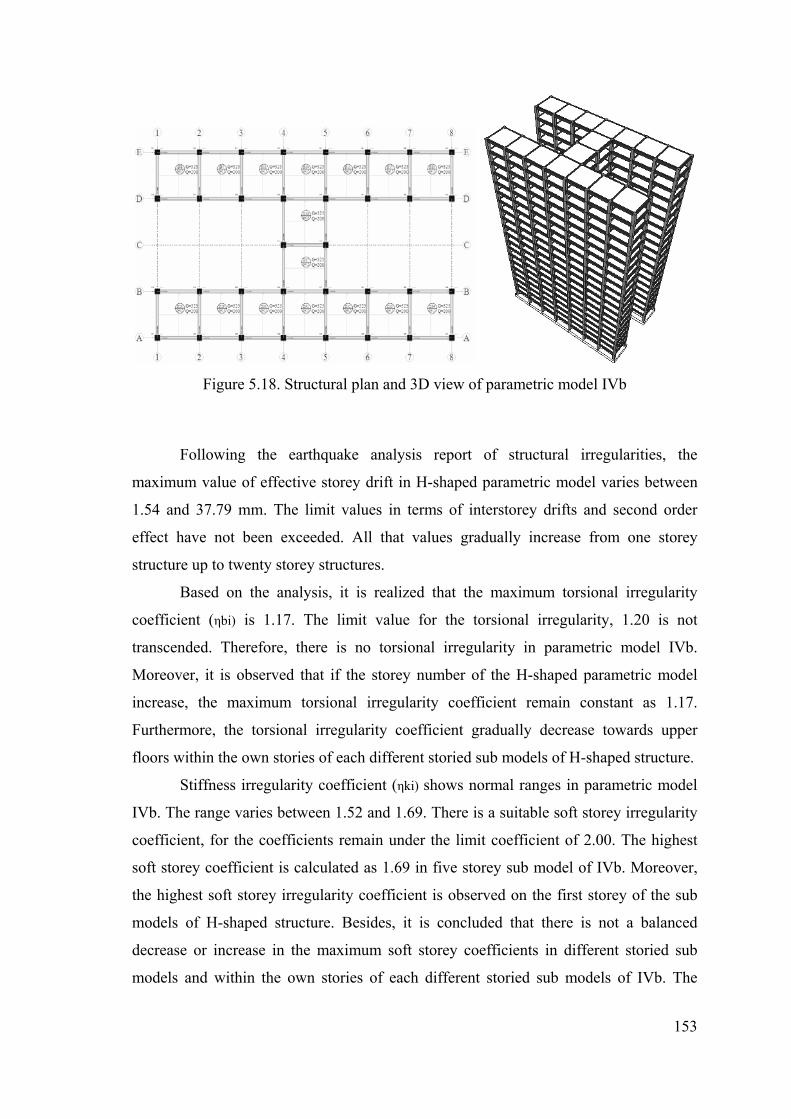
153
Figure 5.18. Structural plan and 3D view of parametric model IVb
Following the earthquake analysis report of structural irregularities, the
maximum value of effective storey drift in H-shaped parametric model varies between
1.54 and 37.79 mm. The limit values in terms of interstorey drifts and second order
effect have not been exceeded. All that values gradually increase from one storey
structure up to twenty storey structures.
Based on the analysis, it is realized that the maximum torsional irregularity
coefficient (ηbi) is 1.17. The limit value for the torsional irregularity, 1.20 is not
transcended. Therefore, there is no torsional irregularity in parametric model IVb.
Moreover, it is observed that if the storey number of the H-shaped parametric model
increase, the maximum torsional irregularity coefficient remain constant as 1.17.
Furthermore, the torsional irregularity coefficient gradually decrease towards upper
floors within the own stories of each different storied sub models of H-shaped structure.
Stiffness irregularity coefficient (ηki) shows normal ranges in parametric model
IVb. The range varies between 1.52 and 1.69. There is a suitable soft storey irregularity
coefficient, for the coefficients remain under the limit coefficient of 2.00. The highest
soft storey coefficient is calculated as 1.69 in five storey sub model of IVb. Moreover,
the highest soft storey irregularity coefficient is observed on the first storey of the sub
models of H-shaped structure. Besides, it is concluded that there is not a balanced
decrease or increase in the maximum soft storey coefficients in different storied sub
models and within the own stories of each different storied sub models of IVb. The

154
earthquake analysis checks of H-shaped parametric model are comprehensively shown
in Table 5.18.
5.4.3. Parametric Model IVc: T Form
In this model, storey gross area is 400 m2 and the plan geometry of the structure
has been designed as frame system to have T-shaped plan geometry. It is illustrated in
Figure 5.19. Each beam span has a length of 5 meter. In T-shaped parametric model, the
plan geometry has the same projection dimensions in both of the axes. The projection
dimensions are 10 meter on both X and Y axis and the total plan dimensions are 30
meter on X-direction and 20 meter on Y-direction. A3 ratio in T-shaped parametric
model is calculated as approximately 33 % on X-axis and 50 % on Y-axis.
Consequently, there is A3 irregularity in the T-shaped parametric model (IVc)
depending on both axes, because the limit ratio is exceeded. Furthermore, it is
symmetrical according to only Y axis.
Figure 5.19. Structural plan and 3D view of parametric model IVc
Depending on the analysis, it is noticed that the maximum value of effective
storey drift in T-shaped parametric model varies between 1.73 and 35.68 mm. The limit
values in terms of interstorey drifts and second order effect have not been exceeded. All
that values gradually increase from one storey structure up to twenty storey structures.

155
Moreover, they are all increase for each different storied sub models of T-shaped
structure (IVc).
According to the analysis report, the highest torsional irregularity coefficient
(ηbi) is obtained as 1.21 in twenty storey sub model of T-shaped structure (IVc).
Therefore, there is torsional irregularity in H-shaped parametric model. Moreover, it is
observed that there is not a balanced increase or decrease in the maximum torsional
irregularity coefficients.
Stiffness irregularity coefficient or soft storey irregularity coefficient (ηki) shows
normal ranges in the sub models of T-shaped structure. The range varies between 1.52
and 1.86. There is an agreeable soft storey coefficient because the coefficients remain
under the limit coefficient of 2.00. The highest soft storey coefficient is calculated as
1.86 in five storey sub model of T-shaped structure. Moreover, the highest soft storey
coefficients are observed on the first storey. Furthermore, it is observed that if the
number of storey in T-shaped parametric model increase, the maximum soft storey
irregularity coefficient will gradually increase in each different storey sub models of T-
shaped structure. On the other hand, there is not a balanced increase or decrease within
the own stories of each different storied parametric models of T-shaped structure from
ground floor to the upper floors (Table 5.18).
5.4.4. Parametric Model IVd: U Form
In this model, storey gross area is 400m2 and the plan geometry of the structure
has been designed as frame system to have U-shaped plan geometry. The model is
shown in Figure 5.20. Each beam span has a length of 5 meter. In U-shaped parametric
model, the plan geometry does not have any projections on X axis. However, it has 5
meter projection on Y axis. The total plan dimension is 30 meter on X-axis and 15
meter on Y-axis. While the A3 ratio in U-shaped parametric model is calculated as
approximately 33 % on Y-axis, there is not any projection on X axis. Therefore, A3
irregularity does not exist in the structure according to the X axis. On the other hand,
there is A3 irregularity in the structure according to the Y-axis, for the projection
dimension on Y-axis exceeds the limit ratio of 20 %. Consequently, there is A3
irregularity in U-shaped parametric model (IVd). Furthermore, it is only symmetrical
according to Y axis.

156
Figure 5.20. Structural plan and 3D view of parametric model IVd
According to the earthquake analysis report of structural irregularities which is
shown in Table 5.18, the maximum value of effective storey drift in U-shaped
parametric model is obtained between 1.70 and 35.02 mm. The limit values in terms of
interstorey drifts and second order effect have not been exceeded. Also, these values
gradually increase from one storey model up to twenty storey models. Moreover, they
are all increase for each different storied sub models of T-shaped parametric structure
(Table 5.18).
The maximum torsional irregularity coefficient is 1.17 in parametric model IVd.
There is not any torsional irregularity in the U-shaped parametric model because
torsional irregularity coefficients remained under the limit coefficient of 1.20.
Moreover, it is observed that if the number of storey in U-shaped parametric model
increase, the maximum torsional irregularity coefficient remains constant as 1.17
similar with H-shaped structure. Furthermore, the torsional irregularity coefficient
gradually decrease towards upper floors within the own stories of each different storied
parametric models of U-shaped structure (IVd).
Stiffness irregularity coefficient (ηki) shows normal ranges in the parametric
models U-shaped structure. The range varies between 1.52 and 1.68. There is a
favorable soft storey irregularity coefficient because the coefficients remained under the
limit coefficient of 2.00. The highest soft storey coefficient is calculated as 1.68 in five
storey sub model of U-shaped structure. Moreover, the highest soft storey coefficients
are discovered on the first storey of the sub models of U-shaped structure. Furthermore,

157
it is realized that if the number of storey in U-shaped parametric model increase, it does
not cause a regular increase or decrease in the different storied sub models and within
the own stories of each different storied sub models of T-shaped towards upper floors.
5.4.5. Parametric Model IVe: Square Form
The necessary description and earthquake analysis report has been carried out in
detail in case IV coded as Ia20x20. For that reason; they are not retailed in this part. It
has a square plan geometry which makes it regular in terms of plan geometry. The main
aim of choosing the model of Ia20x20 in this part is to compare its behaviour with the
irregular plan geometries. The differences between the parametric models are evaluated
comprehensively in the following section.
5.4.6. Discussion and Results of Case IV
A set of 5 models, 4 of which had A3 or excessive projection dimensions and 1
of which had no projections were analyzed during the case IV. The aim of this case was
to investigate the seismic behaviour of irregular plan geometries consisting with
different projection dimensions. All models are designed as frame systems. The
irregular plan geometries are generated as symmetrical on both sided, on one sided or
non symmetric. The effects of projection dimension ratio and the symmetry axis are
evaluated. In the TEC (2007), a limit percentage of 20 % was given for the A3
irregularity. In this case, the importance of symmetry in plan geometry and the ratio for
A3 irregularity are examined. The results were evaluated according to the several
criteria containing torsional irregularity coefficient, soft storey coefficient, effective
storey drifts, relative storey drifts and second order effects. On the bases of the carried
out numerical analysis in case IV for the A3 irregularity, the following conclusions
could be drawn up:
• As seen on Figure 5.21, structural model which is symmetrical according to
the both axis, show the best seismic behaviour. The changes in the torsional
irregularity coefficients are illustrated in Figure 5.21. Square plan geometry
has no projections and regular in terms of plan geometry. Moreover, it is

158
symmetrical according to the both axis. Therefore, it shows the best seismic
behaviour. Apart from the other models, an effective storey displacement
shows lower values.
1.1
1.13
1.16
1.18
1.21
1.24
1S 3S 5S 8S 10S 12S 15S 20S
1.111.11 1.11 1.11 1.11 1.11 1.111.1
1.191.2 1.2 1.2 1.2
1.19 1.19
1.21
1.171.17 1.17 1.17 1.17 1.17 1.171.17
1.14
1.16
1.181.19
1.2
1.221.231.24
L form non-symmetricalL form non-symmetrical
H Form twosidedsymmetrical
H Form twosidedsymmetricalT form onesidedsymmetrical
T form onesidedsymmetricalSquare Formtwo sidedsymmetrical
Square Formtwo sidedsymmetrical
Storey number
Tors
iona
lco
effic
ient
s
Figure 5.21. Maximum torsional irregularity coefficients according to the
different storied sub models of case IV
• H-shaped plan geometry is symmetrical according to both X and Y axis. On
the other hand, it has 48 % projection dimensions which exceed the limit
coefficient of 20 %. When the maximum torsional coefficients for different
storied parametric models of H-shaped plan geometry is investigated, it is
observed that the maximum torsional irregularity coefficients show a linear
behavior, and consistently show the value of 1.17 as in the U-shaped model.
• U-shaped plan geometry shows similar seismic performance with H-shaped
plan geometry in terms of torsional irregularity. For that reason, its values
are not shown in the Figure 5.21. U-shaped plan geometry has 33 %
projection dimension on Y axis. It exceeds the A3 limit coefficient. On the
other hand, it is symmetrical on one-sided. With the interaction of symmetry
and projection ratio, it shows similar performance in terms of torsional
irregularity although it is symmetrical on one-sided. Because, projection
dimension ratio is lower than the U-shaped plan geometry.

159
• T-shaped plan geometry is symmetrical according to only Y axis. On the
other hand, it has 33 % A3 ratio which exceed the limit percentage of 20 %.
When the maximum torsional coefficients for different storied parametric
models of T-shaped plan geometry is investigated, it is observed that
torsional irregularity coefficients draw an uneven curve. In the 20 storey T-
shaped parametric models, maximum torsional irregularity coefficients begin
to draw an increasing linear curve and the maximum value takes the value
of1.21.
• L-shaped plan geometry is both non-symmetrical and has 60 % projection
ratio which is three times of the limit coefficient of 20 %. Therefore, it
shows the worst seismic performance among the models in case 3. Torsional
irregularity coefficients draw a continuously increasing curve. The
maximum torsional coefficient is calculated as 1.24 in twelve storey sub
model of L-shaped structure.
• It is observed that all models shows better seismic performance against the
earthquake loads which come from the symmetry axis.
• There is not observed soft storey irregularity in any of the models.
• It is concluded from the case IV that structures having regular plan geometry
and symmetrical according to the both sides shows best seismic
performance.
• The T and U-shaped plan geometry are designed to have the same projection
dimension ratio of 33 % which is under the limit coefficient of 20 %. They
are both one-sided symmetrical. (according to the Y axis) On the other hand,
although there is torsional irregularity in the T-shaped parametric model,
The U-shaped parametric model does not have torsional irregularity. It has
projections in plan only on Y direction.
• In conclusion, there should be made a sanction in the TEC (2007) related to
the percentage of the projection dimensions. The percentage should be
considered according to the different plan geometry and may be its structural
system types.

160
Table 5.18. Analysis results of case IV
L-Shape - IVa H-Shape - IVb T-Shape - IVc U-Shape - IVd Square – IVe
(δi)max (ηbi) ηki (δi)max ηbi ηki (δi)max ηbi ηki (δi)max ηbi ηki (δi)max ηbi ηki
1S 1.68 1.14 - 1.54 1.17 - 1.73 1.19 - 1.70 1.17 - 1.38 1.11 -
3S 5.46 1.16 1.51 5.25 1.17 1.52 5.60 1.20 1.52 5.49 1.17 1.52 4.90 1.11 1.52
5S 10.16 1.18 1.67 9.88 1.17 1.69 10.47 1.20 1.69 10.28 1.17 1.68 9.27 1.11 1.67
8S 17.11 1.19 1.66 17.32 1.17 1.68 17.67 1.20 1.71 17.32 1.17 1.67 13.02 1.11 1.64
10S 22.08 1.20 1.64 22.61 1.17 1.64 22.88 1.20 1.71 22.43 1.17 1.63 14.07 1.11 1.57
12S 26.95 1.22 1.61 28.27 1.17 1.65 28.04 1.19 1.75 27.49 1.17 1.57 14.88 1.11 1.53
15S 31.90 1.23 1.57 32.75 1.17 1.67 32.81 1.19 1.84 32.14 1.17 1.58 15.84 1.11 1.54
20S 34.85 1.24 1.59 37.79 1.17 1.69 35.68 1.21 1.86 35.02 1.17 1.59 17.38 1.10 1.56
(Cont. on next page)
160

161
Table 5.18. (Cont.)
L-Shape H-Shape T-Shape U-Shape Square
(δi)max/hi θi (δi)max/hi θi (δi)max/hi θi (δi)max/hi θi (δi)max/hi θi
1S 0.0006 0.0004 0.0006 0.0004 0.0006 0.0004 0.0006 0.0004 0.0005 0.0004
3S 0.0020 0.0016 0.0019 0.0015 0.0021 0.0016 0.0020 0.0016 0.0018 0.0015
5S 0.0038 0.0034 0.0037 0.0032 0.0039 0.0033 0.0038 0.0033 0.0034 0.0032
8S 0.0063 0.0060 0.0065 0.0059 0.0065 0.0059 0.0064 0.0059 0.0048 0.0057
10S 0.0082 0.0078 0.0084 0.0077 0.0085 0.0077 0.0083 0.0077 0.0052 0.0073
12S 0.0100 0.0097 0.0105 0.0097 0.0104 0.0095 0.0102 0.0095 0.0055 0.0090
15S 0.0118 0.0124 0.0121 0.0130 0.0122 0.0123 0.0119 0.0123 0.0059 0.0116
20S 0.0071 0.0176 0.0140 0.0190 0.0132 0.0174 0.0130 0.0175 0.0064 0.0162
161

162
CHAPTER 6
CONCLUSIONS
6.1. Conclusions
The main objective of this thesis was to explore the effective factors on
structural irregularities to develop a substantial design guide for architects and students
of architecture in order to design earthquake resistant buildings. Because, earthquake
resistance of a building is strongly related to the interaction of architectural design with
structural configuration. This thesis consists of a comparative analytical study of
various R/C skeleton structures. The behaviour of the R/C structures was investigated
on the bases of the structural irregularities that defined in the TEC (2007). R/C
structures were chosen for the analysis due to the its widespread usage in Turkey. An
understanding or perception tried to be given to architects or students of architecture
about earthquake resistant design (ERD) criteria in order to abstain from the design
faults. The study aims to contribute to the general understanding and perception of ERD
in order to contribute to the development of a tradition of earthquake resistant
architectural design in Turkey.
In the thesis, firstly the theoretical information related to the earthquake resistant
design of R/C buildings in terms of structural irregularities was described
comprehensively with drawings and damaged building photographs in Chapter 3
according to the TEC (2007). Then, to demonstrate the validity of the mentioned
theoretical information, in Chapter 5, a series of cases consisting of many parametric
models were developed for each structural irregularity. The number of structural axis
and the number of stories were increased in each parametric model of the cases to
evaluate structural irregularity coefficients
Based on the analysis performed in the case studies, following conclusions were
drawn:
• According to the results obtained from the model analysis, the following
factors were realized as effective in the variation of the structural irregularity
coefficients:
163
1. Plan geometry of the structure (Architectural form)
2. Rigidity distribution in the structure
3. Configuration of structural walls in the plan
4. The number of structural axis
5. The number of stories
6. Positions of floor openings in the plan with its ratio.(A2)
7. Projection ratio, projection directions and symmetry condition in the
plan geometry
8. The number of overhangs, overhang directions and building mass
• Results of the model analysis demonstrate that if the structural axis
increases, the torsional irregularity coefficient will increase. Moreover, it
was observed that the change in the torsional irregularity coefficients do not
show a consistent behaviour by the increasing or decreasing the number of
stories. Increase or decrease in the torsional irregularity coefficient which
formed by changing the number of stories, depend on the structural
configuration. Therefore, each structural system displayed different
behaviour in terms of torsional irregularity coefficient.
• It was concluded that the symmetrical models which consists of shear-frame
systems with a central rigid core show better earthquake behaviour than the
models which consists of only shear-frame system.
• It is noticed that the models designed as frame systems shows acceptable
torsional irregularity coefficients. However, a central rigid core added to the
system, the structures expose to high torsional irregularity coefficients. This
condition demonstrates that if the shear walls get closer to the gravity centre,
the torsional irregularity coefficient will increase.
• The positions of shear walls change the torsional irregularity coefficient
despite both of the structure have similar rigidity quantity. The models
without any floor openings which have shear walls on the corner of the
structure shows better seismic performance in terms of torsional irregularity
rather than the models which have shear walls in the middle of the outer
axis. In those models, the structural irregularity coefficients were observed
under the limit coefficient for structural irregularity or closer to that value.
164
• It was realized that if the rigidity distribution in the system arranged
randomly in any of the earthquake direction, the structure will failure on the
flexible side. Distributions of the structural member’s regularly in both
earthquake directions improve the seismic behaviour of the structure.
• It was noticed that shear walls should be placed on the outer axis as possible.
If a central rigid core added to the structure due to the architectural aims, at
least additional shear walls should be placed on the outer axis of the
structure in order to balance the rigidity in the structure.
• Sufficiency in rigidity can be changed according to the number of storey and
axis in the structure. Excessive usage of shear walls does not mean excessive
resistant structure under earthquake loads. The usage of shear walls largely
improves the seismic behaviour of the structure provided that they were used
efficiently in the right place.
• It is noticed that despite the regular plan geometry and rigidity distribution,
structural elements type, their location in the plan and their sufficiency in
terms of rigidity, strength and stability according to the each R/C structural
system play the most effective role in determining the earthquake behaviour
of structures.
• It was realized that rigidity distribution on the structure plays the main role
under earthquake loads rather than the simple plan geometry.
• It is observed that all models show better torsional irregularity coefficients
against the earthquake loads coming from the symmetry axis.
• Earthquake loads are directly proportional with the building mass. It was
detected that if the overhangs were added to the structure, the building mass
directly increased. Furthermore, the directions of overhangs were as
important as the number of overhangs. For instance, when the two model
one of which has one-sided overhang, and the other has quadral-sided
overhang were compared, it was realized that although excessive building
mass, the model which has quadral-sided overhang shows lower torsional
irregularity coefficient than the model which has one-sided overhang. This
condition occurs because the model consisting of one-sided overhang was
symmetrical only according to the earthquake direction of X axis. On the
other hand, the model consisting of quadral-sided overhang was symmetrical

165
according to the both X and Y earthquake direction. The rigidity and gravity
centre coincide in that model.
• It is concluded from the model analysis that location of the floor openings
has a significant role rather than the floor opening ratio. For this reason,
there should be made a sanction in the TEC where floor openings should be
left. Alternative solutions for different R/C structural system type and with
different arrangements of floor openings should be considered.
• The location of shear walls and its interaction with floor openings are
effective in earthquake behavior of the structure. According to the results
obtained from the model analysis made for researching the effects of floor
discontinuity, it was noticed that shear walls should be positioned on the
corners of the structure if the model has a central floor opening. On the other
hand, it was realized that if the floor openings are placed symmetrically on
the corners of the structure, and a central rigid core added to the structure,
shear walls should be placed in the middle of the outer axis instead of the
corners of the structure in order to balance of the rigidity.
• On the bases of the carried out numerical analysis with different plan
geometries, it was noticed that symmetric plan geometry displays better
seismic behaviour. Square plan geometry which has no projection in plan
shows the best seismic behaviour. Moreover, H shaped form shows better
seismic behaviour due to the its symmetric condition according to the both X
and Y earthquake direction. On the other hand, L form which is
asymmetrical according to the both earthquake direction shows the worst
earthquake behaviour.
• Symmetrical configuration is not only provided in the plan geometry of a
building, but also must be provided in the rigidity distribution. The analysis
has revealed that regularity in the rigidity distribution is much more
important than the regularity in the plan geometry.
• In conclusion from the model analysis which was created in order to
investigate the effects of projection percentage and the effects of symmetry,
it was realized that there should be made a sanction in the TEC (2007)
related to the percentage of the projection dimensions. The percentage

166
should be considered according to the different plan geometry and may be its
structural system types.
• It was noticed that in all models effective storey drift values consistently
increased when the storey number in the models were increased. Moreover,
the limit values in terms of interstorey drifts and second order effect have not
been exceeded according to the limit coefficients described in the TEC
(2007). It was noticed that all that values gradually increase with an increase
in the storey number.
• Results of the model analysis demonstrate that increase in the storey number
cause increase in the soft storey irregularity coefficients in especially first
storey of the structure due to the load bearing capacity of the structural
elements. Besides, storey loads accumulated in lower stories of the structure.
For this reason, the load bearing capacity of structural members in lower
stories should be increased in order to provide sufficiency in the stiffness or
rigidity.
6.2. Recommendations for Further Studies
This thesis includes a comprehensive research on structural irregularities
according to the TEC (2007). For further studies, increasing the number of case studies
what were found and criticized in the thesis may contribute to the TEC with providing a
new solution suggestion or a new sanction in the structural irregularity evaluation in
TEC (2007). Moreover, the results from the obtained model analysis can be compared
with other regulations such as Eurocode 8 FEMA 356, ATC 40 in order to compare the
structural irregularity results with other codes. Thereby, the study also provides a
comparative assessment on structural irregularities. Furthermore, a three dimensional
time history analysis can be performed for the comparison of actual damage observed
during the earthquake of the worst model in each structural irregularity case. Solutions
should be developed for the existing building stock in Turkey which was constructed
previous earthquake codes with having many structural irregularities. Moreover, a
perception in the phenomenon of earthquake architecture should be popularized among
architects in order to prevent design faults in newly constructed structures.

167
REFERENCES
Aka,İ., Keskinel, F., Çılı, F., & Çelik, C. (2001). Betonarme [Reinforced concrete].
Turkey, İstanbul: Birsen press. Akıncı, E. (2005) Depreme dayanıklı yapı tasarımında burulma düzensizliğinin
incelenmesi [Studying the effect of torsional disorder on earthquake enduring structure design]. (Master thesis). Mustafa Kemal University, Antakya, Turkey.
Ambrose, J., & Vergun, D. (1985). USeismic design of buildingsU USA, New York: Wiley
& Sons Inc. Arbabian, H. (2000, November). The role of architects in seismic design. International
Conference on the Seismic Performance of Traditional Buildings, Istanbul. Arnold, C., & Reitherman, R. (2002). Building configuration and seismic design. USA,
NW: John Wiley & Sons. Inc. Atımtay, E. (2000). Açıklamalar ve örneklerle afet bölgelerinde yapılacak yapılar
hakkında yönetmelik [Specification for buildings to be built in Seismic Zones with explanation and exemplification], Turkey, Ankara: Bizimbüro press.
Bachman, H. (2003). Seismic conceptual design of buildings- basic principles for
engineers, architects, building owners, and authorities. Swiss, Bern: Swiss Federal Office for Water and Geology.
Bakar, V. (2003). 17 Ağustos 1999 depreminde ağır hasar gören binaların ortak
özellikleri [Common faults of the buildings heavily damaged during the 17 August 1999 earthquake]. Ankara TMMOB Chamber of civil engineers bulletin, 8, 28-32.
Barka, A. (2000). Yeryüzü ve deprem [Earth and earthquake]. Turkey, Istanbul: Boyut
press. Bayülke, N. (2001a). Depreme dayanıklı betonarme ve yığma yapı tasarımı [Earthquake
resistant reinforced concrete and masonry building design]. Turkey, İzmir: Chamber of civil engineers press.

168
Bayülke, N. (2001b). Depremde hasar gören yapıların onarım ve güçlendirilmesi [Repairing and Strengthening of the damaged structures after earthquakes]. Turkey, İzmir: Chamber of civil engineers press.
Braile, L.W. (2000). Seismic waves and the slinky. A guide for teachers, informal
publication. Retrieved from http://www.geo.mtu.edu/UPSeis/waves.html. Büyükyıldırım, G. (2006). Öldüren deprem mi, yapılar mı? [Does earthquake or
structure kill?] Turkey, Antalya: Chamber of civil engineers press. Celep, Z., & Kumbasar, N. (1992). Deprem mühendisliğine giriş ve depreme dayanıklı
yapı tasarımı [Introduction to the earthquake engineering and earthquake resistant design]. Turkey, Istanbul: İstanbul Teknik University Faculty of civil engineering press.
Charleson, A. (2008). Seismic Design for Architects: Outwitting the Quake. USA,
Burlington: Elsevier. Chen, W.F., & Scawthorn, C. (2002). Earthquake engineering. England, London: Taylor
and Francis press. Coburn, A., & Spence, R. (1992). Earthquake Protection. USA, Chichester: John Wiley
& Sons. Inc. Çağatay, I. H., & Güzeldağ, S. (2002). Yeni Deprem Yönetmeliği SAP2000N
Uygulamaları [New earthquake code SAP2000N practices], Turkey, Adana: Birsen press.
Dimova, S., & Illiaalashki (2003). Seismic Design of Symmetric Structures for
Accidental Torsion. Bulletin of EarthquakeEngineering, 1, 303–320. Dowrick, D. J. (1987). Earthquake resistant design for engineers and architects. USA,
Chichester: Wiley & Sons. Inc. Doğan, M. (2007). Depreme dayanıklı yapı tasarımı [Earthquake resistant building
design]. Turkey, Eskişehir: Osmangazi University press. Doğan, M., Ünlüoğlu, E., & Özbaşaran, H. (2007). Earthquake failures of cantilever
projections buildings. Engineering Failure Analysis, 1458-1465.

169
Döndüren, S. M., Karaduman, A., Çöğürcü, T. M., & Altın, M. (2007). Yapılarda burulma düzensizliği [Torsional irregularity in buildings]. Selçuk University Technical Science journal, 6 (1), 42-52.
Düzgün, M., & Bozdağ, Ö. (2007). Depreme dayanıklı yapı tasarımında temel
kavramlar [Basic terms on earthquake resistant building design]. Retrieved from http://www.scribd.com/doc/13427755/Depreme-Dayanikli-Yapi-Tasariminda-Temel-Kavramlar.
Erman, E. (2002). Deprem bilgisi ve deprem güvenli mimari tasarım [Earthquake
information and earthquake safety architectural design]. Turkey, Ankara: Middle East Technical University Faculty of architecture press.
Ersoy, U. (1999). Binaların mimarisinin ve taşıyıcı sisteminin deprem dayanımına etkisi
[The effects of architectural design and structural system of buildings on earthquake resistance]. In T. Aktüre (Ed.), Earthquake Safety Housing Symposium (pp. 65-77). Turkey, Istanbul: Boyut press.
Evcil, E. (2005). Yeni deprem yönetmeliğine (TDY-98) gore düzensizliklerin
incelenmesi [Examination of the irregularities used in TEC (Master Thesis). Çukurova University, Adana, Turkey.
Gönençen, K. (2000). Mimari tasarımda depreme karşı yapı davranışının düzenlenmesi
[Arrangement of structural behaviour in architectural design against earthquake. Turkey, Ankara: Technic press.
Gülay, F. G., & Çalım, G. (2003). A comparative study of torsionally unbalanced multi-
storey structures under seismic loading. Turkish Journal Engineering Environment Science, 27, 11-19.
Gülkan, P. (2000). Marmara ve Düzce Depremleri Mühendislik Raporu –
Yapılardaki Hasar Sebepleri ve Sonuçları [Marmara and Duzce earthquakes Engineering report – Damage reasons and results on buildings]. Retriewed from http://www.metu.edu.tr/home/wwweerc/reports/marmara. pdf.
Güllü, E. (2004). Yapıların deprem yönetmeliğine göre hesabında perde yerleşiminin
etkisi ve A2 düzensizlik durumunun incelenmesi [Investigation of the effects of shear walls and A2 irregularity conditions according to the earthquake calculations on buildings (Master thesis). Çukurova University, Adana, Turkey.

170
Işık, B. (2003, Mayıs). Depreme dayanıklı yapı elde edilmesi için alker duvarın tasarım kriterinin araştırılması [Investigation of wall design criterias in order to gain earthquake resistant building]. Fifth National Conference on Earthquake Engineering, Istanbul.
İnan, T., & Korkmaz, K. (2009, August). Parametric analysis of torsional irregularity in
buildings during earthquakes according to the Turkish Earthquake Code. Poster session presented at the International Earthquake Symposium, Kocaeli.
Japan International Cooperation Agency. (2004). Türkiye’de doğal afetler konulu ülke
strateji raporu [Country strategy report related the subject of natural disaster in Turkey]. Retrieved from http://www.deprem.gov.tr/Sarbis/DDK/5d8ce590ad8981c_ek.pdf.
Kaplan, A.S. (1999). Mevcut Yapıların Deprem Yüklerine Karşı Güçlendirilmesi
Çıkmalı binaların depreme karşı güvensizliği ve mevzuatta düzeltilmesi gereken hususlar [Strengthing of existing buildings against earthquake loads Insecurity of the buildings having overhangs against earthquake and provisions to be changed]. Retrieved from http://www.depremlesavas.com/makaleler/makale01-sakaplan.htm.
Karaesmen, E. (2002). Öncesiyle sonrasıyla deprem [Before and after earthquake].
Turkey, Istanbul: Atılım University press. Krinitzsky, E. L., Gould, J. P., & Edinger, P. H. (1993). Fundamentals of earthquake-
resistant construction. USA, New York: John Wiley & Sons. Inc. Lagorio, H. J. (1990). Earthquakes, “An Architect’s Guide to Non-structural Seismic
Hazards. USA, NW: John Wiley & Sons. Inc. Lindeburg, M. R., & Baradar M. (2001). Seismic Design of Building Structures (8th
ed.). CA: Professional Publications Inc. Livaoğlu, R., & Doğangün, A. (2003, May). The evaluation of behavior of rigid and
flexible side elements on the multistory building with torsional irregularity. Paper presented at the fifth national conferance on earthquake engineering, İstanbul.
Mendi, H.E. (2005).Evaluation of Architectural Consciousness and exploration of
architecture-based issues in seismic design (Master thesis). Middle East Technical University, Ankara, Turkey.

171
Mertol, A., & Mertol, H.C. (2002). Deprem Mühendisliği, Depreme Dayanıklı Yapı Tasarımı [Earthquake Engineering, Earthquake Resistant Building Design]. Turkey, Ankara: Kozan press.
Mezzi, M., Parducci, P.,& Verducci P. (2004). Architectural and structural
configurations of buildings with innovative aseismic systems. 13th WCEE, Vancouver, Canada.
Murthy, D.B.N. (2007). Disaster management: Text and case studies. Indian, New
Delphi: Deep & Deep Publications Pvt. Ltd. Naeim, F. (2001). The Seismic Design Handbook. USA, New York: Van Nostrand
Reinhold. Öztekin, K., & Yıldırım, S. T. (2007). Building constructed regions and the earthquake
in Kocaeli. New World Sciences Academy, 1, 22-29. Özmen, G. (2004). Çok katlı yapılarda aşırı burulma düzensizliği [Excessive Torsional
Irregularity in Multi-Story Structures]. IMO Technical Journal, 210, 3131-3144. Özmen, C., & Ünay, A. I. (2007). Commonly encountered seismic design faults due to
the architectural design of residential buildings in Turkey. Building and Environment, 42 (3), 1406 – 1416.
Özmen, C. (2008). A Comparative Structural and Architectural Analysis of Earthquake
Resistant Design Principles Applied in Reinforced Concrete Residental Buildings in Turkey (Doctoral dissertation). Middle East Technical University, Ankara, Turkey.
Pampal, S. & Özmen, B. ( 2009). Depremler doğal afetmidir? [Are earthquakes natural
disaster?] Depremlerle başedebilmek [Cope with earthquakes]. Turkey, Ankara: Eflatun press.
Parsons, T., Toda, S., Stein, R. S., Barka, A., & Dieterich, J. H. (2000). Heightened
Odds of Large Earthquakes Near Istanbul: An Interaction-Based Probability Calculation. Science, 288, 661-665.
Requirements for design and construction of reinforced concrete structures, Turkish
Standard, TS 500, 2000.

172
Sezer, E. (2006). Yapı sistemlerinde burulma düzensizliğini etkileyen parametrelerin incelenmesi [Investigation of the parameters effecting torsional irregularity of structural systems]. (Master thesis). Zonguldak Karaelmas University, Zonguldak, Turkey.
TEC (Turkish Eartquake Code), 2007. Official Gazette No. 26454. Sucuoğlu, H. & Yılmaz, T. (2000). Düzce, Turkey: A City Hit by Two Major
Earthquakes in 1999 within Three Months. Turkey, Ankara: Earthquake Engineering Research Center.
Tezcan, S. (1998). Depreme dayanıklı tasarım için bir mimarın seyir defteri [A journal
of an architect for earthquake resistant design]. Turkey, İstanbul: Turkish Earthquake Foundation.
Tuna, M. E. (2000). Depreme dayanıklı yapı tasarım [Earthquake Resistant Design].
Turkey, Ankara: Tuna Education and Culture foundation. United State Geological Survey [USGS]. (2010a). Frequency of earthquake occurence.
Retriewed from http://earthquake.usgs.gov/earthquakes/eqarchives/year/eqstats.php.
United State Geological Survey [USGS]. (2010b). Significant earthquakes. Retriewed
from http://earthquake.usgs.gov/earthquakes/eqinthenews/. United State Geological Survey [USGS]. (2010c). Tectonic map of Turkey. Retriewed
from http://neic.usgs.gov/neis/eq_depot/2003/eq_030501/neic_tgac_maps.html. Wakabayashi, M. (1986). Design of earthquake-resistant buildings. New York:
McGraw-Hill. Yılmaz, R., & Demirtaş, R. (1996). Depremler ve Türkiye’nin Depremselliği
[Earthquakes and seismicity of Turkey]. In E. Karaesmen (Ed.), Earthquake and after (pp. 32-37). Turkey, Ankara: Contractors federation press.
Yulu, T. (2003). Yeni deprem yönetemeliğinde (TDY98) A2 ve A3 düzensizliğinin
incelenmesi [Investigation of A2 and A3 irregularity in Turkish Earthquake Code] (Master thesis). Çukurova University, Adana, Turkey.

173
Zacek, M. (2001). The architect's role in earthquake resistant building design. In E. M. Komut (Ed.), Natural Disasters: Designing for Safety (pp. 18-37). Turkey, Ankara: Chamber of Architects.
Zacek, M. (2002). Depreme dayanıklı yapı tasarımı ön proje aşaması [Pre-project phase
of earthquake resistant design]. (M. T. Akbulut, Trans.). Turkey, Istanbul: Yıldız Technic University press. (Original work published 1999).
Zacek, M. (2005a). Earthquake-resistant architectural design. In E. M. Komut (Ed.),
Architects and Disasters (pp. 23-26). Turkey, Ankara: Chamber of Architects. Zacek, M.(2005b). Structural Behaviour Under Seismic Load. In E. M. Komut (Ed.),
Architects and Disasters (pp. 54-57). Turkey, Ankara: Chamber of Architects. Zacek, M. (2005c). Seismic Vulnerability of Existing Buildings. In E. M. Komut (Ed.),
Architects and Disasters (pp. 58-61). Turkey, Ankara: Chamber of Architects.


![başkan sunum.ppt [Uyumluluk Modu]...Lisanslı Voleybolcu Sayısı : 183.782 Faal Voleybolcu Sayısı : 43.244 Antrenör Sayısı : 7.264 Kulüp Sayısı : 916 HACETTEPE ÜNİVERSİTESİ](https://img.pdfslide.net/doc/110x75/5f47316721e635686c2ca043/bakan-sunumppt-uyumluluk-modu-lisansl-voleybolcu-says-183782-faal.jpg)