Embed Size (px)
Citation preview

The interevent time fingerprint of triggering for induced seismicity
Mark Naylor
School of GeoSciencesUniversity of Edinburgh
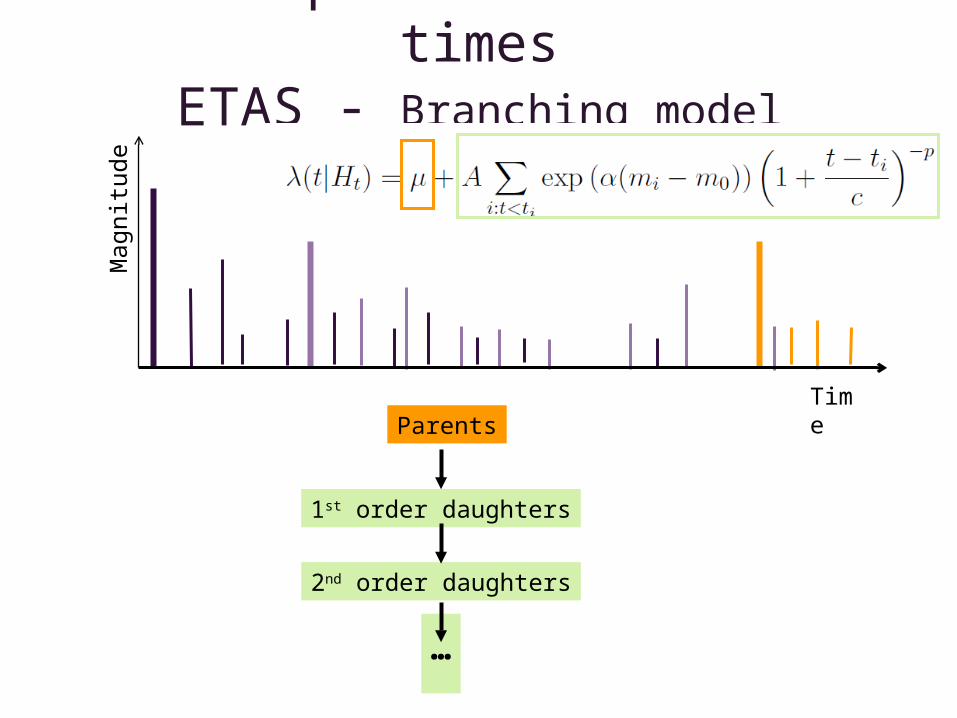
Earthquake inter-event timesETAS - Branching model simulations
Time
Mag
nitu
de
Parents
1st order daughters
2nd order daughters
…

Earthquake inter-event timesIn simulation we know the “Marks”
(Touati, Naylor and Main, Physical review letters, 102, 168501)
Dependentevent pairs
Independentevent pairs
Time
Mag
nitu
de
time
mag
nitu
de
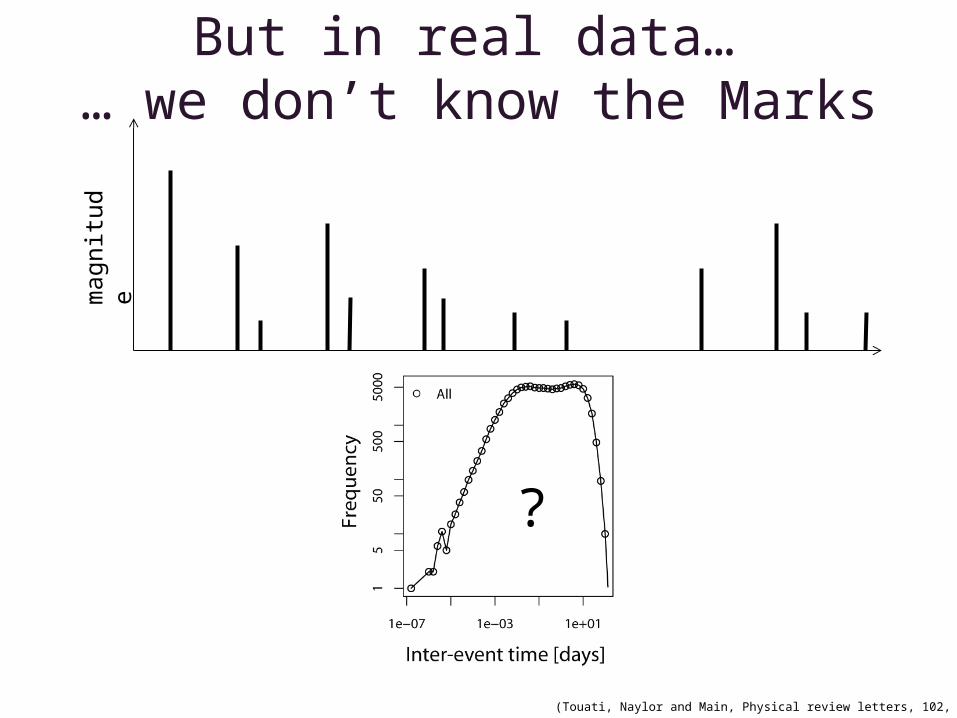
But in real data… … we don’t know the Marks
(Touati, Naylor and Main, Physical review letters, 102, 168501)
?

Data
Synthetic

Earthquake inter-event timesBase case
Dependentevent pairs
Independentevent pairs
Time
Mag
nitu
de
(Touati, Naylor, Main and Christie, JGR, Submitted)

Earthquake inter-event timesSame aftershock properties, Vary rate
Time
Mag
nitu
de
Time
Mag
nitu
de
(Touati, Naylor, Main and Christie, JGR, Submitted)
Low seeding rate
Higher seeding rateMasks correlated event pairs

Background rate is constant
Varies between runs
Analogous for region size
All other parameters are the same
Overlap of aftershock sequences varies and removes dependent event pairs from the time series
Low rate, IETs~Crossover dist
High rate, IETs~Exponential
“Stationarity filter?”

Implication:Inversion for background
rate
Loss of correlations due to overlap fools inversion into predicting higher background rates

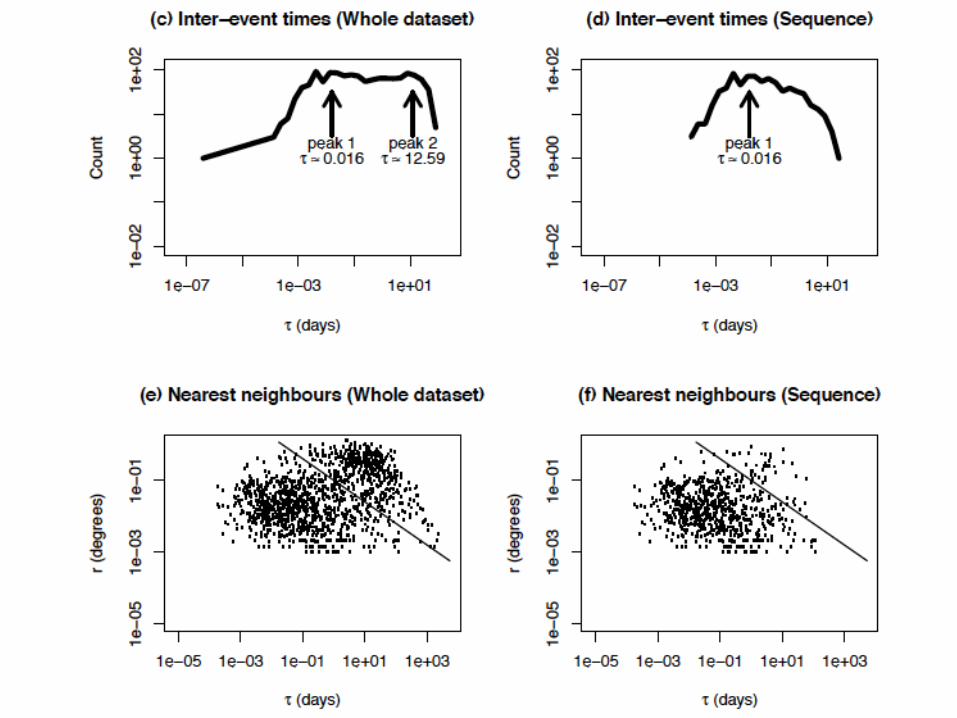
Space can also help identify clustering
But I will consider 3 cases which are spatially localised


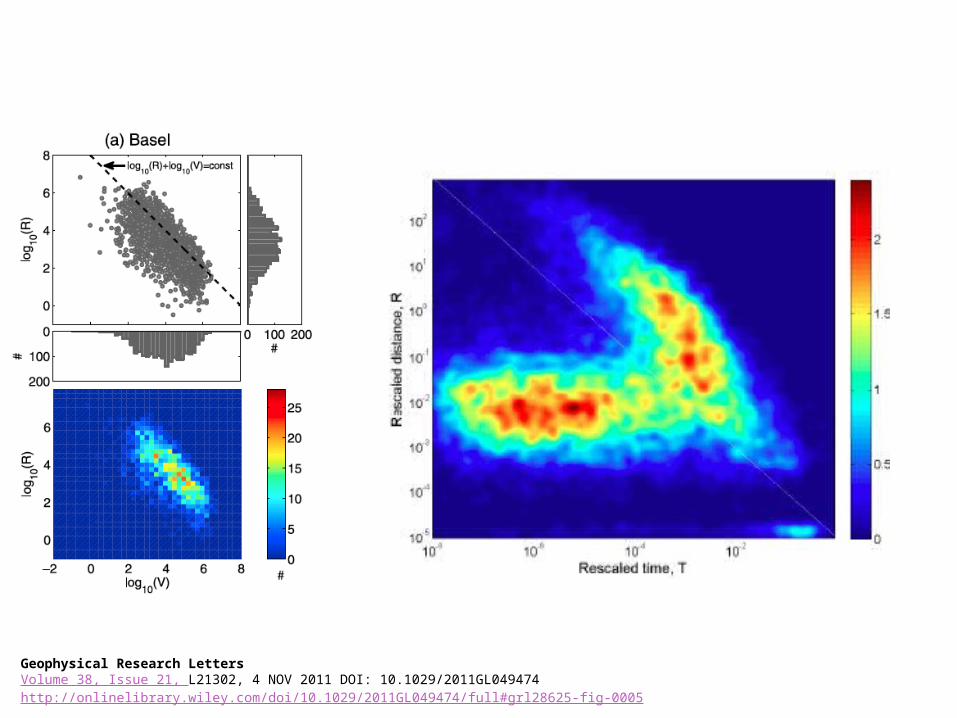
Geophysical Research LettersVolume 38, Issue 21, L21302, 4 NOV 2011 DOI: 10.1029/2011GL049474http://onlinelibrary.wiley.com/doi/10.1029/2011GL049474/full#grl28625-fig-0005

Geophysical Research LettersVolume 38, Issue 21, L21302, 4 NOV 2011 DOI: 10.1029/2011GL049474http://onlinelibrary.wiley.com/doi/10.1029/2011GL049474/full#grl28625-fig-0005

Geophysical Research LettersVolume 38, Issue 21, L21302, 4 NOV 2011 DOI: 10.1029/2011GL049474http://onlinelibrary.wiley.com/doi/10.1029/2011GL049474/full#grl28625-fig-0005
Does fluid injection suppress local seismicity?
But, what about the non-stationary periods?Here we can’t easily compare high and low rate conditions

Vesuvius EtnaIntrusions


Colfiorifo, Umbria-Marche
1997-1998 sequence
(Italy)


Standard ML ETAS inversion and simulation

Resample with uncertainty constrained using the long term rate


Summary
• We observe the same tending towards a “Poisson” signal in 3 different settings – fluid injection, volcanic, tectonic/fluid
• Is fluid driven seismicity genuinely more “Poissonian”?– If so, what process inhibits cascading aftershocks?
• Or, are the triggering processes the same?– Do the higher rates and tight spatial proximity
mask the triggering signal?

2. Convergence in frequency magnitude distributions
• We choose to distinguish between– GR: F(M) ~ M-b
– Modified GR F(M) ~ M- b exp(-M/q)q is the corner or characteristic moment
• We do not explicitly consider different forms of the rolloff (currently) – assume that there is not sufficient data to resolve form
• We want to understand what the convergence trends in a BIC metric will look like as we start to resolve roll-off – Particularly since the safety case for some industries relies on their
estimations of maximum magnitudes– We do not attempt to consider the harder question of the risk of
triggering larger, inherited structures (important in UK)
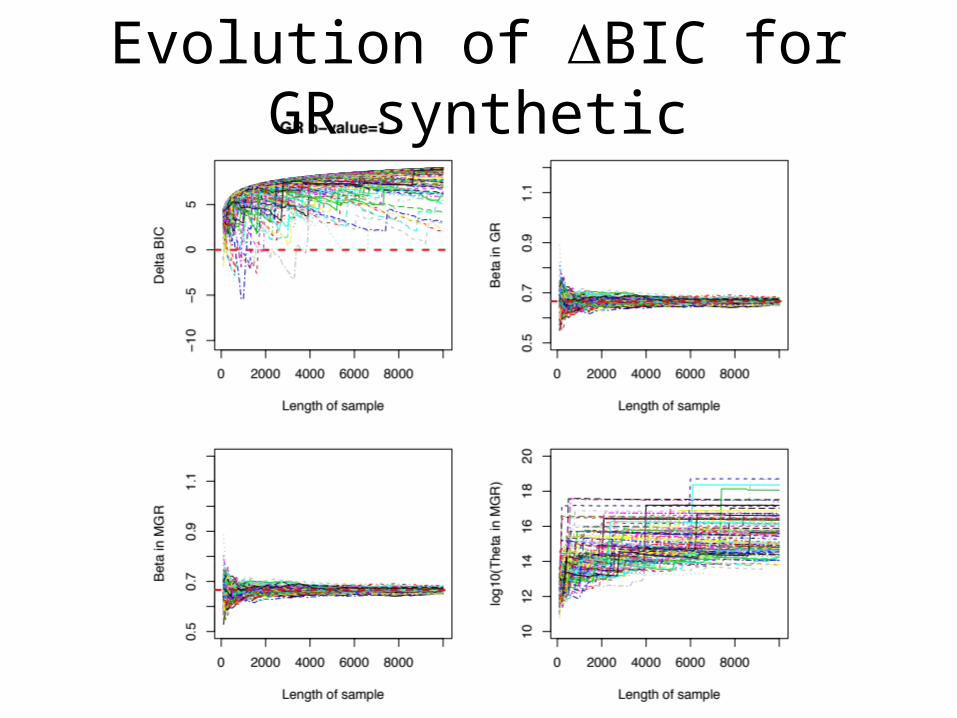
Evolution of DBIC for GR synthetic

Evolution of DBIC for mGR synthetic

GR mGR

Low b
High b

Low q
High q

Analysis of California…

Snapshots of Global CMT
• Beta converging• Corner moment
unconstrained • We previously used DBIC to discriminate models (Main et al 2008)

Snapshots of Global CMT
• Beta converging• Corner moment
unconstrained • Confidence intervals
defined by sampling likelihood space

Global CMT (Lower cutoff 5.75 Mw)

Comparison with GR bootstrap
Comments• Convergence trend for:
– California consistent with GR sampling– Global CMT appears inconsistent with pure GR
• We are currently running large bootstrap to verify this
• If the global catalogue is just sampling GR…– …we are observing an uncommon sample
• Alternative interpretation:– Global CMT catalogue represents a mixture different subsets with
various roll-offs• Next step:
– Analyse more regional tectonic catalogues– Analyse high resolution catalogues that may resolve roll-off
• Geysers? Mining data?


Sensitivity of Global CMT to cutoff

Kilauea and Mauna Loa


Volcanic precursors – Caldera IETs
• Accelerations are due to the failure of new rock as magma is injected
• More hope of forecasting failure in such systems

A simpler (but still hard) problem:Forecasting (asymptotic) failure
Failure Forecasting Method: Least squares on
GLM: Power law-link function with Gaussian (top) or Poisson (bottom) error structure

FFM vs GLM: Synthetic

FFM vs GLM: Real dataStrain – brittle creep AE– brittle creep AE – Mnt Etna
(preceeding eruption)