Embed Size (px)
Citation preview

RP515
THE INTERFERENCE METHOD OF MEASURING THER-MAL EXPANSION
By George E. Merritt
ABSTRACT
This paper is in response to numerous inquiries for details of the method de-veloped at this bureau and described in Scientific Papers Nos. 393 and 485, andseveral articles in outside publications. It is intended as a manual for the useof those who wish to measure thermal expansions by the interferometric method.As such, a more complete description of the apparatus and methods developedcan be included than would be in order in a paper dealing primarily with theresults of a particular set of measurements. The apparatus, method of makingspecimens, forms for taking data, and computation of data, each is the subjectof a careful exposition. An appendix contains tables and special calculations.
CONTENTSPage
I. Introduction 59II. Construction and adjustment of apparatus 61
1. The furnace 612. Temperature measuring apparatus 613. The illuminating viewing apparatus 64
III. Preparation and adjustment of the specimen 661. Types of sample 662. Methods of preparation 663. Adjustment 674. Introducing the specimen into the furnace 68
IV. Observations to be made before starting the run 681
.
Recording thick edge of interferometer 682. Aperture of iris diaphragm 693. Initial position of fringes 694. Balance of storage cell against standard cell 695. Zero setting of galvanometer. 696. Sensitivity of galvanometer 697. Initial temperature of cold junction and furnace 69
V. The run 691. Adjustment of the heating current 702. Watching the fringes 703. Preparing to read the temperature 70
VI. Records 70VII. Computing and plotting 71VIII. Appendix 73
1. Computations relating to oxidizable specimens 76
I. INTRODUCTION
This paper is in response to numerous requests for details of theinterferometric methods, apparatus and procedure developed at this
bureau and described briefly in Scientific Papers Nos. 393 and 485and in several outside publications. It includes later developmentsin apparatus and technique and full information regarding procedure.
59

60 Bureau of Standards Journal of Research [ vol. 10
The apparatus described lends itself equally well to the determina-
tion to a high degree of accuracy of the linear expansion under equi-
librium conditions, or to the determination of the continuous changes
in length taking place in a material while being heated or cooled at
a predetermined rate which may or may not be uniform. The results
obtained by the two procedures are not always the same and it is
necessary for the experimenter to consider carefully which procedureis the one which will yield the information he desires.
Since materials differ greatly in the rate with which they reachequilibrium, an investigator attempting to obtain measurementsunder equilibrium conditions should give careful consideration to this
rate at the temperatures involved. For certain kinds of work it is
the practice to hold the specimen for a sufficient length of time at
each temperature where measurements are to be taken. Cases haveoccurred in this laboratory where equilibrium conditions were notreached even after several hours.
In the case of a material where the expansion follows the increase
in temperature in a regular way an approximate value for the expan-sion under equilibrium conditions may be obtained by heating con-tinuously at a slow rate and neglecting the readings taken before theheating rate becomes established. In this case it must be assumedthat the lag will be constant and that only "true" thermal expansionis taking place. Strictly speaking the only true thermal expansion is
where an increase in size of a material results from an increase in
effective size of the constituent molecules without any change in their
relative arrangement. There are, however, certain effects of changeof thermal energy occurring in different substances at different tem-perature ranges which result in a more or less sudden and drasticrearrangement of the molecules. These appear in the thermal expan-sion curve as irregularities of slope sometimes amounting to an actualreversal. Such rearrangement of the molecules into different configu-rations may be very rapid, such as the almost instantaneous conver-sion of alpha into beta quartz, or very slow, such as the annealing ofglass. In either case a study of their nature can be made with this
apparatus by heating at a definite rate with frequent readings on thetemperature and change in length. This continuous or mobile pro-cedure is not to be considered merely a convenient method of obtain-ing an approximation to the same value better obtained by means ofthe equilibrium procedure, but may be thought of as a means of ob-taining an entirely different type of information. An insufficientlyrapid change of temperature often masks the information sought,hence for a complete analysis several rates should be used and theresults compared.The point to be emphasized here is that neither the "equuibrium"
nor the "mobile" procedure should be used indiscriminately, butthat each problem should be analyzed and a decision reached as tothe type of information desired so that the more appropriate pro-cedure may be selected.
Because of the small size of specimen and the ease and rapidity ofreading, the interferometric apparatus described in this paper is par-ticularly advantageous when the mobile procedure is selected. Thesmall size of the specimen and simplicity of temperature control arefeatures which recommend its use in cases where the specimen is tobe held at a constant temperature until reaching equilibrium.
B. S. Journal of Research. RP515
1OB
p III 1
FIGURE L—Assembled apparatus for thermal expansion measurements by the
interference method

Menitt] Thermal Expansion Measurements 61
II. CONSTRUCTION AND ADJUSTMENT OF APPARATUS
The apparatus consists of three main parts—a furnace for heatingthe specimen, a device for measuring the temperature, and a meansfor measuring the change in length. Figure 1 shows the set up.
1. THE FURNACE
A very satisfactory furnace of the tubular type, wound with 17 to
18 feet of chromel ribbon of 1-ohm resistance to the foot is illustrated
in Figure 2. The ends of the ribbon are anchored to iron collars andeither hard soldered to copper leads or carried out to the outside of
the furnace and clamped to binding posts. Care must be taken thatthe insulation in a vertical direction is as nearly symmetrical as pos-sible. If this is not done, there will be a temperature gradient betweenthe thermocouple and the specimen which will give trouble. 1 Thespace between the heating tube and the outside of the furnace is filled
with silocel or some other similar insulating material capable of stand-ing high temperatures.
This furnace is heated by a 110-volt line current of from 1 to 5amperes which should be controlled by means of rheostats. For non-magnetic specimens either direct or alternating current is satisfactory.
A convenient, though not necessary accessory, is a tapered wire rheo-stat which will take more current without overheating as the resistance
is taken out. Furnaces of this type may be purchased on the market.A small porcelain bucket is provided by means of which the speci-
men may be introduced into and removed from the furnace. Thethermocouple is inserted through the bottom of the furnace and pro-
jects through a hole in the bottom of this bucket, so that the junctionis almost, but not quite, in contact with the lower surface of b, Figure 2.
2. TEMPERATURE MEASURING APPARATUS
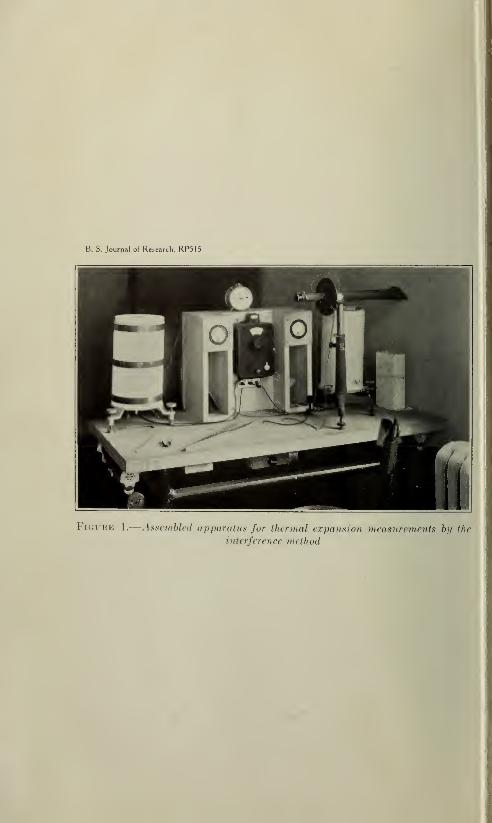
For temperature measurements a potentiometer set-up as shown in
Figure 3 may be used. The electromotive force developed by thedifference in temperature between the hot and cold junctions of thethermocouple is balanced across a galvanometer against the electro-
motive force of a 2-volt storage battery by means of resistances in-
troduced by the dials of the potentiometer, the storage battery havingbeen previously balanced against a standard cell by means of externalrheostats. While the galvanometer sensitivity must drop very low to
affect the accuracy of the reading, a rather close watch of the sensitiv-
1 In order to control the temperature gradient in the furnace, it is desirable to check the temperatureindicated by the thermocouple against the temperature existing at the same time in the location occupiedby the specimen. A method for approximating this is by utilizing the well-known melting points of sev-eral of the more fusible metals.In order to do this, it is only necessary to prepare a specimen consisting of one element of the desired
metal and two elements of some more refractory metal, the expansion of which is not too different fromthat of the fusible metal. The specimen should be of small cross section in order not to delay the melt.
It is not necessary to count the fringes, but only to watch them carefully as the expected melting pointapproaches and to see that the heating schedule is the same as that to be used when making regular runs.The melting point is indicated by a rapid change in width of the fringes, culminating in their entire disap-pearance.Since many substances have a bad effect on the surfaces of fused quartz, it is desirable to confine these
tests to a few metals which have been found to have little effect on the surfaces and the melting points ofwhich are wall known, such as:
°C.Tin.. 231.9Zinc. 419.4Aluminum 658.9Silver 961

62 Bureau of Standards Journal of Research [ Vol. w
Figure 2.
—
Cross section of furnace
Merritt] Thermal Expansion Measurements 63
ity is desirable, because any change may be an indication of poorconnections or other trouble.
A platinum, platinum-rhodium thermocouple is recommended.A table which gives the standard calibration for this kind of couple is
shown on page 73. For use from room temperature to 1,000° C, achromel-alumel couple may be used, and for temperatures below 300° C.a copper constantan thermocouple may be employed. The last twothermocouples are more sensitive than the Pt-PtRh couple.The cold junction may consist of a pair of mercury filled glass
tubes into which the two wires of the thermocouple and the wiresto the potentiometer are inserted. The temperature of this junctionmust be well controlled and this is easily done by immersing both tubesin a vacuum bottle which may be filled with water or a mixture of
FURNACE
POTENTIOMETER
Figure 3.
—
Potentiometer arrangement
water and ground ice. The temperature of the cold junction may beread by means of a thermometer.The galvanometer may be of the quartz suspension, moving concave
mirror type, the radius of curvature of the mirror being about 50 cm.The image of a lamp filament is focused on a ground glass placed in
such a position that it is convenient for the operator to read, zero beingindicated by a black index mark on the ground glass. Lighter refer-
ence marks, used to determine the sensitivity, can be advantageouslyadded without confusing the observer. The ground glass should beso arranged that it can be displaced to compensate for small drifts in
the zero without readjusting the galvanometer.A very convenient direct-reading potentiometer indicator may be
obtained in which the galvanometer and standard cell are integral
parts of the instrument, and a room temperature compensator elimi-
nates the need for a specially controlled cold junction.
148938—33 5

64 Bureau of Standards Journal of Research [ Vol. 10
3. THE ILLUMINATING VIEWING APPARATUS
Figure 4 is a diagram of the essential optical parts of the viewingapparatus. Light from a source, H, which may be the capillary of a
helium tube, or a real image of the same, is made parallel by the lens,
L, and after reflection from the prism, R, falls on the interferometer
plates, A and B. Here the light partially reflected from the lower sur-
face of A and that from the upper surface of B is returned. Thatreflected from the upper surface of A is thrown to one side by virtue
of the angle of 20' between the two surfaces of A) and that from thelower surface of B is diffused, or reflected to one side in the same man-ner as that from the top of A. The reflected beams, from A lower andB upper, return nearly on their incident path and are brought to
focus in two real images, both of which must fall on the opening in the
~~ O S E
Fig. 4.
—
Diagram of optical parts of viewing instrument
diaphragm at P. When the central rays of these images are parallel,the telescope OSE focused for infinity will focus the fringes in thesame plane as the image of the plates. This brings the reference markon the lower surface of A into focus without parallax between it andthe fringes. 2
If two trains of waves from one point in a source havingtraveled different paths fall upon a point in the retina of the eye, theresultant amplitude of vibration determines the brightness. If theyare "in step" maximum brightness results. If, however, the "troughs"of one arrive with the "crests" of the other, destructive interferencetakes place resulting in relative darkness. If the two trains traveldifferent distances, so that the difference in path is some whole num-u 5-n-
WaVe lenSths >then the waves will reach the eye in phase. If
the difference in path is equal to some whole number of wave lengthsplus one-half wave length, the waves in the two trains will be in
• See footnote 2 on p. 65.

Merritt] Thermal Expansion Measurements 65
opposite phase, so that destructive interference will take place. 2 Inorder that these conditions may* be satisfied, the source H and theplate A must both be at the focal distance of the lens L from L. Asmall amount of deviation from these conditions may be compensatedfor by changing the focus of the telescope.
The lens L should be slightly canted so that light reflected from its
surfaces will be thrown out of the field, and the prism R should, for
the same reason, be slightly rotated about an axis normal to the planeof its hypotenuse.The following procedure is recommended
:
0, the objective of the telescope, should be brought close enoughto P to take in a large part of the two interfering beams from A andB. The telescope should be previously focused on a distant object;
and the cross wires, S, placed at the principal focus of 0. Then,with H at the principal focus of L, the distance from L to A via Rcan be correctly adjusted by raising or lowering a well illuminatedobject in the path of the beam until it is in focus when viewed throughthe whole system The larger plate, B, is then substituted for this
object; the eyepiece, E, removed and the light reflected from theupper surface of B brought into the field. If A, the smaller plate, is,
then laid directly on B and the eyepiece replaced, a set of fringes will
be seen. Likewise, any reference marks or other features on the sur-
faces of either of these plates will be seen to be in focus.
In order to energize the helium tube a high voltage current is needed.This is conveniently supplied by a 110 to 12,000 volt transformer of
the land used for the smaller neon signs. In order to prevent over-heating the tube, thus shortening its life, it is well to introduce aresistance of 100 to 150 ohms in series with the primary of the trans-
former. As a criterion, the bulbs at the ends of the helium tube shouldnot, in operation, be too hot to touch. Furthermore, the capillary
(which gets hotter than the ends of the tube) should not be allowedto get hot enough to give off sodium fight. A conveniently arrangedswitch will enable one to turn off the light when not in use, thus length-ening the life of the tube.
1 Extract from Theory of Optics, A. Schuster IV, p. 76.
The simplest case of a film of variablethickness would be presented by a trans-parent wedge (fig. 45).A plane wave AB falling on the wedge,
we may select one ray B'S reflected at Stoward P, and another, B"H, such thatafter refraction at II and reflexion at E, it
meets the upper surface at the same pointS. Owing to the inclination of the twosurfaces, the refracted ray SP' is not nowcoincident with SP, though the inclinationis small, if the angle of the wedge is small.The difference in optical length betweenthe two rays is 2y.e cos 7 or taking accountof the change of phase at reflexion, 2/ze
cos 7+5- In tnis expression e denotes the
length of the perpendicular from S to thelower surface of the plate (which may betaken as the thickness of the plate at S) and7 is the angle of incidence on the lower sur-
face. The inspection of the figure explainshow the expression is derived. Neglectingall rays which have suffered more than oneinternal reflexion, an eye placed so as to
receive both rays SP and SP' and focusedon S, will observe a maximum or minimumof light, according as 2ne cos 7 is an odd or
even multiple of half the wave length.

66 Bureau of Standards Journal of Research [Vol. 10
The interferometer plates A and B are of clear transparent fused
quartz and should not contain large bubbles or other imperfections.
The surfaces of each plate should be flat to one-fifth of a fringe or
better throughout the central parts and inclined to each other at anangle of about 20' for the reasons already explained. It is well to
choose A about 27 mm in diameter and B, slightly larger (30 mm).Both A and B should be 4 or 5 mm thick.
III. PREPARATION AND ADJUSTMENT OF THE SPECIMEN
The specimen consists of three elements which are placed betweenthe two interferometer plates A and B in contact with the lower sur-
face of A and the upper surface of B.
1. TYPES OF SAMPLE
The specimen is usually arranged as a tripod, the feet of whichmay be either projecting parts of the same piece of material, or consist
of three separate fragments. Metallic specimens or those already of
tubular form (such as glass tubing) are often constructed as rings.
Three scallops are, however, taken out of the upper and lower endsof this ring so that the specimen consists effectively of three perpen-dicular rods of the material joined by three bridgelike arches which donot touch either the top or the bottom plate. (See fig. 4.)
Massive materials which are easily cut and ground are usually madeinto rough pyramids, tetrahedrons, or cones. The bases of theseshould be concave or grooved so that each piece rests solidly on threefeet. The point of contact with the upper plate should be wellwithin the base limited by these contact points. Three such elements,each sitting solidly on its own feet, constitute a single specimen in
which the expansion obtained from a reference mark in the center of
the upper plate is an average of the expansions of all three,3
2. METHODS OF PREPARATION
Some of the softer terra cottas and clays can be roughed intoshape with a file or even scraped with a knife; harder ones must beground on a carborundum wheel, while glass and the harder ceramicmaterials can be best formed on a revolving cast-iron lap chargedwith carborundum powder in water. For shaping many of the smallspecimens it is very convenient to use a dentists' grinding motor withflexible shaft and a variety of steel and carborundum cutters. Afterbringing the three elements within a few hundredths of a millimeterof the same height in one of these ways, they are usually finishedon a dry carborundum knife stone of rather fine grain. The mostadvantageous length for the specimen is between 5 and 10 mm.A particular problem is presented in the preparation of glaze
samples. In this case a sample of the glazed body should be brokenup and a piece bearing an uncracked flake of glaze 3 or 4 mm longand perhaps half as wide, selected. The body is then ground awaymikI the sample inspected with a microscope to insure the removalof nil traces of undissolved body material. A binocular microscopei- preferable for this purpose. This flake, which may be as thin as0.2 mm and will probably not be thicker than 0.6 mm is measured
» J. Wash. Acad. Scl. vol. 9, No. 10, May 19. 1919.

Menitt] Thermal Expansion Measurements 67
by means of a micrometer and ground so that it is of the same thick-
ness along one edge ond very nearly plane parallel. It is then placedon a sheet of dark cardboard and very carefully broken with a needleor fine pointed knife into a number of small pieces. Three of these
pieces are selected and placed on the lower plate as is done with thelarger specimens, but in this case if the fringes are not of the right
width, it is better to substitute another piece from the number avail-
able than to grind one down. Usually no measurements are madewith the micrometer after the flake of glaze is broken into smallpieces. The less area these pieces have, the better, as there will
be less likelihood of included air films, etc. The only requirementis that they have wide enough bases compared with their heights,
to be stable.3. ADJUSTMENT
When the three elements of a specimen (whether separate pieces
or parts of a ring) are the same length as nearly as can be read on amicrometer caliper,4 they are ready for a trial between the plates.
First, the lower plate should be placed in the focus of the viewingapparatus and the reflection from its upper surface found. This is
distinguished by being clear and free from shadows of strise and other'
imperfections in the interior of the plate. A still better criterion is
the following:
If, when the reflection of a surface is found, the upper plate is laid
directly on the lower, fringes should be seen at once if the reflection
in question is that of the upper surface of B. If they do not appear,
Jor are faint and hazy, remove the upper plate and eyepiece of the
I observing s}7stem, and adjust the leveling screws until the reflection
of the other surface of B comes into the field. Then replace the eye-', piece and upper plate, when sharp black fringes should appear at
once.
When the reflection of the top surface has been located and theeyepiece is in place, the three elements of the specimen are placed onB at the corners of an equilateral triangle. The elements should bemoved slightly with the fingers in order to feel any grit which may
] have eluded the previous cleaning. If any is found, the elements1 should be removed and cleaned before proceeding. The plate, A,
is then held slightly above the specimen and turned about a vertical
axis into a position such that the refractive effect of the upper platewill not throw the light reflected from the lower plate out of the field.
When this position is found, the plate is set gently on top of thespecimen. If the micrometer has been used carefully, fringes shouldbe seen at once. If they are not visible, take a glass rod drawn to apoint about as fine as an ordinary pencil and press with this carefully
on the top plate near the reference mark. If this does not bringfringes into view, inspect the elements carefully to see that none of
them has been laid on its side. This is by no means an uncommonoccurrence, especially with specimens approximately tetrahedral in
shape. If all are found erect, they should be remeasured. It is wellto see if any one of them is, perhaps, a whole hundredth or tenth of amillimeter longer than another.
' The usual metric micrometer has divisions representing hundredths of a millimeter; an English instru-ment should have the smallest division 1/1000 inch. An effort should be made in either case to estimatetenths of the smallest division.

68 Bureau of Standards Journal oj Research [Voi.w
When the fringes have been found, press with the glass rod until
sure that the plates are resting in a position of stable equilibrium.
If the fringes are too wide or too narrow, the elements must beadjusted in length. When a slight pressure is exerted on the upperplate near the reference mark, the fringes move toward the thick side
of the space between the plates, that is, toward the longest of the
three elements. This indicates which one is to be shortened. It
should be remembered that the method by which the elements are
now being compared is far more sensitive than the micrometer,hence only a relatively slight change needs to be made.
4. INTRODUCING THE SPECIMEN INTO THE FURNACE
Having the fringes of the desired width, about 2 mm betweencenters, the plates and specimen, which now constitute an inter-
ferometer, may be picked up with a pair of cork-tipped tweezers andplaced in the bucket. This bucket should now be lowered carefully
into the furnace either by means of a long bail of thin platinum wirepermanently attached, or by a pair of internally expanding forcepswith small pins made to fit the holes near the upper edge of thebucket. If wire is used, it should be flexible enough to bend easily
out of the way. If forceps are used, the lid of the bucket, a porcelaindisk with a 2-cm hole in the center, must be put in after the bucketis set in place.
After the specimen has been let down into the furnace and theviewing apparatus adjusted, the glass rod should again be pressedagainst the center of plate A in order to make certain that nothinghas shaken loose during the transfer, and that the interferometer in
its container is resting solidly in the furnace. At this time it shouldbe noted which side of the interfererometer is the thicker. Theviewing apparatus is then swung to one side, the tube or thimblecontaining the fused quartz windows Wi and W2 put in, the coverwith the glass window W3 placed on top, and the viewing apparatusreturned and adjusted.5
IV. OBSERVATIONS TO BE MADE BEFORE STARTING THERUN
1. RECORDING THICK EDGE OF INTERFEROMETER
When making the last test with the glass rod, it is advisable,as already stated, just before closing the furnace, to place the rodnear the center of the upper plate and exert a slight downwardpressure in order to see that the plate is seated solidly. This pressureproduces a slight compression which shifts the fringes slightly towardthe thick side of the wedge-shaped space between the two plates.This direction should be noted. The fringes will move in the oppositedirection when the specimen expands. It is well to draw a smalldiagram of the field showing the position of the fringes and the ele-ments of the specimen, indicating which is the thick side of theinterferometer.
A convenient arrangement for adjusting specimens and transferring them to the furnace without thel
:• for readjusting the viewing apparatus is to have a stand set alongside of the furnace at a heightsuch that roedmena on it will bo the same distance from the table as they will be when in the furnace,i r tins .stand, or the furnace, or both can be leveled, it is possible to arrange things so that the viewing appa-ratus may be swung from one position to the other and will need very little or no change to be equally inadjustment for both positions.
*

MenM] Thermal Expansion Measurements 69
2. APERTURE OF IRIS DIAPHRAGM
The most advantageous aperture for the iris diaphragm in theobserving system should be determined and the diaphragm set there
before starting. This precaution is necessary because a changein the size of aperture shifts the observed position of the fringes,
which, during the run, would introduce an error of two-tenths or three-
tenths of a fringe. For runs which are to be carried to higher temper-atures, the aperture should be small in order to minimize the effect of
scattered light from the incandescant furnace. If, during the run,
the fringes become faint, the condition can probably be remediedby releveling the viewing instrument rather than by changing theaperture of the diaphragm.
3. INITIAL POSITION OF FRINGES
The position of the reference mark with respect to the nearestfringes should be noted and recorded. If the viewing apparatushas a movable cross wire in the eyepiece, it may be desirable to
measure this fraction with some accuracy, as its value is importantin the case of the smaller specimens or those of low expansion wherethe total expansion causes but few fringes to pass. In the case of mostspecimens, however, where the fringes cross the reference mark in
relatively rapid succession, the first fringe to cross may be taken as
zero and the temperature at the time of transit used as the "roomtemperature."
4. BALANCE OF STORAGE CELL AGAINST STANDARD CELL
The storage battery should then be balanced against the standardcell.
5. ZERO SETTING OF GALVANOMETER
The zero setting of the galvanometer can usually be accomplishedby moving the ground glass until the zero mark falls under the imageof the lamp filament.
6. SENSITIVITY OF GALVANOMETER
After the preceding adjustment the key of the potentiometershould be closed and the galvanometer deflection brought to zero
by moving the dials. Then, as a check on the sensitivity, one of thedials should be turned one step and the resulting deflection noted andcompared with previous readings.
7. INITIAL TEMPERATURE OF COLD JUNCTION AND FURNACE
The temperature of the cold junction should now be read and thedifference, if any, between it and the furnace recorded. Even whenusing the direct-reading potentiometer indicator which has the roomtemperature compensator, it is desirable to read and record the roomtemperature outside the furnace as well as the temperature indicatedby the thermocouple.
V. THE RUNEverything necessary for recording the results should be obtained
before turning on the heating current.
70 Bureau of Standards Journal of Research [ vol. 10
1. ADJUSTMENT OF THE HEATING CURRENT
Only experience with the individual furnace will reveal how muchcurrent is needed at a given temperature to produce a given heating
rate. Complete and accurate records of the heating current, times,
and resulting temperatures for a few runs will supply all the dataneeded for successful regulation. The heating schedule used in cali-
brating the furnace should be adhered to as closely as possible. Im-mediately after each observation of temperature, the rate should becalculated and the requisite changes in the heating current made. Aschedule of increments may be prepared for a particular furnace, butthis should be checked and revised from time to time, since the charac-teristics of a furnace change as the heating ribbon deteriorates withrepeated use.
With specimens of low thermal difTusivity or with thick specimensof materials of any kind, there will be a slower inflow of heat into thespecimen, so that the temperature indicated by the thermocouple mayexceed the average temperature of the specimen by an amount toogreat to neglect in cases where it is desirable to measure the expansionunder equilibrium conditions with a high degree of accuracy. This is
particularly true at the lower temperatures, say from room tempera-ture up 100° or 200°. In order to bring the specimen into equilibriumconditions with the least expenditure of time, it is well to make all
specimens as small as is practicable without sacrificing stability orsufficient height. Data for the amount of current necessary for hold-ing the temperature of the furnace constant should also be collected.
2. WATCHING THE FRINGES
It is important that the attention of the observer be constantly onhis work, as each passing fringe must be counted. There is no otherway of telling after a lapse of time whether the fringe on the referencemark is the first or the fifth to come into this position since the last
observation. To be sure, when the heating rate is constant and theform of the expansion curve of the material is known, less continuity ofattention is permissible because it is practically certain that the fringeswill follow each other at regular intervals; but unusual care shouldbe exercised wherever there is any uncertainty regarding the sub-stance or in the neighborhood of expected changes.
3. PREPARING TO READ THE TEMPERATUREThe potentiometer should be set before an expected temperature
reading. The galvanometer is then kept on zero by movements ofthe dials and at the same time the fringe is watched as it approachesthe reference mark. When the fringe is exactly on the mark, thesetting of the galvanometer is verified by a quick glance and the dialsallowed to remain in that position until read.
VI. RECORDS
Where the temperature is not to be read for every fringe, the timeof transit of each fringe should be recorded on a separate sheet ofpaper.

Merritt] Thermal Expansion Measurement^
A convenient record form is shown below:
73
Substance, glass.
X
Length of Specimen £o=0.7640 cm. Value of —0.3845.
22° CTemperature of cold junction
'
• Room temperature 23° C.
Date. Dec. 1.1922.Serial No. S 107.
Run No. 1.
Source. Glass section No. 43
I II III IV V VI VII VIII
Transit timeFringesN
X
Lo
Air '
correct-ion
AJDin
Poten-tiom-eterread-ings
Cor-rectedfor
coldjunction
Temper-ature
12.56
10
20
ju/cm
3.857.69
M/cm
.37
.62
M/cm
4.228.31
micro-volts
6303605
micro-volts
131428730
°C.23
1.55 701.28 112
In the first column is written the time of transit of the fringe
recorded in the second. In the sixth column is the reading of thepotentiometer at that time. In the seventh, this reading is correctedfor the temperature of the cold junction. 6 The eighth column is
derived from the seventh by means of Table 1 of the appendix.These columns are all filled in during the run. The number of thecoming fringe is recorded as soon as it is fully decided it is the nextone to be used. As soon as it is centered on the reference mark, thetime is read and recorded. Then the potentiometer is read and re-
corded, the correction added and the temperature found by reference
to the calibration table for the thermocouple.These operations consume time, so care must be exercised that no
fringe be allowed to pass unobserved while the attention is distracted.
If their movement is very rapid, it may be best to record only thetime, number of fringe, and microvolts until the region of rapid expan-sion has been passed.
VII. COMPUTING AND PLOTTING
The third, fourth, and fifth columns are calculated after completingthe run. The values of the third column are obtained by multiplyingthe number of fringes shown in the second column by a previously
X
calculated factor _2_ the equation
:
LoX
AL =N 2_ + air correction
rwhere N is the number of fringes, X is the wave length (in microns)
of the light used, and N ~ is the apparent amount in microns that the
6 This is done by adding the number of microvolts equivalent to the temperature of the cold junction tothe reading of the dials. If melting ice made from pure water is kept around the cold junction, this correc-tion reduces to zero.

70 Bureau of Standards Journal oj Research [Vol. 10
specimen has expanded. When this quantity is divided by theoriginal length of the specimen, L , in centimeters, we have AL, theexpansion of a centimeter of the material in microns. 7 To facilitate
* Xthe calculations, the factor 2_ is calculated separately. - for the yel-
T
low helium line is 0.29378/*. at 15° C. and 760 mm. The expression
2 does not give the true dilatation because the wave length of the
4C
£
oi.o
£
<
30
10
10
/
/
S/
/y100 100 300 ArOO 500 600
Temperature in Degrees Centigrade
Figure 5.
—
Sample thermal expansion curve
light is affected by the temperature and pressure 8 of the air betweenthe two plates. To correct for changes in temperature, Table 2 (seeAppendix), has been calculated from the data of Scientific Paper No.327. If the first temperature recorded is above 20° C. the entry inthe table opposite that number should be subtracted from each ofthe succeeding corrections. These corrections should be entered inthe fourth column. The fifth column is the sum of the third andfourth.
In plotting, the temperatures are laid off along the horizontal axisand the dilatation along the vertical axis. The fifth column is thenplotted against the eighth and the resulting graph is the expansionci nvo of the Bubstance. An example is shown in Figure 5. Theaverage coefficient of expansion for any temperature range is usually,for reasons of convenience, expressed in parts per million. To obtain
This la equivalent to "parts per ton thousand" or "hundredths of a per cent."• I he eiieci of QhaofM 10 i>ns: urc usually encountered during a run is negligible.

Merritt) Thermal Expansion Measurements 73
the average coefficient of expansion for a certain temperature range,
it is necessary to divide the change In length expressed in parts per
million by the number of degrees in this particular temperaturerange. For example, the average coefficient of expansion of iron
between 20° and 100° C. is 12 parts per 1,000,000 per °C. Thismay also be expressed as 12 X 10"° or 0.000012 per °C.
VIII. APPENDIXTable I.
—
Reference table for Pt. to Pt.-10 per cent Rh thermocouple
Emf-temperature relation for platinum to platinum-10 per cent rhodium thermocouples as calculated byAdams > from gas thermometer determinations made at the Geophysical Laboratory by Day and Sosman.
[Emfs are expressed in microvolts and temperatures in °C. Cold junctions at 0° C]
EMicrovolts 1,000 2,000
147.1 265.417.8 12.6 11.2
17.8 159.7 276.616.7 12.4 11.1
34.5 172.1 287.715.8 12.2 11.0
50.3 184.3 298.716.1 12.0 11.0
65.4 196.3 309.711 6 11.8 10.9
80.0 208.1 320.614.1 11.6 10.9
94.1 219.7 . 331.5IS. 7 11.6 10.8
107.8 231.2 342.3IS. 4 11.5 10.7
121.2 242.7 353.0ISA 11.4 10.7
134. 3 254.1 363.712.8 11. S 10.6
147.1 265.4 374.3
3,000 4,000 5,000 ,000 7,000 8,000
0...
100.
200.
300.
400.
500.
600.
700.
374.3
384.
'
395.4
405.
10.6)
10.5I
10.5}
10.4i
10.4
426.71
437.1
900..
1,000.
447.41
457.7
467.
10.4L
10. SI
10. s7
10.2)
10.2
478.1
.3
10.2I
10.14
10.15
10.1610.0
610.0
6
10.06
9.95
9.94
9.9
3
578.3
588.1
597.9
607.7
617.4
627.1
636.8
646.5
656.1
665.7
675.3
675.3
684.8
703.
713.3
9.5
9.5
9.5
9.5
9.4
722.7
732.1
750.9
760.2
769.5
769.5
778.8
788.0
797.2
806.4
815.6
824.7
833.8
942.9
852.0
861.1
9. 8
9.2
9.2
9.1
9.1
9.1
9.1
9.1
861.1
870.1
879.1
888.1
897.1
906.1
915.0
923.9
932.8
941.6
950.4
9.0
9.0
9.0
EMicrovolts ,000 10,000 11,000 12,000 13,000 14,000 15,000 16,000 17,000
0.-
100-
200-
300.
400.
500.
600.
700.
800-
900-
950.48
959.28
968.08
976.78
985.4S
994.18
1, 002. 8<S
1,011.5
1, 020.
1
8
1. 028. 7
037.38
045.98
054.48
062.98
071.4
079.9
088. 4
I
096.9I
105.4I
113.8
1,000. 1, 037. 3 1, 122. 2
1, 122. 2I
1, 130. 6I
1, 139.
I
1, 147. 4
i
1, 155. 8i
1, 164. 2I
1, 172. 5
I
1, 180. 9
I
1, 189. 2
I
1, 197. 6I
1, 205. 9
1, 205. 96
1, 214. 2
1, 222. 6
1, 230. 9
6
1, 239. 3
8
1, 247. 66
1, 255. 9
8
1, 264. 3
8
1, 272. 68
1, 281.
8
1, 289.
3
1. 289.
3
1, 297. 7
1, 306. o'
1, 314.3'
1, 322. 6
1, 330. 9
i
1, 339. 2I
1, 347. 5
I
1, 355. 8I
1, 364.
1
I
1, 372. 4
1, 372. 4i
1, 380. 7
I
1, 389.
I
1, 397. 3
I
1, 405. 6
i
1,413.
1, 422.
8
1, 430. 28
1, 438. 4
1, 446. 68.
,'
1, 454. 8
1, 454. 8t
1, 463.
I
1, 471. 2
I
1, 479. 4
I
1, 487. 7
i
1, 496.
I
1, 504. 3I
1, 512. 6
1, 520. 9
1, 529. 2
t
1, 537. 5
1, 537. 5
1, 545. 8
1, 554.
1
1, 562. 4
6
1, 570. 8
1, 579.
1
6
1, 587. 5
1, 595. 88
1, 604. 28
1, 612. 58
1, 620.
9
620.9I
629.2I
637.6I
645.9I
654.3I
662.6i
670.9I
679.3I
687.66
696.08
1, 704. 3
J. Am. Chem. Soc, vol. 36, p. 65; 1914; Int. Crit. Tables, vol. 1, p. 57; 1926.

74 Bureau of Standards Journal of Research f Vol. 10
Table 2.
—
Air corrections from 20° C. to X temperatures indicated (microns percentimeter)
[Atmospheric pressure, 760 mm]
Tem-Correc-
Tem-Correc-
Tem-Correc-
Tem-Correc-
Tem-Correc-'
Tem-Correc-
pera-ture
tionspera-ture
tionspera-ture
tionspera-ture
tionspera-ture
tionsjpera-ture
tions
20 0.00 70 0.40 142 0.80 252 1.20 439 1.60 840 2.001 .01 2 .41 4 .81 5 1.21 446 1.61 850 2.012 .02 4 .42 6 .82 8 1.22 453 1.62 870 2.023 .03 5 .43 8 .83 263 1.23 9 1.63 880 2.034 .04 6 .44 150 .84 6 1.24 466 1.64 900 2.04
5 .05 8 .45 4 .85 9 1.25 470 1.65 920 2.056 .06 80 .46 6 .86 273 1.26 480 1.66 940 2.067 . o;; 2 .47 8 .87 7 1.27 7 1.67 960 2.078 .08 3 .48 160 .88 280 1.28 493 1.68 980 2.089 .09 4 .49 3 .89 5 1.29 502 1.69 1,000 2.09
30 .10 6 .50 5 .90 9 1.30 510 1.70 1,020 2.102 .11 8 .51 8 .91 292 1.31 7 1.71 1,040 2.113 .12 9 .52 170 .92 6 1.32 521 1.72 1,060 2.125 .13 90 .53 3 .93 300 1.33 534 1.73 1,080 2.136 .14 2 .54 5 .94 5 1.34 542 1.74 1,100 2.14
7 .15 4 .55 8 .95 9 1.35 551 1.758 .16 6 .56 180 .96 313 1.36 9 1.76
40 .17 7 .57 3 .97 7 1.37 568 1.771 .18 8 .58 5 .98 320 1.38 578 1.782 .19 102 .59 8 .99 6 1.39 587 1.79
3 .20 3 .60 190 1.00 331 1.40 596 1.805 .21 4 .61 4 1.01 5 1.41 606 1.816 .22 6 .62 7 1.02 340 1.42 615 1.827 .23 8 .63 200 1.03 3 1.43 620 1.838 .24 110 .64 2 1.04 350 1.44 635 1.84
50 .25 2 .65 5 1.05 4 1.45 646 1.851 .26 4 .66 8 1.06 9 1.46 657 1.862 .27 6 .67 210 1.07 364 1.47 668 1.874 .28 8 .68 4 1.08 9 1.48 679 1.885 .29 9 .69 < 1.09 374 1.49 690 1.89
G .30 122 .70 220 1.10 8 1.50 700 1.907 .31 4 .71 3 1.11 386 1.51 712 1.919 .32 6 .72 6 1.12 392 1.52 726 1.92
61 .33 8 .73 9 1.13 7 1.53 740 1.933 .34 130 .74 232 1.14 403 1.54 752 1.94
4 .35 2 .75 5 1.15 9 1.55 766 1.9565 .36 4 .76 8 1.16 415 1.56 780 1.966 .37 6 .77 241 1.17 421 1.57 790 1.978 .38 8 .78 5 1.18 7 1.5S 810 1.989 .39 140 .79 9 1.19 433 1.59 820 1.99

Merritt) Thermal Expansion Measurements 75
Table 3.
—
Air corrections from 20° C. to low temperatures indicated {microns percentimeter)
Atmospheric pressure, 760 mm.
Tem- Cor- Tem- Cor- Tem- Cor- Tem- Cor- Tem- Cor- Tem- Cor-pera- rec- pera- rec- pera- rec- pera- rec- pera- rec- pera- rec-
ture tion ture tion ture tion ture tion ture tion ture tion
+20 0.00 -20 -0.43 -60 -1.02 -100 -1.89 -140 -3.27 -180 -5.8519 -.01 21 .44 61 1.04 101 1.91 141 3.32 181 5.9418 .02 22 .45 62 1.06 102 1.94 142 3.36 182 6.0417 .03 23 .47 63 1.07 103 1.97 143 • 3.41 183 6.1316 .04 24 .48 64 1.09 104 . 1.99 144 3.46 184 6.23
15 .05 25 .49 65 1.11 105 2.02 145 3.50 185 6.3314 .06 26 .51 66 1.13 106 2.05 146 3.55 186 6.4413 .07 27 .52 67 1.15 107 2.08 147 3.60 187 6.5412 .08 28 .53 68 1.17 108 2.11 148 3.65 188 6.6511 .09 29 .55 69 1.19 109 2.14 149 3.71 189 6.76
10 .10 30 .56 70 1.21 110 2.17 150 3.76 190 6.889 .11 31 .57 71 1.22 111 2.20 151 3.81 191 7.008 .12 32 .59 72 1.24 112 2.23 152 3.86 192 7.127 .13 33 .60 73 1.26 113 2.26 153 3.92 193 7.246 .14 34 .61 74 1.28 114 2.29 154 3.98 194 7.36
5 .15 35 .63 75 1.30 115 2.32 155 4.034 .16 36 .64 76 1.32 116 2.36 156 4.093 .17 37 .66 77 1.35 117 2.39 157 4.152 .18 38 .67 78 1.37 118 2.42 158 4.211 .19 39 .69 79 1.39 119 2.45 159 4.27
.20 40 .70 80 1.41 120 2.49 160 4.33-1 .21 41 .71 81 1.43 121 2.52 161 4.392 .22 42 .73 82 1.45 122 2.56 162 4.463 .23 43 .74 83 1.47 123 2.59 163 4.524 .24 44 .76 84 1.50 124 2.63 164 4.59
5 .25 45 .78 85 1.52 125 2.66 165 4.666 .26 46 .79 86 1.54 126 2.70 166 4.737 .28 47 .81 87 1.56 127 2.74 167 4.808 .29 48 .82 88 1.59 128 2.78 168 4.879 .30 49 .84 89 1.61 129 2.81 169 4.94
10 .31 50 .85 90 1.63 130 2.85 170 5.0211 .32 51 .87 91 1.66 131 2.89 171 5.0912 .33 52 .89 92 1.68 132 2.93 172 5.1713 .35 53 .90 93 1.71 133 2.97 173 5.2514 .36 54 .92 94 1.73 134 3.01 174 5.33
15 .37 55 .94 95 1.76 135 3.05 175 5.4116 .38 56 .95 96 1.78 136 3.10 176 5.4917 .39 57 .97 97 1.81 137 3.14 177 5.5818 .41 58 .99 98 1.83 138 3.18 178 5.6719 .42 59 1.00 99 1.86 139 3.23 179 5.76

76 Bureau of Standards Journal oj Research [ vol. w, Merriu]
1. COMPUTATIONS RELATING TO OXIDIZABLE SPECIMENS
In some cases, where the expansion of an oxidizable specimen is
desired and the formation of an oxide film during the run causes aspurious expansion to be introduced, the true expansion may often
be obtained by running two sets of specimens of different lengths of
the same material. The true expansion may then be calculated bythe following method, assuming that the oxide film is the same in
both cases.
Two samples are made up, Si and S2 . In this case /Si = 0.22 cm and#2 = 0.37 cm at 20° C.Over a temperature range (for example, 20° to 500°), Si shows an
apparent increase of 73.5 ju/cm and S2 shows an apparent increase of
70.0 /i/cm.
Apparent increase of Si Si = 73.5X0.22 = 16.17.
Apparent increase of S2 S2= 70.0 X 0.37 = 25.90.
Si = SiXCx(t2 -ti)+R (1)
where C= average coefficient expansion between tx and t2 and R = oxidefilm.
S2 = S2 xCx(t2 -ti)+R (2)
Subtract equation (1) from equation (2) after substituting numer-ical values.
16.17 = 0.22 XCX 480 +R25.90 = 0.37X^X480+59.73= (0.37-0.22) X (7X480
9.73
0.15X480
Washington, October, 1932
Q 73^nKviQn = 1^ 5 M/cm or 13.5 X10"6.