Embed Size (px)
Citation preview
The interpretation of image data for depositional
facies orientation used in building a Static
Model for the Harvey CO2 sequestration area.
A Report by ODIN Reservoir Consultants
For
Department of Minerals and Petroleum
April 2016
DMP/2016/2
Jon Willem Roestenburg
South West Hub CO2 Sequestration Confidential
Page 2 of 15 April 2016
LIST OF FIGURES .................................................................................................................................. 3
DECLARATION ....................................................................................................................................... 4
NOTE: ...................................................................................................................................................... 4
1. SUMMARY AND CONCLUSIONS .................................................................................................. 5
2. INTRODUCTION .............................................................................................................................. 6
2.1 OBJECTIVES OF THE EVALUATION ................................................................................................. 6 2.2 SCOPE OF WORK – GEOLOGICAL MODELLING ............................................................................... 6 2.3 DATA PACKAGE ........................................................................................................................... 6 2.4 PROCESSING AND METHODOLOGY ............................................................................................... 6 2.5 INTERPRETATION ......................................................................................................................... 8
2.5.1 Cross referencing to real rock and analogue data ............................................................. 8 2.6 DEFINING ORIENTATION ON PLANAR FEATURES ............................................................................. 9
2.6.1 Non planar features ......................................................................................................... 10 2.7 STRUCTURAL DIP DETERMINATION AND COMPENSATION ............................................................... 11 2.8 INCORPORATING IMAGE DERIVED DATA WITH THE STATIC MODEL .................................................. 11
2.8.1 Depositional facies generation ......................................................................................... 11 2.8.2 Depositional Orientation ................................................................................................... 13
2.9 CONCLUSION ............................................................................................................................. 15
South West Hub CO2 Sequestration Confidential
Page 3 of 15 April 2016
List of Figures
Figure 1 Distribution or XRMI buttons representing individual log curves from which a interpolated
image is generated ........................................................................................................ 7 Figure 2 Results of depth adjustments by depth shifting buttons and rows and remove irregular tool
motion to align well crossing features. Pre depth shift image is on the left. ................. 8 Figure 3 Computing dip and azimuth along planar bedding and classification into geological dip sets
such as planar bedding and fractures ........................................................................... 9 Figure 4 Stereographic presentation of dip and azimuth data by classified dip sets showing fracture
populations at left and crossbedding at right ............................................................... 10 Figure 5 Non planar image features and their geological classification ............................. 11 Figure 6 Presentation of image log data, derived dip sets and depositional facies ........... 12 Figure 7 Depositional orientation ........................................................................................ 14
South West Hub CO2 Sequestration Confidential
Page 4 of 15 April 2016
Declaration
ODIN Reservoir Consultants has been commissioned to undertake to provide a review of the GSWA Harvey-1 Reservoir Simulation for Carbon Capture and Storage – Western Australia on Project on behalf of The Department of Minerals and Petroleum, (DMP) The evaluation of Carbon Capture and Storage is subject to uncertainty because it involves judgments on many variables that cannot be precisely assessed, including CO2 sequestration rates and capture, the costs associated with storing these volumes, sequestration gas distribution and potential impact of fiscal/regulatory changes. The statements and opinions attributable to us are given in good faith and in the belief that such statements are neither false nor misleading. In carrying out our tasks, we have considered and relied upon information supplied by the DMP and available in the public domain. Whilst every effort has been made to verify data and resolve apparent inconsistencies, neither ODIN Reservoir Consultants nor its servants accept any liability for its accuracy, nor do we warrant that our enquiries have revealed all of the matters, which an extensive examination should disclose. We believe our review and conclusions are sound but no warranty of accuracy or reliability is given to our conclusions. Neither ODIN Reservoir Consultants nor its employees has any pecuniary interest or other interest in the assets evaluated other than to the extent of the professional fees receivable for the preparation of this report Note: ODIN has conducted the attached independent technical evaluation with the following internationally recognised specialists: Jon Roestenburg Jon is a Petroleum Geologist and Leadership advocate with global experience involving technical, managerial, educational and corporate roles. Jon has worked in large, multi-national corporations with experience in onshore USA, Central Asia, Russia, China, Japan, Southeast Asia and Australasia. Jon is an expert in the application of borehole log and Image log data to the reconstruction of contextual subsurface geological architecture. Jon has applied his borehole image analysis expertise to a diverse range of geological applications ranging from depositional environment analysis, sedimentology, diagenesis, brittle deformation styles, structural geology and geobody orientation in a wide variety of basins, deformational terrains, conventional and unconventional petroleum systems and mineral deposits.
South West Hub CO2 Sequestration Confidential
Page 5 of 15 April 2016
1. SUMMARY AND CONCLUSIONS
A key component of building a facies property in a static model is the orientation of the
facies units based on the understanding or interpretation of the depositional
environment. Both Harvey-1 and Harvey-4 wells of the South West Hub CO2
sequestration project contain image log data from which depositional facies units and
their orientation were derived. Dip and azimuth measurements on bedding planes and
sedimentary structures that have been recognised on image log data are critical to
determining the orientation of the bedding, the structural setting, the brittle deformation
and the facies orientation for use in the static model.
Both well data sets were processed (reprocessed in the case of Harvey-1) so that a
consistent interpretation and outcome would be achieved. Over 16,000 dip and
azimuth measurements were made and form the basis of the depositional models and
their orientation after structural dip compensation. These depositional units in turn
were used to develop the oriented facies units that are imported into the static model.
Conformable and stratigraphically persistent dips and azimuths were derived from
image data acquired over nearly three kilometres of vertical section.
The results indicate that the dominant pre structural orientation of braided fluvial
depositional facies in the Wonnerup Member is E and NE derived from planar cross
bedding, co-sets, vertically consistent and cumulative cross strata and depositional
facies. A consistent palaeo-depostional orientation exists for the fluvial point bar
sandstone units that dominate the Yalgorup Member. For the purposes of modelling,
the two environments are classified as “fluvial” since the respective geobodies are in
the same direction.
South West Hub CO2 Sequestration Confidential
Page 6 of 15 April 2016
2. INTRODUCTION
2.1 Objectives of the Evaluation
The objective of this study is to derive depositional facies and their orientation from the
Harvey-1 and Harvey-4 borehole image data, and to develop a reservoir linked facies
unit distribution that can be used in the static model of the Harvey area.
2.2 Scope of Work – Geological Modelling
The scope of this project is to derive dip and azimuth data from processed image logs,
determine the structural dip and remove it, then establish the depositional facies and
orientation based on Harvey-4 XRMI and Harvey-1 STAR data.
2.3 Data Package
Both Harvey-1 and Harvey-4 have image log data that has been utilised in this project:
Harvey-1: Harvey-1_STAR_RAW_1285-2723m
Harvey-4: Harvey 4_S2R2_XRMI_Main_250-1784.0m
In addition to these log data files the derived image based dip, azimuth and facies data,
the project referenced facies distribution within the accepted analogue models for the
Wonnerup Member based on the Brahmaputra River Braided fluvial systems and
channel orientation models and analogues for meandering fluvial systems for the
overlying Yalgorup Member.
2.4 Processing and Methodology
Image Log Processing is an involved and computationally intensive process requiring
specialist software and processing to allow the accurate spatial alignment of individual
current curves or acoustic impulses necessary to create the circumferential borehole
image – a suitable colour scale, such as “earth tones” is then applied to the individual
curves to generate an image through interpolation.
South West Hub CO2 Sequestration Confidential
Page 7 of 15 April 2016
Processing starts with data loading, button to button and pad to pad alignments through
tilt arm corrections, borehole eccentricity corrections including borehole erosion
(washout) and corrections for hole deviation, relative bearing and azimuth (rotation
away from true and magnetic north – essential for orientation and dip computation) and
instantaneous tool acceleration corrections.
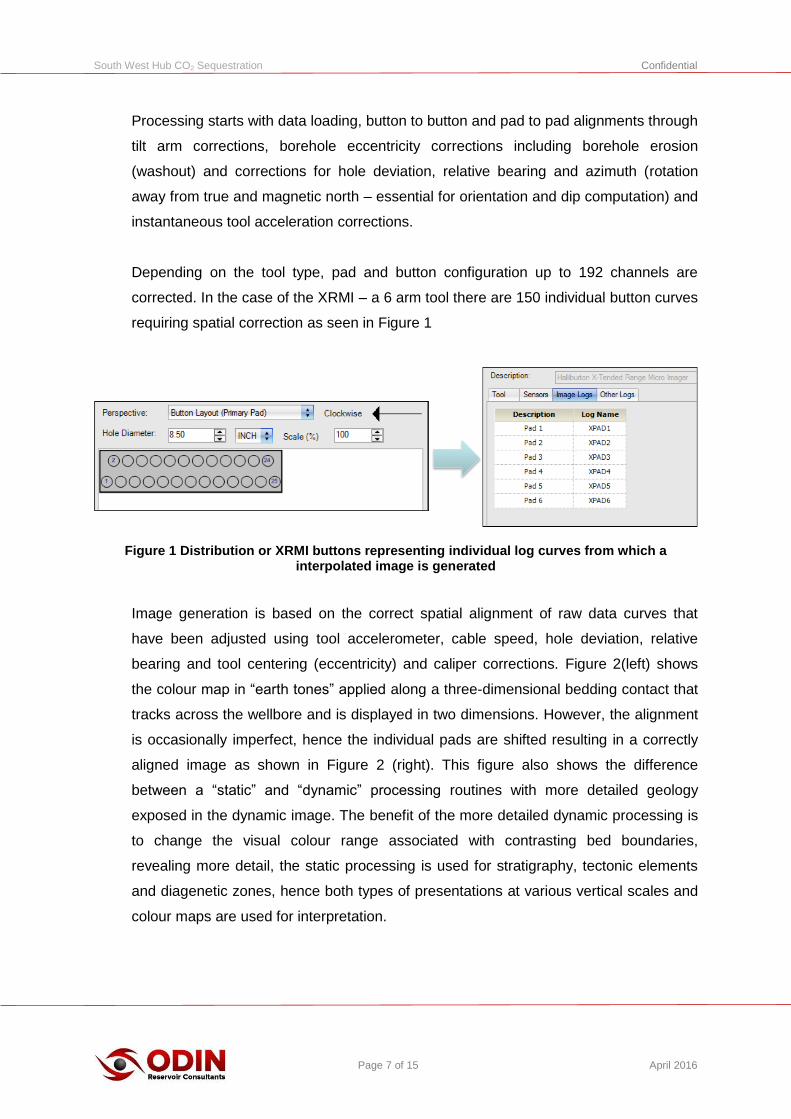
Depending on the tool type, pad and button configuration up to 192 channels are
corrected. In the case of the XRMI – a 6 arm tool there are 150 individual button curves
requiring spatial correction as seen in Figure 1
Figure 1 Distribution or XRMI buttons representing individual log curves from which a interpolated image is generated
Image generation is based on the correct spatial alignment of raw data curves that
have been adjusted using tool accelerometer, cable speed, hole deviation, relative
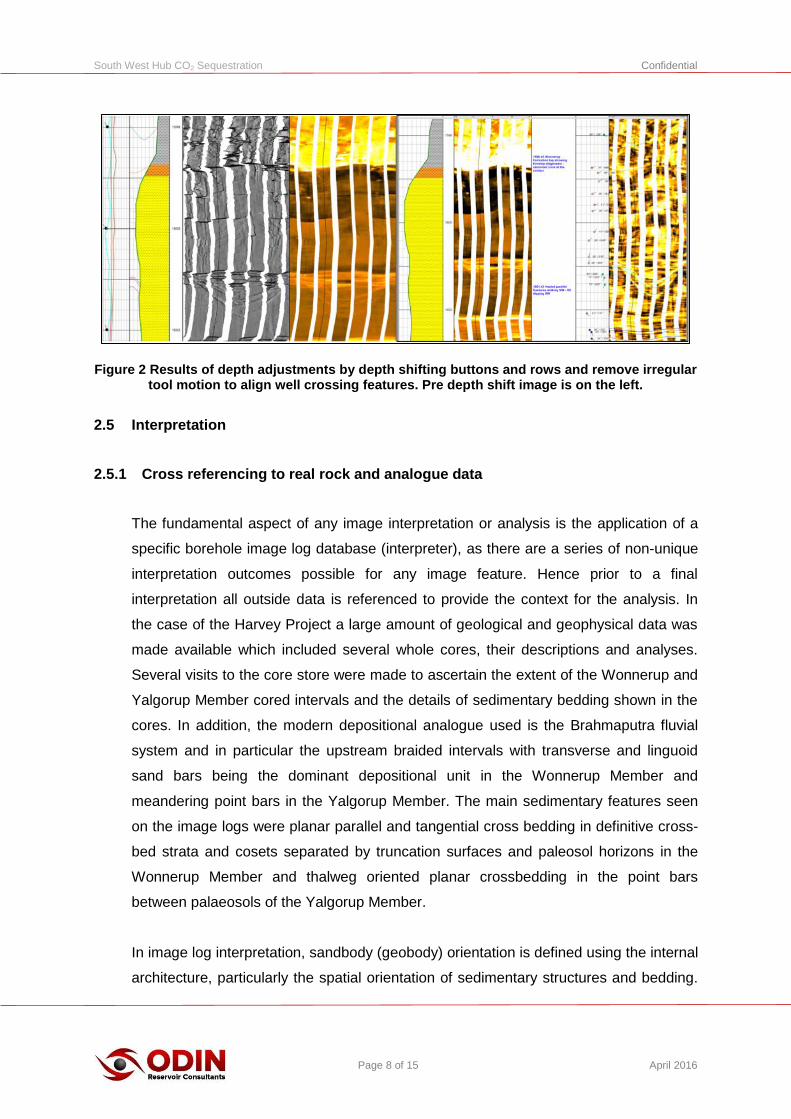
bearing and tool centering (eccentricity) and caliper corrections. Figure 2(left) shows
the colour map in “earth tones” applied along a three-dimensional bedding contact that
tracks across the wellbore and is displayed in two dimensions. However, the alignment
is occasionally imperfect, hence the individual pads are shifted resulting in a correctly
aligned image as shown in Figure 2 (right). This figure also shows the difference
between a “static” and “dynamic” processing routines with more detailed geology
exposed in the dynamic image. The benefit of the more detailed dynamic processing is
to change the visual colour range associated with contrasting bed boundaries,
revealing more detail, the static processing is used for stratigraphy, tectonic elements
and diagenetic zones, hence both types of presentations at various vertical scales and
colour maps are used for interpretation.
South West Hub CO2 Sequestration Confidential
Page 8 of 15 April 2016
Figure 2 Results of depth adjustments by depth shifting buttons and rows and remove irregular tool motion to align well crossing features. Pre depth shift image is on the left.
2.5 Interpretation
2.5.1 Cross referencing to real rock and analogue data
The fundamental aspect of any image interpretation or analysis is the application of a
specific borehole image log database (interpreter), as there are a series of non-unique
interpretation outcomes possible for any image feature. Hence prior to a final
interpretation all outside data is referenced to provide the context for the analysis. In
the case of the Harvey Project a large amount of geological and geophysical data was
made available which included several whole cores, their descriptions and analyses.
Several visits to the core store were made to ascertain the extent of the Wonnerup and
Yalgorup Member cored intervals and the details of sedimentary bedding shown in the
cores. In addition, the modern depositional analogue used is the Brahmaputra fluvial
system and in particular the upstream braided intervals with transverse and linguoid
sand bars being the dominant depositional unit in the Wonnerup Member and
meandering point bars in the Yalgorup Member. The main sedimentary features seen
on the image logs were planar parallel and tangential cross bedding in definitive cross-
bed strata and cosets separated by truncation surfaces and paleosol horizons in the
Wonnerup Member and thalweg oriented planar crossbedding in the point bars
between palaeosols of the Yalgorup Member.
In image log interpretation, sandbody (geobody) orientation is defined using the internal
architecture, particularly the spatial orientation of sedimentary structures and bedding.
South West Hub CO2 Sequestration Confidential
Page 9 of 15 April 2016
In addition, primary sedimentary structures are related to the depositional process and
the energy (which is classified using the dip magnitude). In the Harvey Project, the
direction of planar and tangential cross bedding is the most informative sedimentary
structure for defining the depositional orientation.
2.6 Defining Orientation on planar features
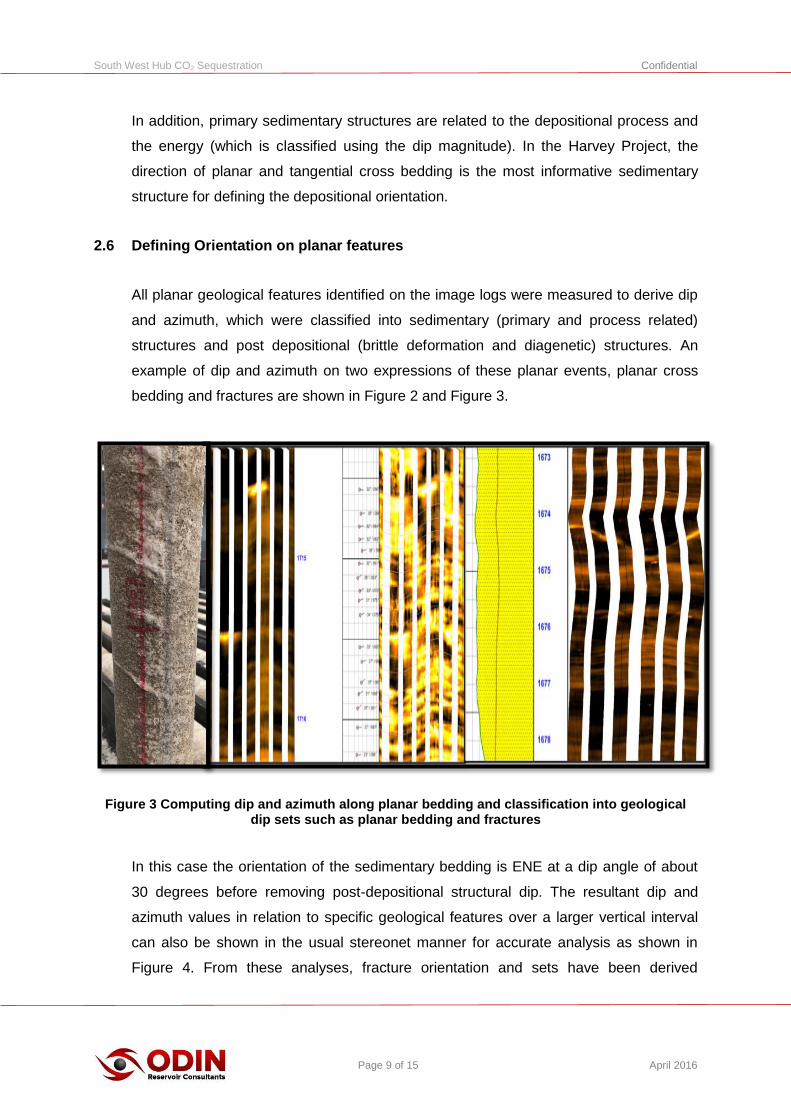
All planar geological features identified on the image logs were measured to derive dip
and azimuth, which were classified into sedimentary (primary and process related)
structures and post depositional (brittle deformation and diagenetic) structures. An
example of dip and azimuth on two expressions of these planar events, planar cross
bedding and fractures are shown in Figure 2 and Figure 3.
Figure 3 Computing dip and azimuth along planar bedding and classification into geological dip sets such as planar bedding and fractures
In this case the orientation of the sedimentary bedding is ENE at a dip angle of about
30 degrees before removing post-depositional structural dip. The resultant dip and
azimuth values in relation to specific geological features over a larger vertical interval
can also be shown in the usual stereonet manner for accurate analysis as shown in
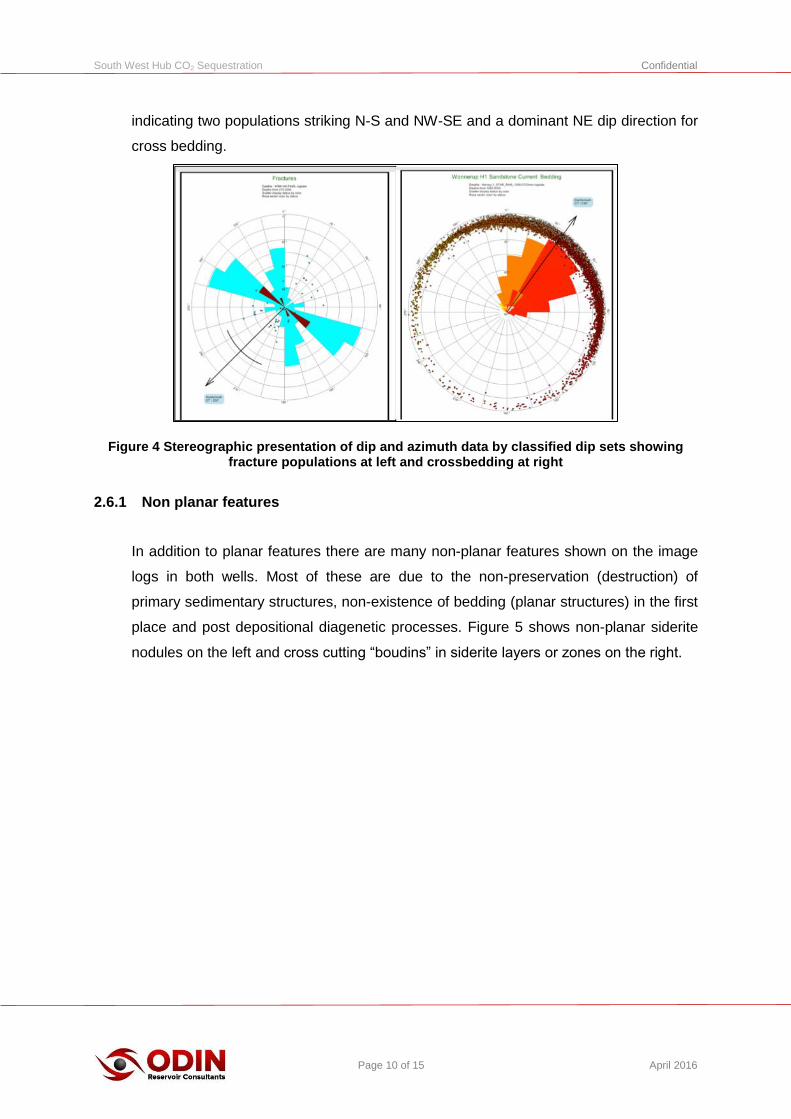
Figure 4. From these analyses, fracture orientation and sets have been derived
South West Hub CO2 Sequestration Confidential
Page 10 of 15 April 2016
indicating two populations striking N-S and NW-SE and a dominant NE dip direction for
cross bedding.
Figure 4 Stereographic presentation of dip and azimuth data by classified dip sets showing fracture populations at left and crossbedding at right
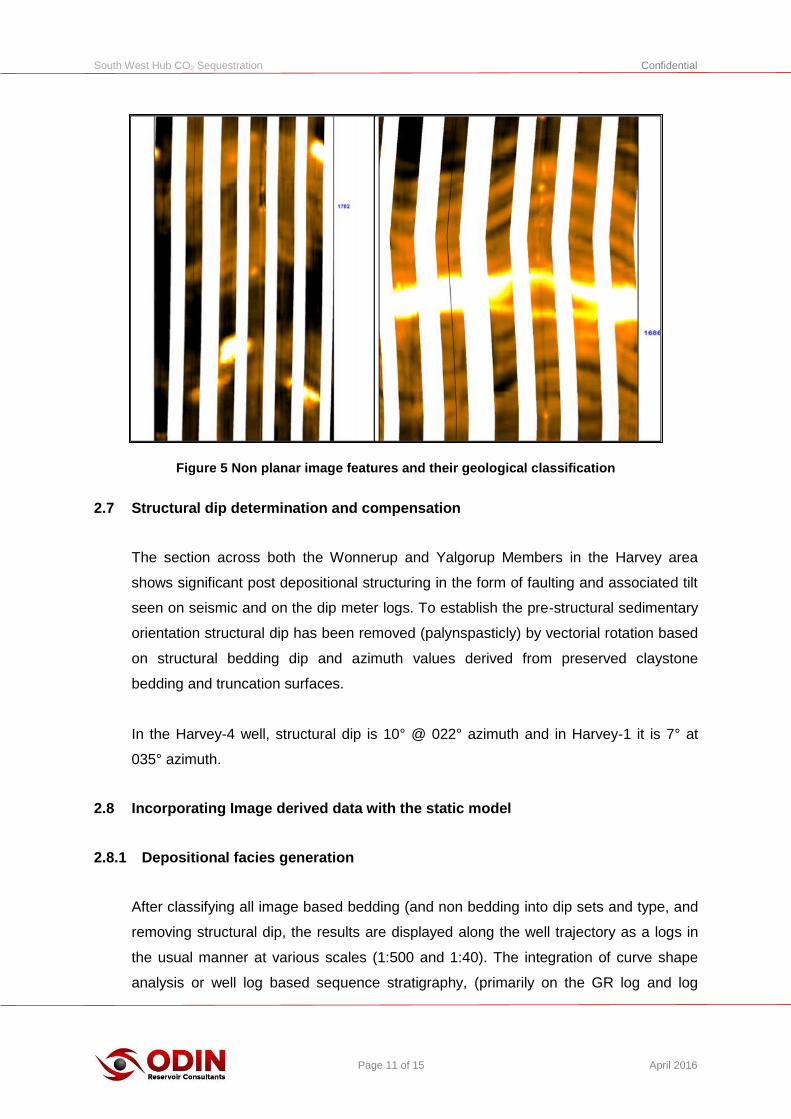
2.6.1 Non planar features
In addition to planar features there are many non-planar features shown on the image
logs in both wells. Most of these are due to the non-preservation (destruction) of
primary sedimentary structures, non-existence of bedding (planar structures) in the first
place and post depositional diagenetic processes. Figure 5 shows non-planar siderite
nodules on the left and cross cutting “boudins” in siderite layers or zones on the right.
South West Hub CO2 Sequestration Confidential
Page 11 of 15 April 2016
Figure 5 Non planar image features and their geological classification
2.7 Structural dip determination and compensation
The section across both the Wonnerup and Yalgorup Members in the Harvey area
shows significant post depositional structuring in the form of faulting and associated tilt
seen on seismic and on the dip meter logs. To establish the pre-structural sedimentary
orientation structural dip has been removed (palynspasticly) by vectorial rotation based
on structural bedding dip and azimuth values derived from preserved claystone
bedding and truncation surfaces.
In the Harvey-4 well, structural dip is 10° @ 022° azimuth and in Harvey-1 it is 7° at
035° azimuth.
2.8 Incorporating Image derived data with the static model
2.8.1 Depositional facies generation
After classifying all image based bedding (and non bedding into dip sets and type, and
removing structural dip, the results are displayed along the well trajectory as a logs in
the usual manner at various scales (1:500 and 1:40). The integration of curve shape
analysis or well log based sequence stratigraphy, (primarily on the GR log and log
South West Hub CO2 Sequestration Confidential
Page 12 of 15 April 2016
derived lithology), dipmeter interpretation (pattern analysis) and geological setting
characteristics are then used to interpret the log and dip response as depositional
facies.
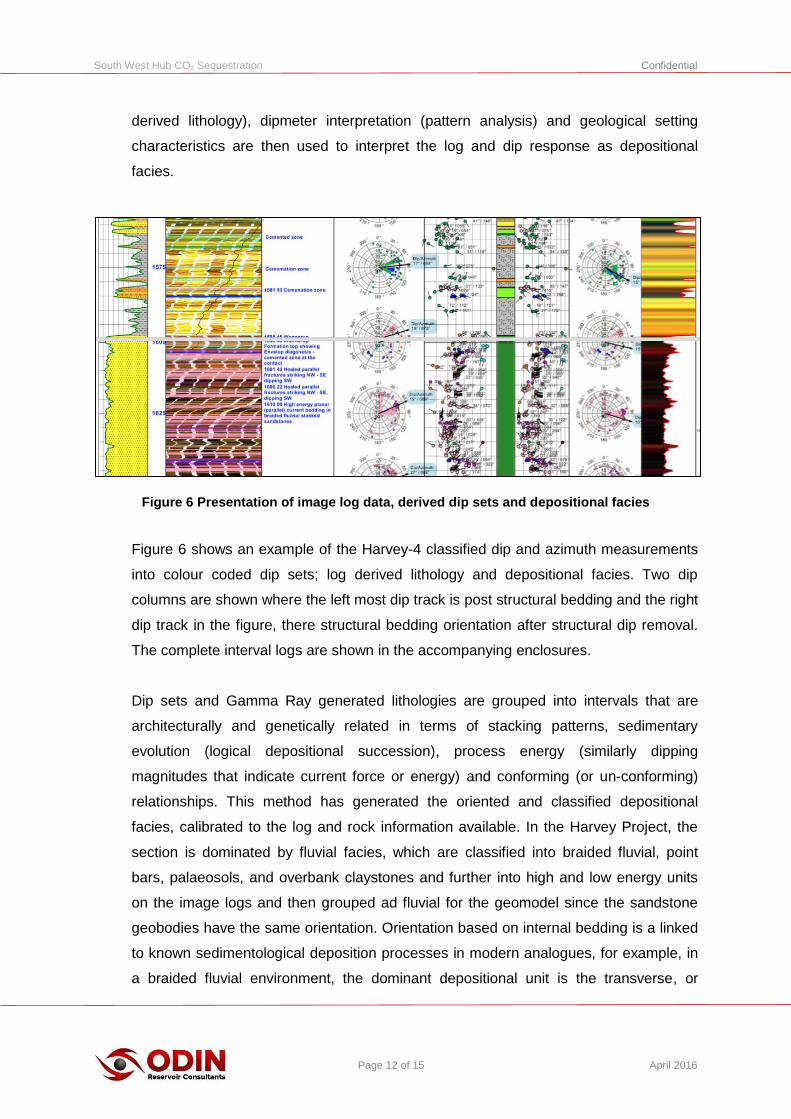
Figure 6 Presentation of image log data, derived dip sets and depositional facies
Figure 6 shows an example of the Harvey-4 classified dip and azimuth measurements
into colour coded dip sets; log derived lithology and depositional facies. Two dip
columns are shown where the left most dip track is post structural bedding and the right
dip track in the figure, there structural bedding orientation after structural dip removal.
The complete interval logs are shown in the accompanying enclosures.
Dip sets and Gamma Ray generated lithologies are grouped into intervals that are
architecturally and genetically related in terms of stacking patterns, sedimentary
evolution (logical depositional succession), process energy (similarly dipping
magnitudes that indicate current force or energy) and conforming (or un-conforming)
relationships. This method has generated the oriented and classified depositional
facies, calibrated to the log and rock information available. In the Harvey Project, the
section is dominated by fluvial facies, which are classified into braided fluvial, point
bars, palaeosols, and overbank claystones and further into high and low energy units
on the image logs and then grouped ad fluvial for the geomodel since the sandstone
geobodies have the same orientation. Orientation based on internal bedding is a linked
to known sedimentological deposition processes in modern analogues, for example, in
a braided fluvial environment, the dominant depositional unit is the transverse, or
South West Hub CO2 Sequestration Confidential
Page 13 of 15 April 2016
linguiod bars, whose orientation, given by downstream (slope) avalanching cross
bedding is oblique to the downstream elongation direction of the braid plain. Generally,
an azimuth spread of around 35° – 45° occurs between successive bar orientations and
the main downstream depositional vector direction. Most of the Wonnerup Member
cross bedding is of this type. Within the younger Yalgorup Member, dominated by a
meandering fluvial system the cross-bedding is within point bars with helicoidal cross
bedding, dipping towards the channel thalweg. The geobody elongation direction is
orthogonal to the direction of internal bedding dip.
2.8.2 Depositional Orientation
The dip vectors (dip and azimuth) have been grouped according to a range in azimuth.
Three groups or azimuthal classes are defined as: E-NE (red), NE-N (Orange), and N-
NW (yellow). These groups were assigned based on their vertical occurrence along the
well trajectory as shown in Figure 7. This classification was applied to both Harvey-1
and Harvey-4 for consistency and vertical continuity.
South West Hub CO2 Sequestration Confidential
Page 14 of 15 April 2016
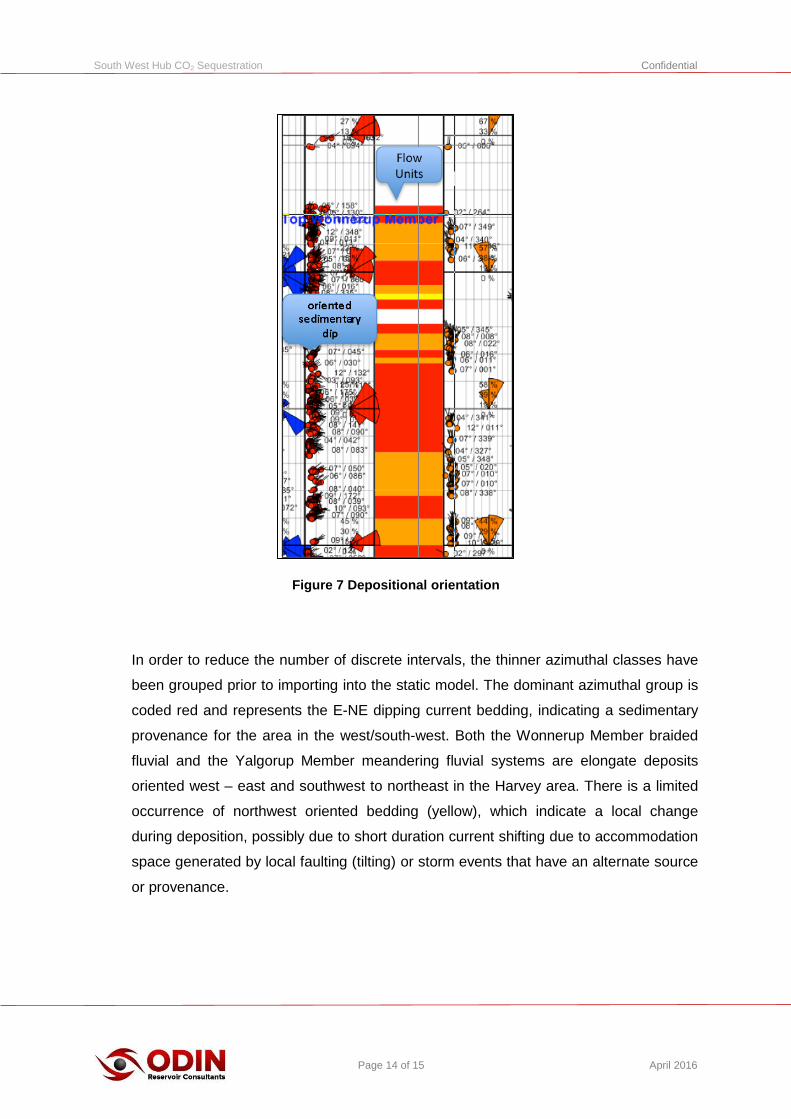
Figure 7 Depositional orientation
In order to reduce the number of discrete intervals, the thinner azimuthal classes have
been grouped prior to importing into the static model. The dominant azimuthal group is
coded red and represents the E-NE dipping current bedding, indicating a sedimentary
provenance for the area in the west/south-west. Both the Wonnerup Member braided
fluvial and the Yalgorup Member meandering fluvial systems are elongate deposits
oriented west – east and southwest to northeast in the Harvey area. There is a limited
occurrence of northwest oriented bedding (yellow), which indicate a local change
during deposition, possibly due to short duration current shifting due to accommodation
space generated by local faulting (tilting) or storm events that have an alternate source
or provenance.
South West Hub CO2 Sequestration Confidential
Page 15 of 15 April 2016
2.9 Conclusion
Over 16000 dip and azimuth measurements were made over the Wonnerup and
Yalgorup Members at the Harvey-1 and Harvey-4 locations. The image log data sets
from Harvey-1 and Harvey-4 - which cover nearly three kilometres of vertical section
(2972m) - have been processed, analysed and interpreted to derive azimuthal
classes/groups for inclusion in the static model. The orientation is dominated by east to
northeast depositional units with a sub dominant northeast to north facies distribution
for both members. This information has been incorporated into the static geological
model of the Harvey area.