Embed Size (px)
Citation preview
Abstract—This study experimentally and numerically investigates
motor cooling performance. The motor consists of a centrifugal fan, two axial fans, a shaft, a stator, a rotor and a heat exchanger with 637 cooling tubes. The pressure rise-flow rate (P-Q) performance curves of the cooling fans at 1800 rpm are tested using a test apparatus complying with the Chinese National Standard (CNS) 2726. Compared with the experimental measurements, the numerical analysis results show that the P-Q performance curves of the axial fan and centrifugal fan can be estimated within about 2% and 6%, respectively. By using the simplified model, setting up the heat exchanger and stator as porous media, the flow field in the motor is calculated. By using the results of the flow field near the rotor and stator, and subjecting the heat generation rate as a boundary condition, the temperature distributions of the stator and rotor are also calculated. The simulation results show that the calculated temperature of the stator winding near the axial fans is lower by about 5% than the measured value, and the calculated temperature of the stator core located at the center of the stator is about 1% higher than the measured value. Besides, discussion is made to improve the motor cooling performance.
Keywords—Motor cooling, P-Q performance curves, CNS, porous media.
I. INTRODUCTION OTORS are widely used in our lives, but heating becomes a key consideration in the production of motor.
Overheating will result in decreasing motor’s lifetime. Hence, how to reduce cost and to get optimized performance is necessary to make efforts. Through CFD (Computational Fluid Dynamics) codes, it will be useful to understand the heat transfer in motors and to improve the thermal management of motors. In order to enhance motor performance, many studies dedicated on performance prediction and optimization of fans [1-6]. A good fan influences the motor’s cooling capacity, including its geometry and blade number. Besides, the noise and vibration generated from the fans is a key point which needs to propose methods lowering its decibels. Concerning the motor temperature, power dissipation and motor thermal
Chih-Chung Chang is with the Department of Mechanical Engineering, National Taiwan University, Taiwan (e-mail: [email protected]).
Sy-Chi Kuo is with the Department of Mechanical Engineering, National Taiwan University, Taiwan (e-mail: [email protected])
Chen-Kang Huang is with the Department of Bio-Industrial Mechatronics Engineering, National Taiwan University, Taiwan (e-mail: [email protected]).
Sih-Li Chen is with Department of Mechanical Engineering, National Taiwan University, Taiwan (phone: 886-2-23621808; fax: 886-2-23631755; e-mail: [email protected]).
resistance can be considered to determine the motor temperature [7]. Due to the convective heat transfer, which depends on the flow structure in an enclosed motor cooling system, the fluid flow in an enclosed electrical motor is studied by numerical methods [8]. About the study of the motor performance, using CFD modeling techniques investigates thermal management of motors. [9-13].
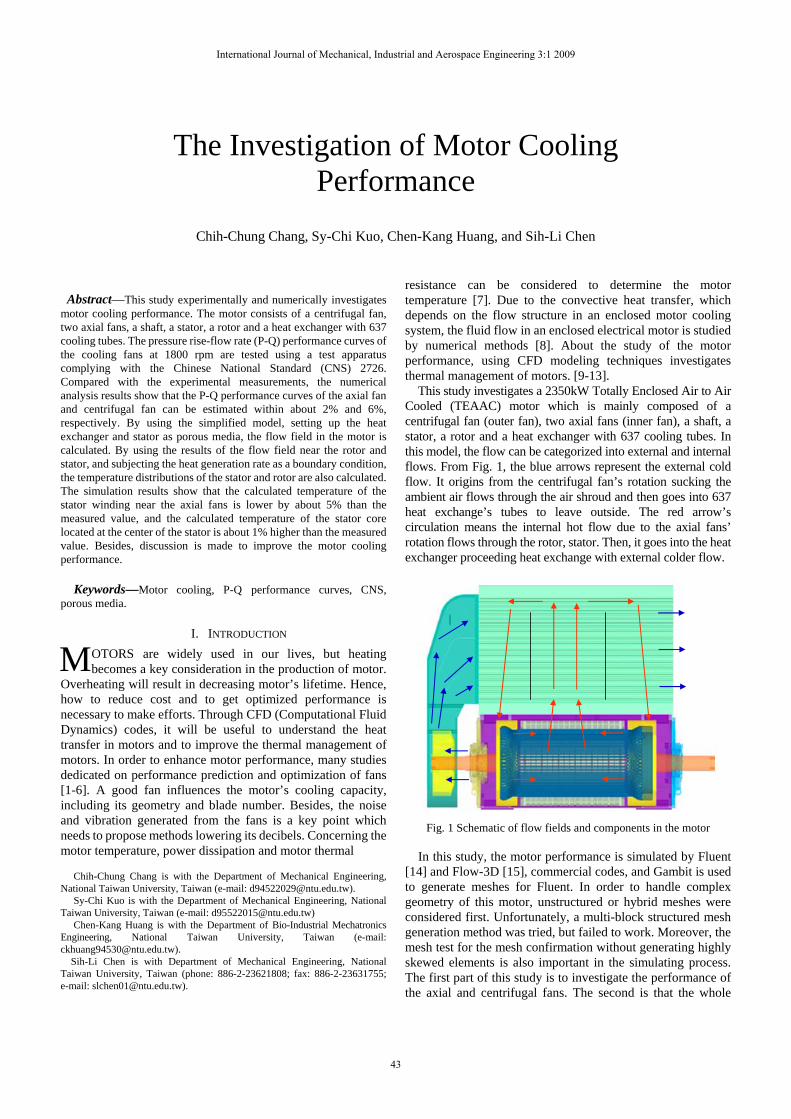
This study investigates a 2350kW Totally Enclosed Air to Air Cooled (TEAAC) motor which is mainly composed of a centrifugal fan (outer fan), two axial fans (inner fan), a shaft, a stator, a rotor and a heat exchanger with 637 cooling tubes. In this model, the flow can be categorized into external and internal flows. From Fig. 1, the blue arrows represent the external cold flow. It origins from the centrifugal fan’s rotation sucking the ambient air flows through the air shroud and then goes into 637 heat exchange’s tubes to leave outside. The red arrow’s circulation means the internal hot flow due to the axial fans’ rotation flows through the rotor, stator. Then, it goes into the heat exchanger proceeding heat exchange with external colder flow.
Fig. 1 Schematic of flow fields and components in the motor
In this study, the motor performance is simulated by Fluent
[14] and Flow-3D [15], commercial codes, and Gambit is used to generate meshes for Fluent. In order to handle complex geometry of this motor, unstructured or hybrid meshes were considered first. Unfortunately, a multi-block structured mesh generation method was tried, but failed to work. Moreover, the mesh test for the mesh confirmation without generating highly skewed elements is also important in the simulating process. The first part of this study is to investigate the performance of the axial and centrifugal fans. The second is that the whole
The Investigation of Motor Cooling Performance
Chih-Chung Chang, Sy-Chi Kuo, Chen-Kang Huang, and Sih-Li Chen
M
International Journal of Mechanical, Industrial and Aerospace Engineering 3:1 2009
43

motor’s flow field, pressure field and temperature near the stator and rotor is discussed. In order to demonstrate the accuracy of the model, the calculation results of the fan performance and stator temperature will be compared with the experimental data.
II. NOMENCLATURE
Op output power, W ω rotating speed, rpm M imposing momentum on the fan, N-m Effs static pressure efficiency, % Ps static pressure, Pa Q volume flow rate, m3/s
III. FAN MODEL Fig. 2 shows the schematics of the axial and centrifugal fans,
respectively. The axial fan is composed of 9 blades and the centrifugal fan consists of 12 blades.
(a) Axial fan (b) Centrifugal fan
Fig. 2 Schematics of axial fan and centrifugal fan
Before solving the problem by Fluent, several assumptions of numerical analysis for Fluent are setup. It is assumed that the working fluid is a Newtonian and incompressible one. Steady state simulation is adopted, and the influences of gravity, buoyancy and temperature variation are neglected. Fig. 3 exhibits the boundary condition of the fan model. Pressure inlet and pressure outlet boundary conditions are imposed in the model. To assure the flow that can uniformly flow into the tunnel, the large cubic block near the model of the inlet side is required. The fan rotates at 1800 RPM. In this work, the highly detailed geometry makes mesh generation very difficult. The fan model based on a hybrid mesh setting is usually recommended. Furthermore, the mesh domain near the fan blades will be densely generated because of the complicated geometry. To reduce the iteration time and to make the iteration stable, the fan motion using the moving reference frame method rather than moving the mesh of the fan blades is initialized.
(a) Axial fan
(b)Centrifugal fan
Fig. 3 Boundary setup for axial fan and centrifugal fan
To examine calculated precision of the fan performance, fig. 4 illustrates the P-Q performance curves of the centrifugal fan and axial fan, respectively. According to the variation of the pressure drop across of the fan, the mass flow rate can be calculated. The computed mass flow rates are almost 2% and 6% larger than the experimental values tested using a Chinese National Standards (CNS) 2726 test apparatus. The output power and static pressure efficiency curves of the centrifugal fan and axial fan are shown in Fig. 5 and Fig. 6. Compared with the experimental data, the deviation of the calculated output power and static pressure efficiency are about 14% and 2% for the centrifugal fan, and about 15% and 4% for the axial fan. This discrepancy is due to measurement error and the CFD assumptions. The output power is described as following.
Μ=ωpO (1) Where Op is output power (W),ω is angular velocity of fan (rpm) and Μ is imposing momentum on the fan (N-m). The static pressure efficiency is defined as following.
= ss
p
P QEff
O (2)
Where Effs is static pressure efficiency (%) and Q is volume flow rate (m3/s).
International Journal of Mechanical, Industrial and Aerospace Engineering 3:1 2009
44

0 1 2 3 4 5Mass Flow Rate (Kg/s)
0
50
100
150
200
250
Sta
tic P
ress
ure
(mm
Aq)
SimulationExperiment
k0 1 2 3 4 5
Mass Flow Rate (Kg/s)
0
50
100
150
200
250
Sta
tic P
ress
ure
(mm
Aq)
SimulationExperiment
k (a) Centrifugal fan
0 1 2 3 4
Mass Flow Rate (Kg/s)
0
10
20
30
40
Stat
ic P
ress
ure
(mm
Aq)
SimulationExperiment
k0 1 2 3 4
Mass Flow Rate (Kg/s)
0
10
20
30
40
Stat
ic P
ress
ure
(mm
Aq)
SimulationExperiment
k (b) Axial fan
Fig. 4 P-Q performance curves of fans
0 1 2 3 4 5Mass Flow Rate (Kg/s)
0
4
8
12
16
20
Out
put P
ower
(W)
Output Power of FansSimulation of Centrifugal FanExperiment of Centrifugal FanSimulation of Axial FanExperiment of Axial Fan
k0 1 2 3 4 5
Mass Flow Rate (Kg/s)
0
4
8
12
16
20
Out
put P
ower
(W)
Output Power of FansSimulation of Centrifugal FanExperiment of Centrifugal FanSimulation of Axial FanExperiment of Axial Fan
k Fig. 5 Output power of fans
0 1 2 3 4 5Mass Flow Rate (Kg/s)
0
10
20
30
40
50
Stat
ic P
ress
ure
Effic
ienc
y (%
)
Static Pressure Efficiency of FansSimulation of Centrifugal FanExperiment of Centrifugal FanSimulation of Axial fanExperiment of Axial Fan
k0 1 2 3 4 5
Mass Flow Rate (Kg/s)
0
10
20
30
40
50
Stat
ic P
ress
ure
Effic
ienc
y (%
)
Static Pressure Efficiency of FansSimulation of Centrifugal FanExperiment of Centrifugal FanSimulation of Axial fanExperiment of Axial Fan
k Fig. 6 Static pressure efficiency of fans
Fig. 7 to 10 demonstrate both the flow field and path line of
the centrifugal fan and axial fan at different pressure drop conditions. When the flow field is under large pressure drop, the reversed flow occurred near the blades and collided with the blade surface. In addition, the path lines are loose. Thus, reversed flow reduces the flow rate of fan, resulting in a lower cooling capacity. On the contrary, as the flow field is under small pressure drop, the air flow between the blades flowed parallel to the blade surface. Besides, the path lines compared with large pressure drop condition is relatively dense. Hence, it can be found that the flow field and path line in each case are quite different. As mentioned above, the air flow rate depends on the pressure drop of the cooling system. Therefore, when predicting the flow field in the motor, it is necessary to estimate the flow resistance through the motor compartment.
(a) Large pressure drop (b) Small pressure drop
Fig. 7 Flow fields of the centrifugal fan
(a) Large pressure drop
International Journal of Mechanical, Industrial and Aerospace Engineering 3:1 2009
45
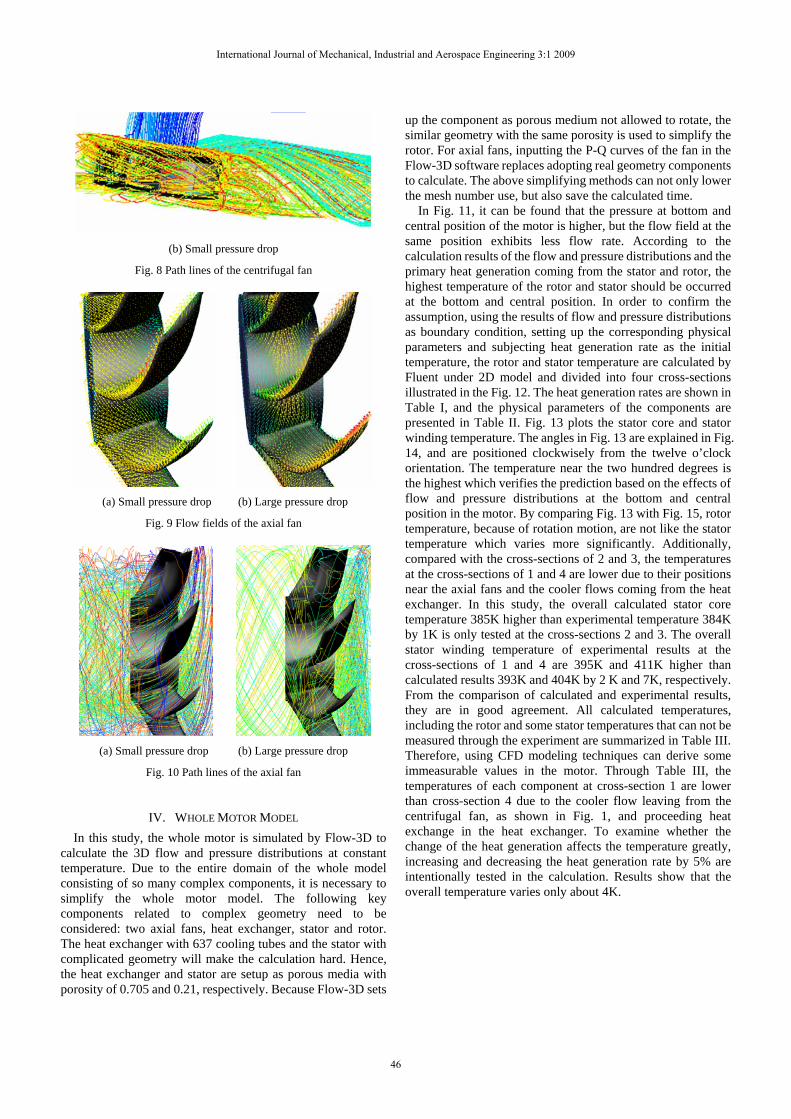
(b) Small pressure drop
Fig. 8 Path lines of the centrifugal fan
(a) Small pressure drop (b) Large pressure drop
Fig. 9 Flow fields of the axial fan
(a) Small pressure drop (b) Large pressure drop
Fig. 10 Path lines of the axial fan
IV. WHOLE MOTOR MODEL In this study, the whole motor is simulated by Flow-3D to
calculate the 3D flow and pressure distributions at constant temperature. Due to the entire domain of the whole model consisting of so many complex components, it is necessary to simplify the whole motor model. The following key components related to complex geometry need to be considered: two axial fans, heat exchanger, stator and rotor. The heat exchanger with 637 cooling tubes and the stator with complicated geometry will make the calculation hard. Hence, the heat exchanger and stator are setup as porous media with porosity of 0.705 and 0.21, respectively. Because Flow-3D sets
up the component as porous medium not allowed to rotate, the similar geometry with the same porosity is used to simplify the rotor. For axial fans, inputting the P-Q curves of the fan in the Flow-3D software replaces adopting real geometry components to calculate. The above simplifying methods can not only lower the mesh number use, but also save the calculated time.
In Fig. 11, it can be found that the pressure at bottom and central position of the motor is higher, but the flow field at the same position exhibits less flow rate. According to the calculation results of the flow and pressure distributions and the primary heat generation coming from the stator and rotor, the highest temperature of the rotor and stator should be occurred at the bottom and central position. In order to confirm the assumption, using the results of flow and pressure distributions as boundary condition, setting up the corresponding physical parameters and subjecting heat generation rate as the initial temperature, the rotor and stator temperature are calculated by Fluent under 2D model and divided into four cross-sections illustrated in the Fig. 12. The heat generation rates are shown in Table I, and the physical parameters of the components are presented in Table II. Fig. 13 plots the stator core and stator winding temperature. The angles in Fig. 13 are explained in Fig. 14, and are positioned clockwisely from the twelve o’clock orientation. The temperature near the two hundred degrees is the highest which verifies the prediction based on the effects of flow and pressure distributions at the bottom and central position in the motor. By comparing Fig. 13 with Fig. 15, rotor temperature, because of rotation motion, are not like the stator temperature which varies more significantly. Additionally, compared with the cross-sections of 2 and 3, the temperatures at the cross-sections of 1 and 4 are lower due to their positions near the axial fans and the cooler flows coming from the heat exchanger. In this study, the overall calculated stator core temperature 385K higher than experimental temperature 384K by 1K is only tested at the cross-sections 2 and 3. The overall stator winding temperature of experimental results at the cross-sections of 1 and 4 are 395K and 411K higher than calculated results 393K and 404K by 2 K and 7K, respectively. From the comparison of calculated and experimental results, they are in good agreement. All calculated temperatures, including the rotor and some stator temperatures that can not be measured through the experiment are summarized in Table III. Therefore, using CFD modeling techniques can derive some immeasurable values in the motor. Through Table III, the temperatures of each component at cross-section 1 are lower than cross-section 4 due to the cooler flow leaving from the centrifugal fan, as shown in Fig. 1, and proceeding heat exchange in the heat exchanger. To examine whether the change of the heat generation affects the temperature greatly, increasing and decreasing the heat generation rate by 5% are intentionally tested in the calculation. Results show that the overall temperature varies only about 4K.
International Journal of Mechanical, Industrial and Aerospace Engineering 3:1 2009
46
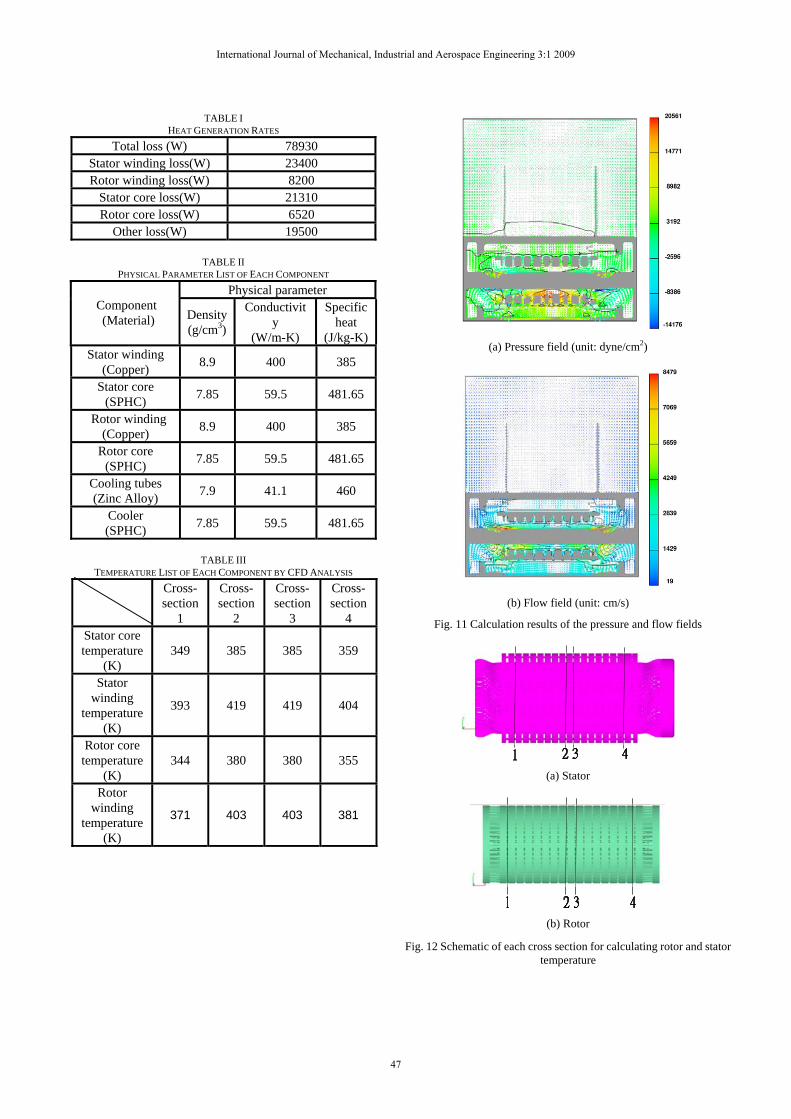
TABLE I HEAT GENERATION RATES
Total loss (W) 78930 Stator winding loss(W) 23400 Rotor winding loss(W) 8200
Stator core loss(W) 21310 Rotor core loss(W) 6520
Other loss(W) 19500
TABLE II PHYSICAL PARAMETER LIST OF EACH COMPONENT
Physical parameter Component (Material) Density
(g/cm3)
Conductivity
(W/m-K)
Specific heat
(J/kg-K) Stator winding
(Copper) 8.9 400 385
Stator core (SPHC) 7.85 59.5 481.65
Rotor winding (Copper) 8.9 400 385
Rotor core (SPHC) 7.85 59.5 481.65
Cooling tubes (Zinc Alloy) 7.9 41.1 460
Cooler (SPHC) 7.85 59.5 481.65
TABLE III
TEMPERATURE LIST OF EACH COMPONENT BY CFD ANALYSIS Cross-
section 1
Cross- section
2
Cross- section
3
Cross- section
4 Stator core temperature
(K) 349 385 385 359
Stator winding
temperature (K)
393 419 419 404
Rotor core temperature
(K) 344 380 380 355
Rotor winding
temperature (K)
371 403 403 381
(a) Pressure field (unit: dyne/cm2)
(b) Flow field (unit: cm/s)
Fig. 11 Calculation results of the pressure and flow fields
(a) Stator
(b) Rotor
Fig. 12 Schematic of each cross section for calculating rotor and stator temperature
International Journal of Mechanical, Industrial and Aerospace Engineering 3:1 2009
47

0 100 200 300 400Angle (Degree)
0
340
360
380
400
420
440
460
Tem
pera
ture
(K)
Stator-Fe Temperature DistributionsCross Section1Cross Section2Cross Section3Cross Section4
(a) Stator core
0 100 200 300 400Angle (Degree)
0
380
400
420
440
460
480
Tem
pera
ture
(K)
Stator-Cu Temperature DistributionsCross Section1Cross Section2Cross Section3Cross Section4
(b) Stator winding
Fig. 13 Calculation results of stator temperature
3600
12
3600
12
3600
12
Fig. 14 Schematic of temperature variation with different angles
0 100 200 300 400Angle (Degree)
0
340
360
380
400
420
440
460
Tem
pera
ture
(K)
Rotor-Fe Temperature DistributionsCross Section 1Cross Section 2Cross Section 3Cross Section 4
(a) Rotor core
0 100 200 300 400Angle (Degree)
0
360
380
400
420
440
460
Tem
pera
ture
(K)
Rotor-Cu temperature DistributionsCross Section 1Cross Section 2Cross Section 3Cross Section 4
(b) Rotor winding
Fig. 15 Calculation results of rotor temperature
V. CONCLUSION In this paper, a motor is completely modeled, and the heat
transfer and P-Q performance curves of cooling fans are derived. The calculation results are in a good agreement with the experimental data, and show that the current motor design can meet its temperature and mass flow rate requirements. The whole motor CFD model is found a powerful engineering visualization tool which can predict TEAAC motor temperature distribution accurately and show for some experimental data that can not test in the motor. Future investigations will keep on the optimum sizes for key motor parts to further improve the thermal performance.
International Journal of Mechanical, Industrial and Aerospace Engineering 3:1 2009
48

ACKNOWLEDGMENT The authors thank China Steel Corporation, Tatung
Corporation and Industrial Technology Research Institute for supporting this project.
REFERENCES [1] Bleier, P. Frank, “Fan handbook: selection, application, and design”,
McGraw-Hill, New York, 1997. [2] Dr. Ing. BRUNO ECK, “FANS”, Pergamon Press, New York, 1973. [3] A.B. Mckenzie, “Axial Flow Fans and Compressors”, Public by Ashgate
Publishing Limited, 1997. [4] T. Fukano , Y. Takamatsu and Y. Kodama, “The effects of tip clearance
on the noise of low pressure axial and mixed flow fans”, Journal of Sound and Vibration, vol. 105, no.2, 1986, pp.291-308.
[5] C. William, Osborne, “FANS”, Pergamon Press, New York, 1977. [6] L. Kondo and Y. Aoki, “Noise Reduction in Turbo Fans for Air
Conditioners”, Technical Review-Mitsubishi Heavy Industries, vol. 26, no. 3, October 1989, pp. 173-179.
[7] Mazurkiewicz, John (Baldor Electric), “Motor temperature”, Motion System Design, vol. 45, no. 4, April, 2003, pp. 20-24.
[8] A. Fasquelle, (CNRT Futurelec, Laboratoire de Mecanique et Energetique, Laboratoire d'Electrotechnique et d'Electronique de Puissance); D. Saury; S. Harmand; A. Randria,; B. Boualem, “Numerical study of fluid flow in an enclosed electrical motor”, Proceedings of ASME Fluids Engineering Division Summer Meeting 2006, FEDSM2006, vol. 1 SYMPOSIA, Proceedings of ASME Fluids Engineering Division Summer Meeting 2006, FEDSM2006, 2006, pp. 149-156.
[9] C.M. Liao, C.L. Chen, and T. Katcher, “Thermal Management of AC Induction Motors Using Computational Fluid Dynamics Modeling”, IDMDC’99, Seattle, Washington, 1999, pp. 189-191.
[10] Y.C. Chen, (Applied Computational Physics, Rockwell Scientific Company); B.C. Chen; C.L. Chen; J.Q. Dong, “CFD thermal analysis and optimization of motor cooling fin design”, Proceedings of the ASME Summer Heat Transfer Conference, vol. 3, Proceedings of the ASME Summer Heat Transfer Conference, HT 2005, 2005, pp. 625-629.
[11] C.M. Liao, (Rockwell Science Cent); C.L. Chen, “Thermal analysis and design for power electronics of integrated motor”, Proceedings of SPIE - The International Society for Optical Engineering, vol. 3906, 1999, pp. 408-414.
[12] C.M. Liao, (Rockwell Science Cent); C.L. Chen; Katcher, Tom, “Thermal analysis for design of high performance motors”, Thermomechanical Phenomena in Electronic Systems -Proceedings of the Intersociety Conference, 1998, pp. 424-429.
[13] M. Wu, (National University of Singapore); A.O. Andrew Tay; M.A. Jabbar, “Determination of thermal performance of small electric motors”, Proceedings of the International Conference on Power Electronics and Drive Systems, vol. 2, 2001, pp. 877-880.
[14] http://www.flow3d.com [15] http://www.Fluent.com
Chih-Chung Chang received the B.S. (2003) in National Taiwan Ocean University and M.S. (2005) in National Tsing Hua University. He is working toward the Ph.D. degree in mechanical engineering from the National Taiwan University. His current interests include electronic cooling, HVAC system and energy engineering.
Sy-Chi Kuo received the B.S. (2004) in National Taiwan Ocean University, and M.S. (2006) in National Central University. He is working toward the Ph.D.
degree in mechanical engineering from the National Taiwan University. His current interests include CFD and electronic cooling. Chen-Kang Huang received the B.S. (1979) and M.S. (1981) in National Taiwan University, Ph.D. (1987) in UC Berkeley. He is an assistant professor of Department of Bio-Industrial Mechatronics Engineering, National Taiwan University. His current interests include bio heat and mass transfer and computer aided engineering. Sih-Li Chen received the B.S. (1995) and M.S. (1997) in National Taiwan University, Ph.D. (2004) in UC Berkeley. He is a professor of Department of Mechanical Engineering, National Taiwan University. His current interests include electronic cooling, HVAC system and energy engineering.
International Journal of Mechanical, Industrial and Aerospace Engineering 3:1 2009
49