Embed Size (px)
Citation preview
The IPOX Week www.ipoxschuster.com Feb 11, 2011
Summary Developed markets benchmarks continued to zoom higher ahead of expiration week, shrugging off big weakness in selected emerging markets (China) on inflation jitters. With the U.S. IPO market having regained global leadership, key deals managed to price expensively atop of original ranges.
[ Week 2/14/2011 ]
Highlights IPOX Indexes:
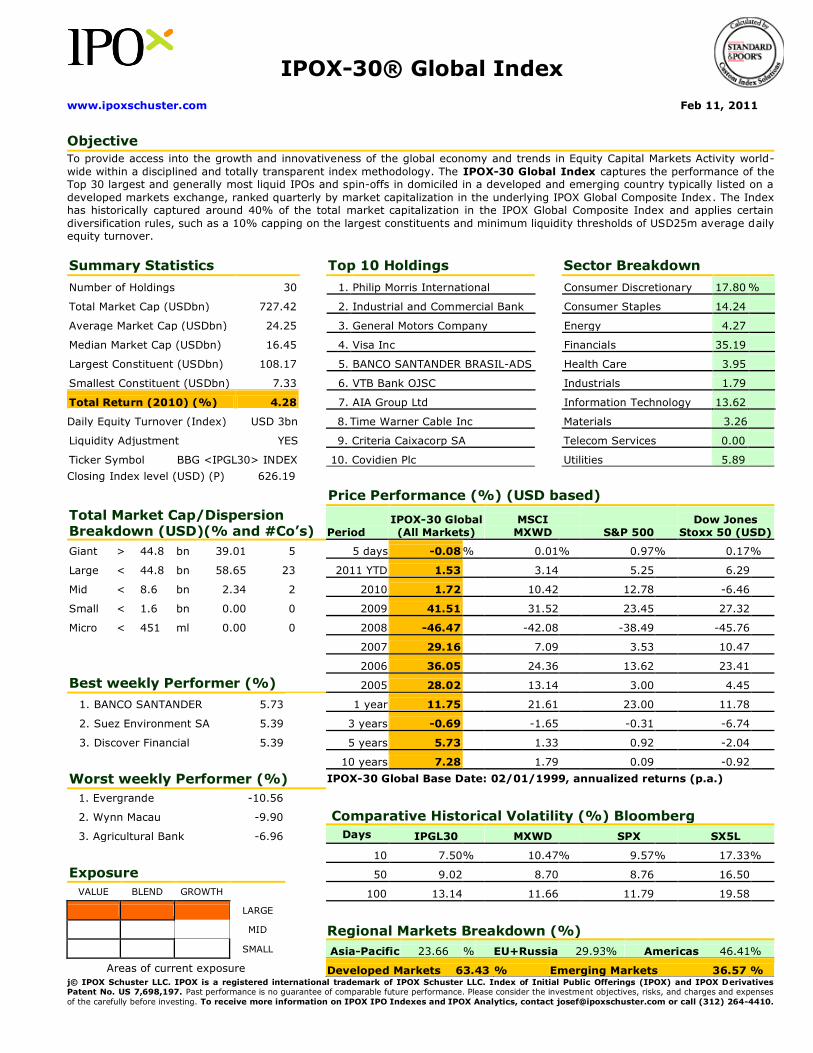
Global equity index spreads continued to gyrate sharply ahead of option expiration week as the correlation between developed and emerging (China) markets plunged anew. The narrower IPOX Global Indexes were unaffected by the spike in emerging markets risk with the IPOX-30 Global Index (BBG: IPGL30) declining -0.08%, in line with the global benchmark MSCI World (MSCI).
44/100 companies in the broader IPOX-100 Global Index (IPGL100) fell, with the average (median) equally-weighted constituent falling -0.98% (-0.76%), underperforming the applied market-cap weighted index. The weakness was driven by big selling in the Macau-based casino operators with SJM Holdings (880 HK: -10.19%) and Wynn Macau (1128 HK: -9-90%) leading the way. IPOX heavyweight Teradata (TDC US: +8.80%) rose on strong earnings.
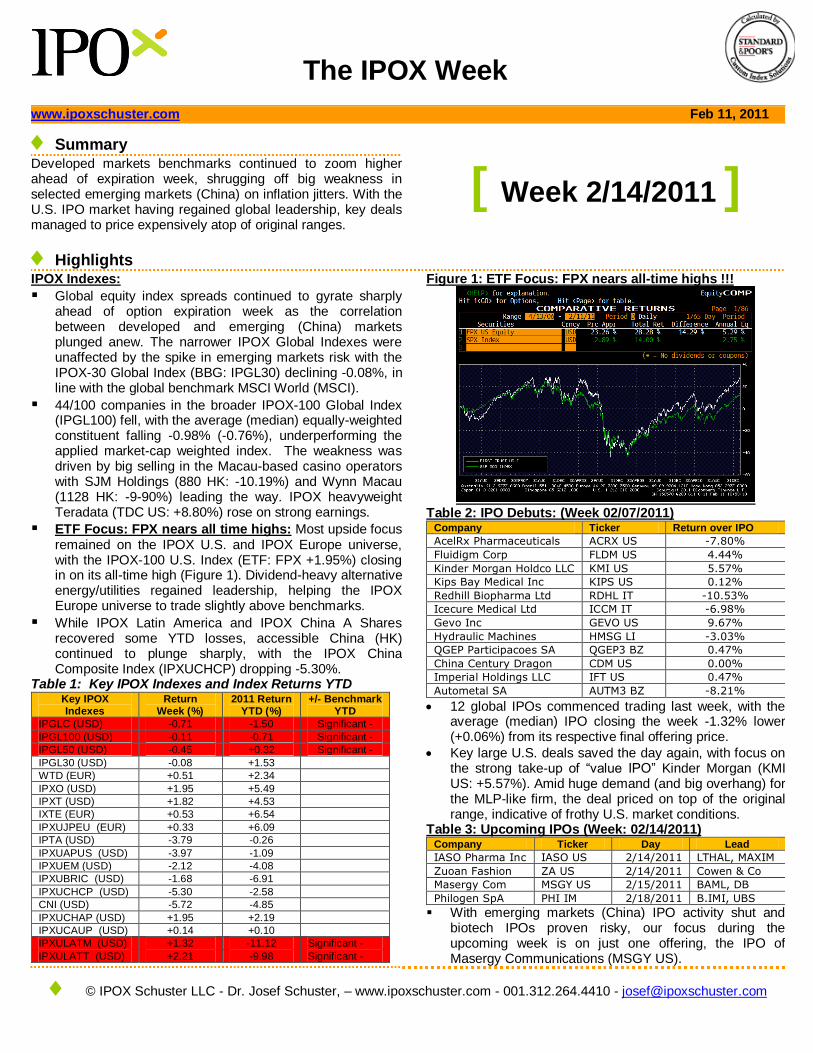
ETF Focus: FPX nears all time highs: Most upside focus remained on the IPOX U.S. and IPOX Europe universe, with the IPOX-100 U.S. Index (ETF: FPX +1.95%) closing in on its all-time high (Figure 1). Dividend-heavy alternative energy/utilities regained leadership, helping the IPOX Europe universe to trade slightly above benchmarks.
While IPOX Latin America and IPOX China A Shares recovered some YTD losses, accessible China (HK) continued to plunge sharply, with the IPOX China Composite Index (IPXUCHCP) dropping -5.30%.
Table 1: Key IPOX Indexes and Index Returns YTD Key IPOX Indexes
Return Week (%)
2011 Return YTD (%)
+/- Benchmark YTD
IPGLC (USD) -0.71 -1.50 Significant -
IPGL100 (USD) -0.11 -0.71 Significant -
IPGL50 (USD) -0.45 +0.32 Significant -
IPGL30 (USD) -0.08 +1.53
WTD (EUR) +0.51 +2.34
IPXO (USD) +1.95 +5.49
IPXT (USD) +1.82 +4.53
IXTE (EUR) +0.53 +6.54
IPXUJPEU (EUR) +0.33 +6.09
IPTA (USD) -3.79 -0.26
IPXUAPUS (USD) -3.97 -1.09
IPXUEM (USD) -2.12 -4.08
IPXUBRIC (USD) -1.68 -6.91
IPXUCHCP (USD) -5.30 -2.58
CNI (USD) -5.72 -4.85
IPXUCHAP (USD) +1.95 +2.19
IPXUCAUP (USD) +0.14 +0.10
IPXULATM (USD) +1.32 -11.12 Significant -
IPXULATT (USD) +2.21 -9.98 Significant -
Figure 1: ETF Focus: FPX nears all-time highs !!!
Table 2: IPO Debuts: (Week 02/07/2011)
Company Ticker Return over IPO
AcelRx Pharmaceuticals ACRX US -7.80%
Fluidigm Corp FLDM US 4.44%
Kinder Morgan Holdco LLC KMI US 5.57%
Kips Bay Medical Inc KIPS US 0.12%
Redhill Biopharma Ltd RDHL IT -10.53%
Icecure Medical Ltd ICCM IT -6.98%
Gevo Inc GEVO US 9.67%
Hydraulic Machines HMSG LI -3.03%
QGEP Participacoes SA QGEP3 BZ 0.47%
China Century Dragon CDM US 0.00%
Imperial Holdings LLC IFT US 0.47%
Autometal SA AUTM3 BZ -8.21%
12 global IPOs commenced trading last week, with the average (median) IPO closing the week -1.32% lower (+0.06%) from its respective final offering price.
Key large U.S. deals saved the day again, with focus on the strong take-up of “value IPO” Kinder Morgan (KMI US: +5.57%). Amid huge demand (and big overhang) for the MLP-like firm, the deal priced on top of the original range, indicative of frothy U.S. market conditions.
Table 3: Upcoming IPOs (Week: 02/14/2011) Company Ticker Day Lead
IASO Pharma Inc IASO US 2/14/2011 LTHAL, MAXIM
Zuoan Fashion ZA US 2/14/2011 Cowen & Co
Masergy Com MSGY US 2/15/2011 BAML, DB
Philogen SpA PHI IM 2/18/2011 B.IMI, UBS
With emerging markets (China) IPO activity shut and biotech IPOs proven risky, our focus during the upcoming week is on just one offering, the IPO of Masergy Communications (MSGY US).
© IPOX Schuster LLC - Dr. Josef Schuster, – www.ipoxschuster.com - 001.312.264.4410 - [email protected]

IPOX-100® Global Index
www.ipoxschuster.com Feb 11, 2011
Objective
To provide access into the growth and innovativeness of the global economy and trends in Equity Capital Markets Activity in
developed countries within a disciplined and totally transparent index methodology. The IPOX-100 Global Index captures the performance of the Top 100 largest and generally most liquid IPOs and spin-offs in developed and emerging countries ranked
quarterly by market capitalization in the underlying IPOX Global Composite Index. The Index has historically captured around 75% of the total market capitalization in the IPOX Global Composite Index and applies certain diversification rules, such as a 10%
capping on the largest constituents and a minimum average daily equity turnover of approximately USD 10 million.
Summary Statistics Top 10 Holdings Sector Breakdown
Number of Holdings 100 1. Philip Morris International Consumer Discretionary 13.15 %
Total Market Cap (USDbn) 1234.93 2. Ecopetrol SA ADR Consumer Staples 14.14
Average Market Cap (USDbn) 12.35 3. General Motors Company Energy 14.84
Median Market Cap (USDbn) 8.09 4. Visa Inc Financials 23.33
Largest Constituent (USDbn) 108.17 5. BANCO SANTANDER BRASIL-ADS Health Care 2.84
Smallest Constituent (USDbn) 2.12 6. OGX Petroleo E Gas Participa Industrials 4.35
Total Return (2010) (%) 7.67 7. AIA Group Ltd Information Technology 10.83
Daily Equity Turnover (Index) USD 3.5bn 8. United Company RUSAL Plc Materials 8.95
Liquidity Adjustment YES 9. Criteria Caixacorp SA Telecom Services 2.34
Ticker Symbol BBG <IPGL100> INDEX 10. Covidien Plc Utilities 5.23
Closing Index level (USD) (P) 576.59 0
Price Performance (%) (USD based)
Total Market Cap/Dispersion Breakdown (USD)(% and #Co’s) Period
IPOX-100
Global
MSCI
MXWD S&P 500
Dow Jones
Stoxx 50
Giant > 44.8 bn 28.14 5 5 days -0.11 % 0.01 % 0.97 % 0.17 %
Large < 44.8 bn 44.90 37 2011 YTD -0.71 3.14 5.25 6.29
Mid < 8.6 bn 26.96 58 2010 5.27 10.42 12.78 -6.46
Small < 1.6 bn 0.00 0 2009 42.47 31.52 23.45 27.32
Micro < 451 ml 0.00 0 2008 -50.75 -43.45 -38.49 -45.76
2007 29.52 9.59 3.53 10.47
2006 42.80 18.84 13.62 23.41
Best weekly Performer (%) 2005 20.69 8.85 3.00 4.45
1. Teradata Corp 8.80 1 year 24.04 21.61 23.00 11.78
2. Turk Telekomunikasyon 7.23 3 years 3.44 -1.65 -0.31 -6.74
3. AVAGO TECHNOLOGIES 6.70 5 years 5.72 1.33 0.92 -2.04
10 years 6.55 1.79 0.09 -0.92
Worst weekly Performer (%) IPOX-100 Global Base Date: 02/01/1999, annualized returns (p.a.)
1. Evergrande Real Est -10.56
2. SJM Holdings Ltd. -10.19 Comparative Historical Volatility (%) Bloomberg
3. Wynn Macau -9.90 Days IPGL100 MXWD SPX SX5L
10 10.22 % 10.47 % 9.57 % 17.33 %
Exposure 50 9.15 8.70 8.76 16.50
VALUE BLEND GROWTH 100 12.94 11.66 11.79 19.58
LARGE
MID Regional Markets Breakdown (%)
SMALL Asia-Pacific 31.33 % EU +Russia 32.35 % Americas 36.82 %
Areas of current exposure Developed Markets 51.79 % Emerging Markets 48.21 % © IPOX Schuster LLC. IPOX is a registered international trademark of IPOX Schuster LLC. Index of Initial Public Offerings (IPOX) and IPOX Derivatives Patent No. US 7,698,197. Past performance is no guarantee of comparable future performance. Please consider the investment objectives, risks, and charges and expenses
of the carefully before investing. To receive more information on IPOX IPO Indexes and IPOX Analytics, contact [email protected] call (312) 264-4410.
IPOX-30® Global Index
www.ipoxschuster.com Feb 11, 2011
Objective
To provide access into the growth and innovativeness of the global economy and trends in Equity Capital Markets Activity world-
wide within a disciplined and totally transparent index methodology. The IPOX-30 Global Index captures the performance of the Top 30 largest and generally most liquid IPOs and spin-offs in domiciled in a developed and emerging country typically listed on a
developed markets exchange, ranked quarterly by market capitalization in the underlying IPOX Global Composite Index. The Index has historically captured around 40% of the total market capitalization in the IPOX Global Composite Index and applies certain
diversification rules, such as a 10% capping on the largest constituents and minimum liquidity thresholds of USD25m average daily equity turnover.
Summary Statistics Top 10 Holdings Sector Breakdown
Number of Holdings 30 1. Philip Morris International Consumer Discretionary 17.80 %
Total Market Cap (USDbn) 727.42 2. Industrial and Commercial Bank Consumer Staples 14.24
Average Market Cap (USDbn) 24.25 3. General Motors Company Energy 4.27
Median Market Cap (USDbn) 16.45 4. Visa Inc Financials 35.19
Largest Constituent (USDbn) 108.17 5. BANCO SANTANDER BRASIL-ADS Health Care 3.95
Smallest Constituent (USDbn) 7.33 6. VTB Bank OJSC Industrials 1.79
Total Return (2010) (%) 4.28 7. AIA Group Ltd Information Technology 13.62
Daily Equity Turnover (Index) USD 3bn 8. Time Warner Cable Inc Materials 3.26
Liquidity Adjustment YES 9. Criteria Caixacorp SA Telecom Services 0.00
Ticker Symbol BBG <IPGL30> INDEX 10. Covidien Plc Utilities 5.89
Closing Index level (USD) (P) 626.19 0
Price Performance (%) (USD based)
Total Market Cap/Dispersion Breakdown (USD)(% and #Co’s) Period
IPOX-30 Global (All Markets)
MSCI MXWD S&P 500
Dow Jones Stoxx 50 (USD)
Giant > 44.8 bn 39.01 5 5 days -0.08 % 0.01 % 0.97 % 0.17 %
Large < 44.8 bn 58.65 23 2011 YTD 1.53 3.14 5.25 6.29
Mid < 8.6 bn 2.34 2 2010 1.72 10.42 12.78 -6.46
Small < 1.6 bn 0.00 0 2009 41.51 31.52 23.45 27.32
Micro < 451 ml 0.00 0 2008 -46.47 -42.08 -38.49 -45.76
2007 29.16 7.09 3.53 10.47
2006 36.05 24.36 13.62 23.41
Best weekly Performer (%) 2005 28.02 13.14 3.00 4.45
1. BANCO SANTANDER 5.73 1 year 11.75 21.61 23.00 11.78
2. Suez Environment SA 5.39 3 years -0.69 -1.65 -0.31 -6.74
3. Discover Financial 5.39 5 years 5.73 1.33 0.92 -2.04
10 years 7.28 1.79 0.09 -0.92
Worst weekly Performer (%) IPOX-30 Global Base Date: 02/01/1999, annualized returns (p.a.)
1. Evergrande -10.56 2. Wynn Macau -9.90 Comparative Historical Volatility (%) Bloomberg
3. Agricultural Bank -6.96 Days IPGL30 MXWD SPX SX5L
10 7.50 % 10.47 % 9.57 % 17.33 %
Exposure 50 9.02 8.70 8.76 16.50
VALUE BLEND GROWTH 100 13.14 11.66 11.79 19.58
LARGE
MID Regional Markets Breakdown (%)
SMALL Asia-Pacific 23.66 % EU+Russia 29.93 % Americas 46.41 %
Areas of current exposure Developed Markets 63.43 % Emerging Markets 36.57 % j© IPOX Schuster LLC. IPOX is a registered international trademark of IPOX Schuster LLC. Index of Initial Public Offerings (IPOX) and IPOX Derivatives Patent No. US 7,698,197. Past performance is no guarantee of comparable future performance. Please consider the investment objectives, risks, and charges and expenses
of the carefully before investing. To receive more information on IPOX IPO Indexes and IPOX Analytics, contact [email protected] or call (312) 264-4410.

IPOX-100® U.S. Index (ETF: FPX)
www.ipoxschuster.com Feb 11, 2011
Objective
To provide access into the growth and innovativeness of the U.S. economy and trends in U.S. Equity Capital Markets Activity using IPOs and spin-offs as a proxy within a disciplined and totally transparent index methodology. Based on the IPOX Global Composite
Index, the IPOX-100 U.S. applies certain diversification rules and liquidity adjustments, such as a 10% capping on the largest constituents.
Summary Statistics Top 10 Holdings Sector Breakdown
Number of Holdings 100 1. Philip Morris International Consumer Discretionary 20.97 %
Total Market Cap (USDbn) 646.58 2. General Motors Company Consumer Staples 15.38
Average Market Cap (USDbn) 6.47 3. Visa Inc Energy 9.62
Median Market Cap (USDbn) 2.70 4. Time Warner Cable Inc Financials 8.02
Largest Constituent (USDbn) 108.17 5. Covidien Plc Health Care 7.10
Smallest Constituent (USDbn) 0.68 6. Spectra Energy Corp Industrials 7.43
Total Return (2010) (%) 19.08 7. Tyco Electronics Ltd Information Technology 28.15
Daily Equity Turnover (Index) USD 5.5bn 8. Western Union Co Materials 0.80
Liquidity Adjustment YES 9. First Solar Inc Telecom Services 1.76
Ticker Symbol BBG <IPXO> INDEX, FPX 10. Mead Johnson Nutrition Co Utilities 0.79
Closing Index level (USD) (P) 1096.28
0
Price Performance (%)
Total Market Cap/Dispersion Breakdown (USD)(% and #Co’s) Period
IPOX-100 (FPX) S&P 500
Russell 2000 Index Nasdaq-100
Giant > 44.8 bn 27.85 3 5 days 1.95 % 0.97 % 2.03 % 1.35 %
Large < 44.8 bn 31.58 13 2011 YTD 5.49 5.25 4.18 6.85
Mid < 8.6 bn 33.71 53 2010 17.27 12.78 25.31 19.22
Small < 1.6 bn 6.86 31 2009 43.73 23.45 25.22 53.54
Micro < 451 ml 0.00 0 2008 -44.29 -38.49 -34.72 -41.89
2007 14.39 3.53 -2.73 18.67
2006 19.70 13.62 17.05 6.79
Best weekly Performer (%) 2005 23.40 3.00 3.32 1.49
1. SUCCESSFACTORS 14.48 1 year 27.41 23.00 34.70 33.45
2. Commvault Systems 14.17 3 years 4.04 -0.31 5.23 9.73
3. Rackspace Hosting Inc 11.03 5 years 5.79 0.92 2.60 7.32
10 years 5.56 0.09 5.07 0.47
Worst weekly Performer (%) IPOX-100 U.S. Base Date: 01/03/1989, annualized returns (p.a.)
1. Motricity Inc -14.62
2. HHGregg Inc -7.91 Comparative Historical Volatility (%) Bloomberg
3. NXP Semiconductor NV -7.61 Days IPXO SPX RUT NDX
10 9.48 % 9.57 % 13.13 % 9.88 %
Exposure 30 11.23 10.30 18.40 13.69
VALUE BLEND GROWTH 50 9.79 8.76 15.15 11.17
LARGE 100 12.25 11.79 17.72 13.82
MID 200 19.45 18.89 27.18 20.57
SMALL 400 17.78 17.36 24.42 18.63
Areas of current exposure Source: Bloomberg Analytics
© © IPOX Schuster LLC. IPOX is a registered international trademark of IPOX Schuster LLC. Index of Initial Public Offerings (IPOX) and IPOX Derivatives Patent No. US 7,698,197. Past performance is no guarantee of comparable future performance. Please consider the investment objectives, risks, and charges and expenses carefully before investing. To receive more information on IPOX IPO Indexes and IPOX Analytics, contact [email protected] or call (312) 264-4410.
IPOX-30® U.S. Index
www.ipoxschuster.com Feb 11, 2011
Objective
To provide access into the growth and innovativeness of the U.S. economy and trends in U.S. Equity Capital Markets Activity using
IPOs and spin-offs as a proxy within a disciplined and totally transparent index methodology. Based on the IPOX Global Composite Index, the IPOX-30 U.S. applies certain diversification rules and liquidity adjustments, such as a 10% capping on the largest
constituents.
Summary Statistics Top 10 Holdings Sector Breakdown
Number of Holdings 30 1. Philip Morris International Consumer Discretionary 25.31 %
Total Market Cap (USDbn) 464.44 2. General Motors Company Consumer Staples 18.80
Average Market Cap (USDbn) 15.48 3. Visa Inc Energy 10.80
Median Market Cap (USDbn) 8.38 4. Time Warner Cable Inc Financials 8.47
Largest Constituent (USDbn) 108.17 5. Covidien Plc Health Care 8.27
Smallest Constituent (USDbn) 3.12 6. Spectra Energy Corp Industrials 3.33
Total Return (2010) (%) 16.99 7. Tyco Electronics Ltd Information Technology 20.62
Daily Equity Turnover (Index) USD 4.4bn 8. Mead Johnson Nutrition Co Materials 0.00
Liquidity Adjustment YES 9. Lorillard Inc Telecom Services 3.04
Ticker Symbol BBG <IPXT> INDEX 10. Discover Financial Services Utilities 1.35
Closing Index level (USD) (P) 1148.66 0
Price Performance (%)
Total Market Cap/Dispersion Breakdown (USD)(% and #Co’s) Period IPOX-30 U.S. S&P 500
Russell 2000
Index Nasdaq-100
Giant > 44.8 bn 28.69 3 5 days 1.82 % 0.97 % 2.03 % 1.35 %
Large < 44.8 bn 46.17 11 2011 YTD 4.53 5.25 4.18 6.85
Mid < 8.6 bn 25.14 16 2010 14.92 12.78 25.31 19.22
Small < 1.6 bn 0.00 0 2009 40.35 23.45 25.22 53.54
Micro < 451 ml 0.00 0 2008 -42.55 -38.49 -34.72 -41.89
2007 12.30 3.53 -2.73 18.67
2006 24.77 13.62 17.05 6.79
Best weekly Performer (%) 2005 27.32 3.00 3.32 1.49
1. Rackspace Hosting Inc 11.03 1 year 23.99 23.00 34.70 33.45
2. Teradata Corp 8.80 3 years 3.42 -0.31 5.23 9.73
3. Scripps Networks Inter 6.65 5 years 5.72 0.92 2.60 7.32
10 years 6.55 0.09 5.07 0.47
Worst weekly Performer (%) IPOX-30 U.S. Base Date: 01/03/1989, annualized returns (p.a.)
1. NXP Semiconductor NV -7.61
2. Dr Pepper Snapple -4.71 Comparative Historical Volatility (Bloomberg)
3. LPL Investment -2.80 Days IPXT SPX RUT NDX
10 7.08 % 9.57 % 13.13 % 9.88 %
Exposure 30 9.93 10.30 18.40 13.69
VALUE BLEND GROWTH 50 8.64 8.76 15.15 11.17
LARGE 100 11.90 11.79 17.72 13.82
MID 200 19.00 18.89 27.18 20.57
SMALL 400 17.24 17.36 24.42 18.63
Areas of current exposure Source: Bloomberg Analytics
© IPOX Schuster LLC. IPOX is a registered international trademark of IPOX Schuster LLC. Index of Initial Public Offerings (IPOX) and IPOX Derivatives
Patent No. US 7,698,197. Past performance is no guarantee of comparable future performance. Please consider the investment objectives, risks, and charges and expenses carefully before investing. To receive more information on IPOX IPO Indexes and IPOX Analytics, contact [email protected] or call (312) 264-4410.

IPOX-30® Europe Index
www.ipoxschuster.com Feb 11, 2011
Objective
To provide access into the growth and innovativeness of the European economy and trends in European Equity Capital Markets
Activity within a disciplined and totally transparent index methodology. Based on the IPOX Global Composite Index, the IPOX-30 Europe has historically captured around 40% of the total market capitalization in the IPOX Composite Europe Index and applies
certain diversification rules, such as a 10% capping on the largest constituents and is adjusted for liquidity.
Summary Statistics Top 10 Holdings Sector Breakdown
Number of Holdings 30 1. Criteria Caixacorp SA Consumer Discretionary 5.59 %
Total Market Cap (EURbn) 171.32 2. Eurasian Natural Resources Corp Consumer Staples 0.00
Average Market Cap (EURbn) 5.71 3. Galp Energia SGPS SA Energy 7.45
Median Market Cap (EURbn) 4.26 4. Iberdrola Renovables Financials 19.63
Largest Constituent (EURbn) 16.81 5. Enel Green Power SpA Health Care 1.49
Smallest Constituent (EURbn) 2.22 6. Legrand Promesses Industrials 21.15
Total Return (2010) (%) 9.02 7. Suez Environment SA Information Technology 5.48
Daily Equity Turnover (Index) EUR 1.2bn 8. Wacker Chemie AG Materials 17.79
Liquidity Adjustment YES 9. Amadeus IT Hldg SA Telecom Services 1.40
Ticker Symbol BB <IXTE> INDEX 10. Pandora A/S Utilities 20.03
Closing Index Level (USD) (P) 471.46
Price Performance (%)
Total Market Cap/Dispersion Breakdown (EUR)(% and #Co’s) Period
IPOX-30
Europe MSCI Europe
Dow Jones
STOXX 50
DAX30
DAX
Giant > 44.8 bn 0.00 0 5 days 0.55 % 0.82 % 0.20 % 2.15 %
Large < 44.8 bn 33.22 4 2011 YTD 6.54 4.10 5.23 6.61
Mid < 8.6 bn 66.78 26 2010 6.42 3.90 0.04 16.06
Small < 1.6 bn 0.00 0 2009 29.69 21.56 23.76 23.85
Micro < 451 ml 0.00 0 2008 -55.26 -40.93 -43.43 -40.37
2007 13.68 3.33 -3.57 22.36
2006 26.09 15.97 10.39 22.05
Best weekly Performer (%) 2005 22.86 21.71 20.70 27.07
1. EDP Renovaveis SA 6.08 1 year 19.73 14.86 12.26 33.93
2. Suez Environment SA 5.39 3 years -7.23 -3.11 -4.63 3.01
3. Strabag SE 4.39 5 years -2.49 -1.85 -4.54 5.27
10 years 1.05 -1.61 -4.63 1.27
Worst weekly Performer (%) IPOX-30 Europe Base Date: 01/03/1990
1. New World Resources NV -5.25
2. Hamburger Hafen -4.15 Country Breakdown (by applied market cap)
3. Eurasian Natural Resources -3.43 1. Austria 1.45 % 9. Italy 1.55 %
2. Belgium 0.00 10. Netherlands 1.64
Exposure 3. Denmark 2.88 11. Norway 0.00
VALUE BLEND GROWTH 4. Finland 0.00 12. Portugal 10.13
LARGE 5. France 20.12 13. Spain 21.21
MID 6. Germany 9.72 14. Sweden 0.00
SMALL 7. Greece 0.00 15. Switzerland 0.00
Areas of current exposure 8. Ireland 0.00 16. United Kingdom 31.31 © IPOX Schuster LLC. IPOX is a registered international trademark of IPOX Schuster LLC. Index of Initial Public Offerings (IPOX) and IPOX Derivatives Patent No. US 7,698,197. Past performance is no guarantee of comparable future performance. Please consider the investment objectives, risks, and charges and expenses carefully before investing. To receive more information on IPOX IPO Indexes and IPOX Analytics, contact [email protected] or call (312) 264-4410.
JPMorgan IPOX® Europe 50 Index
www.ipoxschuster.com Feb 11, 2011
Objective
To provide access into the growth and innovativeness of the European economy and trends in European Equity Capital Markets
Activity within a disciplined and totally transparent index methodology. Based on the IPOX Composite Europe Index, the JP Morgan IPOX Europe 50 is a market-cap weighted index measuring the performance of the top 50 companies ranked quarterly in the IPOX
Composite Europe Index. It has historically captured around 88% of total market cap of the IPOX Composite Europe Index and applies certain diversification rules, such as a 10% capping of the largest constituents.
Summary Statistics Top 10 Holdings Sector Breakdown
Number of Holdings 50 1. Criteria Caixacorp SA Consumer Discretionary 7.51 %
Total Market Cap (EURbn) 216.91 2. Eurasian Natural Resources Corp Consumer Staples 0.00
Average Market Cap (EURbn) 4.34 3. Galp Energia SGPS SA Energy 7.02
Median Market Cap (EURbn) 2.75 4. Iberdrola Renovables Financials 20.15
Largest Constituent (EURbn) 16.81 5. Enel Green Power SpA Health Care 3.65
Smallest Constituent (EURbn) 1.18 6. Legrand Promesses Industrials 17.84
Total Return (2010) (%) 11.2 7. Suez Environment SA Information Technology 6.09
Daily Equity Turnover (Index) EUR 1.5bn 8. Wacker Chemie AG Materials 20.82
Liquidity Adjustment YES 9. Amadeus IT Hldg SA Telecom Services 1.11
Ticker Symbol BB <IPXUJPEU> INDEX 10. Pandora A/S Utilities 15.82
Closing Index level (EUR) (P) 3529.92
0
Total Market Cap/Dispersion Breakdown (EUR)(% and #Co’s) Period
JPM IPOX
IPXUJPEU
MSCI Europe
MSDLE15
Dow Jones
STOXX 50
DAX30
DAX
Giant > 44.8 bn 0.00 0 5 days 0.37 % 0.82 % 0.20 % 2.15 %
Large < 44.8 bn 26.24 4 2011 YTD 6.09 4.10 5.23 6.61
Mid < 8.6 bn 71.73 43 2010 8.45 3.90 0.04 16.06
Small < 1.6 bn 2.03 3 2009 33.26 21.56 23.76 23.85
Micro < 451 ml 0.00 0 2008 -54.43 -40.93 -43.43 -40.37
2007 14.53 3.33 -3.57 22.36
2006 31.13 15.97 10.39 22.05
Best weekly Performer (%) 2005 24.42 21.71 20.70 27.07
1. EDP Renovaveis SA 6.08 1 year 20.86 14.86 12.26 33.93
2. Suez Environment SA 5.39 3 years -5.60 -3.11 -4.63 3.01
3. Home Retail Group 4.91 5 years -0.64 -1.85 -4.54 5.27
10 years 2.15 -1.61 -4.63 1.27
Worst weekly Performer (%) Base Date: 01/02/1990, annualized returns (p.a.)
1. New World Resources -5.25
2. Symrise AG -5.21 Comparative Historical Volatility (%) Bloomberg
3. Hamburger Hafen -4.15 Days IPXUJPEU MSDLE15 SX5P DAX
10 10.80 % 10.17 % 10.67 % 9.04 %
Exposure 30 13.06 11.97 12.71 11.92
VALUE BLEND GROWTH 50 11.29 10.33 11.69 11.14
LARGE 100 12.43 12.83 12.87 13.61
MID 200 19.71 18.61 18.48 18.31
SMALL 400 19.75 18.00 18.28 18.99
Areas of current exposure Source: Bloomberg Analytics
© IPOX Schuster LLC. IPOX is a registered international trademark of IPOX Schuster LLC. Index of Initial Public Offerings (IPOX) and IPOX Derivatives
Patent No. US 7,698,197. Past performance is no guarantee of comparable future performance. Please consider the investment objectives, risks, and charges and expenses carefully before investing. To receive more information on IPOX IPO Indexes and IPOX Analytics, contact [email protected] or call (312) 264-4410.
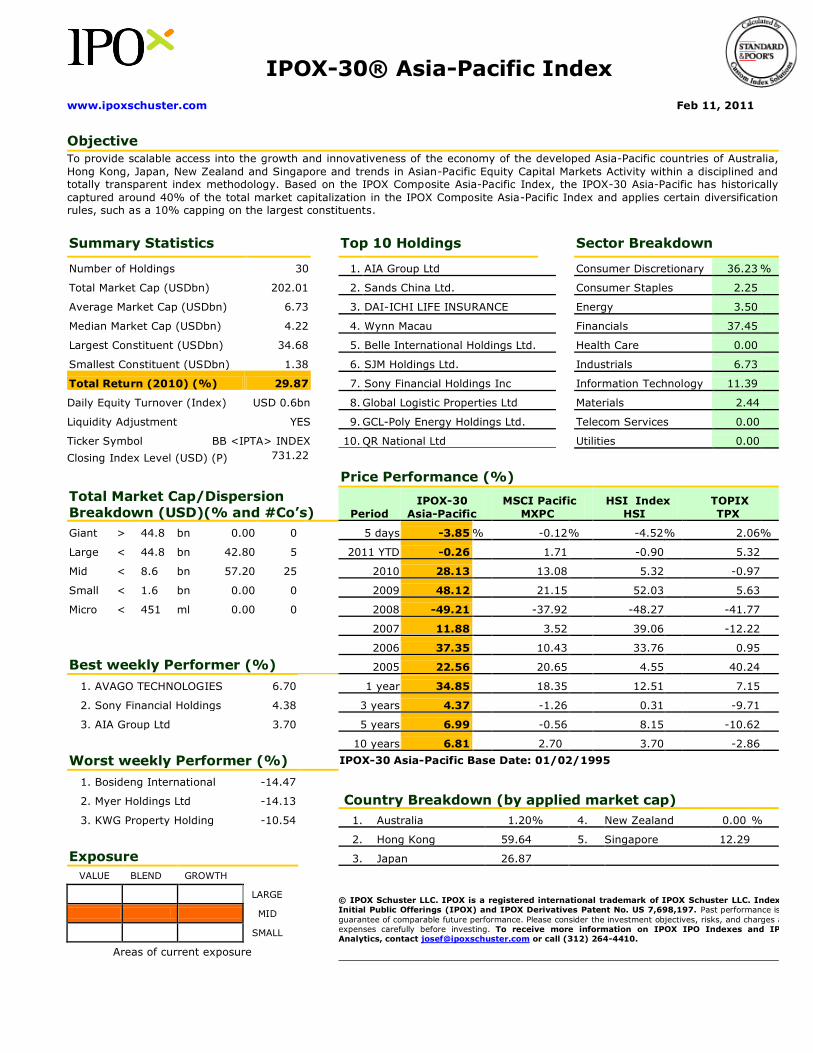
IPOX-30® Asia-Pacific Index
www.ipoxschuster.com Feb 11, 2011
Objective
To provide scalable access into the growth and innovativeness of the economy of the developed Asia-Pacific countries of Australia,
Hong Kong, Japan, New Zealand and Singapore and trends in Asian-Pacific Equity Capital Markets Activity within a disciplined and totally transparent index methodology. Based on the IPOX Composite Asia-Pacific Index, the IPOX-30 Asia-Pacific has historically
captured around 40% of the total market capitalization in the IPOX Composite Asia-Pacific Index and applies certain diversification rules, such as a 10% capping on the largest constituents.
Summary Statistics Top 10 Holdings Sector Breakdown
Number of Holdings 30 1. AIA Group Ltd Consumer Discretionary 36.23 %
Total Market Cap (USDbn) 202.01 2. Sands China Ltd. Consumer Staples 2.25
Average Market Cap (USDbn) 6.73 3. DAI-ICHI LIFE INSURANCE Energy 3.50
Median Market Cap (USDbn) 4.22 4. Wynn Macau Financials 37.45
Largest Constituent (USDbn) 34.68 5. Belle International Holdings Ltd. Health Care 0.00
Smallest Constituent (USDbn) 1.38 6. SJM Holdings Ltd. Industrials 6.73
Total Return (2010) (%) 29.87 7. Sony Financial Holdings Inc Information Technology 11.39
Daily Equity Turnover (Index) USD 0.6bn 8. Global Logistic Properties Ltd Materials 2.44
Liquidity Adjustment YES 9. GCL-Poly Energy Holdings Ltd. Telecom Services 0.00
Ticker Symbol BB <IPTA> INDEX 10. QR National Ltd Utilities 0.00
Closing Index Level (USD) (P) 731.22
Price Performance (%)
Total Market Cap/Dispersion Breakdown (USD)(% and #Co’s) Period
IPOX-30
Asia-Pacific
MSCI Pacific
MXPC
HSI Index
HSI
TOPIX
TPX
Giant > 44.8 bn 0.00 0 5 days -3.85 % -0.12 % -4.52 % 2.06 %
Large < 44.8 bn 42.80 5 2011 YTD -0.26 1.71 -0.90 5.32
Mid < 8.6 bn 57.20 25 2010 28.13 13.08 5.32 -0.97
Small < 1.6 bn 0.00 0 2009 48.12 21.15 52.03 5.63
Micro < 451 ml 0.00 0 2008 -49.21 -37.92 -48.27 -41.77
2007 11.88 3.52 39.06 -12.22
2006 37.35 10.43 33.76 0.95
Best weekly Performer (%) 2005 22.56 20.65 4.55 40.24
1. AVAGO TECHNOLOGIES 6.70 1 year 34.85 18.35 12.51 7.15
2. Sony Financial Holdings 4.38 3 years 4.37 -1.26 0.31 -9.71
3. AIA Group Ltd 3.70 5 years 6.99 -0.56 8.15 -10.62
10 years 6.81 2.70 3.70 -2.86
Worst weekly Performer (%) IPOX-30 Asia-Pacific Base Date: 01/02/1995
1. Bosideng International -14.47
2. Myer Holdings Ltd -14.13 Country Breakdown (by applied market cap)
3. KWG Property Holding -10.54 1. Australia 1.20 % 4. New Zealand 0.00 %
2. Hong Kong 59.64 5. Singapore 12.29
Exposure 3. Japan 26.87
VALUE BLEND GROWTH
LARGE © IPOX Schuster LLC. IPOX is a registered international trademark of IPOX Schuster LLC. Index of Initial Public Offerings (IPOX) and IPOX Derivatives Patent No. US 7,698,197. Past performance is no
guarantee of comparable future performance. Please consider the investment objectives, risks, and charges and expenses carefully before investing. To receive more information on IPOX IPO Indexes and IPOX Analytics, contact [email protected] or call (312) 264-4410.
MID
SMALL
Areas of current exposure

IPOX® BRIC 25 Index
www.ipoxschuster.com Feb 11, 2011
Objective
To provide concentrated access into the growth and innovativeness of companies domiciled in Brazil, Russia, India and China
(BRIC) within a disciplined and totally transparent index methodology. Based on the IPOX Emerging Markets Composite Index, the IPOX BRIC 25 Index has historically captured around 70% of total market cap created through IPO and spin-off activity of
emerging markets IPO and spin-off activity. The index includes stocks which are freely accessible to foreign investors only.
Summary Statistics Top 10 Holdings Sector Breakdown
Number of Holdings 25 1. Industrial and Commercial Bank Consumer Discretionary 1.21 %
Total Market Cap (USDbn) 364.65 2. BANCO SANTANDER BRASIL-ADS Consumer Staples 8.38
Average Market Cap (USDbn) 14.59 3. VTB Bank OJSC Energy 14.96
Median Market Cap (USDbn) 7.73 4. OGX Petroleo E Gas Participa Financials 48.12
Largest Constituent (USDbn) 63.24 5. United Company RUSAL Plc Health Care 2.44
Smallest Constituent (USDbn) 3.77 6. Agricultural Bank of China Ltd H Industrials 5.74
Total Return (2010) (%) 2.5 7. BM&F Bovespa S.A. Information Technology 7.73
Daily Equity Turnover (Index) USD 1.8bn 8. China Communications Constr Materials 9.33
Liquidity Adjustment YES 9. Want Want China Holdings Ltd. Telecom Services 0.00
Ticker Symbol BB < IPXUBRIC > INDEX 10. Essar Energy PLC Utilities 2.10
Closing Index Level (USD) (P) 0
Price Performance (%)
Total Market Cap/Dispersion Breakdown (USD)(% and #Co’s) Period IPOX BRIC 25
MSCI
MXEF
MSCI
MSEUBRIC
BONY
BKBRIC
Giant > 44.8 bn 19.71 2 5 days -1.68 % -3.87 % -4.77 % -1.05 %
Large < 44.8 bn 52.90 10 2011 YTD -6.91 -5.39 -6.54 -3.33
Mid < 8.6 bn 27.39 13 2010 0.02 16.36 7.25 9.32
Small < 1.6 bn 0.00 0 2009 84.03 74.50 88.80 81.54
Micro < 451 ml 0.00 0 2008 -61.50 -54.48 -60.27 -55.43
2007 29.94 34.48 56.12 66.91
2006 75.14 29.18 33.76 50.55
Best weekly Performer (%) 2005 11.91 30.31 4.55 36.90
1. BANCO SANTANDER 5.73 1 year 3.25 19.37 10.24 14.22
2. OGX Petroleo E Gas 5.71 3 years -5.76 -0.19 -3.98 -1.56
3. BM&F Bovespa S.A. 5.32 5 years 4.11 7.15 9.08 13.56
10 years 17.53 11.45 12.63 n.a.
Worst weekly Performer (%) IPOX BRIC 25 Base Date: 01/01/1999
1. Evergrande Real -10.56
2. Want Want China -8.76 Comparative Historical Volatility (%) Bloomberg
3. Longfor Properties Co. -7.25 Days IPXUBRIC MXEF MSEUBRIC BKBRIC
10 11.62 % 14.46 % 14.18 % 20.79 %
Exposure 50 12.58 12.08 14.05 16.80
VALUE BLEND GROWTH 100 15.65 13.66 15.33 19.86
LARGE
MID IPOX BRIC 25 Country Breakdown (%)
SMALL Brazil 33.04 % Russia 16.71 % India 2.52 %
Areas of current exposure China 47.74 %
© IPOX Schuster LLC.. IPOX is a registered international trademark of IPOX Schuster LLC. Index of Initial Public Offerings (IPOX) and IPOX Derivatives
Patent No. US 7,698,197. Past performance is no guarantee of comparable future performance. Please consider the investment objectives, risks, and charges and expenses carefully before investing. To receive information on IPOX IPO Indexes and IPOX Analytics, contact [email protected] or call (312) 264-4410.
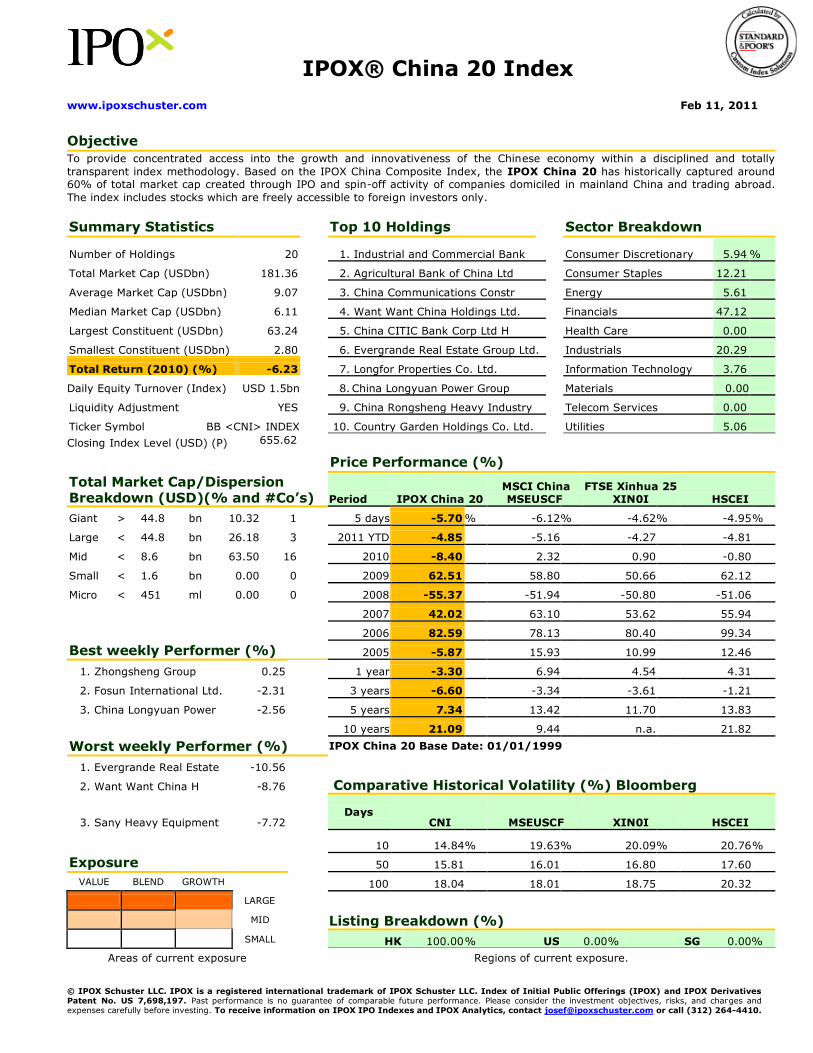
IPOX® China 20 Index
www.ipoxschuster.com Feb 11, 2011
Objective
To provide concentrated access into the growth and innovativeness of the Chinese economy within a disciplined and totally
transparent index methodology. Based on the IPOX China Composite Index, the IPOX China 20 has historically captured around 60% of total market cap created through IPO and spin-off activity of companies domiciled in mainland China and trading abroad.
The index includes stocks which are freely accessible to foreign investors only.
Summary Statistics Top 10 Holdings Sector Breakdown
Number of Holdings 20 1. Industrial and Commercial Bank Consumer Discretionary 5.94 %
Total Market Cap (USDbn) 181.36 2. Agricultural Bank of China Ltd Consumer Staples 12.21
Average Market Cap (USDbn) 9.07 3. China Communications Constr Energy 5.61
Median Market Cap (USDbn) 6.11 4. Want Want China Holdings Ltd. Financials 47.12
Largest Constituent (USDbn) 63.24 5. China CITIC Bank Corp Ltd H Health Care 0.00
Smallest Constituent (USDbn) 2.80 6. Evergrande Real Estate Group Ltd. Industrials 20.29
Total Return (2010) (%) -6.23 7. Longfor Properties Co. Ltd. Information Technology 3.76
Daily Equity Turnover (Index) USD 1.5bn 8. China Longyuan Power Group Materials 0.00
Liquidity Adjustment YES 9. China Rongsheng Heavy Industry Telecom Services 0.00
Ticker Symbol BB <CNI> INDEX 10. Country Garden Holdings Co. Ltd. Utilities 5.06
Closing Index Level (USD) (P) 655.62
0
Price Performance (%)
Total Market Cap/Dispersion Breakdown (USD)(% and #Co’s) Period IPOX China 20
MSCI China MSEUSCF
FTSE Xinhua 25 XIN0I HSCEI
Giant > 44.8 bn 10.32 1 5 days -5.70 % -6.12 % -4.62 % -4.95 %
Large < 44.8 bn 26.18 3 2011 YTD -4.85 -5.16 -4.27 -4.81
Mid < 8.6 bn 63.50 16 2010 -8.40 2.32 0.90 -0.80
Small < 1.6 bn 0.00 0 2009 62.51 58.80 50.66 62.12
Micro < 451 ml 0.00 0 2008 -55.37 -51.94 -50.80 -51.06
2007 42.02 63.10 53.62 55.94
2006 82.59 78.13 80.40 99.34
Best weekly Performer (%) 2005 -5.87 15.93 10.99 12.46
1. Zhongsheng Group 0.25 1 year -3.30 6.94 4.54 4.31
2. Fosun International Ltd. -2.31 3 years -6.60 -3.34 -3.61 -1.21
3. China Longyuan Power -2.56 5 years 7.34 13.42 11.70 13.83
10 years 21.09 9.44 n.a. 21.82
Worst weekly Performer (%) IPOX China 20 Base Date: 01/01/1999
1. Evergrande Real Estate -10.56
2. Want Want China H -8.76 Comparative Historical Volatility (%) Bloomberg
3. Sany Heavy Equipment -7.72 Days
CNI MSEUSCF XIN0I HSCEI
10 14.84 % 19.63 % 20.09 % 20.76 %
Exposure 50 15.81 16.01 16.80 17.60
VALUE BLEND GROWTH 100 18.04 18.01 18.75 20.32
LARGE
MID Listing Breakdown (%)
SMALL HK 100.00 % US 0.00 % SG 0.00 %
Areas of current exposure Regions of current exposure.
© IPOX Schuster LLC. IPOX is a registered international trademark of IPOX Schuster LLC. Index of Initial Public Offerings (IPOX) and IPOX Derivatives Patent No. US 7,698,197. Past performance is no guarantee of comparable future performance. Please consider the investment objectives, risks, and charges and expenses carefully before investing. To receive information on IPOX IPO Indexes and IPOX Analytics, contact [email protected] or call (312) 264-4410.
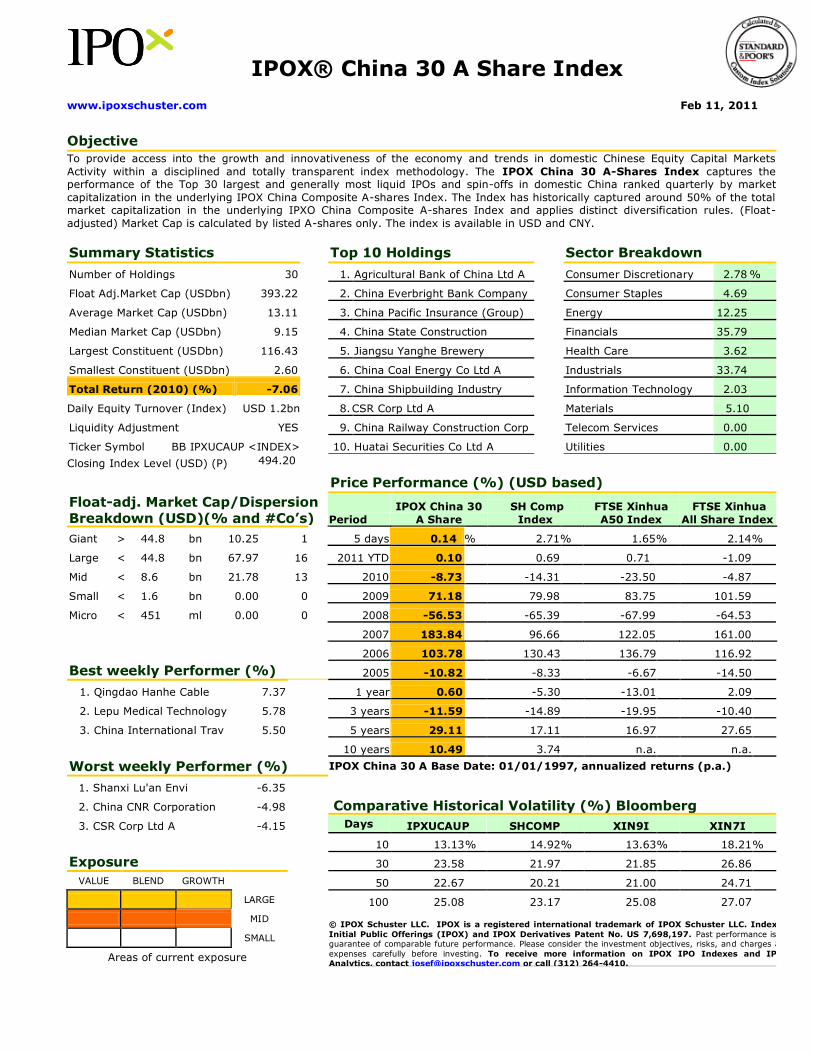
IPOX® China 30 A Share Index
www.ipoxschuster.com Feb 11, 2011
Objective
To provide access into the growth and innovativeness of the economy and trends in domestic Chinese Equity Capital Markets
Activity within a disciplined and totally transparent index methodology. The IPOX China 30 A-Shares Index captures the performance of the Top 30 largest and generally most liquid IPOs and spin-offs in domestic China ranked quarterly by market
capitalization in the underlying IPOX China Composite A-shares Index. The Index has historically captured around 50% of the total market capitalization in the underlying IPXO China Composite A-shares Index and applies distinct diversification rules. (Float-
adjusted) Market Cap is calculated by listed A-shares only. The index is available in USD and CNY.
Summary Statistics Top 10 Holdings Sector Breakdown
Number of Holdings 30 1. Agricultural Bank of China Ltd A Consumer Discretionary 2.78 %
Float Adj.Market Cap (USDbn) 393.22 2. China Everbright Bank Company Consumer Staples 4.69
Average Market Cap (USDbn) 13.11 3. China Pacific Insurance (Group) Energy 12.25
Median Market Cap (USDbn) 9.15 4. China State Construction Financials 35.79
Largest Constituent (USDbn) 116.43 5. Jiangsu Yanghe Brewery Health Care 3.62
Smallest Constituent (USDbn) 2.60 6. China Coal Energy Co Ltd A Industrials 33.74
Total Return (2010) (%) -7.06 7. China Shipbuilding Industry Information Technology 2.03
Daily Equity Turnover (Index) USD 1.2bn 8. CSR Corp Ltd A Materials 5.10
Liquidity Adjustment YES 9. China Railway Construction Corp Telecom Services 0.00
Ticker Symbol BB IPXUCAUP <INDEX> 10. Huatai Securities Co Ltd A Utilities 0.00
Closing Index Level (USD) (P) 494.20
0
Price Performance (%) (USD based)
Float-adj. Market Cap/Dispersion Breakdown (USD)(% and #Co’s) Period
IPOX China 30
A Share
SH Comp
Index
FTSE Xinhua
A50 Index
FTSE Xinhua
All Share Index
Giant > 44.8 bn 10.25 1 5 days 0.14 % 2.71 % 1.65 % 2.14 %
Large < 44.8 bn 67.97 16 2011 YTD 0.10 0.69 0.71 -1.09
Mid < 8.6 bn 21.78 13 2010 -8.73 -14.31 -23.50 -4.87
Small < 1.6 bn 0.00 0 2009 71.18 79.98 83.75 101.59
Micro < 451 ml 0.00 0 2008 -56.53 -65.39 -67.99 -64.53
2007 183.84 96.66 122.05 161.00
2006 103.78 130.43 136.79 116.92
Best weekly Performer (%) 2005 -10.82 -8.33 -6.67 -14.50
1. Qingdao Hanhe Cable 7.37 1 year 0.60 -5.30 -13.01 2.09
2. Lepu Medical Technology 5.78 3 years -11.59 -14.89 -19.95 -10.40
3. China International Trav 5.50 5 years 29.11 17.11 16.97 27.65
10 years 10.49 3.74 n.a. n.a.
Worst weekly Performer (%) IPOX China 30 A Base Date: 01/01/1997, annualized returns (p.a.)
1. Shanxi Lu'an Envi -6.35
2. China CNR Corporation -4.98 Comparative Historical Volatility (%) Bloomberg
3. CSR Corp Ltd A -4.15 Days IPXUCAUP SHCOMP XIN9I XIN7I
10 13.13 % 14.92 % 13.63 % 18.21 %
Exposure 30 23.58 21.97 21.85 26.86
VALUE BLEND GROWTH 50 22.67 20.21 21.00 24.71
LARGE 100 25.08 23.17 25.08 27.07
MID © IPOX Schuster LLC. IPOX is a registered international trademark of IPOX Schuster LLC. Index of
Initial Public Offerings (IPOX) and IPOX Derivatives Patent No. US 7,698,197. Past performance is no guarantee of comparable future performance. Please consider the investment objectives, risks, and charges and
expenses carefully before investing. To receive more information on IPOX IPO Indexes and IPOX Analytics, contact [email protected] or call (312) 264-4410. ..
SMALL
Areas of current exposure
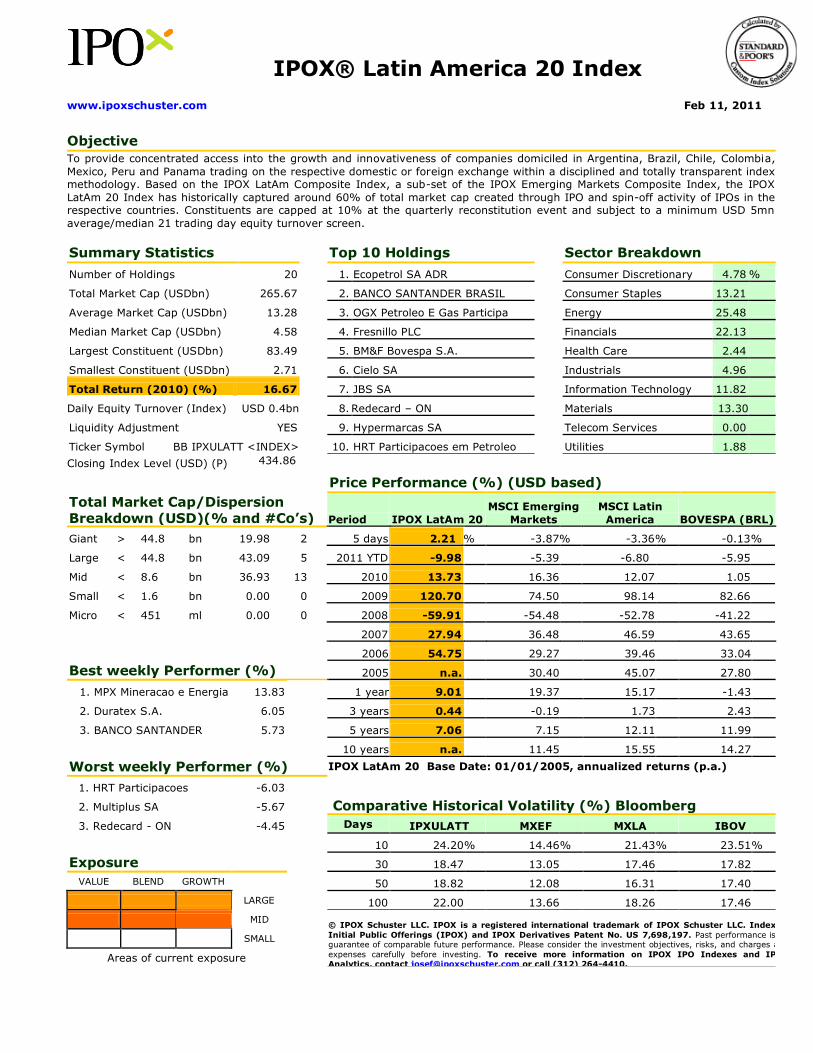
IPOX® Latin America 20 Index
www.ipoxschuster.com Feb 11, 2011
Objective
To provide concentrated access into the growth and innovativeness of companies domiciled in Argentina, Brazil, Chile, Colombia,
Mexico, Peru and Panama trading on the respective domestic or foreign exchange within a disciplined and totally transparent index methodology. Based on the IPOX LatAm Composite Index, a sub-set of the IPOX Emerging Markets Composite Index, the IPOX
LatAm 20 Index has historically captured around 60% of total market cap created through IPO and spin-off activity of IPOs in the respective countries. Constituents are capped at 10% at the quarterly reconstitution event and subject to a minimum USD 5mn
average/median 21 trading day equity turnover screen.
Summary Statistics Top 10 Holdings Sector Breakdown
Number of Holdings 20 1. Ecopetrol SA ADR Consumer Discretionary 4.78 %
Total Market Cap (USDbn) 265.67 2. BANCO SANTANDER BRASIL Consumer Staples 13.21
Average Market Cap (USDbn) 13.28 3. OGX Petroleo E Gas Participa Energy 25.48
Median Market Cap (USDbn) 4.58 4. Fresnillo PLC Financials 22.13
Largest Constituent (USDbn) 83.49 5. BM&F Bovespa S.A. Health Care 2.44
Smallest Constituent (USDbn) 2.71 6. Cielo SA Industrials 4.96
Total Return (2010) (%) 16.67 7. JBS SA Information Technology 11.82
Daily Equity Turnover (Index) USD 0.4bn 8. Redecard – ON Materials 13.30
Liquidity Adjustment YES 9. Hypermarcas SA Telecom Services 0.00
Ticker Symbol BB IPXULATT <INDEX> 10. HRT Participacoes em Petroleo Utilities 1.88
Closing Index Level (USD) (P) 434.86 0
Price Performance (%) (USD based)
Total Market Cap/Dispersion Breakdown (USD)(% and #Co’s) Period IPOX LatAm 20
MSCI Emerging
Markets
MSCI Latin
America BOVESPA (BRL)
Giant > 44.8 bn 19.98 2 5 days 2.21 % -3.87 % -3.36 % -0.13 %
Large < 44.8 bn 43.09 5 2011 YTD -9.98 -5.39 -6.80 -5.95
Mid < 8.6 bn 36.93 13 2010 13.73 16.36 12.07 1.05
Small < 1.6 bn 0.00 0 2009 120.70 74.50 98.14 82.66
Micro < 451 ml 0.00 0 2008 -59.91 -54.48 -52.78 -41.22
2007 27.94 36.48 46.59 43.65
2006 54.75 29.27 39.46 33.04
Best weekly Performer (%) 2005 n.a. 30.40 45.07 27.80
1. MPX Mineracao e Energia 13.83 1 year 9.01 19.37 15.17 -1.43
2. Duratex S.A. 6.05 3 years 0.44 -0.19 1.73 2.43
3. BANCO SANTANDER 5.73 5 years 7.06 7.15 12.11 11.99
10 years n.a. 11.45 15.55 14.27
Worst weekly Performer (%) IPOX LatAm 20 Base Date: 01/01/2005, annualized returns (p.a.)
1. HRT Participacoes -6.03
2. Multiplus SA -5.67 Comparative Historical Volatility (%) Bloomberg
3. Redecard - ON -4.45 Days IPXULATT MXEF MXLA IBOV
10 24.20 % 14.46 % 21.43 % 23.51 %
Exposure 30 18.47 13.05 17.46 17.82
VALUE BLEND GROWTH 50 18.82 12.08 16.31 17.40
LARGE 100 22.00 13.66 18.26 17.46
MID © IPOX Schuster LLC. IPOX is a registered international trademark of IPOX Schuster LLC. Index of
Initial Public Offerings (IPOX) and IPOX Derivatives Patent No. US 7,698,197. Past performance is no guarantee of comparable future performance. Please consider the investment objectives, risks, and charges and
expenses carefully before investing. To receive more information on IPOX IPO Indexes and IPOX Analytics, contact [email protected] or call (312) 264-4410.
SMALL
Areas of current exposure


![Autometal - evento FGV [Modo de Compatibilidade] · A Autometal tem apresentado significativos resultados operacionais e financeiros por meio de expansão orgânica e de aquisições](https://img.pdfslide.net/doc/110x75/5c00d18a09d3f2fa038bb39c/autometal-evento-fgv-modo-de-compatibilidade-a-autometal-tem-apresentado.jpg)