Embed Size (px)
Citation preview

The Islamic University –Gaza غزة -اجلامعة االسالمية
Faculty of Engineering عمادة الدراسات العليا
Higher Education Deanship كلية اهلندسة
Civil Engineering Department Design and Rehabilitation of Structures
قسم اهلندسة املدنية
تصميم وتأهيل املنشآت
Improving X-Ray Radiation Resistance Of Concrete
Used In Radio-Diagnostic Centers
حتسني مقاومة اخلرسانة املستخدمة لألشعة السينية يف مراكز التشخيص اإلشعاعي
Submitted by:
Mahmoud Adel Al Najjar
120102661
Supervisors:
Dr. Samir Yassin Prof. Samir Shihada
Associate prof. Of Physics
Islamic Univ. of Gaza
Professor Of Structural Engineering
Islamic Univ. of Gaza
September, 2015

Dedication
I
Dedication
I would like to dedicate this work to my family specially my
mother and my father who loved and raised me and to my
brothers and sisters, for their sacrifice and endless support.
Acknowledgment
II
Acknowledgment
I would like to extend my gratitude and my sincere thanks to my honorable,
esteemed supervisors, Prof. Samir M. Shihada and Dr. Samir Yassin, for
their exemplary guidance and encouragement.
Also, I would like extend my sincere appreciation to all who helped me in
currying out this thesis.
I would like to thank all my lecturers in the Islamic University of Gaza
from whom I learned much and developed my skills.
Also, My thanks to Interpal Foundation for its partial financial support for
the completion of the experiments of this study.
My deepest appreciation and thanks to everyone who helped me in the
completeness of this study, especially to the staff of Material& Soil
Laboratory in the Islamic University of Gaza, and the staff of radiology
department in Al Shifa Medical Complex.
III
ABSTRACT
The present work aims at improving x-ray radiation resistance of concrete that may be
used in radio diagnostic centers.
It is carried out by increasing attenuation properties of normal concrete to satisfy the
properties of the shielding material.
Recycled lead from local disposed cars batteries was used in this study. This waste lead
was recycled, treated and added to the constituents of concrete in shot form with
maximum size of 1.18 mm at different percentages of lead to cement ratios (0% to
140%) with addition of 20% increments and mixed together to produce homogenous
new concrete.
Several tests on fresh and hardened concrete were carried out. The fresh concrete was
tested and performed using slump test to measure its workability. The testing on
hardened concrete was compressive strength at 7 days, 14 days, and 28 days on
(100x100x100mm) cubes. The penetration of x-ray to concrete after 14 days from
casting date was done by exposing x-ray source of 100KeV and 120KeV energies using
special prisms 200X200 mm of different thicknesses (40 mm, 60 mm, 80 mm, 100
mm).
It is observed from this study that when the lead-to-cement ratio is increased from 0% to
80%, concrete compressive strength and x-ray shielding properties are improved with
maximum of 80%. After that, when the lead to cement ratio is increased from 80% to
140%, the x-ray shielding properties of concrete is increased but its compressive
strength is decreased. This suggests that the optimum percentage of recycled lead shot
(RLS) is about 80% of the cement weight. Also, the results have demonstrated that the
density of concrete increases as the percentage of RLS increases, and the workability of
concrete decreases while RLS ratio increases.
In addition, linear attenuation coefficient (LAC) was found to decrease and half value
layer (HVL) increases as photon energy increases. The LAC of concrete with 80% of
ABSTRACT
IV
lead, based on x-ray emission at energy 100KeV and 120KeV, was about 1.35 and
1.76 times higher than that of the concrete without lead, respectively.
The HVL of concrete with 80% of lead, based on x-ray emission at energy 100KeV and
120KeV, was about 1.35 and 1.76 less than that of the concrete without lead,
respectively.
Finally, it is concluded that the inclusion of additives of RLS to concrete is able to
improve its resistant to x-ray radiation in radio-diagnostic centers.
ملخص
V
ملخص من كز التشخيص االشعاعي السينية المستخدمة في مرا لألشعةهدف هذه الدراسة هو تحسين مقاومة الخرسانة
المطلوبة. الحاجبة لألشعة مادةالخالل زيادة خصائص التوهين للخرسانة العادية ليتحقق فيها خصائص
التالفة بطاريات السياراتلواح رصاص أهذه الدراسة وتم الحصول عليه من في تصنيعهاستخدم الرصاص المعاد الخرسانة لمكونات ا بعد ذلكافتهاض وتمومعالجة لهذه االلواح التالفة تصنيع اعادة عملية اء جر وتم ا, المتوفرة محليا
% لكل خلطة 20% بزيادة 140% الى 0مم وبنسب مختلفة من 1.18لها مقاساكبر ةمتدرجعلى شكل برادة .على خلطة متجانسةخلط والحصول الوتم
برت ت, واخالتشغيلتبار الخرسانة الطازجة لتحديد معامل خاجريت عدة اختبارات للخرسانة الطازجة والمتصلدة, فتم ا( 100*100*100)بأبعاديوم واستخدمت مكعبات 28يوم و14ايام و7الخرسانة المتصلدة لتحديد قوة التحمل بعد
بتعريضها لمصدر أشعة سينية يوم من الصبة14 للخرسانة بعد ةالسيني األشعةم لهذا الغرض, وتم اختبار اختراق ممختلفة كاتابسمم م200*200 بأبعادخاصة مناشيرف واستخدمت .أ.ك 120 ,ف.أ.ك 100عند طاقات
.مم( 40,60,80,100)
% فان قوة تحمل الخرسانة 80 % الى0من لإلسمنتلوحظ من هذه الدراسة عندما تزيد نسبة الرصاص المصنع % فان 140% الى 80على, وعندما تزيد النسبة من % األ80تتحسن وتكون عند األشعةوخصائص حجب
.تقلمقاومتها للضغط نية تزيد ولكن يخصائص الخرسانة لحجب االشعة الس
ية, ومن خالل النتائج تبين لهي النسبة المثاو % 80 حتى ةالمصنعالرصاص استخدام برادة من خالل ذلك يفضل المعاد ومعامل التشغيل يقل بزيادة نسبة برادة الرصاص ,ن كثافة الخرسانة تزداد بزياد نسبة برادة الرصاصأ
.تصنيعه
فقيمة سمك النصفي تزيد بينما طاقة الفوتونات تزيد, لا وقيمةيقل الخطين معامل التوهين لذلك وجد أ باإلضافة 120ف و.أ.ك100السينية عند طاقة التعرض لألشعةو %80 اضافة برادة رصاص عندمعامل التوهين الخطي
.الترتيبعلى مرة مقارنة بالخرسانة الخالية من الرصاص 1.76و 1.35 تزيد بمعدلف .أ.ك
ف .أ.ك100السينية عند طاقة والتعرض لألشعة %80 اضافة برادة رصاص عند وقيمة السمك النصفي للخرسانة .الترتيبعلى مرة مقارنة بالخرسانة الخالية من الرصاص 1.76و 1.35 تقل بمعدل ف.أ.ك 120و
للخرسانة لتحسين خواصها كإضافات التصنيع ةالمعادمن خالل النتائج استخدام برادة الرصاص وفي الختام ينصح .لعزل االشعة السينية في مراكز التشخيص االشعاعي
Table of Contents
VI
Table of Contents
Dedication ....................................................................................................................... I
Acknowledgment ............................................................................................................. II
ABSTRACT .................................................................................................................. III
Table of Contents .......................................................................................................... VI
List of Tables ................................................................................................................. IX
List of Figures ................................................................................................................ XI
List of Abbreviations .................................................................................................. XIV
Definitions ................................................................................................................... XV
Chapter (1) Introduction ....................................................................................... 1
1.1 Overview ....................................................................................................................... 2
1.2 Problem Statement ....................................................................................................... 2
1.3 Research Objectives .................................................................................................... 3
1.4 Methodology ................................................................................................................ 4
1.4.1 General .................................................................................................................. 4
1.4.2 Research methodology ........................................................................................ 4
1.4.3 Flow chart of research methodology ................................................................. 6
1.5 Thesis Layout ............................................................................................................... 7
Chapter (2) Literature Review ............................................................................ 8
2.1 Background ................................................................................................................... 9
2.2 Previous Studies ......................................................................................................... 10
2.3 Basic Shielding Parameters ...................................................................................... 14
2.3.1 Half Value Layer ................................................................................................ 14
2.3.2 Linear attenuation coefficient ......................................................................... 14
2.3.3 The mass attenuation coefficient...................................................................... 15
2.4 Types and Characteristics of Radiation .................................................................. 17
2.4.1 Non-ionizing radiation ...................................................................................... 17
2.4.2 Ionizing radiation ............................................................................................... 17
2.5 Nature of X-Rays ....................................................................................................... 18
2.6 Production of X-Rays ................................................................................................ 19
2.6.1 Bremsstrahlung "braking radiation". ............................................................... 19
Table of Contents
VII
2.6.2 "K-shell" emission ............................................................................................. 19
2.7 Absorption of X-Rays ............................................................................................... 20
2.8 Mechanism of Interaction X-Rays with Matter ..................................................... 21
2.9 Radiation Protection Techniques ............................................................................. 22
2.10 Benefits of Concrete as Shielding Material............................................................ 23
2.11 Benefits of Lead Shots as Additive to Normal Concrete...................................... 24
2.12 Criteria for the Selection of a Shield Material ....................................................... 24
2.13 Ionizing Radiation Dose and Units ......................................................................... 25
2.14 Medical Uses of Ionizing Radiation ........................................................................ 26
2.14.1 Radio-therapy ..................................................................................................... 26
2.14.2 Radio-diagnostic ................................................................................................ 26
2.15 Factors Controlling the X-Ray Beam ...................................................................... 27
2.16 Biological Effects of Ionizing Radiation ................................................................ 29
Chapter (3) Constituent Materials and Experimental Program ........... 31
3.1 Introduction ................................................................................................................ 32
3.2 Materials and Their Quality Tests ........................................................................... 32
3.2.1 Aggregate Quality Tests. ................................................................................... 33
3.2.2 Cement ................................................................................................................. 39
3.2.3 Water .................................................................................................................... 39
3.2.4 Recycled Lead (RL) ........................................................................................... 40
3.3 Mix Proportions ......................................................................................................... 44
3.4 Mix Proportion with Recycled Lead Shots(RLS) Material: ................................ 47
3.5 Sample Categories ..................................................................................................... 47
3.6 Mixing, Casting and Curing Procedures ................................................................. 48
3.6.1 Mixing procedures ............................................................................................. 48
3.6.2 Casting procedures ............................................................................................. 50
3.6.3 Curing procedures .............................................................................................. 50
3.7 Equipment and Testing Procedure ........................................................................... 51
3.7.1 Workability (Slump Test) according to ASTM C143 ................................... 51
3.7.2 Density ................................................................................................................. 52
3.7.3 Compressive Strength Tests ............................................................................. 52
3.7.4 Penetration X-Rays Test ................................................................................... 53
Table of Contents
VIII
Chapter (4) Test Results and Discussion ........................................................ 57
4.1 Introduction: ............................................................................................................... 58
4.2 Normal Concrete: ....................................................................................................... 58
4.3 Workability Test Results .......................................................................................... 58
4.3.1 Justification of Results: ..................................................................................... 59
4.4 Mechanical Properties of Hardened Concrete: ...................................................... 59
4.4.1 Compressive strength 7 days age: .................................................................... 59
4.4.2 Compressive strength 28 days age: .................................................................. 60
4.4.3 Compressive strength and time relationship: ................................................. 62
4.5 Density ........................................................................................................................ 65
4.6 Penetration X-Ray Test Results ............................................................................... 67
4.6.1 X-Ray Energy at 100 KeV ................................................................................ 67
4.6.2 X-Ray Energy at 120 KeV ................................................................................ 73
4.6.3 Relation Between X-Ray Energy and Shielding Parameters ....................... 79
Chapter (5) Conclusions & Recommendations ............................................ 83
5.1 Introduction ................................................................................................................ 84
5.2 Conclusions ................................................................................................................ 84
5.3 Recommendations for Further Studies .................................................................... 86
References ................................................................................................................... 88
Appendices .................................................................................................................. 92
List of Tables
IX
List of Tables
Table
no. Title Page
no.
Chapter Two
2.1 Mass attenuation coefficient calculated using XCOM 16
2.2 Common and SI Units for Radiation Quantities 26
Chapter Three
3.1 Unit weight of coarse and fine aggregate test results 35
3.2 Specific gravity of aggregate 36
3.3 Moisture content values of coarse aggregate 37
3.4 Sieve analysis results for fine and coarse aggregate 38
3.5 Natural Coarse Aggregate physical properties 39
3.6 Ordinary Portland cement properties "Test Results" 39
3.7 Physical and chemical properties of recycled Lead Shots 43
3.8 Recycled Lead sieve grading Table 43
3.9 The final average weight for the job mix 45
3.10 Concrete aggregate graduation 45
3.11 Mix design of the concrete cube samples 47
3.12 Concrete samples for X-Rays penetration test. 48
3.13 Concrete samples for targeted Compressive Strength test. 48
Chapter Four
4.1 Mixture proportion and one cubic meter ingredient 58
4.2
Average compressive strength of concrete specimens at 7, 14 and
28 days of age. 61
4.3
Compressive strength at 7, 14 and 28 days of age and percent of
fcut/fcu28for normal concrete and with RLS concrete 63
4.4 Average concrete density specimens at 7, 14 and 28 days of age. 66
4.5 Mechanical properties of concrete at 28 days of age with the ratio
of RLS
67
4.6
Relationship between the thickness of the concrete sample and
detector intensity at several percentage of RLS 70
List of Tables
X
Table
no. Title Page
no.
4.7 Average LAC, MAC and RLS ratio at energy 100KeV. 71
4.8 Average LAC, HVL, TVL and RLS ratio at energy 100KeV. 72
4.9
Relationship between the thickness of the concrete sample and
detector intensity at several percentage of RLS 76
4.10 Average LAC, MAC and RLS ratio at energy 120KeV. 77
4.11 Average LAC, HVL, TVL and RLS ratio at energy 120KeV. 78
4.12
Average LAC, MAC and RLS ratio at energy 100KeV and
120KeV. 81
4.13
Average LAC, MAC, HVL, TVL and RLS ratio at energy 100
KeV and 120 KeV. 82
List of Figures
XI
List of Figures
Figure
no. Title
Page
no.
Chapter One
1.1 Flowchart of the adopted research methodology 6
Chapter Two
2.1 Protection from Ionizing Radiation. 18
2.2 Diagnostic x-ray tube 20
2.3 The photoelectric effect 21
2.4 Compton scatter 22
Chapter Three
3.1 Three types of natural coarse aggregate 34
3.2 Sand sample 34
3.3 Mold of unit weight test 35
3.4 Specific Gravity test equipments 36
3.5 Aggregate graduation of fine and coarse aggregate 38
3.6 (a) Damaged car batteries
(b) Lead sheets
41
3.7 (a) Melting lead sheets at a temperature more than 327 C
(b) Dispose slag
41
3.8 (a) Recycled solid lead
(b) Recycled lead to shots with maximum size of 1.18mm
42
3.9 Ground lead solid by manually 42
3.10 Measuring specific gravity of recycled lead by pycnometer device. 44
3.11 Atomic Absorption Spectrometer Device 44
3.12 Concrete job mix graduation and specifications 46
3.13 Mechanical mixer 49
3.14 Adding the shots recycled lead material with cement powder 50
3.15 (a) Form of timber moulds
(b) Form of steel cubes
50
3.16 Curing process for (a) Samples of penetration test
(b) Samples of compression strength test
51
3.17 Slump value determination 52
3.18 Compressive strength evaluation chart of concrete cube specimens 53
3.19 Compressive strength testing machine 53
3.20 The radiation parameters of x-ray machine 54
3.21 Radiation survey meter (Dosimeter STEP OD-01). 55
3.22 Penetration x-ray test chart for concrete sample. 56
3.23 Penetration test operation 56
List of Figures
XII
Figure
no. Title
Page
no.
Chapter Four
4.1 Relation between the ratio of RLS and slump value. 59
4.2 Relation between the ratio of RLS and 7 days compressive strength 60
4.3 Relation between the ratio of RLS and 28 days compressive strength 61
4.4 Relation between the ratio of RLS and 7, 14 and 28 days
compressive strength
62
4.5 Age and compressive strength relationship for normal concrete and
with RLS.
64
4.6 Average 28 day concrete density versus percentage of RLS 65
4.7 Relation between the ratio of RLS and 7, 14 and 28 days concrete
density
66
4.8 Intensity for RLS= 0 & 20% at 100KeV 68
4.9 Intensity for RLS= 0 & 40% at 100KeV 68
4.10 Intensity for RLS= 0 & 60% at 100KeV 69
4.11 Intensity for RLS= 0 & 80% at 100KeV 69
4.12 Intensity for RLS= 0 &100% at 100KeV 69
4.13 Intensity for RLS= 0 &120% at 100KeV 69
4.14 Intensity for RLS= 0 &140% at 100KeV 69
4.15 Relation between the thickness of the concrete samples and detector
intensity at several percentage of RLS
70
4.16 Relation between RLS ratio and LAC values at 100 KeV 71
4.17 Relation between RLS ratio and HVL values at 100 KeV 73
4.18 Intensity for RLS = 0 & 20% at 120 KeV 74
4.19 Intensity for RLS = 0 & 40% at 120 KeV 74
4.20 Intensity for RLS = 0 & 60% at 120 KeV 74
4.21 Intensity for RLS = 0 & 80% at 120 KeV 74
4.22 Intensity for RLS = 0 & 100% at 120 KeV 75
4.23 Intensity for RLS = 0 & 120% at 120 KeV 75
4.24 Intensity for RLS = 0 & 140% at 120 KeV 75
4.25 Relation between the thickness of the concrete samples and detector
intensity at several percentages of RLS
76
4.26 Relation between RLS ratio and LAC values 77
4.27 Relation between RLS ratio and HVL values at 120 KeV 77
4.28 Relation between RLS ratio and LAC values at100KeV and 120KeV 77
4.29 Relation between RLS ratio and MAC values at100KeVand 120KeV 77
4.30 Relation between RLS ratio and HVL values at100KeV and 120KeV
82
List of Figures
XIII
Figure
no. Title
Page
no.
Appendices
A.1 Mechanical Mixer 94
A.2 Adding of materials to the mix 94
A.3 Aggregate Sample In Oven Dry 94
A.4 Adding and Moving the RLS to Cement 95
A.5 Atomic Absorption Spectrometer Device 95
A.6 Slump Test Of Fresh Mix. 96
A.7 A timber Cubes for Penetration Test Samples 96
A.8 Curing Concrete Sample for Compressive Strength and Penetration
Test
97
A.9 Compressive Strength test Machine and Sample 97
A.10 Installation Steel Holder and Concrete sample. 98
A.11 X-ray-Dosimeter STEP OD-01 98
A.12 Calibration and Installation X-ray-Dosimeter STEP OD-01 99
A.13 Calibration and Installation basic X-ray machine. 99
A.14 Exposing Concrete Sample to Radiation Dose At 120KeV. 100
A.15 Certificate of radiation survey meter (OD-01) calibration 101
B.1 Disposed Car Batteries. 101
B.2 Extracting Lead Sheets From Car Batteries. 101
B.3 Melting lead sheets at a temperature more than 327 C and disposing
slags.
104
B.4 Flowing Liquid of Lead (In Special Steel Mold). 104
B.5 Solid Recycled Lead. 105
B.6 Ground lead solid by manually 106
B.7 Recycled Lead Shots (RLS). 106
List of Abbreviations
XIV
List of Abbreviations
(𝐟𝐜𝐮)28 Compressive Strength at 28 Days of Cubes10x10x10cm in Dimension
(𝐟𝐜𝐮)t Predicted Compressive Strength At t Time
MOH Ministry Of Health
NC Normal Concrete
I Detector Intensity
Sv Sievert (unit of effective dose)
mSv milliSievert
µsv Micro Sivert
µsv/h Micro Sivert per hour
ACI American Concrete Institute
ALARA As Low As Reasonable Achievable
ASTM American Society for Testing and Material
EPA Environmental Protection Agency
HVL Half Value Layer
ICRP International Commission on Radiological Protection
IR Ionizing Radiation
NIR Non-ionizing radiation
KeV Kilo Electron Volt
kVp kilovolts peak (unit to describe X-ray tube voltage)
LAC Linear Attenuation Coefficient
mA MilliAmpere (unit to describe X-ray tube current)
MOH Ministry Of Health
NCRP National Council on Radiation Protection
NOHSC National Occupational Health and Safety Commission
RL Recycled Lead
RLS Recycled Lead Shot
SDD Source Dosimeter Detector Distance
SOD Source Object Detector Distance
UNRWA United Nations Relief and Work Agency
UNSCEAR United Nations Scientific Committee on the Effects of Atomic Radiation
W/C Water Cement Ratio
WHO World Health Organization
Definitions:
XV
Definitions:
Diagnostic radiology: the use of X-rays to diagnose disease or injury, or provide
imaging information for medical purposes.
Diagnostic X-ray machines: any electronic device that has fast-moving electrons is
a potential source of ionizing radiation.
X-ray: ionizing electromagnetic radiation emitted by an atom when it has been
bombarded with electrons.
Radio-diagnostic centers: A places that offers diagnostic services to medical
profession or general public (Brant and Helms 2012).
Dose: a general term used to refer to the amount of energy absorbed by tissue from
ionizing radiation.
Equivalent dose: a measure of dose in organs and tissues which takes into account
the type of radiation involved. The unit of equivalent dose is J kg-1, with the special
name Sievert (Sv).
Sievert (Sv): the special name for the SI unit of equivalent dose, effective dose, and
operational dose quantities. The unit is joule per kilogram (J/kg).

Chapter One: Introduction
1
Chapter One:
Introduction Chapter One: Introduction
1.1 Overview
1.2 Problem Statement
1.3 Research Objectives
1.4 Methodology
1.5 Thesis Layout
.
Chapter One: Introduction
2
1 Chapter One: Introduction
1.1 Overview
The radiation dosimetry is an important subject in physics, as the radiation started to be
used in various fields with the development of technology. Besides many benefits that
come from the application of radiation, it is hazardous for human cells which should be
protected. This can be made possible by applying three main methods namely time,
distance and shielding in a proper way. The latter is the largely used method especially
for critical buildings such as Radio-Diagnostic Centers. Heavy elements such as lead or
tungsten are ideal materials to be used in radiation shielding. However, these materials
cannot be used directly in building construction due to durability and economic
problems. Concrete is one of the main materials used in building construction, even
though it is a less effective shielding material than, e.g. lead. Alternatively, production
of concrete where different types of aggregates or material used becomes important for
this purpose (Akkurt, 2010a,b; Neville, 1996).
The objective of the present work is to improve x-ray radiation resistance of concrete
used in Radio-Diagnostic centers by increasing attenuation properties of normal
concretes. This would satisfy the properties of a shielding material by adding recycled
lead shots in different percentages with concrete in order to decrease the transmittance
of x-rays radiation. Linear attenuation coefficients of material used will be measured.
In addition, the half value layer of material thickness will be determined (Eaves, 1964;
Akkurt et al., 2010; Singh et al. , 2008).
1.2 Problem Statement
Radiation has a harmful effect on health according to World Health Organization
(WHO). Thus, it is necessary to minimize their dangers by three general rules as
mentioned previously.
Radio-Diagnostic centers and hospitals in Gaza Strip are constructed using ordinary
concrete and isolated lead plates to shield radiations with no special concrete available
for that purpose, according to engineering office in the ministry of health (MOH).
In addition, due to the lack of scientific studies in the Gaza Strip in order to examine the
concrete x-ray radiation resistance and tries to improve it. The work in hospitals of Gaza
Chapter One: Introduction
3
Strip is based on the construction of the diagnosis rooms from ordinary concrete and
lead plates. This would increase the cost due to the larger thickness of walls made from
ordinary concrete in addition to the high cost of lead used in Altersas process of
chambers of radiology.
The presence of the large number of damaged car batteries in Gaza Strip which are
harmful to the environment including land and human health problems according to the
ministry of health (MOH). Therefore, it is necessary to dispose them by collecting them
in a safe place and then recycling them.
In the present work, recycled lead with maximum size of 1.18mm is to be added to the
concrete to improve x-ray radiation resistance. In addition, compressive strength will be
investigated in order to ensure that it is not reduced.
1.3 Research Objectives
The main aim of this research is to improve of x-ray radiation resistance of concrete
used in Radio-Diagnostic centers. This aim can be achieved through the following
objectives:
1. Identify relation between admixtures added to concrete and the linear attenuation
coefficients (index for shielding ability). Also, the half value layer (HVL) and
mass attenuation coefficients of the new type of concrete will be evaluated and
determined.
2. Identify effect of change photon energy for linear attenuation coefficients (LAC)
and half value layer (HVL).
3. Determine concrete properties such as slump test, density and compressive
strength at all recycled lead (RL) percentages.
4. Perform tests on recycled lead, such as specific gravity, sieve analysis and
chemical analysis.
5. Find optimum percentage of recycled lead (RL) to be used in improving X-Ray
radiation resistance concrete used in Radio-Diagnostic centers.
Chapter One: Introduction
4
6. Study relation between thickness of the concrete with and without RLS required
and the ability of x-ray to penetrate concrete sample.
7. Disposal of harmful waste by using lead in concrete to reduce the environmental
and health problems
1.4 Methodology
1.4.1 General
To achieve the objectives of this research, the following activities will be executed:
1- Conduct literature review from references (thesis, recent papers, books) about
the radiation transmission of concrete including shielding materials.
2- Visiting the Gaza Strip sites where new car batteries are bought and disposed
car batteries. This is found to obtain related information such as lead sheets
composition and quantity of waste car batteries, then collecting disposed car
batteries from their sources.
1.4.2 Research Methodology
Preparation of concretes
Waste lead sheets in car batteries was used as an additive after recycling it by a
special method, added recycled lead in forms shots with maximum diameter of
1.18 mm to the constituents of concrete in different percentage of lead to cement
ratio (20%, 40%, 60%, 80%, 100%, 120%, 140%) and mixing together to
produce homogenous new concrete then casting it's in cubes and prisms.
Obtained mixtures were molded into cubes with dimension of 100x100x100 mm
for compression test and 200x200x (40, 60, 80, 100) mm prisms for x-ray
penetration test.
Testing of the samples:
Performed three tests to concrete:
A. Slump test on fresh concrete.
B. Compressive strength test on hardened concrete
Concrete specimens were experimentally investigated after 7 days, 14 days, and 28
days on (100x100x100 mm) cubes.
Chapter One: Introduction
5
C. Penetration of x-ray to concrete samples
The test was performed after 14 days from casting at different photons energy
100KeV and 120KeV .
Using X-Ray-Dosimeter STEP OD-01 that found in Nayaf radiation center to
measure absorb dose(µsv/h) through concrete samples.
The linear attenuation coefficients (µ, cm−1) will be determined by Lambert
law’s:
I = I0e−μx
Where X is concrete thickness, 𝐈𝟎 is the incident X-ray and I is the photon intensity
recorded in detector after passing the concrete material.
Tests were performed on recycled lead, such as specific gravity, sieve analysis
and chemical analysis.
Analysis of results, and recommendations will be prepared, then choosing the best
recycled lead percentage to be added to produce effective shielding concrete.
Chapter One: Introduction
6
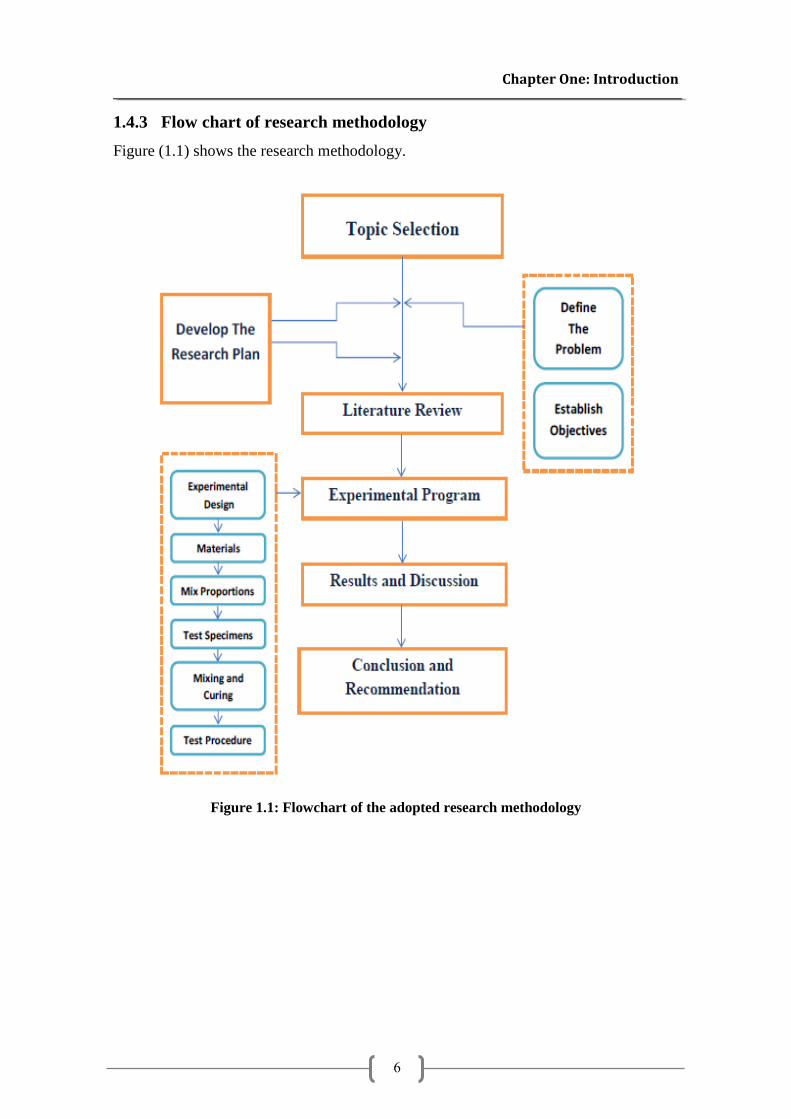
1.4.3 Flow chart of research methodology
Figure (1.1) shows the research methodology.
Figure 1.1: Flowchart of the adopted research methodology
Chapter One: Introduction
7
1.5 Thesis Layout
The present work contains five chapters organized as follows:
Chapter-1 (Introduction)
Introduces the use of the new concrete to resist x-rays radiation by adding special
materials such as recycled lead. Also, it includes a description of research importance,
scope, objectives, methodology, and the report organization.
Chapter-2 (Literature Review)
Presents a general literature review for studying the use of additives such as lead
materials to concrete in engineering practice. These research studies include the
properties of the concrete as shielding material and overview the types of x-rays
radiation.
Chapter-3 (Constituent Materials and Experimental Program)
Presents the experimentation program and the used materials. Furthermore, the involved
variables, concrete mix, mix design, casting and testing of specimens and materials are
also illustrated.
Chapter-4 (Test Results and discussion)
Aims to clarify the essentials of concrete compressive strength analysis and the
methodology followed to highlight the usefulness of considering of recycled lead
material as a main component to improve x-ray radiation resistance of concrete used in
Radio-Diagnostic centers.
Chapter-5 (Conclusions and Recommendations)
A comprehensive summary of this research study, its major conclusions, and
recommendations for future research are presented.
References.
It includes the listing of references used in preparing the study.
Appendices.
It includes photos from the experimental program and divided into "A" and "B"
Chapter One: Introduction
8
Chapter Two:
Literature Review
2.1 Background
2.2 Previous Studies
2.3 Basic Shielding Parameters
2.4 Types and Characteristics of Radiation
2.5 Nature of X-rays
2.6 Production of X-rays
2.7 Absorption of X-rays
2.8 Mechanism of Interaction X-rays with Matter
2.9 Radiation Protection Techniques
2.10 Benefits of Concrete as Shielding Material.
2.11 Benefits of Lead Shots as Additive to Normal Concrete
2.12 Criteria for the Selection of a Shield Material
2.13 Ionizing Radiation Dose and Units
2.14 Medical Uses of Ionizing Radiation
2.15 Factors Controlling the X-ray Beam
2.16 Biological Effects of Ionizing Radiation
Chapter Two: Literature Review
9
2 Chapter Two: Literature Review
2.1 Background
Portland cement concrete is an ideal material for use in construction of radiation shields.
Although there are other materials that could be employed for radiation shielding
purposes, concrete is not only economical, but it also has the advantage of being a
material that can be cast into any desired homogenous structural shape. Concrete is now
commonly used for shielding of atomic research facilities, nuclear power plants, and for
radiation medical and research units or equipment.
Conventional concrete of sufficient thickness can be and is being used for such
purposes. However, where usable space is a major consideration; the reduction in the
thickness of the shield is accomplished by the use of high density concrete.
In recent years, many attempts have been made to increase radiation protection
properties of concrete. Minerals such as magnetite, hematite, geothite and ilmenite were
added as aggregates in concrete and their effects have been determined by Neville
(Neville, 1996; Rezaei-Ochbelagh et al., 2010, 2011). Effects of barite and lead as
additive materials in concrete have been separately investigated (Akkurt et al.,
2010a,b; El-Hosiny and El-Faramawy, 2000). It is known that attenuation properties
depend on the additives of concrete, thickness and density of specimen and gamma ray
energy.
Lead has a very high density of 11.35 g/cm3 and is an excellent shielding material for X
and gamma rays. For this reason, lead is used as a suitable material for attenuation of
gamma rays. Lead is available in a variety of forms such as bricks, sheets and plates.
Because of its toxicity, lead should be encased in concrete or be protected by heavy
coats of paint or drywall (NCRP, 2005). In this research, the concrete containing lead
shield was investigated for x-ray absorption. In order to verify the effect of lead, lead
was used as shot in different size added to concrete.
There are three general rules for protection: exposure time, distance, and shielding. In
most cases, shielding is the main rule to be performed (Eaves, 1964), although
materials such as lead and iron are effective anti-ray shields, mechanical and
economical considerations limit their usage to some special areas (Akkurt et al. ,2010).
Chapter Two: Literature Review
10
On the other hand, concrete is paramount material utilized for radiation shielding in the
facilities having radiation generating equipment and radioactive sources (Singh et
al.,2008).
It is very crucial that materials used for this purpose are available in the country. In this
respect, the studies of the absorption of radiation in materials which are locally available
have become an important issue and thus it is desirable to have the knowledge about the
effective materials for gamma and x-ray shielding.
The aim of this work is to develop special and economical concrete with good shielding
properties by using local lead waste extracted from disposed car batteries.
2.2 Previous Studies
Several studies as follows were conducted on radiation shielding properties of
materials:
Rezaei-Ochbelagh and Azimkhani, 2012, studied concrete mixed with different
percentages of lead (in three forms: powder, shots with radius of 2 mm, and a plate with
dimension of 100 mm X 100 mm X 1.0 mm) to gamma-ray shielding properties.
Obtained mixtures were molded into cubes with dimension of 10x10x10 𝑐𝑚3. The
transmitted fluxes of gamma-rays that were emitted from 𝐶𝑠137and 𝐶𝑜60 sources were
detected, density, compressive strength and linear attenuation coefficients (LAC) of
concrete specimens were experimentally investigated.
It was observed from experimental results that when the lead-to-cement ratio is
increased from 0% to 90% in concrete, its compressive strength and gamma ray
shielding properties also improved and its maximum at 90%. After that, when the lead-
to-cement ratio is increased from 90% to 300% in concrete, the gamma ray shielding
properties of concrete is increased but its compressive strength decreased and found it is
not usable as a shielding element. The LAC of concrete with 90% of lead, based on
gamma ray emission from Cs137and Co60 sources, was about 1.58 and 1.38 times higher
than that of the concrete without lead, respectively.
Mortazavi et al., 2007, investigated the effects of galena mineral added to shielding
concrete. The Galena mineral had a density of 7400 kg/𝑚3. the ideal composition is
86.6% lead and 13.4% sulfur. The concrete samples made had a density of 4800 kg/𝑚3
Chapter Two: Literature Review
11
in comparison to that of ordinary concrete (2350 kg/𝑚3 ) or barite high-density concrete
(up to 3500 kg/𝑚3). The measured half value layer (HVL) thickness of Galena concrete
samples for cobalt-60 gamma rays (1.25 MeV) was much less than that of ordinary
concrete (2.6 cm compared to 6.0 cm). Furthermore, Galena concrete samples had a
significantly higher compressive strength (500 kg/𝑐𝑚2 compared to 300 kg/𝑐𝑚2).
Based on the preliminary results obtained, Galena concrete showed to be a highly
suitable option where high-density concrete is required in megavoltage radiotherapy
rooms, as well as nuclear reactors.
Erdem et al., 2010, analyzed anovel shielding material produced by a metallurgical
solid waste prepared from Cinkur Zinc-Lead Metal Industry containing mainly on lead
19% and other elements as shielding material for different gamma energies (range from
88 to 1332.5 keV) by using different point radioactive sources. The photon total mass
attenuation coefficients (μ
𝜌) were measured, Shielding material was prepared by mixing
cement and the waste sample were mixed homogenously. Mortar was prepared by
water/cement ratio = 0.60 , Six different thicknesses (0.5, 1, 1.5, 2, 2.5 and 3 cm) of
specimens of radiation shielding materials produced from the solid waste and ordinary
Portland cement were prepared. The mass attenuation coefficients (μ
𝜌) were determined
by measuring the transmission of gamma rays through targets of those six different
thicknesses individually.
In their work, it has been clearly seen that variations in the chemical composition of the
materials are more significant. Despite the new material has low density (2.19 𝑔 𝑐𝑚−3),
the total mass attenuation coefficient that is approximately equal to that of lead has been
measured in high energy region in particular.
Its concluded in the high region of photon energy shows that the novel shielding
material prepared from a metallurgical solid waste containing lead would be preferred
as shielding material for buildings against gamma radiation.
Kharita et al., 2009, investigated effects of Carbon powder added to shielding
concrete made of Hematite aggregates on shielding properties. The powder was added
in different percentages in the range of 3%–12% , and the mechanical and radiation
attenuation properties of the prepared concretes were determined.
Chapter Two: Literature Review
12
It can be noticed that adding carbon powder to concrete in the range of 3%–12% has
improved its slump, which is an indicator for workability of the fresh concrete.
The attenuation was determined experimentally using Cs-137 source for gamma rays,
and Am-Be neutron source for neutron rays. It is obvious from results no significant
effect on shielding properties but the strength increased with carbon addition up to 6%
of carbon powder, this increase is about 15.2% of the original mixture.
The measured results can be noticed that, the specific weight decreases with the increase
in the added portion of carbon powder. This is expected as the carbon powder has less
specific weight than the used aggregates and cement paste.
It was concluded that, the addition of carbon powder by 6% (by wt.) of the concrete
could increase the strength on concrete by about 15%, so it is recommended to add 6%
of carbon powder for Hematite concrete which shows the cause the best improvement in
the workability, and strength of this concrete.
Kharita et al., 2010, investigated the effect of water to cement ratio (W/C), on
shielding properties of ordinary concrete, five concrete mixtures have been prepared
using the same proportions of cement, sand, and gravels, but different contents of water
(five different water to cement ratios ranges between 0.43% by weight and 0.63% by
weight) were prepared. The cubic specimens of each mixture were prepared; with
dimensions of 10*10*10 cm, and preserved for 28 days in water bath of 25oC.
The attenuation coefficients were measured for Cs137 (Energy 661 keV) gamma source
and Am-Be neutron source. The attenuation was studied by measuring the ratio of the
penetrating to the incident radiation through the three axes of cube, three times for each
axis. The average values and standard deviations for each mixture and for each type of
radiations were calculated.
The statistical tests show no significant difference between the attenuation coefficients
for both neutrons and gamma for the five prepared mixtures. This indicates that the
effect of the changes of water to cement ratio is too small and fall within the range of
the statistical errors of measurements and minor changes in density and composition
between concrete specimens. On other hand, the W/C ratio effect on the strength has
Chapter Two: Literature Review
13
been noticed clearly in the specimens. It decreases significantly with the increase of the
W/C ratio (in the studied range of ratios). Hence, there is no need to increase this water
to cement ratio as a way to improve the shielding effectiveness of ordinary concretes.
Berna and Aycan, 2013, measured gamma radiation shielding properties of concretes
containing ulexite(U) and ulexite concentrator waste(UCW) at the 59.54 and 80.99 keV
energies. Ulexite is the most important boron ores and UCW is produce from the
processing of boron ores. The values of mass attenuation coefficient for concretes were
determined, two groups of concretes, containing ulexite and ulexite concentrator waste,
were prepared. Totally 10 different concretes produced by using U and UCW in the
ratios of 2.5%, 5.0%, 7.5%, 10% and 20% (in weight) to the cement, all mixtures were
poured into 15X15X4 cm moulds.
It was determined that, the concretes containing U were absorbed gamma rays more
than the concretes containing UCW. The main reason of this is that the density of U is
higher than UCW.
The concretes containing U and UCW in 10%≤ rates more attenuated gamma rays than
the ordinary concrete, without additives. It is concluded that the addition of ulexite and
ulexite concentrator waste (10%≤) in concrete is an alternative option that can be used
for the purposes of gamma ray shielding.
Akkurt et al., 2010, measured the linear attenuation coefficients of barite, concrete
produced with barite and compared with the standard shielding material lead. Using 𝛾-
ray sources of 𝐶𝑠137 and 𝐶𝑜60 which emit 662, 1173 and 1332keV energies
respectively.
Barite(BaSO4) is an alternative material can be used directly or as an aggregate in the
concrete for this purposes.
It is clear that the linear attenuation coefficients are the highest for lead as expected. It
can also be seen that the linear attenuation coefficients of barite are higher than barite
concrete.
The results of mean free path (mfp) as a function of photon energy are displayed, where
the low energy photon can lost its energy in short distance while high energy photons
Chapter Two: Literature Review
14
needs long distance. It is also clear that photons lost its energy in short distance for
leads medium than others for all energy.
It is concluded from this work that while the lead is an ideal shielding materials, barite
itself and using it in concrete as an aggregate can be an alternative shielding materials to
be used in building construction.
2.3 Basic Shielding Parameters
2.3.1 Half Value Layer: Thickness of a shielding material required to reduce
the intensity of radiation at a point to one half of its original intensity. Table (2.1)
displays half value layers for concrete and various shielding materials . It can be
calculated by setting I = ½ 𝑰𝟎 and solving the attenuation equation for x:
𝑥1 2⁄ =0.693
𝜇= 𝐻𝑉𝐿 eqn.(2.1)
2.3.2 Linear attenuation coefficient µ (𝐜𝐦−𝟏): the probability of a photon
interacting in a particular way with a given material, per unit path length, and is
of great importance in radiation shielding. However, linear attenuation coefficients
depend on thickness and the density of shielding materials (Kaplan, 1989; El-Sayed
et al., 2002), also the incident photon energy, the atomic number Z of the medium, and
the chemical composition of the absorbing materials’ parameters such as their types,
thickness and densities (Woods, 1982).
Note that µ has dimensions of inverse length (1/cm). The reciprocal of µ is defined as
the mean free path, which is the average distance the photon travels in an absorber
before an interaction takes place.
Also the magnitude of linear attenuation coefficients, µ that can vary with the density of
the shielding materials were calculated by multiplying mass attenuation coefficient of
each type of concrete in its density.
Chapter Two: Literature Review
15
2.3.3 The mass attenuation coefficient µ𝐦 (𝐜𝐦𝟐𝐠−𝟏): is the basic parameter which
describes the interaction of x and gamma rays with shielding materials. The (µ𝛒) is a
probability of interactions between incident photons and materials that occur in a mass-
per-unit area (Shivaramu, et al., 2001). Table (2.1) demonstrates mass attenuation
coefficients for concrete and various shielding materials. If a photon beam having an
initial intensity 𝑰𝟎 penetrates the matter, it will be attenuated and its intensity decreases
exponentially according to the exponential law:
𝐼 = 𝐼0𝑒−(
𝜇𝑙𝑖𝑛𝑒𝑎𝑟𝜌
)𝜌𝑥= 𝐼0𝑒−𝜇𝑚 𝑑 eqn.(2.2)
This is called the Beer–Lambert law, where I is the transmitted intensity, ( µlinear )is the
linear attenuation coefficient in cm−1 , ρ is the material density in g cm−3, x is the
thickness of the absorbing, where d is 𝜌𝑥 (𝑔 𝑐𝑚−2).
For a given photon energy, µ𝐦 does not change with the physical state of a given
absorber. For example, it is the same for water whether present in liquid or vapor form.
Importance of knowledge of mass attenuation coefficient (𝝁𝒎)
1. The accurate values of mass attenuation coefficients (𝝁𝒎) of 𝛾-rays in several
materials are of great importance for industrial, biological, agricultural and medical
studies.
2. A number of related parameters can be derived from mass attenuation coefficient
such as mass energy-absorption coefficient, the total interactions cross-section, the
molar extinction coefficient, the effective atomic number and the electron density
(Singh et al.,2002).
Chapter Two: Literature Review
16
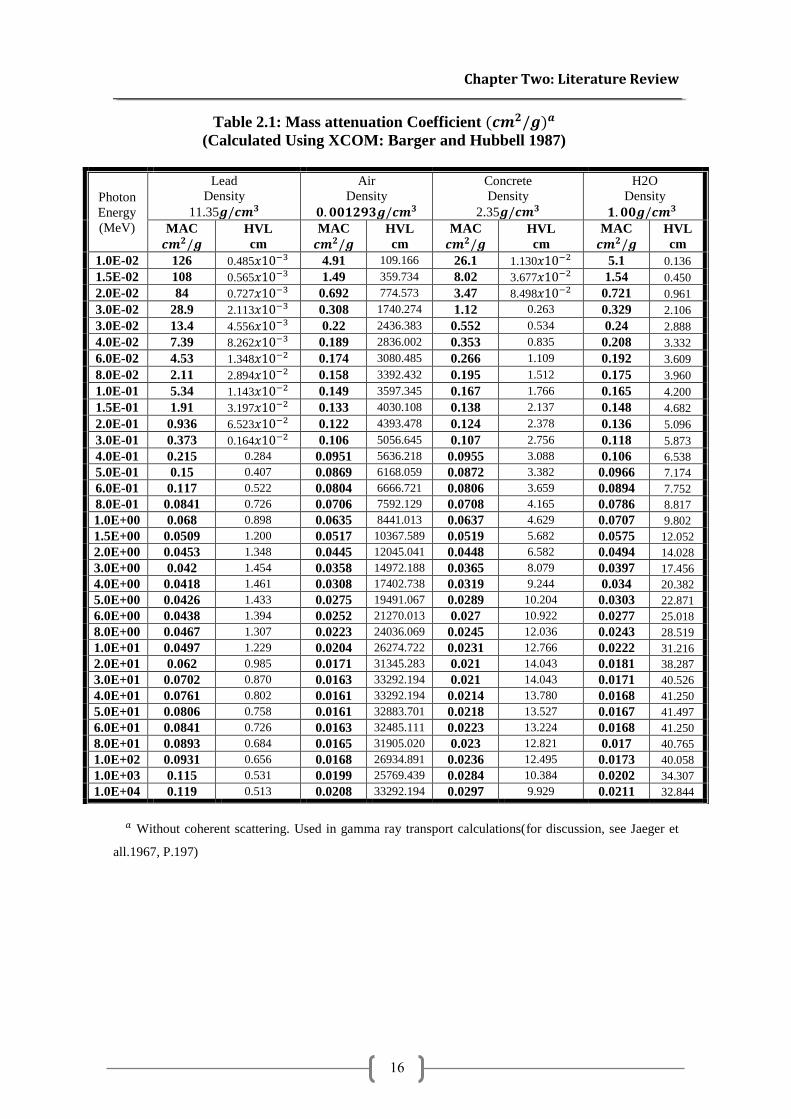
Table 2.1: Mass attenuation Coefficient (𝒄𝒎𝟐/𝒈)𝒂
(Calculated Using XCOM: Barger and Hubbell 1987)
𝑎 Without coherent scattering. Used in gamma ray transport calculations(for discussion, see Jaeger et
all.1967, P.197)
Photon
Energy
(MeV)
Lead
Density
11.35𝒈/𝒄𝒎𝟑 𝟎. 𝟎𝟎𝟏𝟐𝟗𝟑𝒈/𝒄𝒎𝟑
Air
Density
Concrete
Density
2.35𝒈/𝒄𝒎𝟑 𝟏. 𝟎𝟎𝒈/𝒄𝒎𝟑
H2O
Density
MAC
𝒄𝒎𝟐/𝒈
HVL
cm
MAC
𝒄𝒎𝟐/𝒈
HVL
cm 𝒄𝒎𝟐/𝒈
MAC HVL
cm
MAC
𝒄𝒎𝟐/𝒈
HVL
cm
1.0E-02 126 0.485𝑥10−3 4.91 109.166 26.1 1.130𝑥10−2 5.1 0.136
1.5E-02 108 0.565𝑥10−3 1.49 359.734 8.02 3.677𝑥10−2 1.54 0.450
2.0E-02 84 0.727𝑥10−3 0.692 774.573 3.47 8.498𝑥10−2 0.721 0.961
3.0E-02 28.9 2.113𝑥10−3 0.308 1740.274 1.12 0.263 0.329 2.106
3.0E-02 13.4 4.556𝑥10−3 0.22 2436.383 0.552 0.534 0.24 2.888
4.0E-02 7.39 8.262𝑥10−3 0.189 2836.002 0.353 0.835 0.208 3.332
6.0E-02 4.53 1.348𝑥10−2 0.174 3080.485 0.266 1.109 0.192 3.609
8.0E-02 2.11 2.894𝑥10−2 0.158 3392.432 0.195 1.512 0.175 3.960
1.0E-01 5.34 1.143𝑥10−2 0.149 3597.345 0.167 1.766 0.165 4.200
1.5E-01 1.91 3.197𝑥10−2 0.133 4030.108 0.138 2.137 0.148 4.682
2.0E-01 0.936 6.523𝑥10−2 0.122 4393.478 0.124 2.378 0.136 5.096
3.0E-01 0.373 0.164𝑥10−2 0.106 5056.645 0.107 2.756 0.118 5.873
4.0E-01 0.215 0.284 0.0951 5636.218 0.0955 3.088 0.106 6.538
5.0E-01 0.15 0.407 0.0869 6168.059 0.0872 3.382 0.0966 7.174
6.0E-01 0.117 0.522 0.0804 6666.721 0.0806 3.659 0.0894 7.752
8.0E-01 0.0841 0.726 0.0706 7592.129 0.0708 4.165 0.0786 8.817
1.0E+00 0.068 0.898 0.0635 8441.013 0.0637 4.629 0.0707 9.802
1.5E+00 0.0509 1.200 0.0517 10367.589 0.0519 5.682 0.0575 12.052
2.0E+00 0.0453 1.348 0.0445 12045.041 0.0448 6.582 0.0494 14.028
3.0E+00 0.042 1.454 0.0358 14972.188 0.0365 8.079 0.0397 17.456
4.0E+00 0.0418 1.461 0.0308 17402.738 0.0319 9.244 0.034 20.382
5.0E+00 0.0426 1.433 0.0275 19491.067 0.0289 10.204 0.0303 22.871
6.0E+00 0.0438 1.394 0.0252 21270.013 0.027 10.922 0.0277 25.018
8.0E+00 0.0467 1.307 0.0223 24036.069 0.0245 12.036 0.0243 28.519
1.0E+01 0.0497 1.229 0.0204 26274.722 0.0231 12.766 0.0222 31.216
2.0E+01 0.062 0.985 0.0171 31345.283 0.021 14.043 0.0181 38.287
3.0E+01 0.0702 0.870 0.0163 33292.194 0.021 14.043 0.0171 40.526
4.0E+01 0.0761 0.802 0.0161 33292.194 0.0214 13.780 0.0168 41.250
5.0E+01 0.0806 0.758 0.0161 32883.701 0.0218 13.527 0.0167 41.497
6.0E+01 0.0841 0.726 0.0163 32485.111 0.0223 13.224 0.0168 41.250
8.0E+01 0.0893 0.684 0.0165 31905.020 0.023 12.821 0.017 40.765
1.0E+02 0.0931 0.656 0.0168 26934.891 0.0236 12.495 0.0173 40.058
1.0E+03 0.115 0.531 0.0199 25769.439 0.0284 10.384 0.0202 34.307
1.0E+04 0.119 0.513 0.0208 33292.194 0.0297 9.929 0.0211 32.844
Chapter Two: Literature Review
17
2.4 Types and Characteristics of Radiation
2.4.1 Non-ionizing radiation
Non-ionizing radiation (NIR) has less energy than ionizing radiation; it does not possess
enough energy to produce ions. Examples of non-ionizing radiation are visible light,
infrared, radio waves, microwaves, and sunlight. Global positioning systems, cellular
telephones, television stations, FM and AM radio, baby monitors, cordless phones,
garage-door openers, and ham radios use non-ionizing radiation. Other forms include
the earth’s magnetic field, as well as magnetic field exposure from proximity to
transmission lines, household wiring and electric appliances. These are defined as
extremely low-frequency (ELF) waves and are not considered to pose a health risk.
2.4.2 Ionizing radiation
Ionizing radiation (IR) is electromagnetic radiation that has sufficient energy to remove
electrons from atoms (WHO, 2009). Ionization results in the production of negatively
charged free electrons and positively charged ionized atoms (EPA, 2007).
IR can be classified into two categories: particles (α and β particles and neutrons) and
photons (X-ray and γ- radiation) (UNSCEAR, 2006).
2.4.2.1 Particles categories (α and β particles and neutrons)
Alpha particles (α), are made up of two protons and two neutrons each and that carry a
double positive charge. Due to their relatively large mass and charge, they have an
extremely limited ability to penetrate matter. Alpha radiation can be stopped by a piece
of paper or the dead outer layer of the skin. Beta particles (β), are ejected from an
atom’s nucleus and that are physically identical to electrons. Beta particles generally
have a negative charge, are very small and can penetrate more deeply than alpha
particles. However, most beta radiation can be stopped by small amounts of shielding,
such as sheets of plastic, glass or metal. Neutrons (n), a common source of neutrons is
the nuclear reactor, in which the splitting of a uranium or plutonium nucleus is
accompanied by the emission of neutrons. Neutrons are able to penetrate tissues and
organs of the human body when the radiation source is outside the body. Neutron
radiation is best shielded or absorbed by materials that contain hydrogen atoms, such as
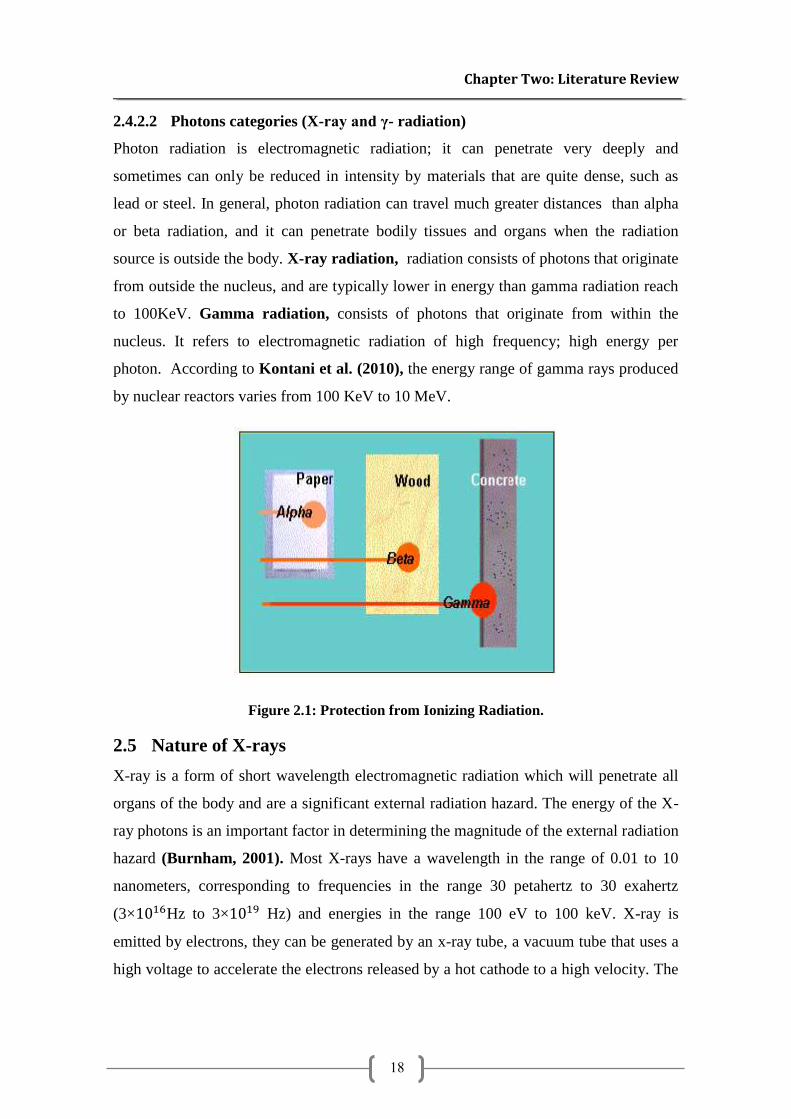
paraffin wax and plastics see figure (2.1).
Chapter Two: Literature Review
18
2.4.2.2 Photons categories (X-ray and γ- radiation)
Photon radiation is electromagnetic radiation; it can penetrate very deeply and
sometimes can only be reduced in intensity by materials that are quite dense, such as
lead or steel. In general, photon radiation can travel much greater distances than alpha
or beta radiation, and it can penetrate bodily tissues and organs when the radiation
source is outside the body. X-ray radiation, radiation consists of photons that originate
from outside the nucleus, and are typically lower in energy than gamma radiation reach
to 100KeV. Gamma radiation, consists of photons that originate from within the
nucleus. It refers to electromagnetic radiation of high frequency; high energy per
photon. According to Kontani et al. (2010), the energy range of gamma rays produced
by nuclear reactors varies from 100 KeV to 10 MeV.
Figure 2.1: Protection from Ionizing Radiation.
2.5 Nature of X-rays
X-ray is a form of short wavelength electromagnetic radiation which will penetrate all
organs of the body and are a significant external radiation hazard. The energy of the X-
ray photons is an important factor in determining the magnitude of the external radiation
hazard (Burnham, 2001). Most X-rays have a wavelength in the range of 0.01 to 10
nanometers, corresponding to frequencies in the range 30 petahertz to 30 exahertz
(3×10¹⁶Hz to 3×10¹⁹ Hz) and energies in the range 100 eV to 100 keV. X-ray is
emitted by electrons, they can be generated by an x-ray tube, a vacuum tube that uses a
high voltage to accelerate the electrons released by a hot cathode to a high velocity. The
Chapter Two: Literature Review
19
high velocity electrons collide with a metal target, the anode, creating the X-rays
(Whaites and Roderick, 2002).
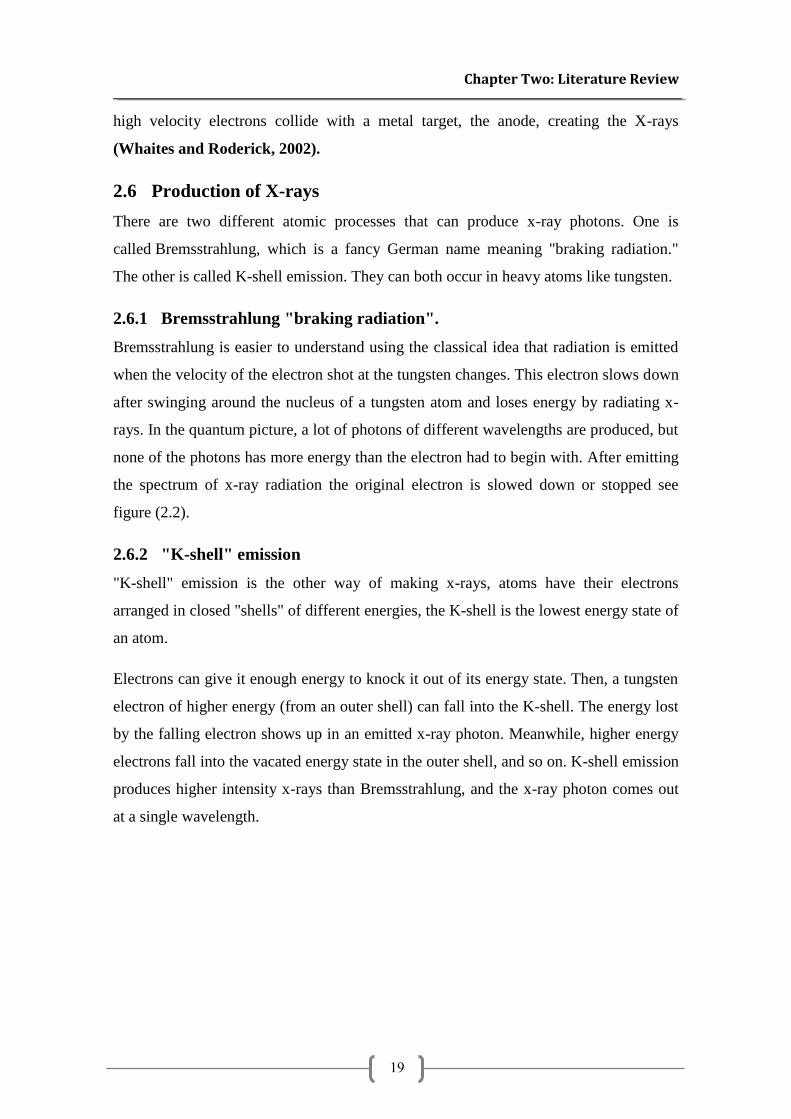
2.6 Production of X-rays
There are two different atomic processes that can produce x-ray photons. One is
called Bremsstrahlung, which is a fancy German name meaning "braking radiation."
The other is called K-shell emission. They can both occur in heavy atoms like tungsten.
2.6.1 Bremsstrahlung "braking radiation".
Bremsstrahlung is easier to understand using the classical idea that radiation is emitted
when the velocity of the electron shot at the tungsten changes. This electron slows down
after swinging around the nucleus of a tungsten atom and loses energy by radiating x-
rays. In the quantum picture, a lot of photons of different wavelengths are produced, but
none of the photons has more energy than the electron had to begin with. After emitting
the spectrum of x-ray radiation the original electron is slowed down or stopped see
figure (2.2).
2.6.2 "K-shell" emission
"K-shell" emission is the other way of making x-rays, atoms have their electrons
arranged in closed "shells" of different energies, the K-shell is the lowest energy state of
an atom.
Electrons can give it enough energy to knock it out of its energy state. Then, a tungsten
electron of higher energy (from an outer shell) can fall into the K-shell. The energy lost
by the falling electron shows up in an emitted x-ray photon. Meanwhile, higher energy
electrons fall into the vacated energy state in the outer shell, and so on. K-shell emission
produces higher intensity x-rays than Bremsstrahlung, and the x-ray photon comes out
at a single wavelength.
Chapter Two: Literature Review
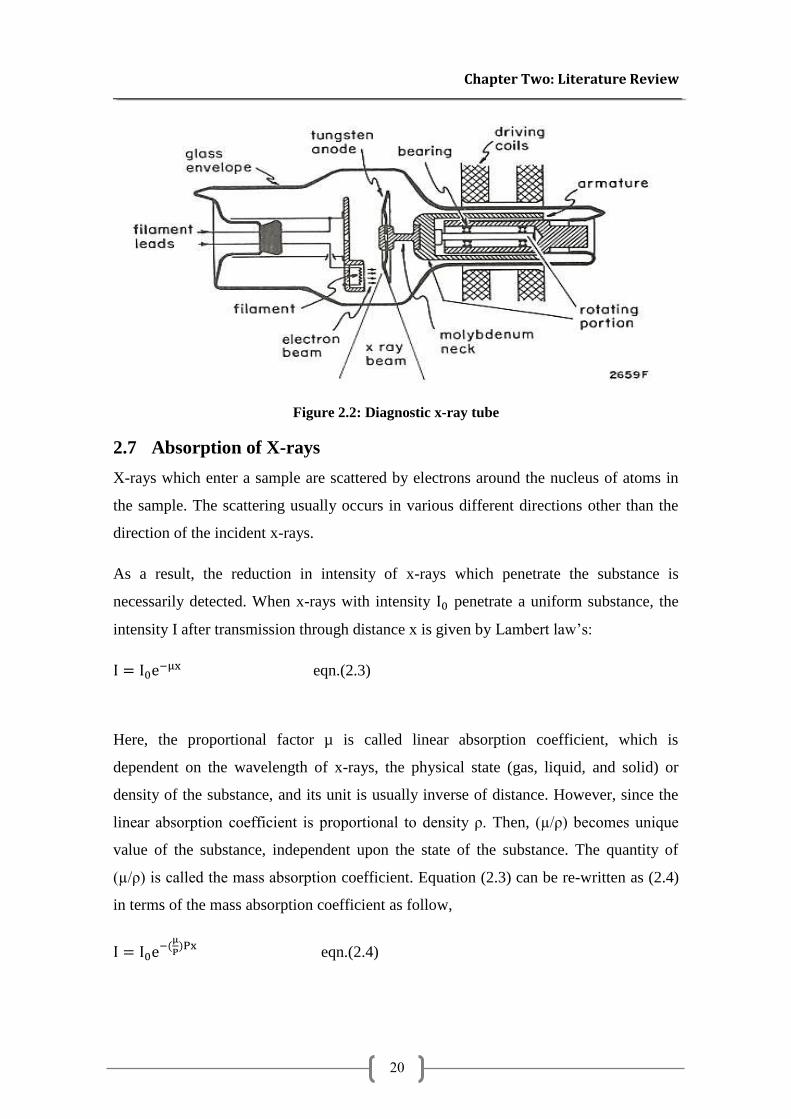
20
Figure 2.2: Diagnostic x-ray tube
2.7 Absorption of X-rays
X-rays which enter a sample are scattered by electrons around the nucleus of atoms in
the sample. The scattering usually occurs in various different directions other than the
direction of the incident x-rays.
As a result, the reduction in intensity of x-rays which penetrate the substance is
necessarily detected. When x-rays with intensity I0 penetrate a uniform substance, the
intensity I after transmission through distance x is given by Lambert law’s:
I = I0e−μx eqn.(2.3)
Here, the proportional factor µ is called linear absorption coefficient, which is
dependent on the wavelength of x-rays, the physical state (gas, liquid, and solid) or
density of the substance, and its unit is usually inverse of distance. However, since the
linear absorption coefficient is proportional to density ρ. Then, (µ/ρ) becomes unique
value of the substance, independent upon the state of the substance. The quantity of
(µ/ρ) is called the mass absorption coefficient. Equation (2.3) can be re-written as (2.4)
in terms of the mass absorption coefficient as follow,
I = I0e−(µ
P)Px
eqn.(2.4)
Chapter Two: Literature Review
21
2.8 Mechanism of Interaction X-rays with Matter
When x-rays or gamma-rays interacts with matter, some are absorbed, some pass
through without interaction, and some are scattered as lower energy photons. The
attenuation of a gamma beam by an absorber material is usually characterized as
occurring under ‘‘good geometry’’ conditions where every photon that interacts is either
absorbed or scattered out of the primary beam such that those that reach the receptor
have kept all of their original energy (Martin, 2006).
The radiation shielding for photons can be calculated relatively accurately based on
three photon interactions:
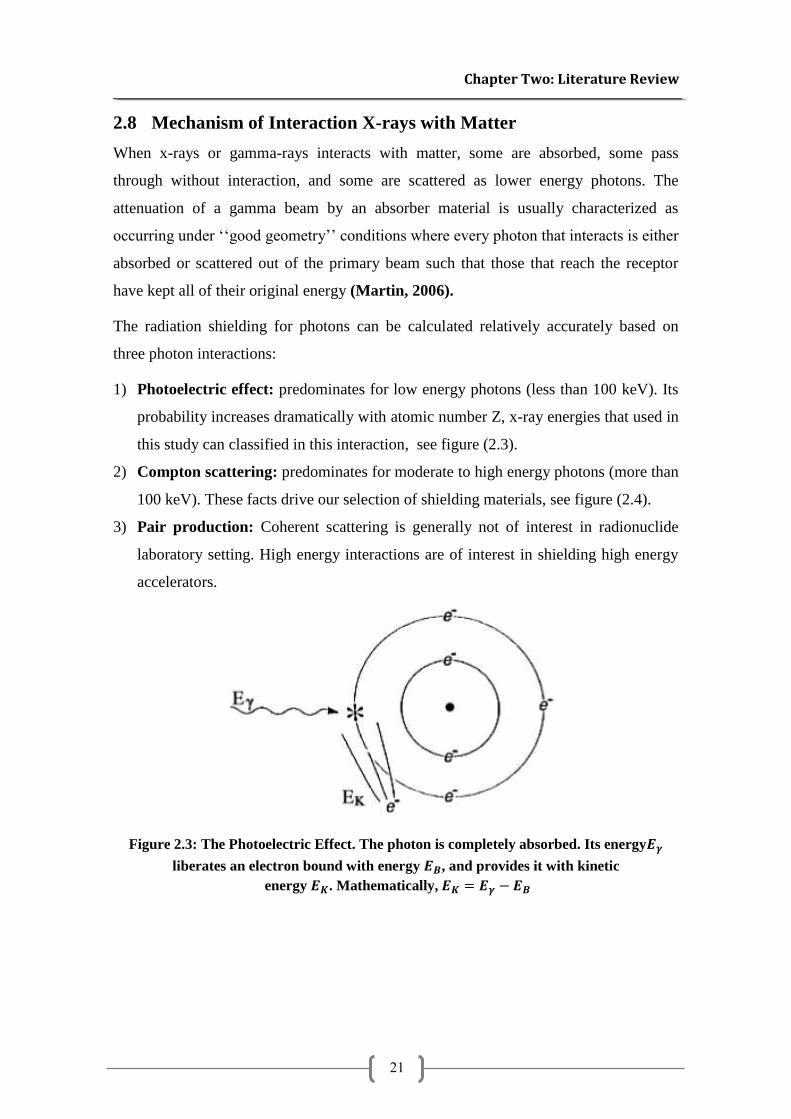
1) Photoelectric effect: predominates for low energy photons (less than 100 keV). Its
probability increases dramatically with atomic number Z, x-ray energies that used in
this study can classified in this interaction, see figure (2.3).
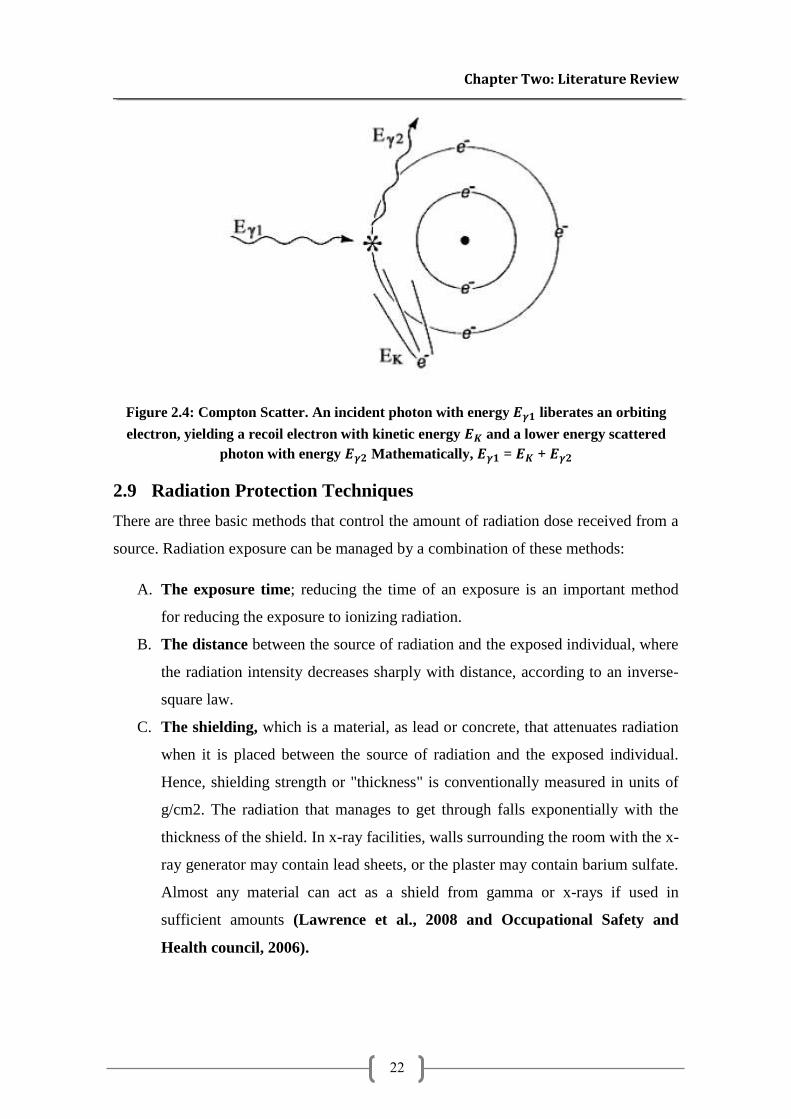
2) Compton scattering: predominates for moderate to high energy photons (more than
100 keV). These facts drive our selection of shielding materials, see figure (2.4).
3) Pair production: Coherent scattering is generally not of interest in radionuclide
laboratory setting. High energy interactions are of interest in shielding high energy
accelerators.
Figure 2.3: The Photoelectric Effect. The photon is completely absorbed. Its energy𝑬𝜸
liberates an electron bound with energy 𝑬𝑩, and provides it with kinetic
energy 𝑬𝑲. Mathematically, 𝑬𝑲 = 𝑬𝜸 − 𝑬𝑩
Chapter Two: Literature Review
22
Figure 2.4: Compton Scatter. An incident photon with energy 𝑬𝜸𝟏 liberates an orbiting
electron, yielding a recoil electron with kinetic energy 𝑬𝑲 and a lower energy scattered
photon with energy 𝑬𝜸𝟐 Mathematically, 𝑬𝜸𝟏 = 𝑬𝑲 + 𝑬𝜸𝟐
2.9 Radiation Protection Techniques
There are three basic methods that control the amount of radiation dose received from a
source. Radiation exposure can be managed by a combination of these methods:
A. The exposure time; reducing the time of an exposure is an important method
for reducing the exposure to ionizing radiation.
B. The distance between the source of radiation and the exposed individual, where
the radiation intensity decreases sharply with distance, according to an inverse-
square law.
C. The shielding, which is a material, as lead or concrete, that attenuates radiation
when it is placed between the source of radiation and the exposed individual.
Hence, shielding strength or "thickness" is conventionally measured in units of
g/cm2. The radiation that manages to get through falls exponentially with the
thickness of the shield. In x-ray facilities, walls surrounding the room with the x-
ray generator may contain lead sheets, or the plaster may contain barium sulfate.
Almost any material can act as a shield from gamma or x-rays if used in
sufficient amounts (Lawrence et al., 2008 and Occupational Safety and
Health council, 2006).
Chapter Two: Literature Review
23
2.10 Benefits of Concrete as Shielding Material.
1. Concrete is the most commonly used shield material as it is inexpensive and
adaptable for any construction design (Singh et al., 2008).
2. Concrete is a suitable material to optimize shielding against gamma rays as an
absorber to reduce biological problems, it has acceptable strength and density for
attenuation of gamma rays (Rezaei-Ochbelagh and Azimkhani , 2012).
3. A thick layer of concrete surrounds nuclear reactors which plays two roles in
supporting the reactor and its related equipments and protecting the surrounding
from high level radiations emitted from the reactor (Yousef et al.,2008).
4. High-density materials are needed to be shielded against x and gamma rays, a
high density concrete is often preferred to the low density type.
5. A set of conflicting requirements must be met in the selection of ingredients and
mix proportions of concrete designed for the optimum attenuation of both x-ray
and gamma radiation (Samarin, 2013).
6. Heavy weight radiation shielding concrete should also be capable to maintain its
structural integrity and effectiveness as a biological shield over a period of 50
years (Samarin, 2013).
7. Increasing the density of the concrete shield by adding heavy materials has a
major effect on the suppression of the gamma- rays (Makarious et al.,1996)
8. High density concrete has higher linear gamma and neutron attenuation
characteristics in comparison with ordinary the concrete; therefore, the use of
high density concrete leads to thinner walls.
9. Gamma and x-rays their attenuation is dependent upon the density of the
shielding material; it can be shown that a dense shield material with a higher
atomic number is a better attenuator of x-rays.
10. Many attempts have been made to increase radiation protection properties of
concrete. Minerals such as magnetite, hematite, goethite and ilmenite were
added as aggregates in concrete and their effects have been determined (Neville,
1996).
Chapter Two: Literature Review
24
2.11 Benefits of Lead Plates.
Lead has characterized properties make it an excellent shielding material when add to
concrete in shots form these properties are (lead Industries Association, 2011):
1. Lead has a very high density of 11.35 g/𝑐𝑚3 and is an excellent shielding
material for X and gamma rays.
2. High atomic number of lead.
3. High level of stability.
4. Ease of fabrication.
5. High degree of flexibility in application, and its availability.
6. lead is the lowest cost of the higher density materials.
2.12 Criteria for the Selection of a Shield Material
Theoretically, all materials could be used for radiation shielding if employed in a
thickness sufficient to attenuate the radiation to safe limits; however, due to certain
characteristics, lead and concrete are among the most commonly used materials. An
effective shield will cause a large energy loss in a small penetration distance without
emission of more hazardous radiation. Furthermore, the good shielding material should
have high absorption cross-section for radiation and at the same time irradiation effects
on its mechanical and optical properties should be small. The choice of the shield
material is dependent upon many varied factors such as (lead Industries Association,
2011):
Final desired attenuated radiation levels.
Ease of heat dissipation, As it is often necessary to remove heat from the inner
layer of the shield, the shield material should have good heat conductivity.
Resistance to radiation damage, It is an essential requirement that the radiation
which is attenuated does not have a significantly deleterious effect on the
mechanical or physical properties of the shield material.
Chapter Two: Literature Review
25
Required thickness and weight.
Multiple use considerations (e.g., shield and/or structural).
Uniformity of shielding capability.
Permanence of shielding and availability.
2.13 Ionizing Radiation Dose and Units
The radiation dose is the amount of energy absorbed in the body from radiation
interactions. Early non quantitative measures of dose, based on skin erythema, were
replaced by measures of exposure [e.g. the ability of x-rays to ionize air, measured in
roentgens (R)] and measures of absorbed dose [e.g. energy absorption, measured
initially in radiation absorbed dose (Rad), and more recently in Gray (Gy)] (Hall and
Giaccia, 2006).
Relative biological effectiveness, which denotes the ability of a given type of radiation
to produce a specific biological outcome compared with X-rays or gamma rays, is taken
into account by the Sievert (Sv), a metric for biological equivalent dose that can be used
to measure mixed types of radiation exposure (ICRP, 1991 and ICRP, 2007).
The effective dose is the sum of the equivalent doses to each tissue and organ exposed
multiplied by the appropriate tissue weighting factor or, in other words, the whole body
dose of x-rays that would have to be delivered to produce the same carcinogenic risk as
the partial dose that was delivered. This quantity provides an easy assessment of overall
risk and makes the comparison of risks much simpler. Although effective dose is
emphasized in many surveys because this metric is related to the risk of carcinogenic
effects, effective dose cannot be measured and cannot be used for individual risk
assessment. Only absorbed dose to a given tissue or organ can be used for estimating
cancer risks (ICRP, 1991 and ICRP, 2007). Table (2.2) demonstrate Common and SI
Units for Radiation Quantities.
Chapter Two: Literature Review
26
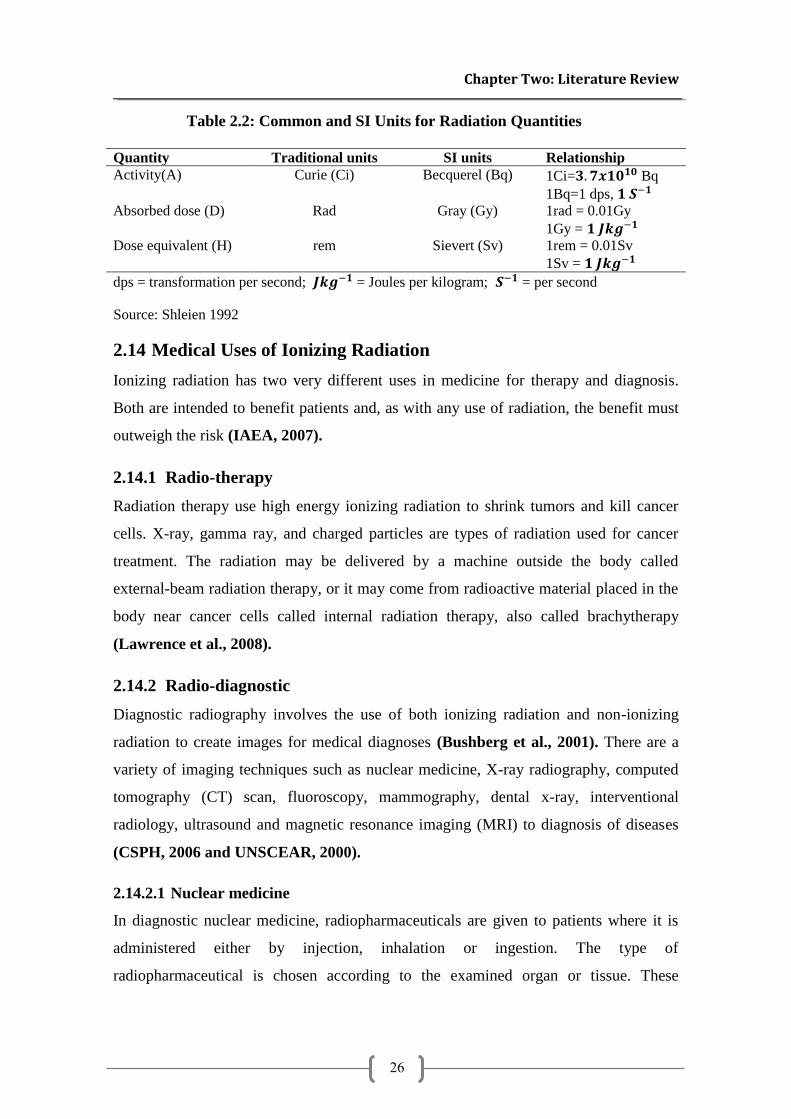
Table 2.2: Common and SI Units for Radiation Quantities
Relationship SI units Traditional units Quantity
1Ci=𝟑. 𝟕𝒙𝟏𝟎𝟏𝟎 Bq
1Bq=1 dps, 𝟏 𝑺−𝟏
Becquerel (Bq) Curie (Ci) Activity(A)
1rad = 0.01Gy
1Gy = 𝟏 𝑱𝒌𝒈−𝟏
Gray (Gy) Rad Absorbed dose (D)
1rem = 0.01Sv
1Sv = 𝟏 𝑱𝒌𝒈−𝟏
Sievert (Sv) rem Dose equivalent (H)
dps = transformation per second; 𝑱𝒌𝒈−𝟏 = Joules per kilogram; 𝑺−𝟏 = per second
Source: Shleien 1992
2.14 Medical Uses of Ionizing Radiation
Ionizing radiation has two very different uses in medicine for therapy and diagnosis.
Both are intended to benefit patients and, as with any use of radiation, the benefit must
outweigh the risk (IAEA, 2007).
2.14.1 Radio-therapy
Radiation therapy use high energy ionizing radiation to shrink tumors and kill cancer
cells. X-ray, gamma ray, and charged particles are types of radiation used for cancer
treatment. The radiation may be delivered by a machine outside the body called
external-beam radiation therapy, or it may come from radioactive material placed in the
body near cancer cells called internal radiation therapy, also called brachytherapy
(Lawrence et al., 2008).
2.14.2 Radio-diagnostic
Diagnostic radiography involves the use of both ionizing radiation and non-ionizing
radiation to create images for medical diagnoses (Bushberg et al., 2001). There are a
variety of imaging techniques such as nuclear medicine, X-ray radiography, computed
tomography (CT) scan, fluoroscopy, mammography, dental x-ray, interventional
radiology, ultrasound and magnetic resonance imaging (MRI) to diagnosis of diseases
(CSPH, 2006 and UNSCEAR, 2000).
2.14.2.1 Nuclear medicine
In diagnostic nuclear medicine, radiopharmaceuticals are given to patients where it is
administered either by injection, inhalation or ingestion. The type of
radiopharmaceutical is chosen according to the examined organ or tissue. These
Chapter Two: Literature Review
27
radiopharmaceuticals emit γ rays which are detected by Gamma camera and give a
picture about the examined organ (Shrimpton, 2001, Burnham, 2001, IAEA, 2004).
2.14.2.2 Diagnostic X-ray
Diagnostic X-ray increase the risk of developmental problems and cancer in those
exposed (Santis et al., 2007; Hall and Brenner, 2008 and Brenner, 2010). The
amount of absorbed radiation depends upon the type of X-ray examination and the body
part involved.
There are a variety of imaging techniques such as Basic X-ray Machine, computed
tomography (CT) scan, fluoroscopy, and mammography, dental X-ray, Lithotripsy
Machine, and Bone Densitometry (DEXA) Machine to diagnosis of diseases. CT scan
and fluoroscopy entail higher doses of radiation than do plain x-ray (Hall and Brenner
, 2008).
2.15 Factors Controlling the X-ray Beam
The x-ray beam emitted from an x-ray tube may be modified to suit the needs of the
application by altering the beam exposure time, tube current (mA), tube voltage (kVp),
filtration and beam shape (collimation).
1. Exposure Time
Portrays the changes in the x-ray spectrum that result when the exposure time is
increased while the tube current (mA) and voltage (kVp) remain constant. When the
exposure time is doubled, the number of photons generated is doubled, but the range
intensity of photons energies is unchanged. Therefore changing the time simply controls
the “quantity” of the exposure, the number of photons generated. The amount of
radiation that a patient receives is determined by the MAS (mA x time).
2. Tube Current (mA)
As the Tube Current (mA) setting is increased, more power is applied to the filament,
which heats up and releases more electrons that collide with the target to produce ration.
A linear relationship exists between mA and radiation output. The quantity of radiation
produced (mAs) is expressed as the product of time and tube current. The quantity of
radiation remains constant regardless of variations in mA and time as long as their
Chapter Two: Literature Review
28
product remains constant. For instance, a machine operating at 10mA for 1 second
(10mAs) produces the same quantity of radiation when operated at 20 mA for 0.5
second (10 mAs).
3. Tube Voltage (kVp)
Increasing the kVp increases the potential difference between the cathode and anode,
thus increasing the energy of each electron when it strikes the target. The greater the
potential Difference the faster the electrons travel from the cathode to the anode. This
results in an increased efficiency of conversion of electron energy into x-ray photons.
The ability of x -ray photons to penetrate matter depends on their energy. High-energy
x-ray photons have a greater probability of penetrating matter, whereas relatively low
energy photons have a greater probability of being absorbed. Therefore the higher the
kVp and mean energy of the x -ray beam, the greater the penetrability of the beam
through matter.
4. Filtration
An x-ray beam consists of a spectrum of x-ray photons of different energies, but only
photons with sufficient energy to penetrate through anatomic structures and reach the
image receptor (usually film) are useful for diagnostic radiology. Those that are of low
energy (long wavelength) contribute to patient exposure but do not have enough energy
to reach the film. The higher the kVp, the less radiation is absorbed by the patient.
Consequently, to reduce patient dose, the less-penetrating photons should be removed.
This can be accomplished by placing an aluminum filter in the path of the beam. The
aluminum preferentially removes many of the lower-energy (long waves) photons with
lesser effect on the higher energy photons that are able to penetrate to the film.
5. Collimation
A collimator is a metallic barrier with an aperture in the middle used to reduce the size
and Shape of the x-ray beam and therefore the volume of irradiated tissue within the
patient. Use of collimation also improves image quality and the detrimental effect of
scattered radiation of the images can be minimized by collimating the beam to reduce
the number of scattered photons reaching the film.
Chapter Two: Literature Review
29
2.16 Biological Effects of Ionizing Radiation
Almost twenty years after the initial discovery of x-rays by Wilhelm Conrad Roentgen
in 1895, the Drosophila geneticist Herman Muller demonstrated that ionizing radiation
causes mutations in living organisms. In the 80 years since that discovery, the biological
and genetic consequences of exposure to ionizing radiation (IR) have been investigated.
The biological effects of IR exposure are mediated through direct damage to
biomolecules (e.g., energy directly deposited on the molecule) or indirectly through the
formation of Reactive Oxygen Species (ROS) (Muller and Richard, 1927).
The biological effects of radiation can be grouped into two types: Stochastic effects
(cancer and heritable effects) and Deterministic effects (tissue reactions) (ICRP,2007).
2.16.1 Stochastic effects (no threshold dose): are those in which the probability of the
effect occurring depends on the amount of radiation dose, this type of effects increases
as a radiation dose increases. So, there is no threshold dose for the stochastic effect.
Stochastic effects can cause cancer, or have influence on genematerial affecting future
generations (NOHSC, 2002 and EPA, 2009).
2.16.2 Deterministic effects (threshold dose): are those effects resulting if the effect
only results when many cells in an organ or tissue are killed, the effect will only be
clinically observable if the radiation dose is above some threshold. The magnitude of
this threshold will depend on the dose rate (i.e. dose per unit time), linear energy
transfer of the radiation, the organ or tissue irradiated, the volume of the irradiated part
of the organ or tissue, and the clinical effect of interest. These effects occur because of
large number of killed cells which cannot be compensated. The degree of damage
(severity) increases the more the threshold value is exceeded (ICRP, 2007 and EPA,
2009).
The single largest contributor of manmade radiation is the medical profession. The
effects of ionizing radiation on a given population are generally divided into two
categories, acute and chronic. The acute effects are considered to be those which happen
in the immediate post irradiation periods, i.e. from the time of radiation exposure up to
6 months to a year post exposure. Acute effects are generally the result of long radiation
exposure delivered to the whole body, or at least a major port of it, in average short
time, on the other hand the chronic effects of radiation results from relatively low
Chapter Two: Literature Review
30
exposure levels delivered over long periods of time. Therefore long time effects of low
doses seems to be the main risk factor and that might results from occupational
exposure (Morgan, 2003).
Chapter Three: Constituent Materials and Experimental Program
31
Chapter Three:
Constituent Materials and
Experimental Program
Chapter Three: Constituent Materials and Experimental Program
3.1 Introduction
3.2 Materials and Their Quality Tests
3.3 Mix Proportions
3.4 Mix Proportion with Recycled Lead Shots(RLS) Material
3.5 Sample Categories
3.6 Mixing, Casting and Curing Procedures
3.7 Equipment and Testing Procedure
Chapter Three: Constituent Materials and Experimental Program
32
3 Chapter Three: Constituent Materials and Experimental Program
3.1 Introduction
To produce more effective resistant concrete to radiation than normal concrete needs to
use additives which have high atomic number and heavy density, where proportional
relation between atomic number, density and ability material to shield radiation.
Waste lead collected from disposed car batteries in the city of Khanyuonis. Recycled
lead in shots form with maximum size of 1.18 mm added to constituents concrete in
different percentages of lead to cement ratio (20%, 40%, 60%, 80%, 100%, 120%,
140%) and mixed together to produce homogenous concrete then cast in cubes and
prisms.
This chapter presents the experimental program which was carried out in the current
study. The experimental program consists of checking the specifications of the
components of concrete mix as aggregate, sand, cement and the recycled lead “RL” and
compares the results to standard specifications. The tests for aggregates are unit weight,
specific gravity, absorption, grain size distribution and fineness modulus but the test for
cement is normal constancy, initial and final set, fineness and compressive strength.
The tests for RL are specific gravity, grain size distribution and chemical analysis to
identify lead content.
This chapter also discusses the procedures of testing fresh and hardened concrete. The
fresh concrete was tested using slump test to measure its workability. The testing on
hardened concrete was made according to the ASTM. The compressive strength was
investigated after 7 days, 14 days, and 28 days on (100x100x100 mm) cubes and the
penetration of x-ray to concrete after 14 days from casting at 100 KeV and 120 KeV
energies where 200X200 mm prisms with different thicknesses (40 mm, 60 mm, 80
mm, 100 mm).
3.2 Materials and Their Quality Tests
It is important to know that the properties and characteristics of constituent materials of
concrete, as we know, concrete is a composite material made up of several different
materials.
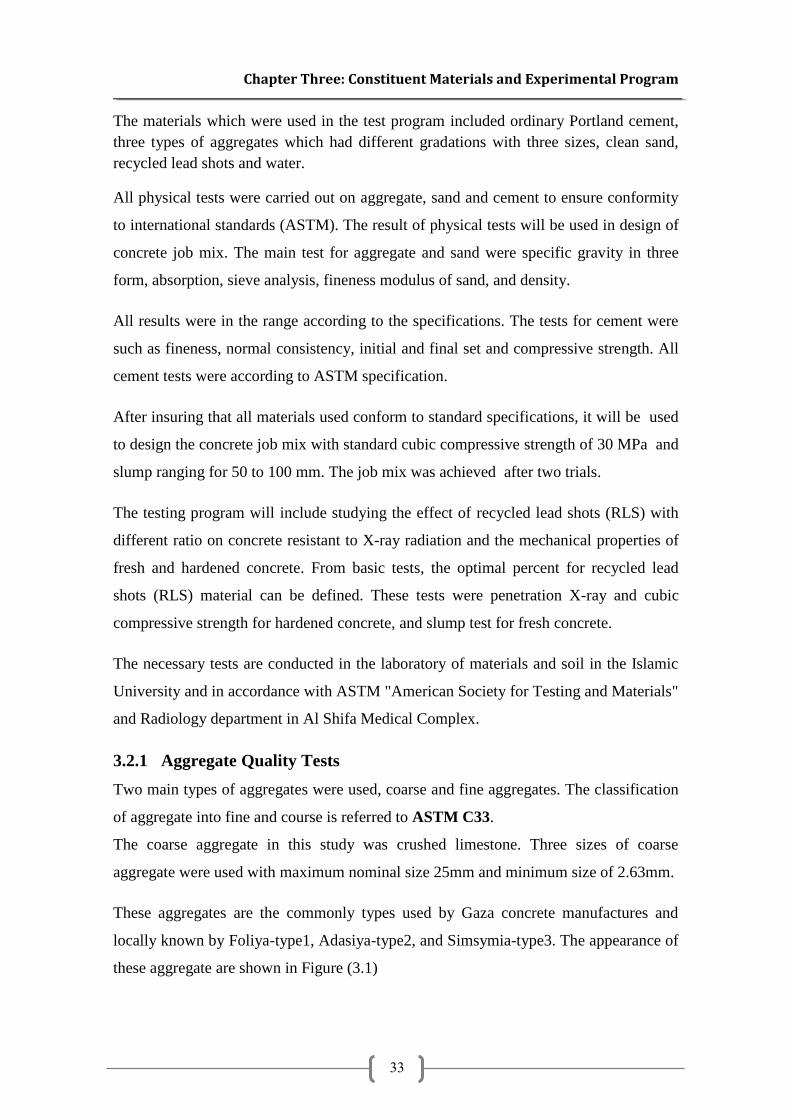
Chapter Three: Constituent Materials and Experimental Program
33
The materials which were used in the test program included ordinary Portland cement,
three types of aggregates which had different gradations with three sizes, clean sand,
recycled lead shots and water.
All physical tests were carried out on aggregate, sand and cement to ensure conformity
to international standards (ASTM). The result of physical tests will be used in design of
concrete job mix. The main test for aggregate and sand were specific gravity in three
form, absorption, sieve analysis, fineness modulus of sand, and density.
All results were in the range according to the specifications. The tests for cement were
such as fineness, normal consistency, initial and final set and compressive strength. All
cement tests were according to ASTM specification.
After insuring that all materials used conform to standard specifications, it will be used
to design the concrete job mix with standard cubic compressive strength of 30 MPa and
slump ranging for 50 to 100 mm. The job mix was achieved after two trials.
The testing program will include studying the effect of recycled lead shots (RLS) with
different ratio on concrete resistant to X-ray radiation and the mechanical properties of
fresh and hardened concrete. From basic tests, the optimal percent for recycled lead
shots (RLS) material can be defined. These tests were penetration X-ray and cubic
compressive strength for hardened concrete, and slump test for fresh concrete.
The necessary tests are conducted in the laboratory of materials and soil in the Islamic
University and in accordance with ASTM "American Society for Testing and Materials"
and Radiology department in Al Shifa Medical Complex.
3.2.1 Aggregate Quality Tests
Two main types of aggregates were used, coarse and fine aggregates. The classification
of aggregate into fine and course is referred to ASTM C33.
The coarse aggregate in this study was crushed limestone. Three sizes of coarse
aggregate were used with maximum nominal size 25mm and minimum size of 2.63mm.
These aggregates are the commonly types used by Gaza concrete manufactures and
locally known by Foliya-type1, Adasiya-type2, and Simsymia-type3. The appearance of
these aggregate are shown in Figure (3.1)
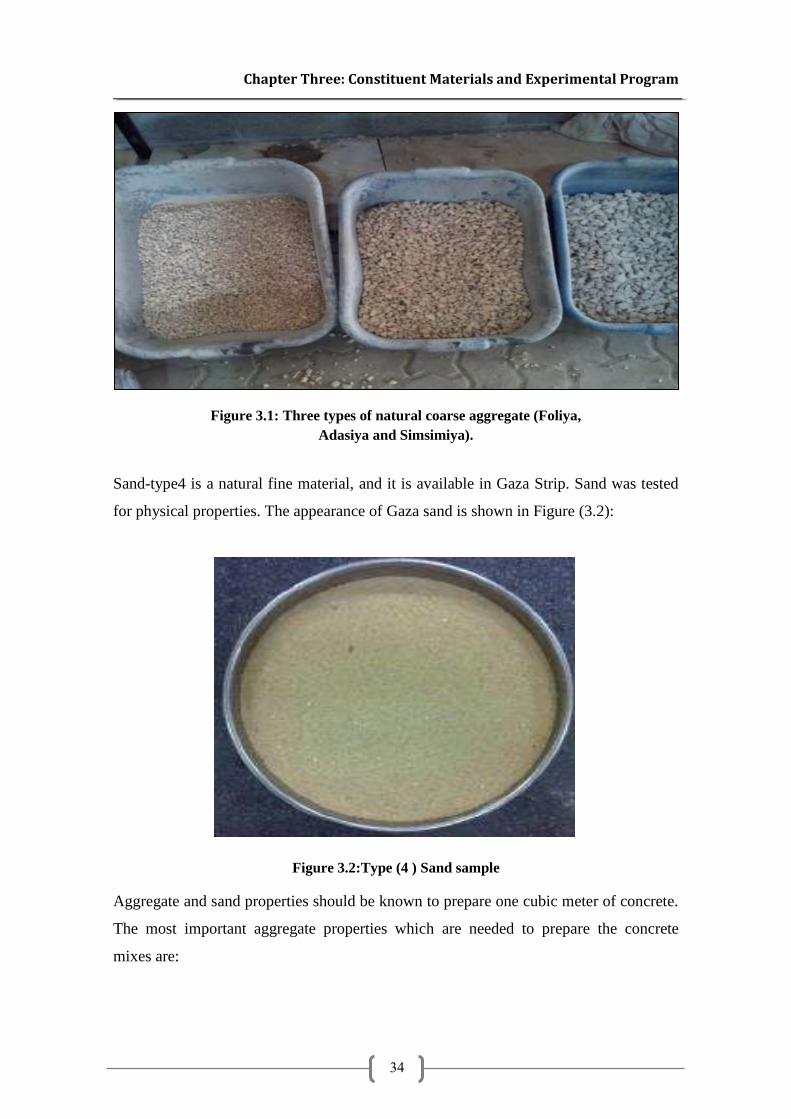
Chapter Three: Constituent Materials and Experimental Program
34
Figure 3.1: Three types of natural coarse aggregate (Foliya,
Adasiya and Simsimiya).
Sand-type4 is a natural fine material, and it is available in Gaza Strip. Sand was tested
for physical properties. The appearance of Gaza sand is shown in Figure (3.2):
Figure 3.2:Type (4 ) Sand sample
Aggregate and sand properties should be known to prepare one cubic meter of concrete.
The most important aggregate properties which are needed to prepare the concrete
mixes are:
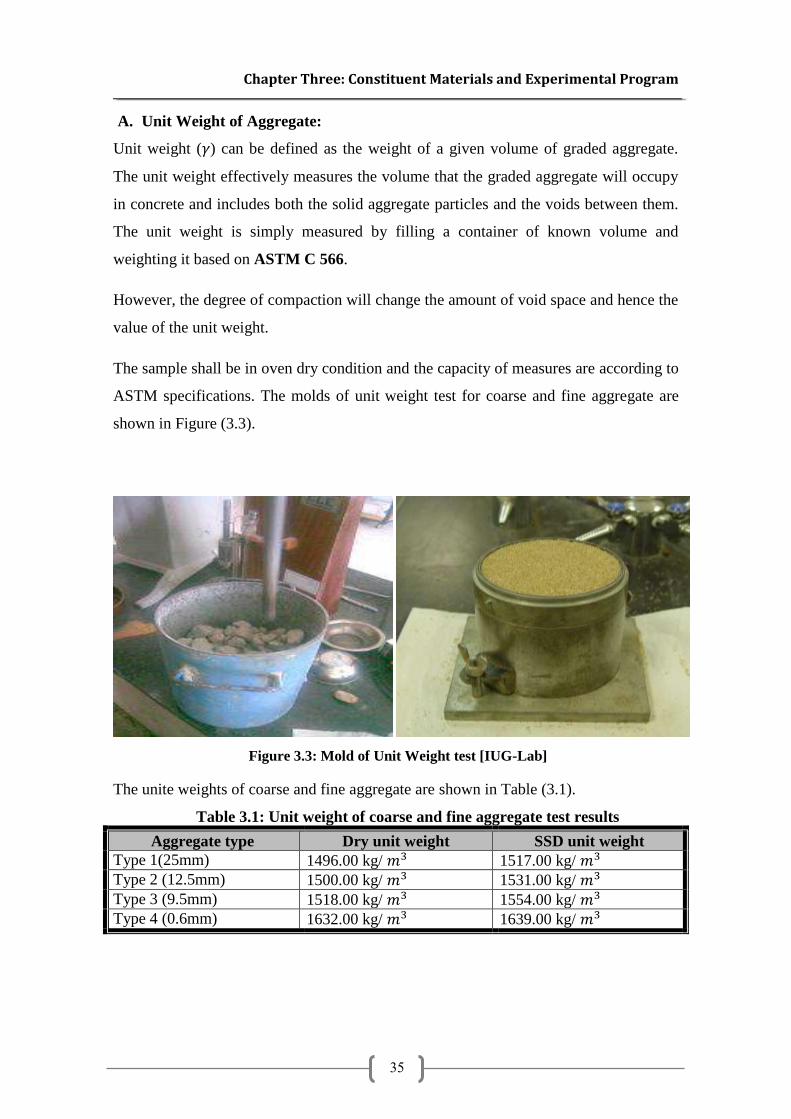
Chapter Three: Constituent Materials and Experimental Program
35
A. Unit Weight of Aggregate:
Unit weight (𝛾) can be defined as the weight of a given volume of graded aggregate.
The unit weight effectively measures the volume that the graded aggregate will occupy
in concrete and includes both the solid aggregate particles and the voids between them.
The unit weight is simply measured by filling a container of known volume and
weighting it based on ASTM C 566.
However, the degree of compaction will change the amount of void space and hence the
value of the unit weight.
The sample shall be in oven dry condition and the capacity of measures are according to
ASTM specifications. The molds of unit weight test for coarse and fine aggregate are
shown in Figure (3.3).
Figure 3.3: Mold of Unit Weight test [IUG-Lab]
The unite weights of coarse and fine aggregate are shown in Table (3.1).
Table 3.1: Unit weight of coarse and fine aggregate test results
Aggregate type Dry unit weight SSD unit weight
Type 1(25mm) 1496.00 kg/ 𝑚3 1517.00 kg/ 𝑚3 Type 2 (12.5mm) 1500.00 kg/ 𝑚3 1531.00 kg/ 𝑚3 Type 3 (9.5mm) 1518.00 kg/ 𝑚3 1554.00 kg/ 𝑚3 Type 4 (0.6mm) 1632.00 kg/ 𝑚3 1639.00 kg/ 𝑚3
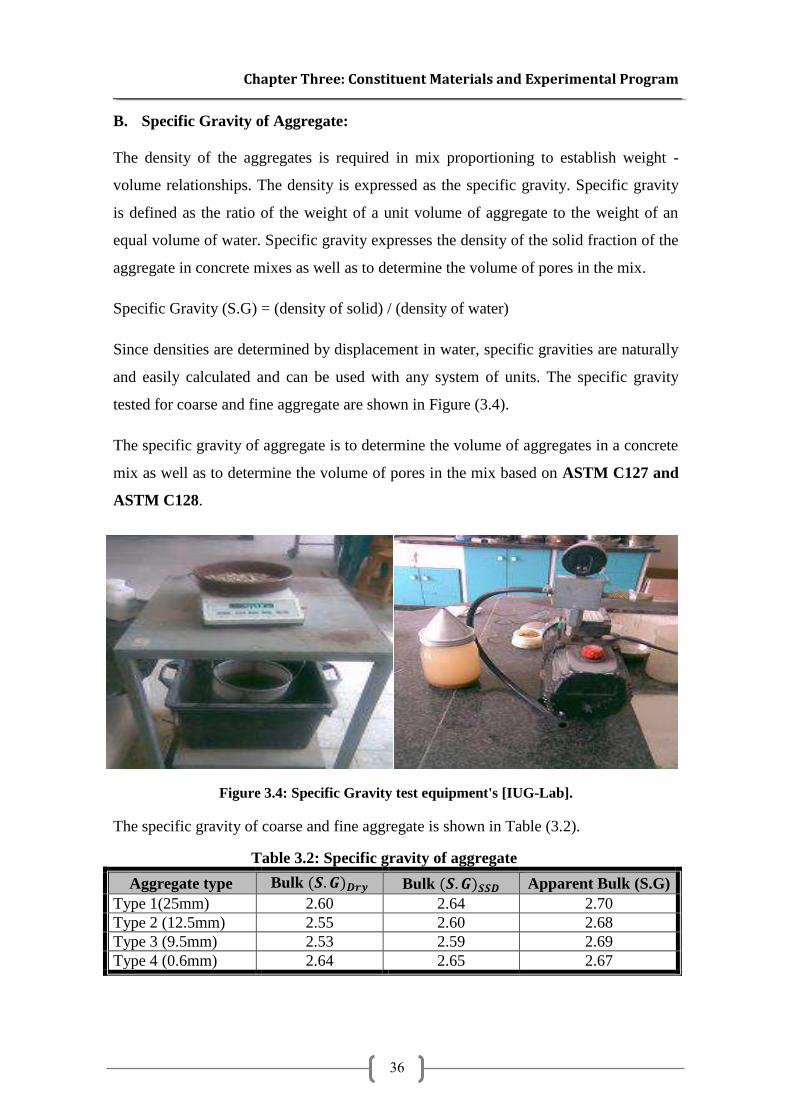
Chapter Three: Constituent Materials and Experimental Program
36
B. Specific Gravity of Aggregate:
The density of the aggregates is required in mix proportioning to establish weight -
volume relationships. The density is expressed as the specific gravity. Specific gravity
is defined as the ratio of the weight of a unit volume of aggregate to the weight of an
equal volume of water. Specific gravity expresses the density of the solid fraction of the
aggregate in concrete mixes as well as to determine the volume of pores in the mix.
Specific Gravity (S.G) = (density of solid) / (density of water)
Since densities are determined by displacement in water, specific gravities are naturally
and easily calculated and can be used with any system of units. The specific gravity
tested for coarse and fine aggregate are shown in Figure (3.4).
The specific gravity of aggregate is to determine the volume of aggregates in a concrete
mix as well as to determine the volume of pores in the mix based on ASTM C127 and
ASTM C128.
Figure 3.4: Specific Gravity test equipment's [IUG-Lab].
The specific gravity of coarse and fine aggregate is shown in Table (3.2).
Table 3.2: Specific gravity of aggregate
Aggregate type Bulk (𝑺. 𝑮)𝑫𝒓𝒚 Bulk (𝑺. 𝑮)𝑺𝑺𝑫 Apparent Bulk (S.G)
Type 1(25mm) 2.60 2.64 2.70
Type 2 (12.5mm) 2.55 2.60 2.68
Type 3 (9.5mm) 2.53 2.59 2.69
Type 4 (0.6mm) 2.64 2.65 2.67
Chapter Three: Constituent Materials and Experimental Program
37
C. Moisture content of Aggregate:
Since aggregates are porous (to some extent), they can absorb moisture. However, this
is a concern for Portland cement concrete because aggregate is generally not dry and
therefore the aggregate moisture content will affect the water content and thus the
water-cement ratio also of the produced Portland cement concrete and the water content
also affects aggregate proportioning (because it contributes to aggregate weight), based
on ASTM C127 and ASTM C128.
The moisture content values of coarse and fine aggregate are shown in Table (3.3).
Table 3.3: Moisture content values of coarse aggregate
Aggregate type Absorption (%)
Type 1 (25mm) 1.45
Type 2 (12.5mm) 2.1
Type 3 (9.5mm) 2.4
Type 4 (0.6mm) 0.4
D. Sieve Analysis of Aggregate:
The size of aggregate particles differs from aggregate to another, and for the same
aggregate the size is different. So in this test we will determine the particle size
distribution of fine and coarse aggregate by sieving. This method is used to determine
the compliance of the aggregate gradation with specific requirements, ASTM C136.
Table (3.4) and Figure (3.5), show sieve analysis results for fine and three types of
coarse aggregate.
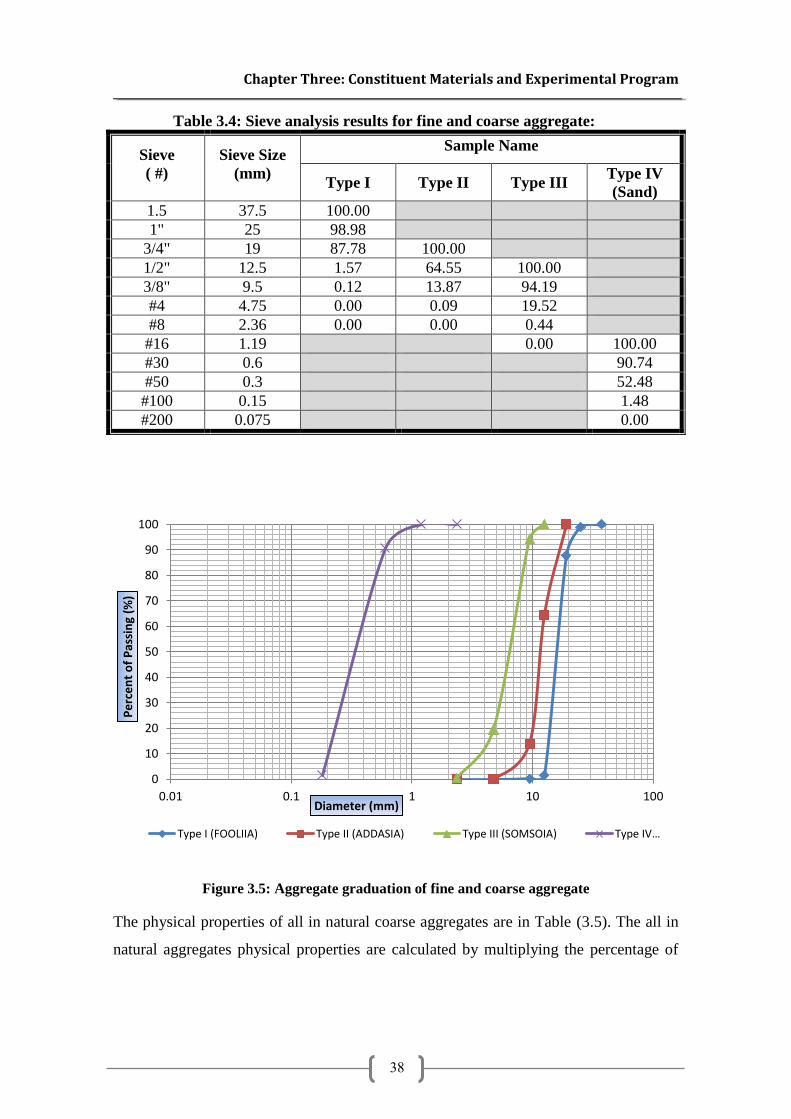
Chapter Three: Constituent Materials and Experimental Program
38
Table 3.4: Sieve analysis results for fine and coarse aggregate:
Sieve
( #)
Sieve Size
(mm)
Sample Name
Type I Type II Type III Type IV
(Sand)
1.5 37.5 100.00
1" 25 98.98
3/4" 19 87.78 100.00
1/2" 12.5 1.57 64.55 100.00
3/8" 9.5 0.12 13.87 94.19
#4 4.75 0.00 0.09 19.52
#8 2.36 0.00 0.00 0.44
#16 1.19 0.00 100.00
#30 0.6 90.74
#50 0.3 52.48
#100 0.15 1.48
#200 0.075 0.00
Figure 3.5: Aggregate graduation of fine and coarse aggregate
The physical properties of all in natural coarse aggregates are in Table (3.5). The all in
natural aggregates physical properties are calculated by multiplying the percentage of
0
10
20
30
40
50
60
70
80
90
100
0.01 0.1 1 10 100
Pe
rce
nt
of
Pas
sin
g (%
)
Diameter (mm)
Type I (FOOLIIA) Type II (ADDASIA) Type III (SOMSOIA) Type IV…
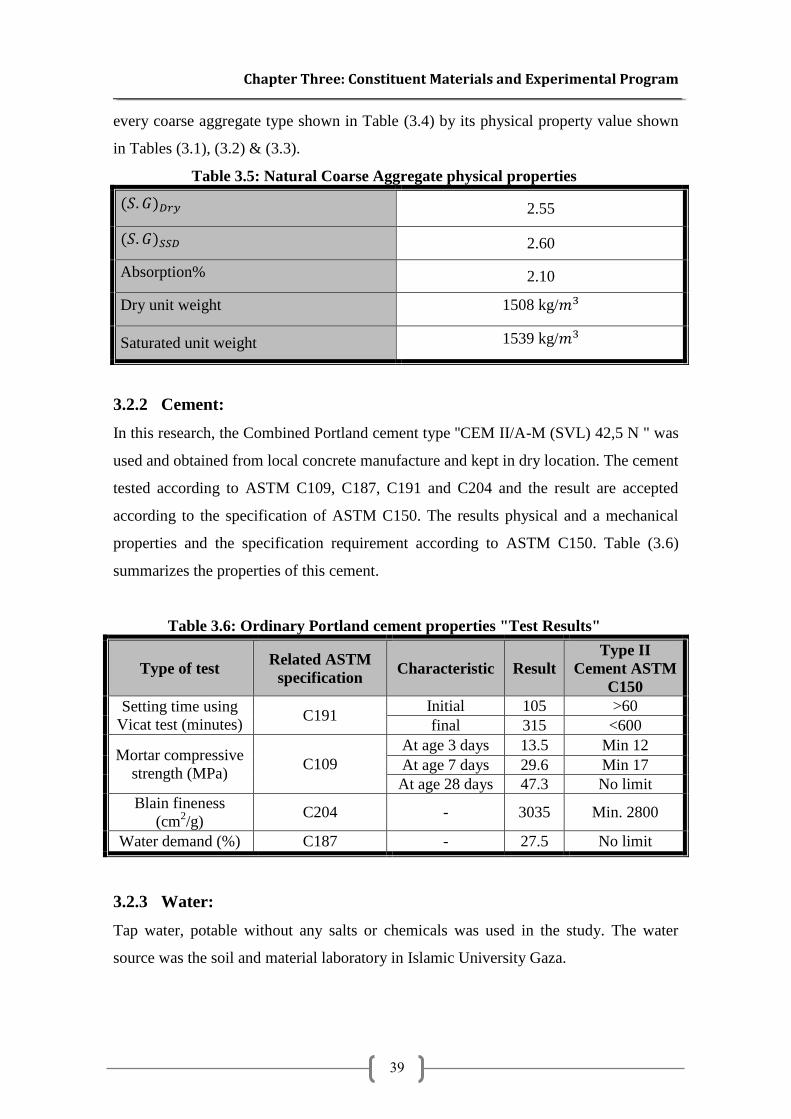
Chapter Three: Constituent Materials and Experimental Program
39
every coarse aggregate type shown in Table (3.4) by its physical property value shown
in Tables (3.1), (3.2) & (3.3).
Table 3.5: Natural Coarse Aggregate physical properties
(𝑆. 𝐺)𝐷𝑟𝑦 2.55
(𝑆. 𝐺)𝑆𝑆𝐷 2.60
Absorption% 2.10
Dry unit weight 1508 kg/𝑚3
Saturated unit weight 1539 kg/𝑚3
3.2.2 Cement:
In this research, the Combined Portland cement type ''CEM II/A-M (SVL) 42,5 N " was
used and obtained from local concrete manufacture and kept in dry location. The cement
tested according to ASTM C109, C187, C191 and C204 and the result are accepted
according to the specification of ASTM C150. The results physical and a mechanical
properties and the specification requirement according to ASTM C150. Table (3.6)
summarizes the properties of this cement.
Table 3.6: Ordinary Portland cement properties "Test Results"
Type of test Related ASTM
specification Characteristic Result
Type II
Cement ASTM
C150
Setting time using
Vicat test (minutes) C191
Initial 105 >60
final 315 <600
Mortar compressive
strength (MPa) C109
At age 3 days 13.5 Min 12
At age 7 days 29.6 Min 17
At age 28 days 47.3 No limit
Blain fineness
(cm2/g)
C204 - 3035 Min. 2800
Water demand (%) C187 - 27.5 No limit
3.2.3 Water:
Tap water, potable without any salts or chemicals was used in the study. The water
source was the soil and material laboratory in Islamic University Gaza.
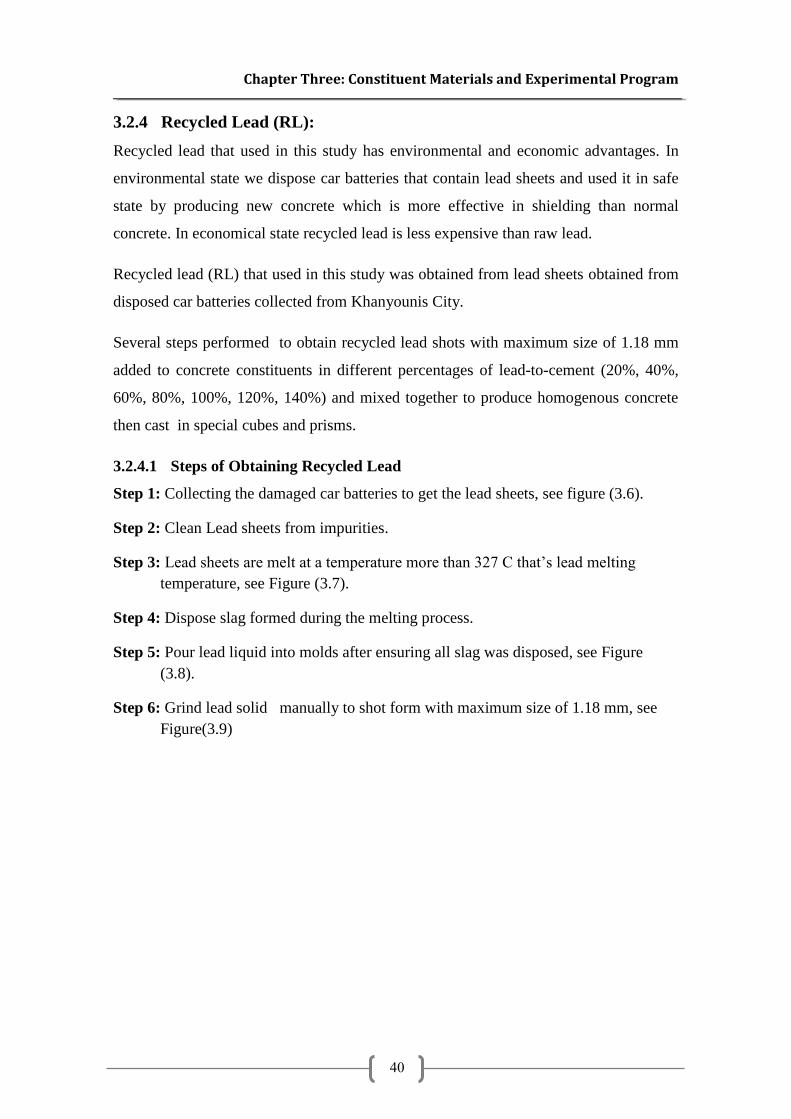
Chapter Three: Constituent Materials and Experimental Program
40
3.2.4 Recycled Lead (RL):
Recycled lead that used in this study has environmental and economic advantages. In
environmental state we dispose car batteries that contain lead sheets and used it in safe
state by producing new concrete which is more effective in shielding than normal
concrete. In economical state recycled lead is less expensive than raw lead.
Recycled lead (RL) that used in this study was obtained from lead sheets obtained from
disposed car batteries collected from Khanyounis City.
Several steps performed to obtain recycled lead shots with maximum size of 1.18 mm
added to concrete constituents in different percentages of lead-to-cement (20%, 40%,
60%, 80%, 100%, 120%, 140%) and mixed together to produce homogenous concrete
then cast in special cubes and prisms.
3.2.4.1 Steps of Obtaining Recycled Lead
Step 1: Collecting the damaged car batteries to get the lead sheets, see figure (3.6).
Step 2: Clean Lead sheets from impurities.
Step 3: Lead sheets are melt at a temperature more than 327 C that’s lead melting
temperature, see Figure (3.7).
Step 4: Dispose slag formed during the melting process.
Step 5: Pour lead liquid into molds after ensuring all slag was disposed, see Figure
(3.8).
Step 6: Grind lead solid manually to shot form with maximum size of 1.18 mm, see
Figure(3.9)
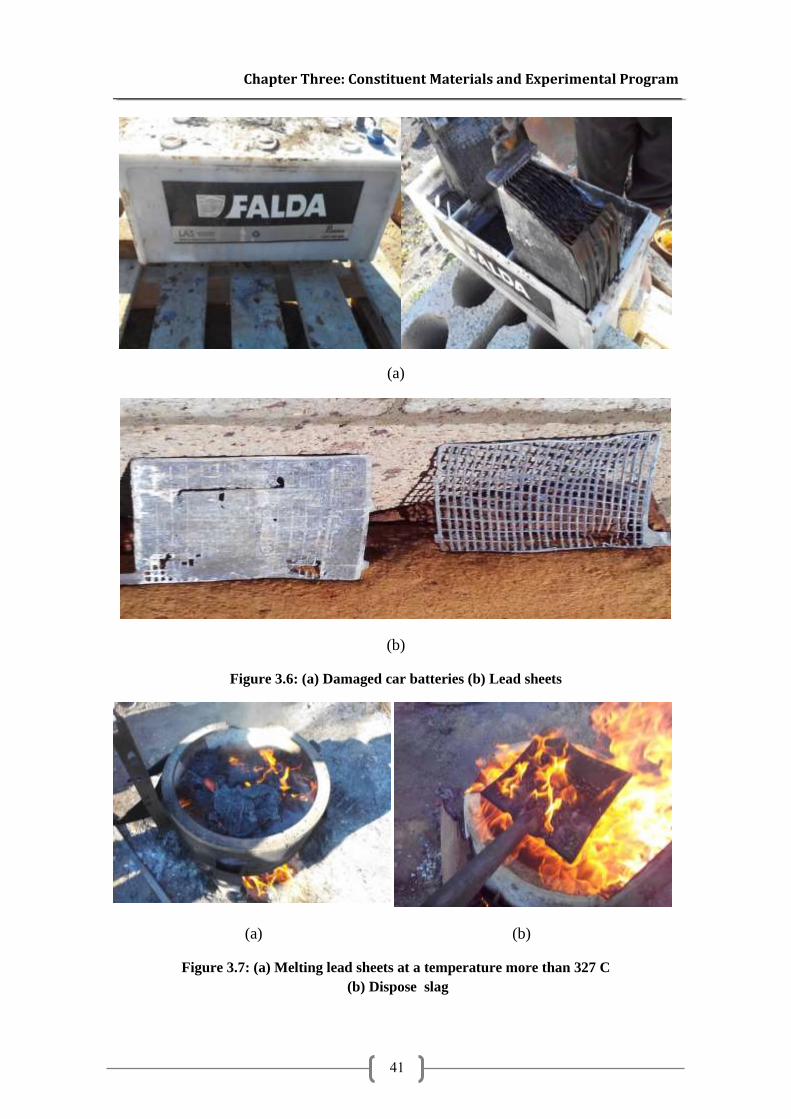
Chapter Three: Constituent Materials and Experimental Program
41
(a)
(b)
Figure 3.6: (a) Damaged car batteries (b) Lead sheets
(a) (b)
Figure 3.7: (a) Melting lead sheets at a temperature more than 327 C
(b) Dispose slag
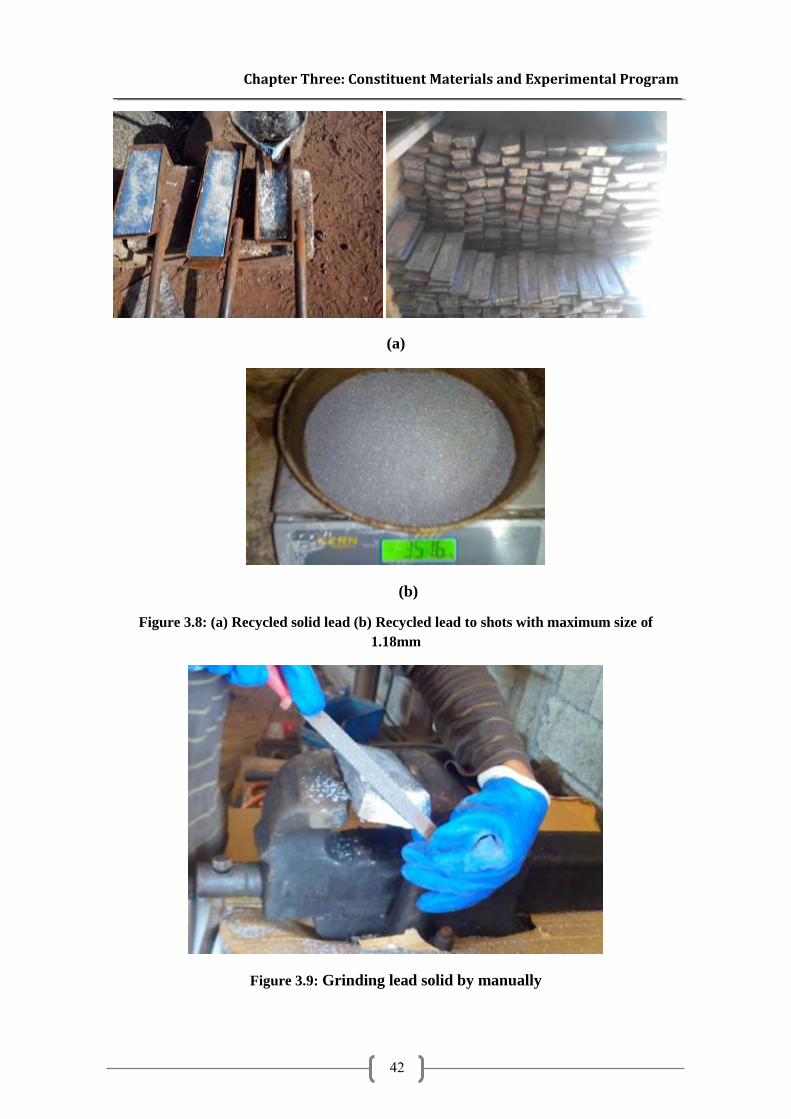
Chapter Three: Constituent Materials and Experimental Program
42
(a)
(b)
Figure 3.8: (a) Recycled solid lead (b) Recycled lead to shots with maximum size of
1.18mm
Figure 3.9: Grinding lead solid by manually
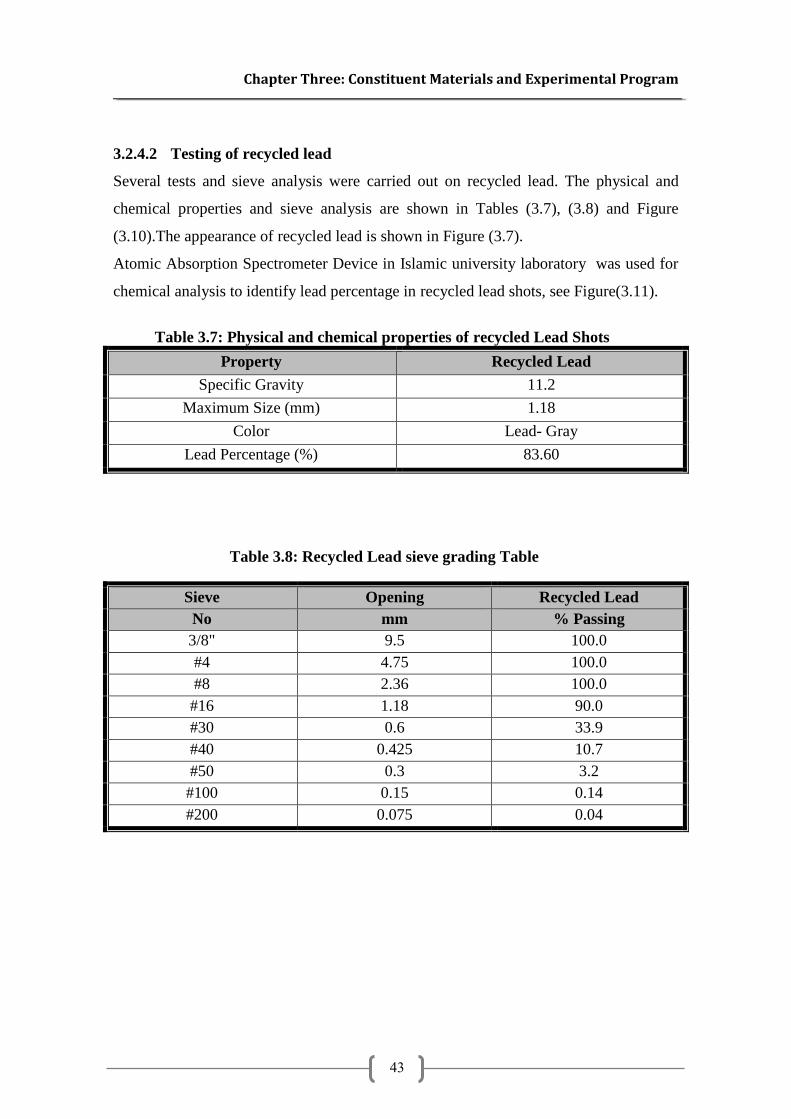
Chapter Three: Constituent Materials and Experimental Program
43
3.2.4.2 Testing of recycled lead
Several tests and sieve analysis were carried out on recycled lead. The physical and
chemical properties and sieve analysis are shown in Tables (3.7), (3.8) and Figure
(3.10).The appearance of recycled lead is shown in Figure (3.7).
Atomic Absorption Spectrometer Device in Islamic university laboratory was used for
chemical analysis to identify lead percentage in recycled lead shots, see Figure(3.11).
Table 3.7: Physical and chemical properties of recycled Lead Shots
Property Recycled Lead
Specific Gravity 11.2
Maximum Size (mm) 1.18
Color Lead- Gray
Lead Percentage (%) 83.60
Table 3.8: Recycled Lead sieve grading Table
Sieve Opening Recycled Lead
No mm % Passing
3/8" 9.5 100.0
#4 4.75 100.0
#8 2.36 100.0
#16 1.18 90.0
#30 0.6 33.9
#40 0.425 10.7
#50 0.3 3.2
#100 0.15 0.14
#200 0.075 0.04
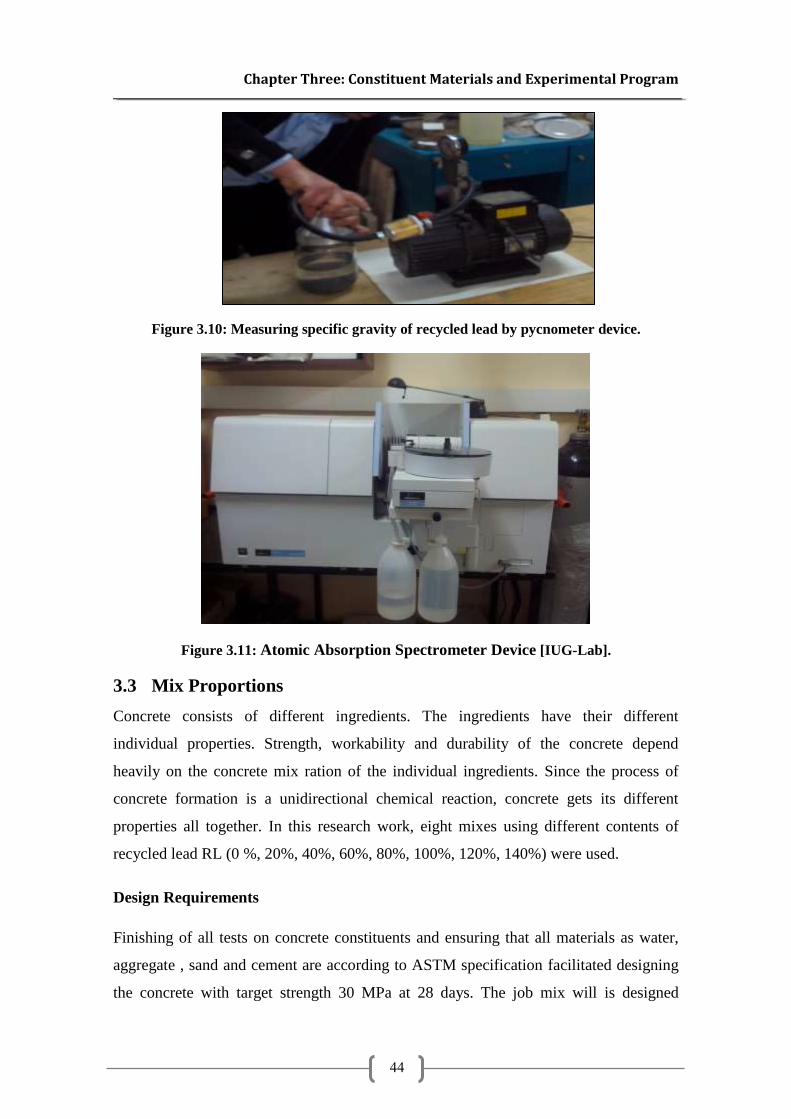
Chapter Three: Constituent Materials and Experimental Program
44
Figure 3.10: Measuring specific gravity of recycled lead by pycnometer device.
Figure 3.11: Atomic Absorption Spectrometer Device [IUG-Lab].
3.3 Mix Proportions
Concrete consists of different ingredients. The ingredients have their different
individual properties. Strength, workability and durability of the concrete depend
heavily on the concrete mix ration of the individual ingredients. Since the process of
concrete formation is a unidirectional chemical reaction, concrete gets its different
properties all together. In this research work, eight mixes using different contents of
recycled lead RL (0 %, 20%, 40%, 60%, 80%, 100%, 120%, 140%) were used.
Design Requirements
Finishing of all tests on concrete constituents and ensuring that all materials as water,
aggregate , sand and cement are according to ASTM specification facilitated designing
the concrete with target strength 30 MPa at 28 days. The job mix will is designed
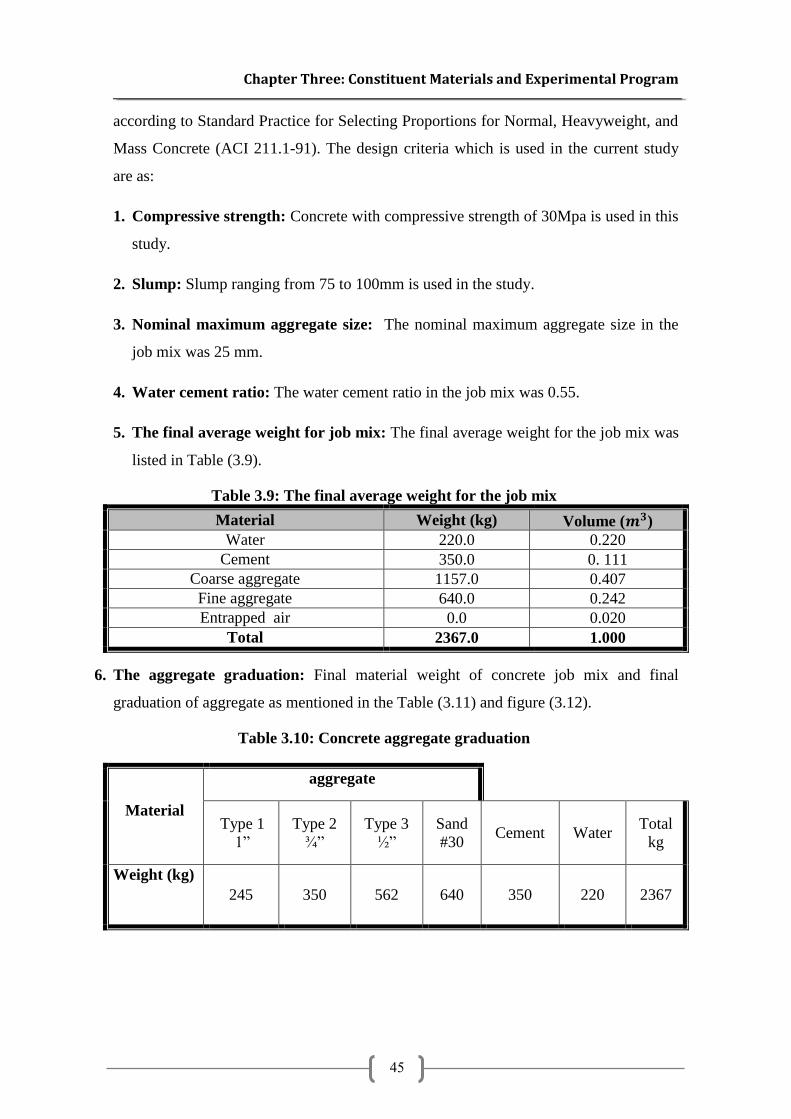
Chapter Three: Constituent Materials and Experimental Program
45
according to Standard Practice for Selecting Proportions for Normal, Heavyweight, and
Mass Concrete (ACI 211.1-91). The design criteria which is used in the current study
are as:
1. Compressive strength: Concrete with compressive strength of 30Mpa is used in this
study.
2. Slump: Slump ranging from 75 to 100mm is used in the study.
3. Nominal maximum aggregate size: The nominal maximum aggregate size in the
job mix was 25 mm.
4. Water cement ratio: The water cement ratio in the job mix was 0.55.
5. The final average weight for job mix: The final average weight for the job mix was
listed in Table (3.9).
Table 3.9: The final average weight for the job mix
Material Weight (kg) Volume (𝒎𝟑)
Water 220.0 0.220
Cement 350.0 0. 111
Coarse aggregate 1157.0 0.407
Fine aggregate 640.0 0.242
Entrapped air 0.0 0.020
Total 2367.0 1.000
6. The aggregate graduation: Final material weight of concrete job mix and final
graduation of aggregate as mentioned in the Table (3.11) and figure (3.12).
Table 3.10: Concrete aggregate graduation
Material
aggregate
Type 1
1”
Type 2
¾”
Type 3
½”
Sand
#30 Cement Water
Total
kg
Weight (kg)
245 350 562 640 350 220 2367
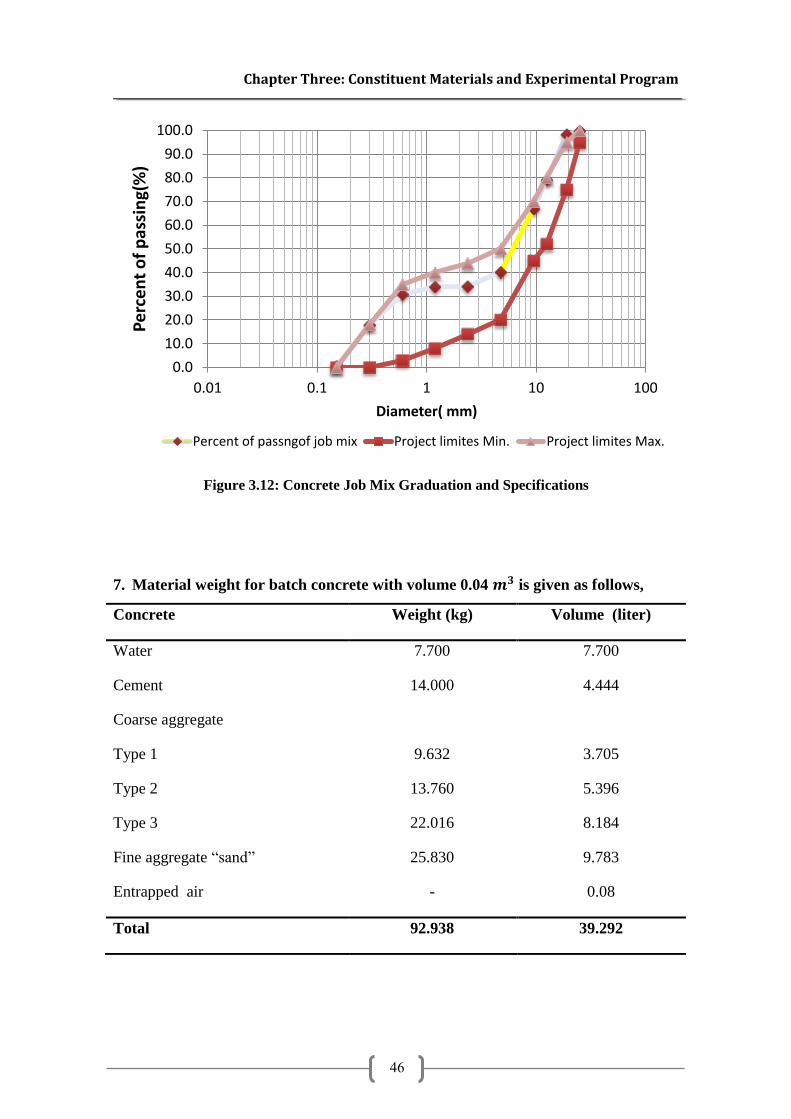
Chapter Three: Constituent Materials and Experimental Program
46
Figure 3.12: Concrete Job Mix Graduation and Specifications
7. Material weight for batch concrete with volume 0.04 𝒎𝟑 is given as follows,
Concrete Weight (kg) Volume (liter)
Water 7.700 7.700
Cement 14.000 4.444
Coarse aggregate
Type 1 9.632 3.705
Type 2 13.760 5.396
Type 3 22.016 8.184
Fine aggregate “sand” 25.830 9.783
Entrapped air - 0.08
Total 92.938 39.292
0.0
10.0
20.0
30.0
40.0
50.0
60.0
70.0
80.0
90.0
100.0
0.01 0.1 1 10 100
Pe
rce
nt
of
pas
sin
g(%
)
Diameter( mm)
Percent of passngof job mix Project limites Min. Project limites Max.
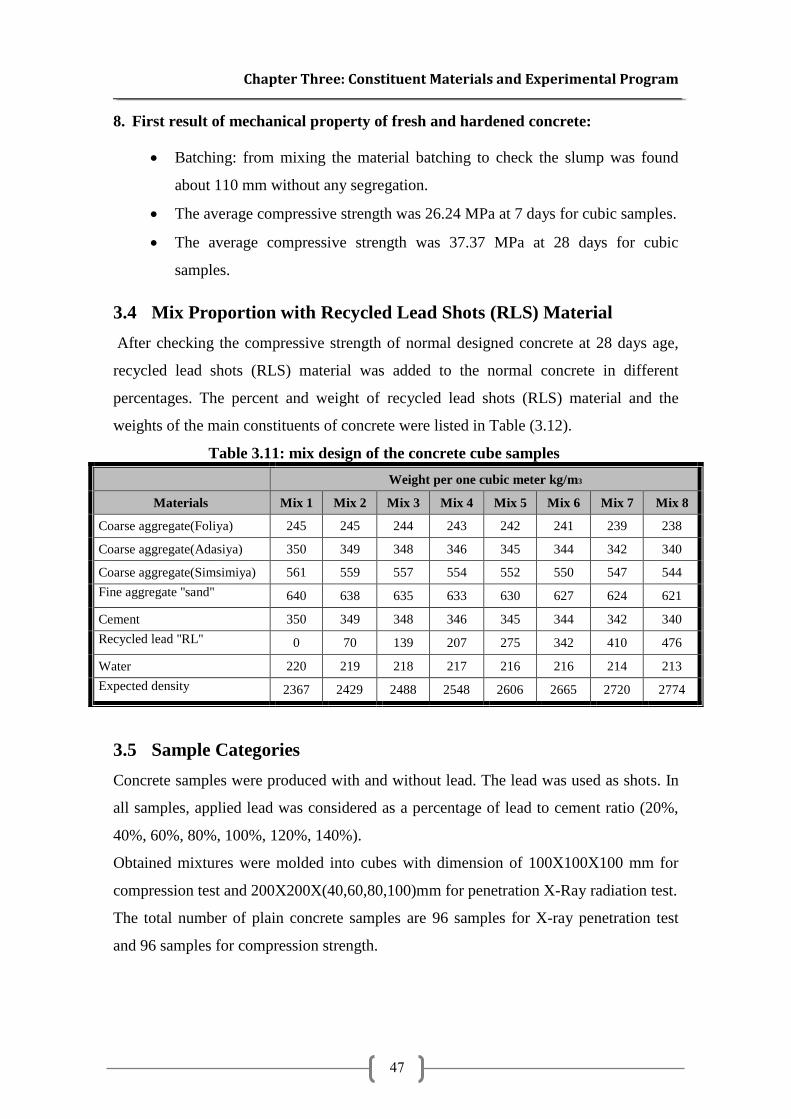
Chapter Three: Constituent Materials and Experimental Program
47
8. First result of mechanical property of fresh and hardened concrete:
Batching: from mixing the material batching to check the slump was found
about 110 mm without any segregation.
The average compressive strength was 26.24 MPa at 7 days for cubic samples.
The average compressive strength was 37.37 MPa at 28 days for cubic
samples.
3.4 Mix Proportion with Recycled Lead Shots (RLS) Material
After checking the compressive strength of normal designed concrete at 28 days age,
recycled lead shots (RLS) material was added to the normal concrete in different
percentages. The percent and weight of recycled lead shots (RLS) material and the
weights of the main constituents of concrete were listed in Table (3.12).
Table 3.11: mix design of the concrete cube samples
Weight per one cubic meter kg/m3
Materials Mix 1 Mix 2 Mix 3 Mix 4 Mix 5 Mix 6 Mix 7 Mix 8
Coarse aggregate(Foliya) 245 245 244 243 242 241 239 238
Coarse aggregate(Adasiya) 350 349 348 346 345 344 342 340
Coarse aggregate(Simsimiya) 561 559 557 554 552 550 547 544
Fine aggregate ''sand'' 640 638 635 633 630 627 624 621
Cement 350 349 348 346 345 344 342 340
Recycled lead ''RL'' 0 70 139 207 275 342 410 476
Water 220 219 218 217 216 216 214 213
Expected density 2367 2429 2488 2548 2606 2665 2720 2774
3.5 Sample Categories
Concrete samples were produced with and without lead. The lead was used as shots. In
all samples, applied lead was considered as a percentage of lead to cement ratio (20%,
40%, 60%, 80%, 100%, 120%, 140%).
Obtained mixtures were molded into cubes with dimension of 100X100X100 mm for
compression test and 200X200X(40,60,80,100)mm for penetration X-Ray radiation test.
The total number of plain concrete samples are 96 samples for X-ray penetration test
and 96 samples for compression strength.
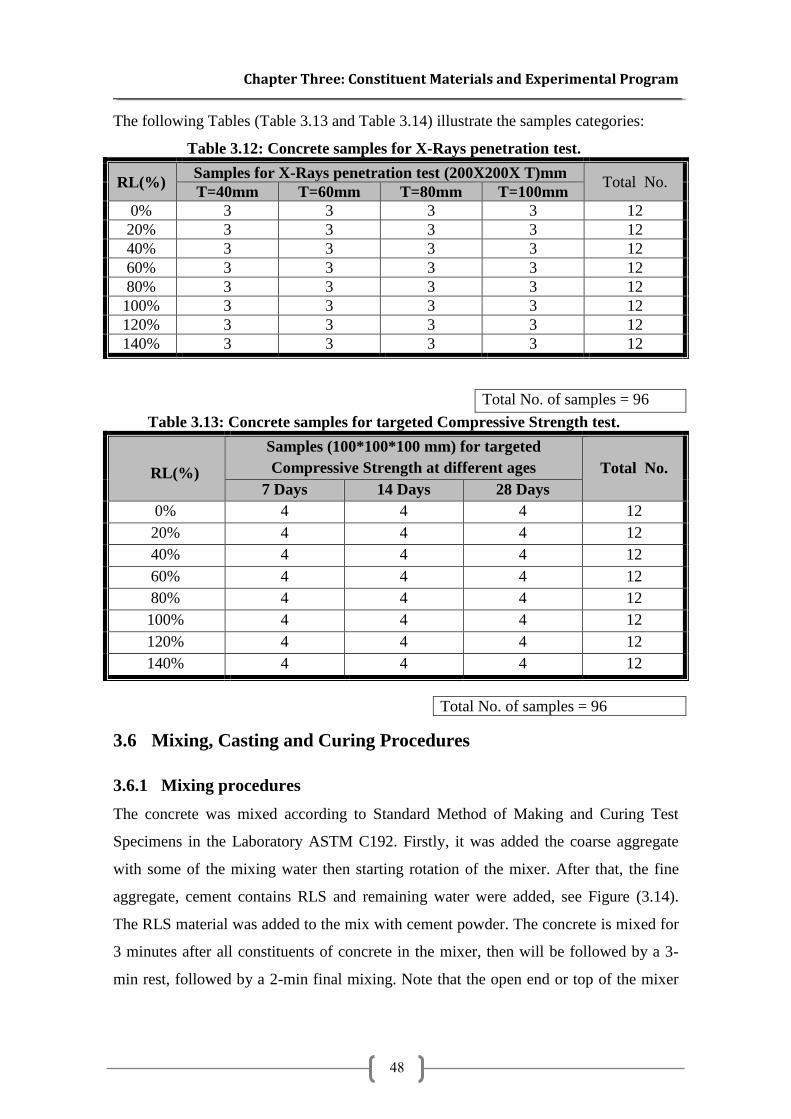
Chapter Three: Constituent Materials and Experimental Program
48
The following Tables (Table 3.13 and Table 3.14) illustrate the samples categories:
Table 3.12: Concrete samples for X-Rays penetration test.
RL(%) Samples for X-Rays penetration test (200X200X T)mm
Total No. T=40mm T=60mm T=80mm T=100mm
0% 3 3 3 3 12
20% 3 3 3 3 12
40% 3 3 3 3 12
60% 3 3 3 3 12
80% 3 3 3 3 12
100% 3 3 3 3 12
120% 3 3 3 3 12
140% 3 3 3 3 12
Total No. of samples = 96
Table 3.13: Concrete samples for targeted Compressive Strength test.
RL(%)
Samples (100*100*100 mm) for targeted
Compressive Strength at different ages Total No.
7 Days 14 Days 28 Days
0% 4 4 4 12
20% 4 4 4 12
40% 4 4 4 12
60% 4 4 4 12
80% 4 4 4 12
100% 4 4 4 12
120% 4 4 4 12
140% 4 4 4 12
Total No. of samples = 96
3.6 Mixing, Casting and Curing Procedures
3.6.1 Mixing procedures
The concrete was mixed according to Standard Method of Making and Curing Test
Specimens in the Laboratory ASTM C192. Firstly, it was added the coarse aggregate
with some of the mixing water then starting rotation of the mixer. After that, the fine
aggregate, cement contains RLS and remaining water were added, see Figure (3.14).
The RLS material was added to the mix with cement powder. The concrete is mixed for
3 minutes after all constituents of concrete in the mixer, then will be followed by a 3-
min rest, followed by a 2-min final mixing. Note that the open end or top of the mixer
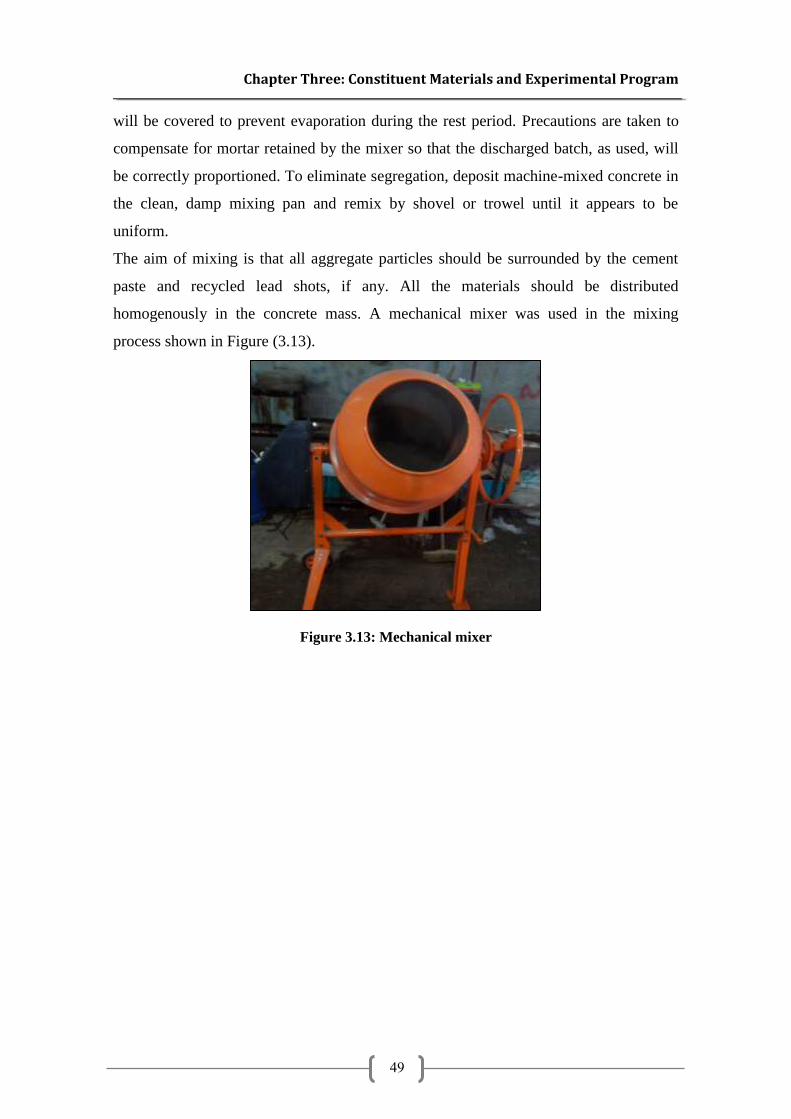
Chapter Three: Constituent Materials and Experimental Program
49
will be covered to prevent evaporation during the rest period. Precautions are taken to
compensate for mortar retained by the mixer so that the discharged batch, as used, will
be correctly proportioned. To eliminate segregation, deposit machine-mixed concrete in
the clean, damp mixing pan and remix by shovel or trowel until it appears to be
uniform.
The aim of mixing is that all aggregate particles should be surrounded by the cement
paste and recycled lead shots, if any. All the materials should be distributed
homogenously in the concrete mass. A mechanical mixer was used in the mixing
process shown in Figure (3.13).
Figure 3.13: Mechanical mixer
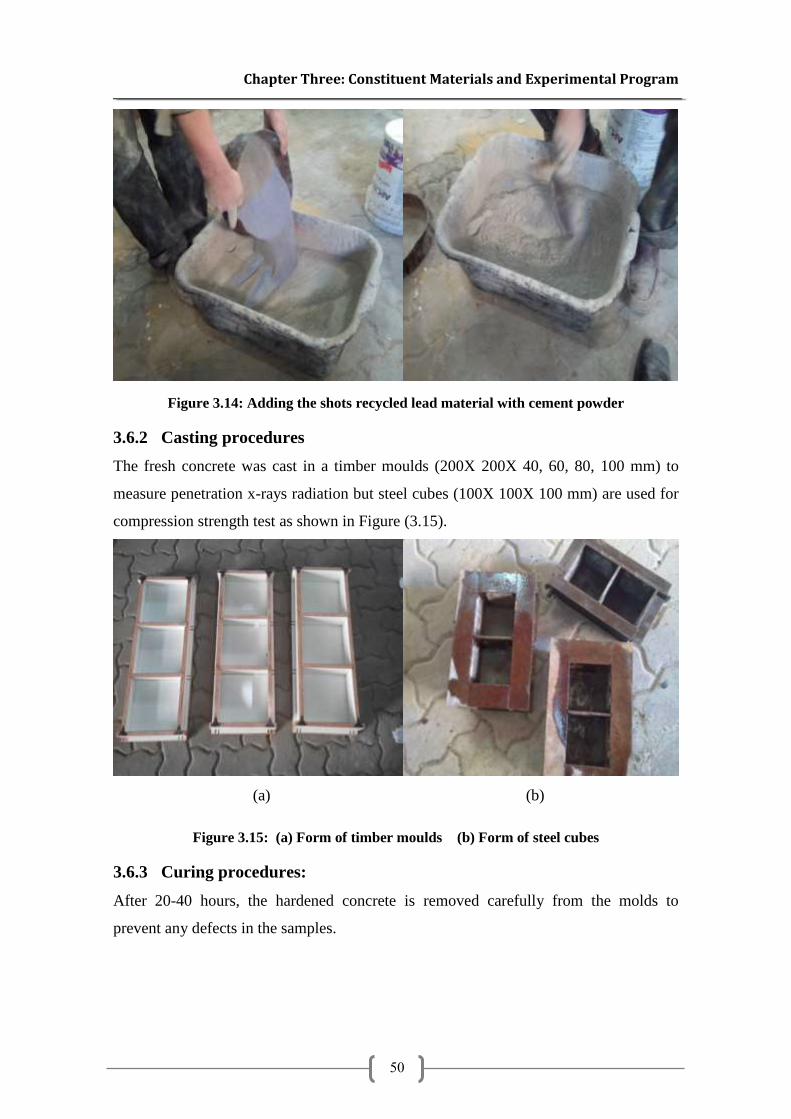
Chapter Three: Constituent Materials and Experimental Program
50
Figure 3.14: Adding the shots recycled lead material with cement powder
3.6.2 Casting procedures
The fresh concrete was cast in a timber moulds (200X 200X 40, 60, 80, 100 mm) to
measure penetration x-rays radiation but steel cubes (100X 100X 100 mm) are used for
compression strength test as shown in Figure (3.15).
(a) (b)
Figure 3.15: (a) Form of timber moulds (b) Form of steel cubes
3.6.3 Curing procedures:
After 20-40 hours, the hardened concrete is removed carefully from the molds to
prevent any defects in the samples.
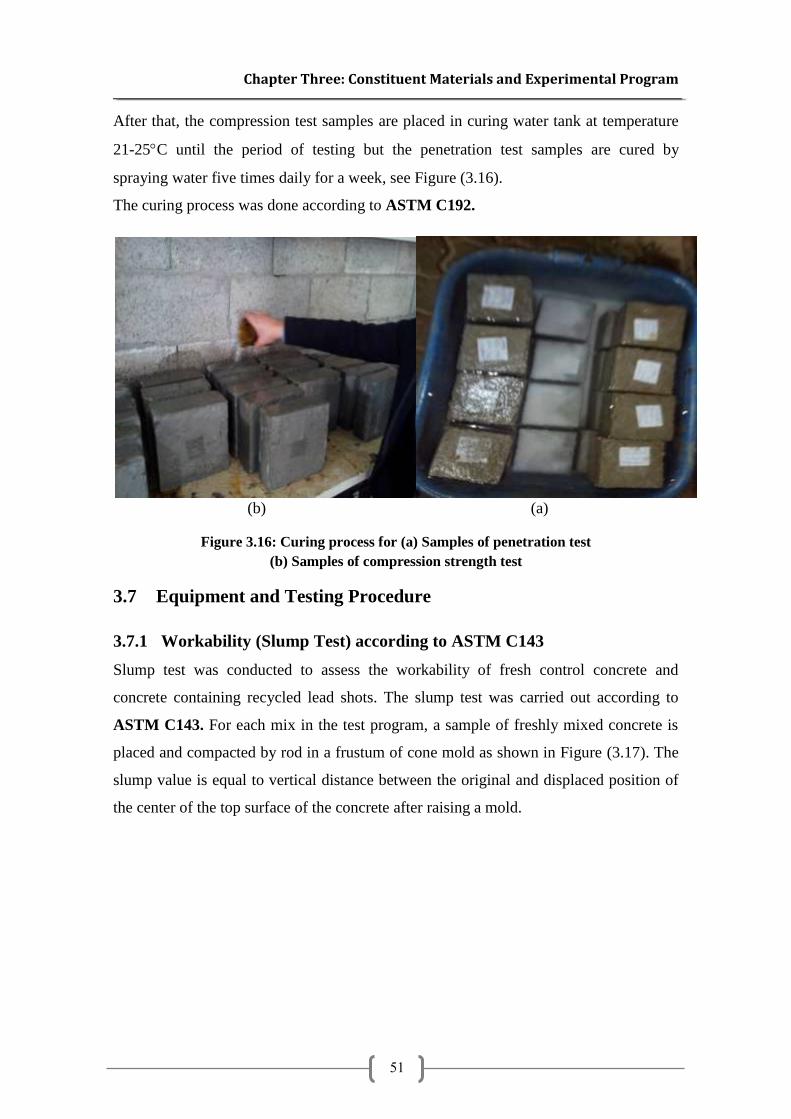
Chapter Three: Constituent Materials and Experimental Program
51
After that, the compression test samples are placed in curing water tank at temperature
21-25C until the period of testing but the penetration test samples are cured by
spraying water five times daily for a week, see Figure (3.16).
The curing process was done according to ASTM C192.
(b) (a)
Figure 3.16: Curing process for (a) Samples of penetration test
(b) Samples of compression strength test
3.7 Equipment and Testing Procedure
3.7.1 Workability (Slump Test) according to ASTM C143
Slump test was conducted to assess the workability of fresh control concrete and
concrete containing recycled lead shots. The slump test was carried out according to
ASTM C143. For each mix in the test program, a sample of freshly mixed concrete is
placed and compacted by rod in a frustum of cone mold as shown in Figure (3.17). The
slump value is equal to vertical distance between the original and displaced position of
the center of the top surface of the concrete after raising a mold.
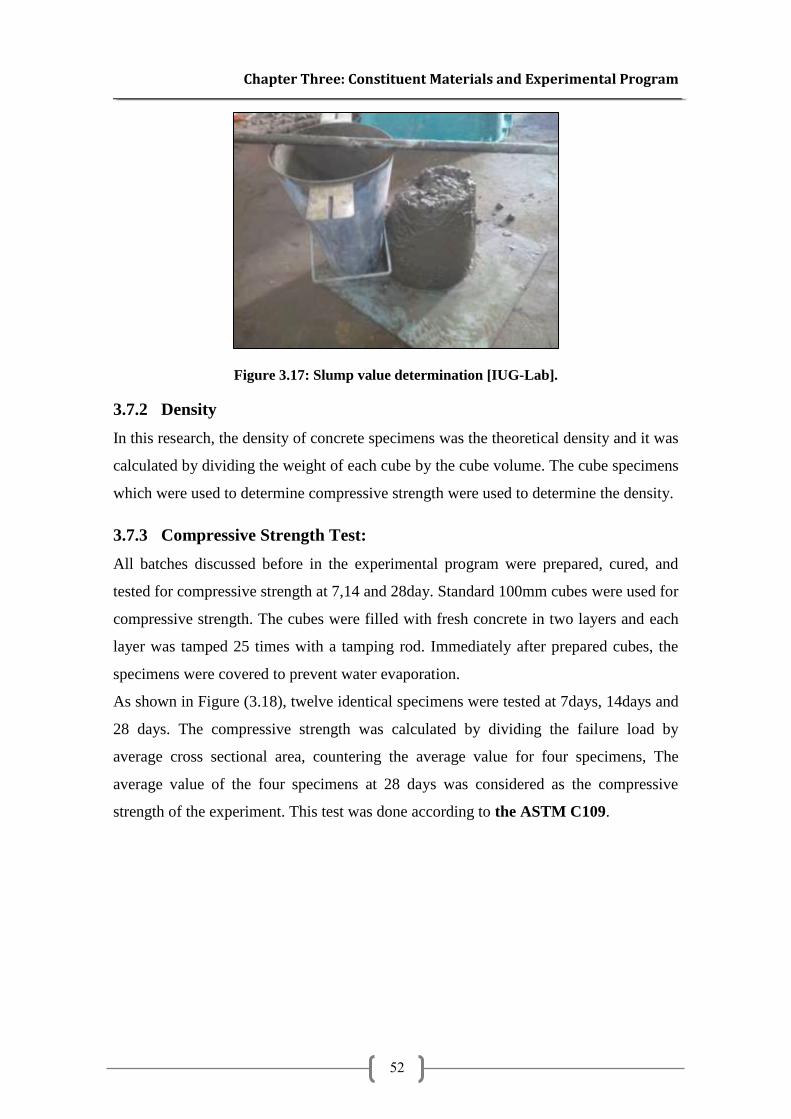
Chapter Three: Constituent Materials and Experimental Program
52
Figure 3.17: Slump value determination [IUG-Lab].
3.7.2 Density
In this research, the density of concrete specimens was the theoretical density and it was
calculated by dividing the weight of each cube by the cube volume. The cube specimens
which were used to determine compressive strength were used to determine the density.
3.7.3 Compressive Strength Test:
All batches discussed before in the experimental program were prepared, cured, and
tested for compressive strength at 7,14 and 28day. Standard 100mm cubes were used for
compressive strength. The cubes were filled with fresh concrete in two layers and each
layer was tamped 25 times with a tamping rod. Immediately after prepared cubes, the
specimens were covered to prevent water evaporation.
As shown in Figure (3.18), twelve identical specimens were tested at 7days, 14days and
28 days. The compressive strength was calculated by dividing the failure load by
average cross sectional area, countering the average value for four specimens, The
average value of the four specimens at 28 days was considered as the compressive
strength of the experiment. This test was done according to the ASTM C109.
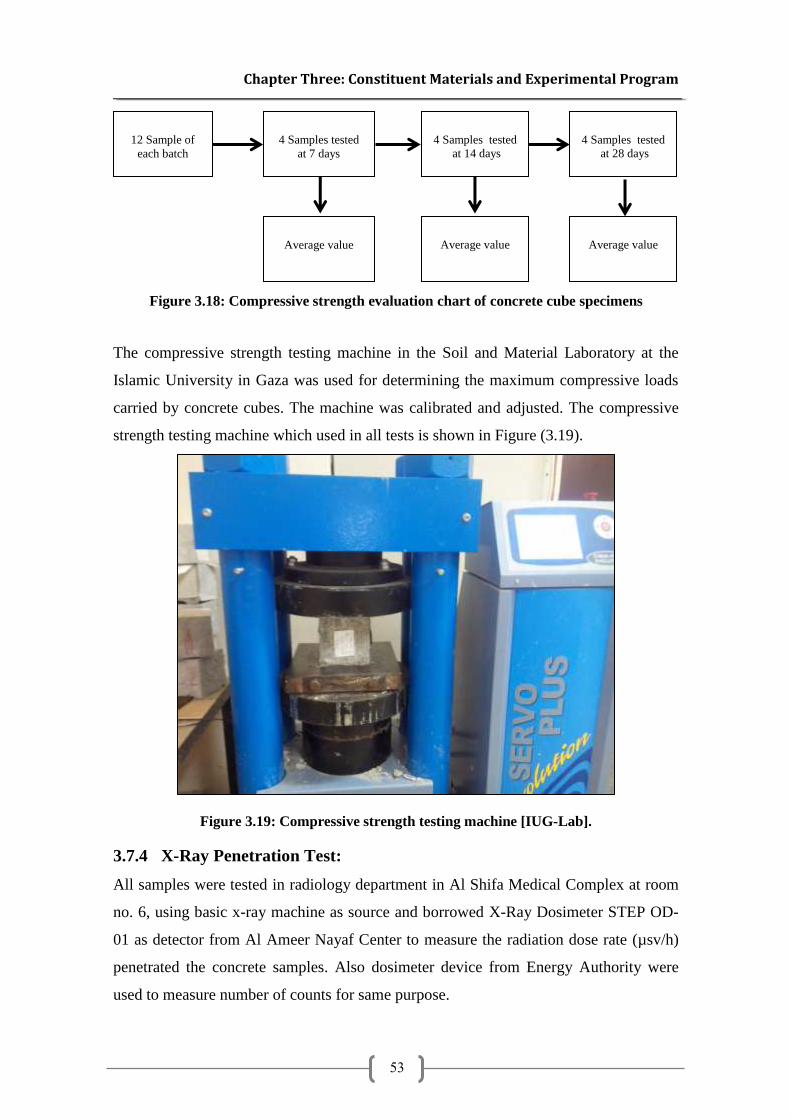
Chapter Three: Constituent Materials and Experimental Program
53
Figure 3.18: Compressive strength evaluation chart of concrete cube specimens
The compressive strength testing machine in the Soil and Material Laboratory at the
Islamic University in Gaza was used for determining the maximum compressive loads
carried by concrete cubes. The machine was calibrated and adjusted. The compressive
strength testing machine which used in all tests is shown in Figure (3.19).
Figure 3.19: Compressive strength testing machine [IUG-Lab].
3.7.4 X-Ray Penetration Test:
All samples were tested in radiology department in Al Shifa Medical Complex at room
no. 6, using basic x-ray machine as source and borrowed X-Ray Dosimeter STEP OD-
01 as detector from Al Ameer Nayaf Center to measure the radiation dose rate (µsv/h)
penetrated the concrete samples. Also dosimeter device from Energy Authority were
used to measure number of counts for same purpose.
12 Sample of
each batch
4 Samples tested
at 7 days
4 Samples tested
at 14 days
4 Samples tested
at 28 days
Average value Average value
Average value
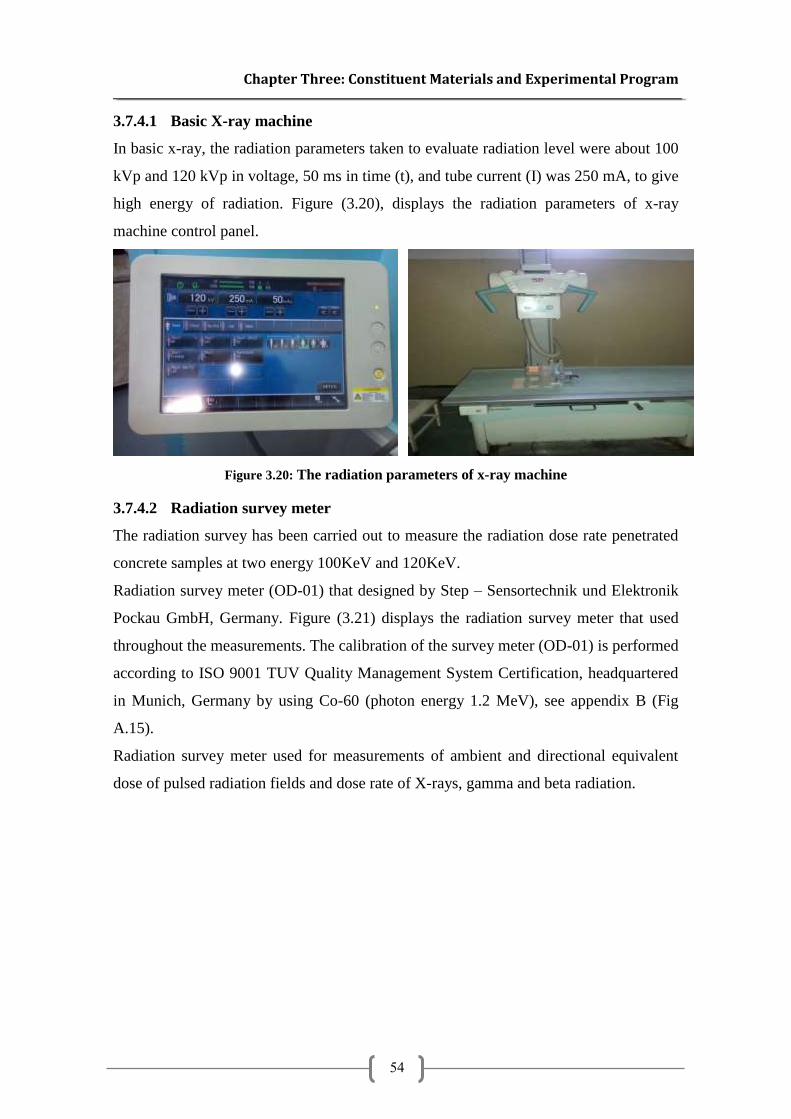
Chapter Three: Constituent Materials and Experimental Program
54
3.7.4.1 Basic X-ray machine
In basic x-ray, the radiation parameters taken to evaluate radiation level were about 100
kVp and 120 kVp in voltage, 50 ms in time (t), and tube current (I) was 250 mA, to give
high energy of radiation. Figure (3.20), displays the radiation parameters of x-ray
machine control panel.
Figure 3.20: The radiation parameters of x-ray machine
3.7.4.2 Radiation survey meter
The radiation survey has been carried out to measure the radiation dose rate penetrated
concrete samples at two energy 100KeV and 120KeV.
Radiation survey meter (OD-01) that designed by Step – Sensortechnik und Elektronik
Pockau GmbH, Germany. Figure (3.21) displays the radiation survey meter that used
throughout the measurements. The calibration of the survey meter (OD-01) is performed
according to ISO 9001 TUV Quality Management System Certification, headquartered
in Munich, Germany by using Co-60 (photon energy 1.2 MeV), see appendix B (Fig
A.15).
Radiation survey meter used for measurements of ambient and directional equivalent
dose of pulsed radiation fields and dose rate of X-rays, gamma and beta radiation.
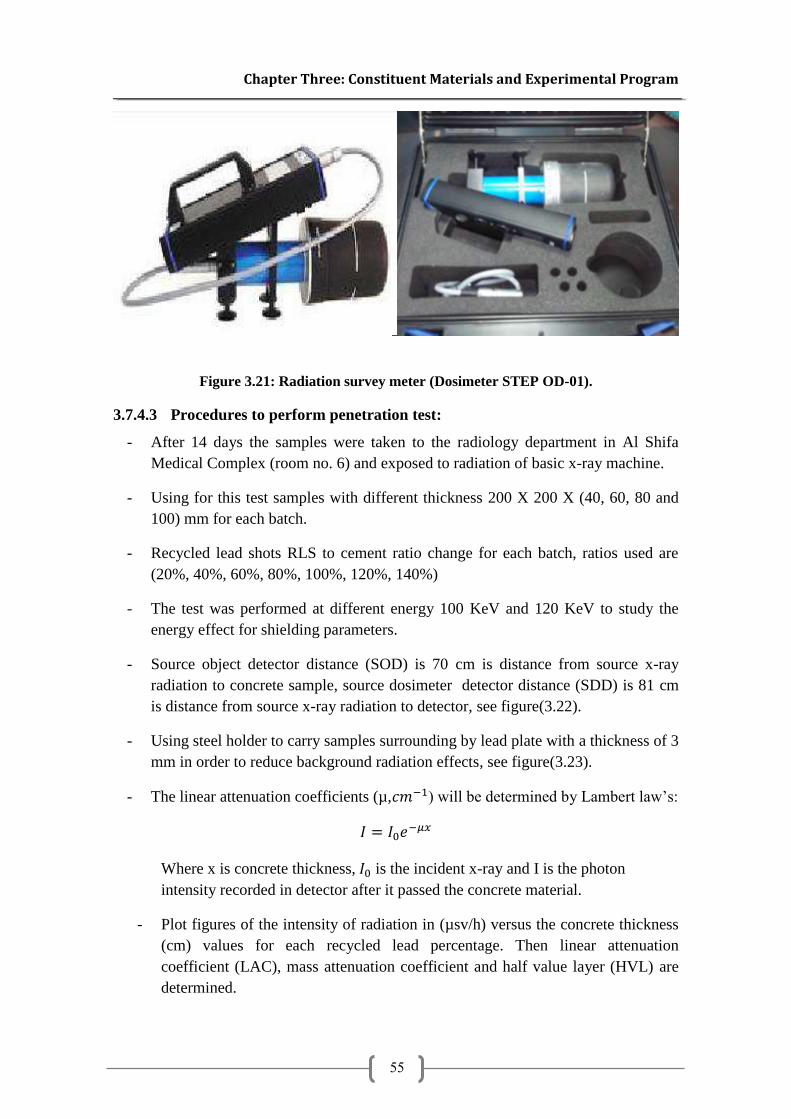
Chapter Three: Constituent Materials and Experimental Program
55
Figure 3.21: Radiation survey meter (Dosimeter STEP OD-01).
3.7.4.3 Procedures to perform penetration test:
- After 14 days the samples were taken to the radiology department in Al Shifa
Medical Complex (room no. 6) and exposed to radiation of basic x-ray machine.
- Using for this test samples with different thickness 200 X 200 X (40, 60, 80 and
100) mm for each batch.
- Recycled lead shots RLS to cement ratio change for each batch, ratios used are
(20%, 40%, 60%, 80%, 100%, 120%, 140%)
- The test was performed at different energy 100 KeV and 120 KeV to study the
energy effect for shielding parameters.
- Source object detector distance (SOD) is 70 cm is distance from source x-ray
radiation to concrete sample, source dosimeter detector distance (SDD) is 81 cm
is distance from source x-ray radiation to detector, see figure(3.22).
- Using steel holder to carry samples surrounding by lead plate with a thickness of 3
mm in order to reduce background radiation effects, see figure(3.23).
- The linear attenuation coefficients (µ,𝑐𝑚−1) will be determined by Lambert law’s:
𝐼 = 𝐼0𝑒−𝜇𝑥
Where x is concrete thickness, 𝐼0 is the incident x-ray and I is the photon
intensity recorded in detector after it passed the concrete material.
- Plot figures of the intensity of radiation in (µsv/h) versus the concrete thickness
(cm) values for each recycled lead percentage. Then linear attenuation
coefficient (LAC), mass attenuation coefficient and half value layer (HVL) are
determined.
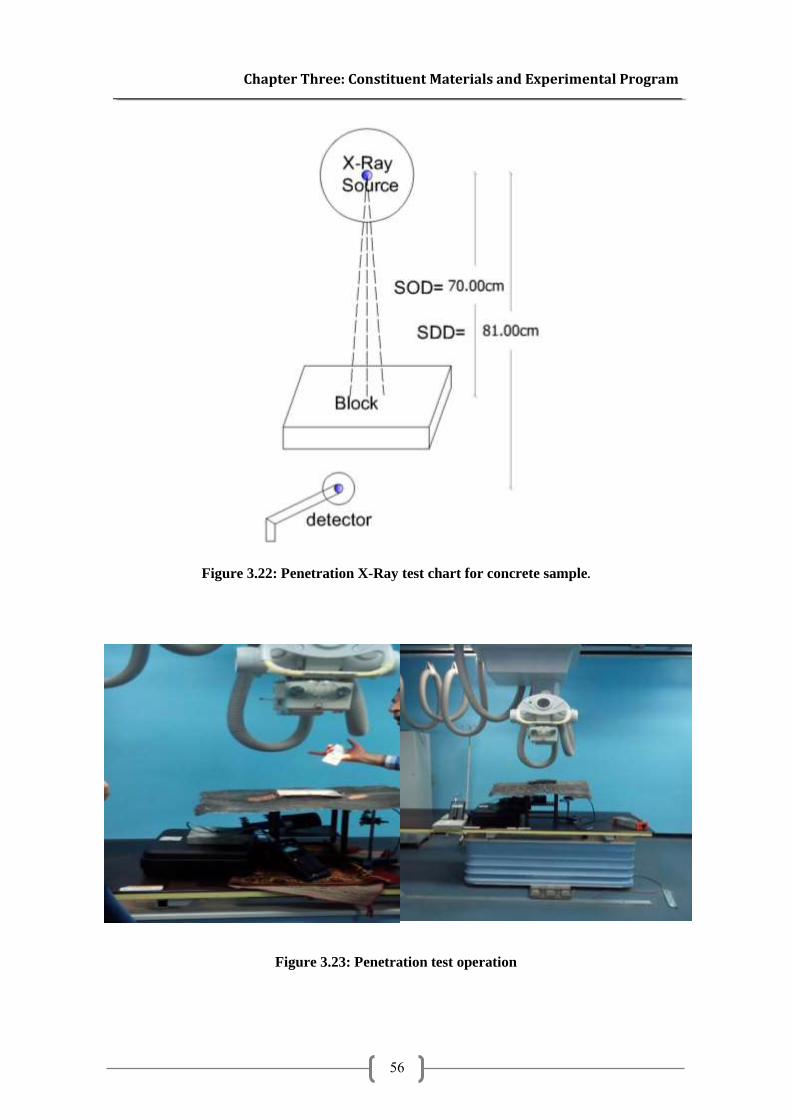
Chapter Three: Constituent Materials and Experimental Program
56
Figure 3.22: Penetration X-Ray test chart for concrete sample.
Figure 3.23: Penetration test operation
Chapter Four: Test Results and Discussion
57
Chapter Four:
Test Results and Discussion
Chapter Four: Test Results and Discussion
4.1 Introduction
4.2 Normal Concrete
4.3 Workability Test Results
4.4 Mechanical Properties of Hardened Concrete
4.5 Density
4.6 Penetration X-ray Test Results
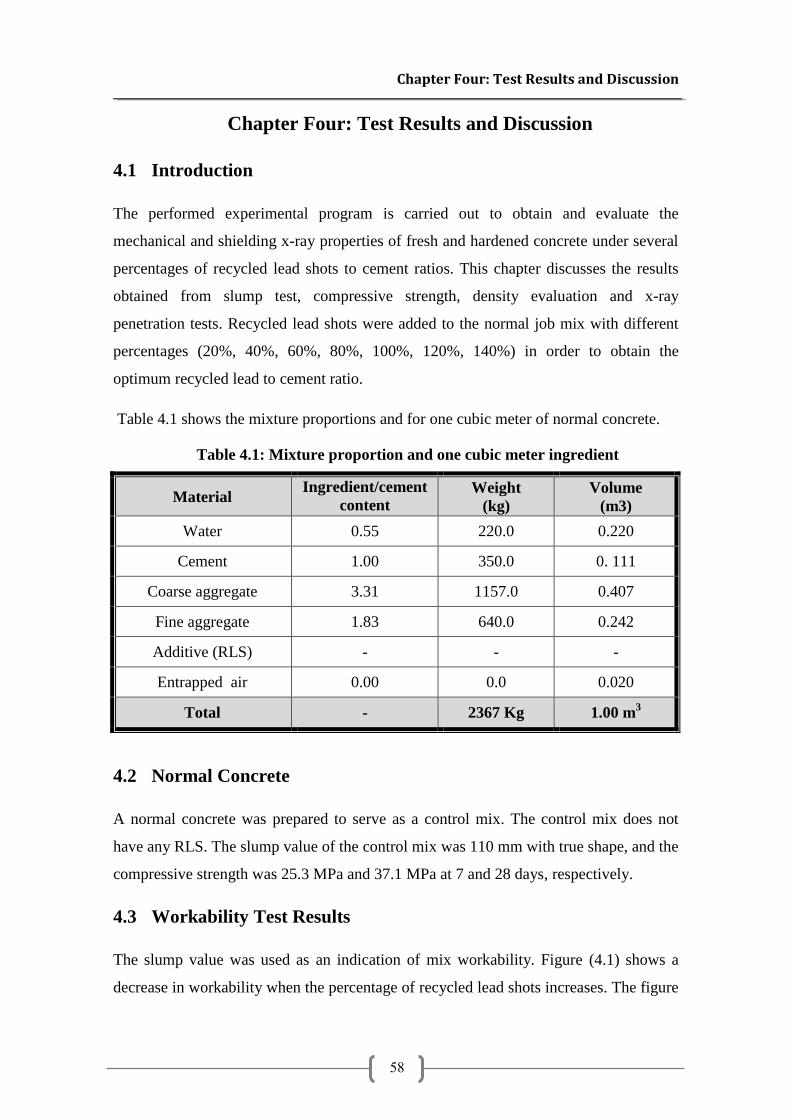
Chapter Four: Test Results and Discussion
58
4 Chapter Four: Test Results and Discussion
4.1 Introduction
The performed experimental program is carried out to obtain and evaluate the
mechanical and shielding x-ray properties of fresh and hardened concrete under several
percentages of recycled lead shots to cement ratios. This chapter discusses the results
obtained from slump test, compressive strength, density evaluation and x-ray
penetration tests. Recycled lead shots were added to the normal job mix with different
percentages (20%, 40%, 60%, 80%, 100%, 120%, 140%) in order to obtain the
optimum recycled lead to cement ratio.
Table 4.1 shows the mixture proportions and for one cubic meter of normal concrete.
Table 4.1: Mixture proportion and one cubic meter ingredient
Material Ingredient/cement
content
(%)
Weight
(kg)
Volume
(m3)
Water 0.55 220.0 0.220
Cement 1.00 350.0 0. 111
Coarse aggregate 3.31 1157.0 0.407
Fine aggregate 1.83 640.0 0.242
Additive (RLS) - - -
Entrapped air 0.00 0.0 0.020
Total - 2367 Kg 1.00 m3
4.2 Normal Concrete
A normal concrete was prepared to serve as a control mix. The control mix does not
have any RLS. The slump value of the control mix was 110 mm with true shape, and the
compressive strength was 25.3 MPa and 37.1 MPa at 7 and 28 days, respectively.
4.3 Workability Test Results
The slump value was used as an indication of mix workability. Figure (4.1) shows a
decrease in workability when the percentage of recycled lead shots increases. The figure
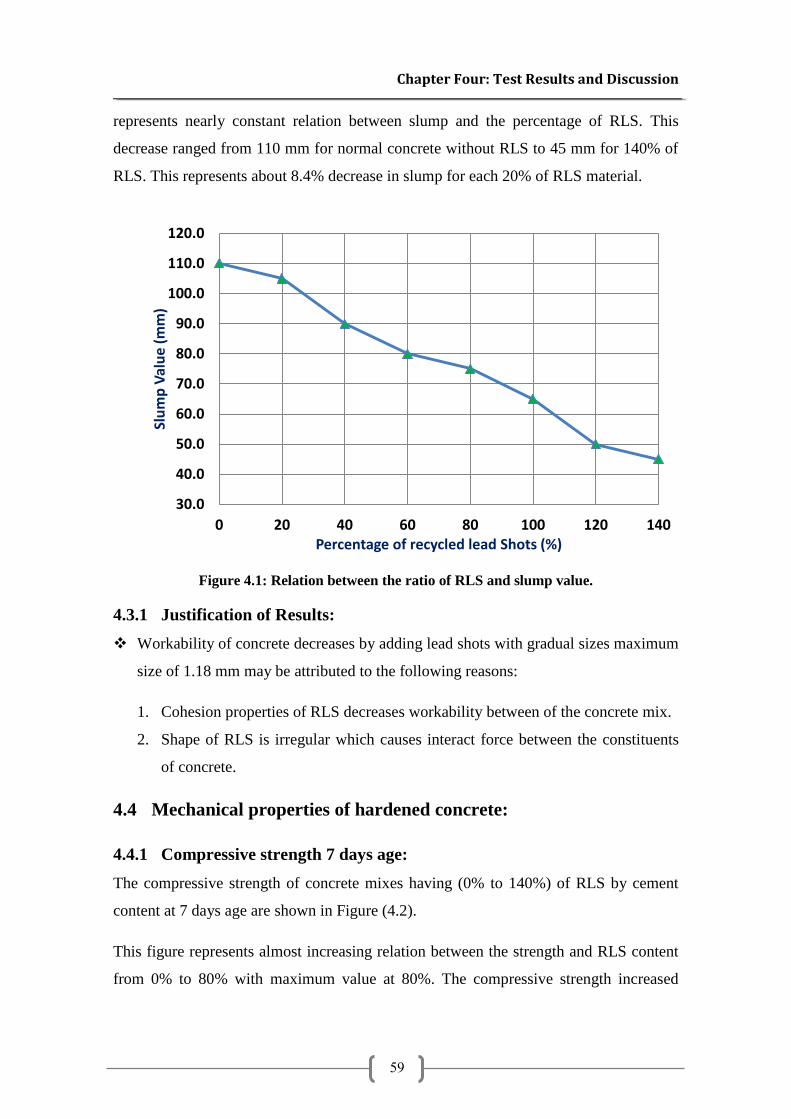
Chapter Four: Test Results and Discussion
59
represents nearly constant relation between slump and the percentage of RLS. This
decrease ranged from 110 mm for normal concrete without RLS to 45 mm for 140% of
RLS. This represents about 8.4% decrease in slump for each 20% of RLS material.
Figure 4.1: Relation between the ratio of RLS and slump value.
4.3.1 Justification of Results:
Workability of concrete decreases by adding lead shots with gradual sizes maximum
size of 1.18 mm may be attributed to the following reasons:
1. Cohesion properties of RLS decreases workability between of the concrete mix.
2. Shape of RLS is irregular which causes interact force between the constituents
of concrete.
4.4 Mechanical properties of hardened concrete:
4.4.1 Compressive strength 7 days age:
The compressive strength of concrete mixes having (0% to 140%) of RLS by cement
content at 7 days age are shown in Figure (4.2).
This figure represents almost increasing relation between the strength and RLS content
from 0% to 80% with maximum value at 80%. The compressive strength increased
30.0
40.0
50.0
60.0
70.0
80.0
90.0
100.0
110.0
120.0
0 20 40 60 80 100 120 140
Slu
mp
Val
ue
(mm
)
Percentage of recycled lead Shots (%)
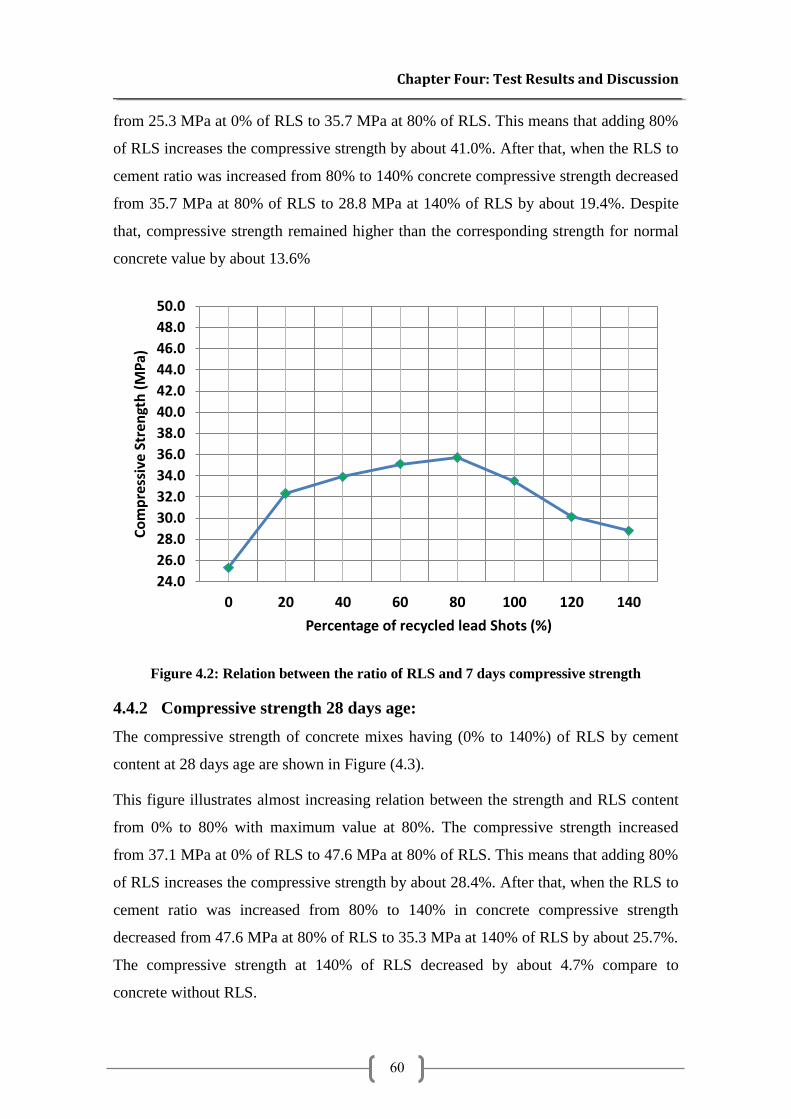
Chapter Four: Test Results and Discussion
60
from 25.3 MPa at 0% of RLS to 35.7 MPa at 80% of RLS. This means that adding 80%
of RLS increases the compressive strength by about 41.0%. After that, when the RLS to
cement ratio was increased from 80% to 140% concrete compressive strength decreased
from 35.7 MPa at 80% of RLS to 28.8 MPa at 140% of RLS by about 19.4%. Despite
that, compressive strength remained higher than the corresponding strength for normal
concrete value by about 13.6%
Figure 4.2: Relation between the ratio of RLS and 7 days compressive strength
4.4.2 Compressive strength 28 days age:
The compressive strength of concrete mixes having (0% to 140%) of RLS by cement
content at 28 days age are shown in Figure (4.3).
This figure illustrates almost increasing relation between the strength and RLS content
from 0% to 80% with maximum value at 80%. The compressive strength increased
from 37.1 MPa at 0% of RLS to 47.6 MPa at 80% of RLS. This means that adding 80%
of RLS increases the compressive strength by about 28.4%. After that, when the RLS to
cement ratio was increased from 80% to 140% in concrete compressive strength
decreased from 47.6 MPa at 80% of RLS to 35.3 MPa at 140% of RLS by about 25.7%.
The compressive strength at 140% of RLS decreased by about 4.7% compare to
concrete without RLS.
24.0
26.0
28.0
30.0
32.0
34.0
36.0
38.0
40.0
42.0
44.0
46.0
48.0
50.0
0 20 40 60 80 100 120 140
Co
mp
ress
ive
Stre
ngt
h (
MP
a)
Percentage of recycled lead Shots (%)
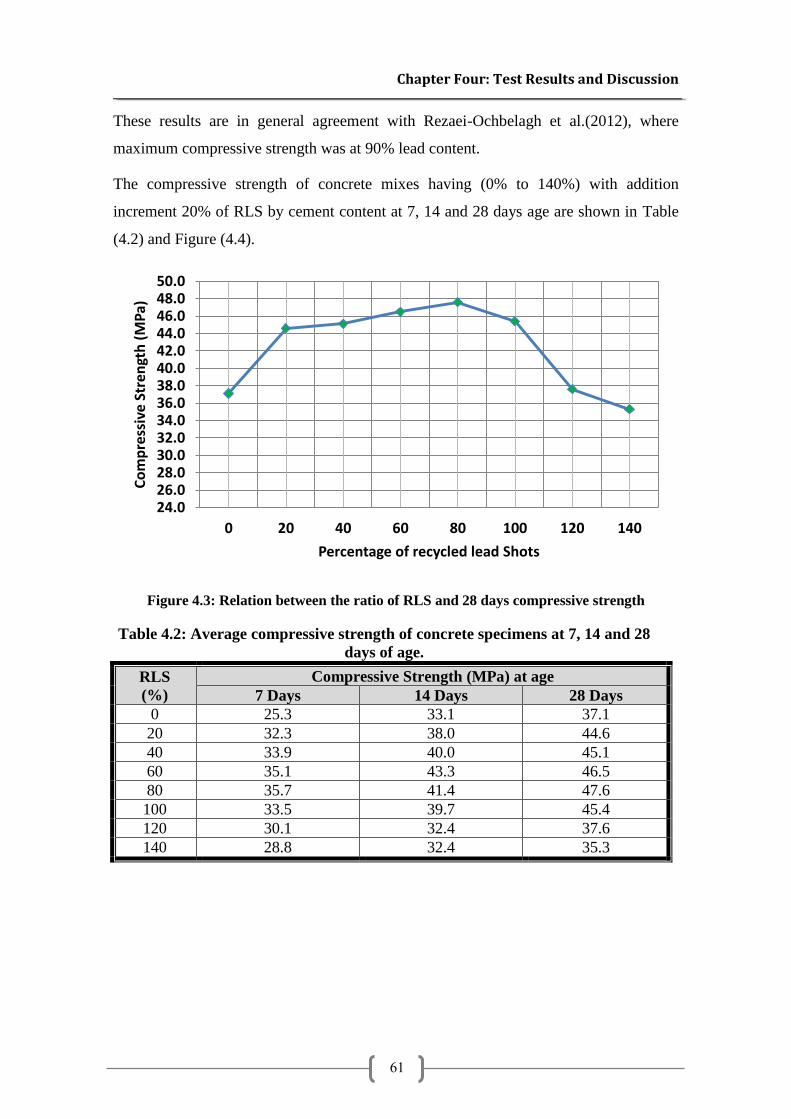
Chapter Four: Test Results and Discussion
61
These results are in general agreement with Rezaei-Ochbelagh et al.(2012), where
maximum compressive strength was at 90% lead content.
The compressive strength of concrete mixes having (0% to 140%) with addition
increment 20% of RLS by cement content at 7, 14 and 28 days age are shown in Table
(4.2) and Figure (4.4).
Figure 4.3: Relation between the ratio of RLS and 28 days compressive strength
Table 4.2: Average compressive strength of concrete specimens at 7, 14 and 28
days of age.
RLS
(%)
Compressive Strength (MPa) at age
7 Days 14 Days 28 Days
0 25.3 33.1 37.1
20 32.3 38.0 44.6
40 33.9 40.0 45.1
60 35.1 43.3 46.5
80 35.7 41.4 47.6
100 33.5 39.7 45.4
120 30.1 32.4 37.6
140 28.8 32.4 35.3
24.026.028.030.032.034.036.038.040.042.044.046.048.050.0
0 20 40 60 80 100 120 140
Co
mp
ress
ive
Stre
ngt
h (
MP
a)
Percentage of recycled lead Shots
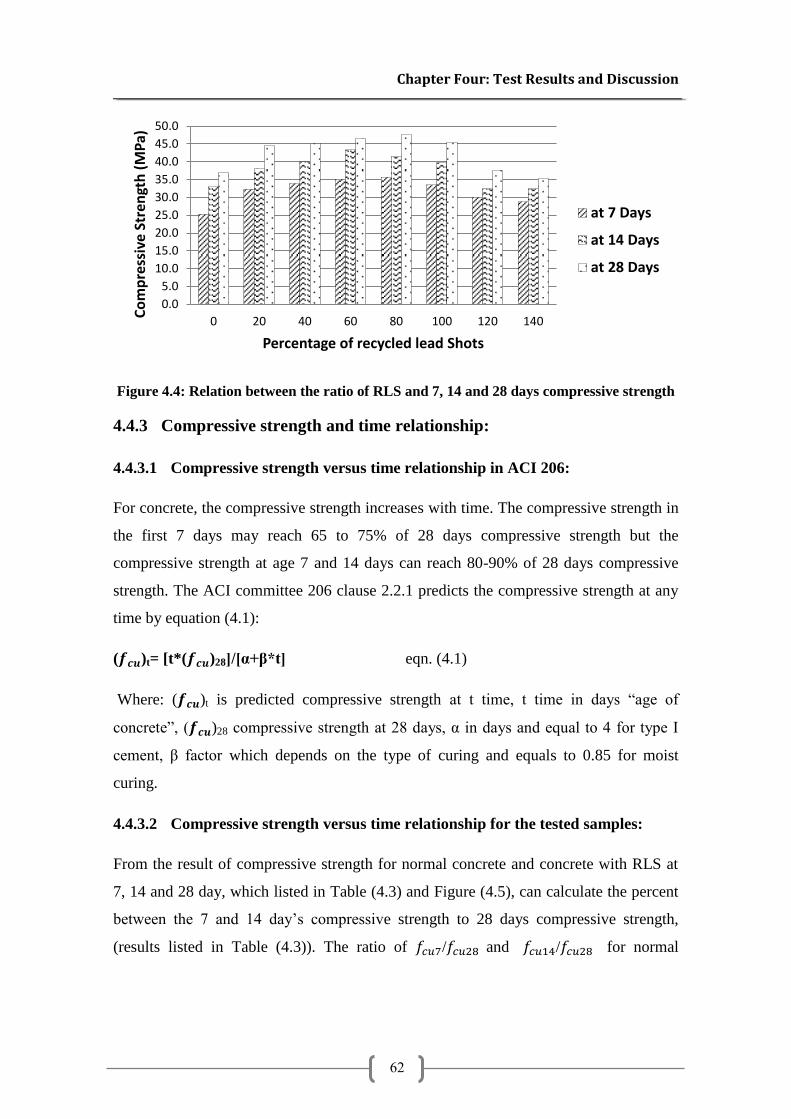
Chapter Four: Test Results and Discussion
62
Figure 4.4: Relation between the ratio of RLS and 7, 14 and 28 days compressive strength
4.4.3 Compressive strength and time relationship:
4.4.3.1 Compressive strength versus time relationship in ACI 206:
For concrete, the compressive strength increases with time. The compressive strength in
the first 7 days may reach 65 to 75% of 28 days compressive strength but the
compressive strength at age 7 and 14 days can reach 80-90% of 28 days compressive
strength. The ACI committee 206 clause 2.2.1 predicts the compressive strength at any
time by equation (4.1):
(𝒇𝒄𝒖)t= [t*(𝒇𝒄𝒖)28]/[α+β*t] eqn. (4.1)
Where: (𝒇𝒄𝒖)t is predicted compressive strength at t time, t time in days “age of
concrete”, (𝒇𝒄𝒖)28 compressive strength at 28 days, α in days and equal to 4 for type I
cement, β factor which depends on the type of curing and equals to 0.85 for moist
curing.
4.4.3.2 Compressive strength versus time relationship for the tested samples:
From the result of compressive strength for normal concrete and concrete with RLS at
7, 14 and 28 day, which listed in Table (4.3) and Figure (4.5), can calculate the percent
between the 7 and 14 day’s compressive strength to 28 days compressive strength,
(results listed in Table (4.3)). The ratio of 𝑓𝑐𝑢7/𝑓𝑐𝑢28 and 𝑓𝑐𝑢14/𝑓𝑐𝑢28 for normal
0.0
5.0
10.0
15.0
20.0
25.0
30.0
35.0
40.0
45.0
50.0
0 20 40 60 80 100 120 140
Co
mp
ress
ive
Stre
ngt
h (
MP
a)
Percentage of recycled lead Shots
at 7 Days
at 14 Days
at 28 Days
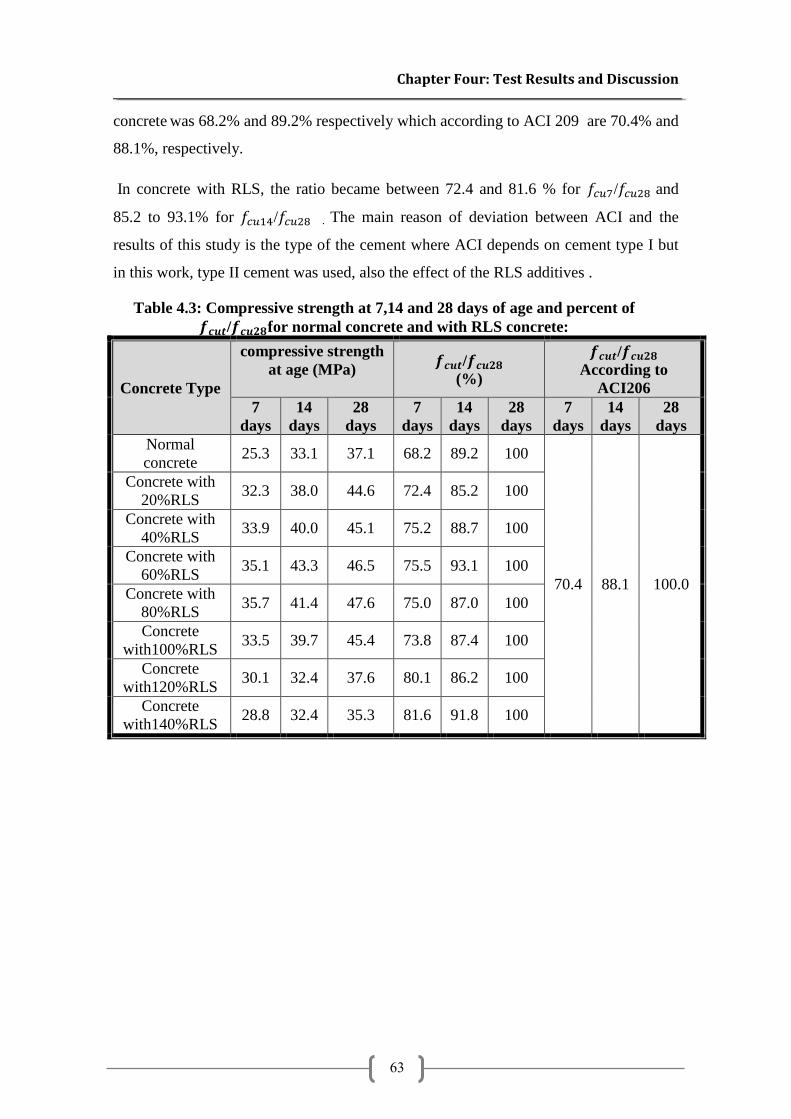
Chapter Four: Test Results and Discussion
63
concrete was 68.2% and 89.2% respectively which according to ACI 209 are 70.4% and
88.1%, respectively.
In concrete with RLS, the ratio became between 72.4 and 81.6 % for 𝑓𝑐𝑢7/𝑓𝑐𝑢28 and
85.2 to 93.1% for 𝑓𝑐𝑢14/𝑓𝑐𝑢28 . The main reason of deviation between ACI and the
results of this study is the type of the cement where ACI depends on cement type I but
in this work, type II cement was used, also the effect of the RLS additives .
Table 4.3: Compressive strength at 7,14 and 28 days of age and percent of
𝒇𝒄𝒖𝒕/𝒇𝒄𝒖𝟐𝟖for normal concrete and with RLS concrete:
Concrete Type
compressive strength
at age (MPa)
𝒇𝒄𝒖𝒕/𝒇𝒄𝒖𝟐𝟖
(%)
𝒇𝒄𝒖𝒕/𝒇𝒄𝒖𝟐𝟖
According to
ACI206
7
days
14
days
28
days
7
days
14
days
28
days
7
days
14
days
28
days
Normal
concrete 25.3 33.1 37.1 68.2 89.2 100
70.4 88.1 100.0
Concrete with
20%RLS 32.3 38.0 44.6 72.4 85.2 100
Concrete with
40%RLS 33.9 40.0 45.1 75.2 88.7 100
Concrete with
60%RLS 35.1 43.3 46.5 75.5 93.1 100
Concrete with
80%RLS 35.7 41.4 47.6 75.0 87.0 100
Concrete
with100%RLS 33.5 39.7 45.4 73.8 87.4 100
Concrete
with120%RLS 30.1 32.4 37.6 80.1 86.2 100
Concrete
with140%RLS 28.8 32.4 35.3 81.6 91.8 100
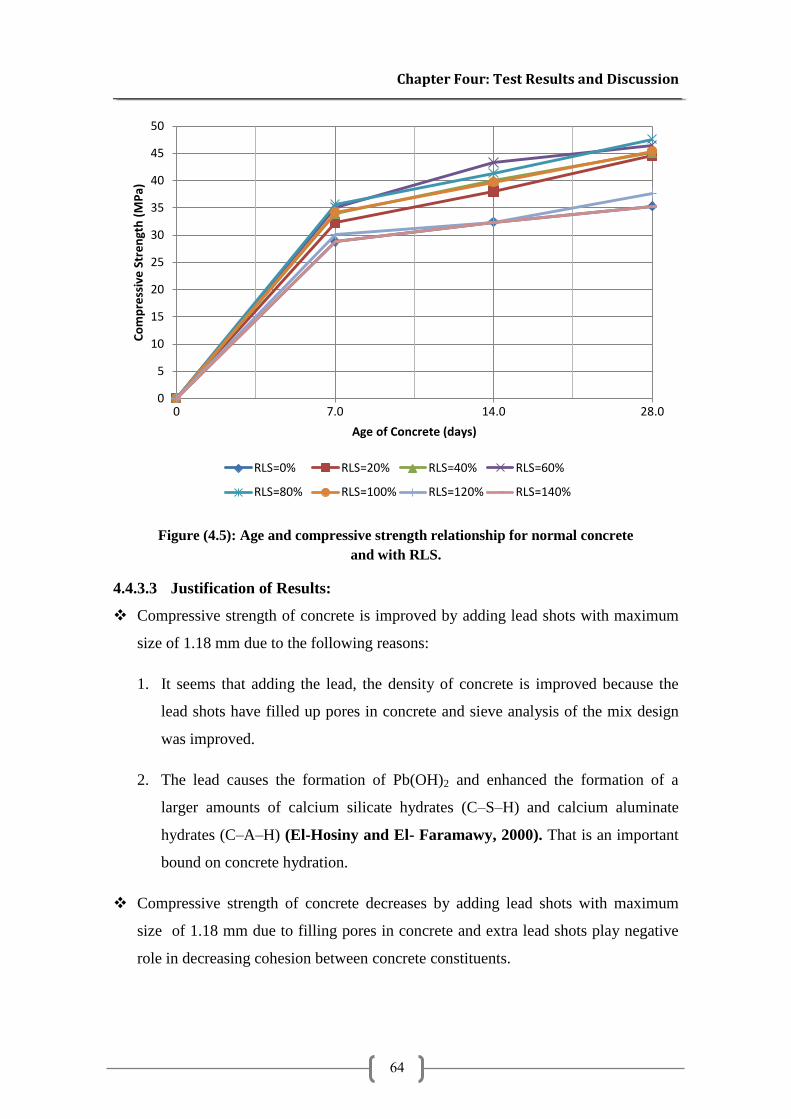
Chapter Four: Test Results and Discussion
64
Figure (4.5): Age and compressive strength relationship for normal concrete
and with RLS.
4.4.3.3 Justification of Results:
Compressive strength of concrete is improved by adding lead shots with maximum
size of 1.18 mm due to the following reasons:
1. It seems that adding the lead, the density of concrete is improved because the
lead shots have filled up pores in concrete and sieve analysis of the mix design
was improved.
2. The lead causes the formation of Pb(OH)2 and enhanced the formation of a
larger amounts of calcium silicate hydrates (C–S–H) and calcium aluminate
hydrates (C–A–H) (El-Hosiny and El- Faramawy, 2000). That is an important
bound on concrete hydration.
Compressive strength of concrete decreases by adding lead shots with maximum
size of 1.18 mm due to filling pores in concrete and extra lead shots play negative
role in decreasing cohesion between concrete constituents.
0
5
10
15
20
25
30
35
40
45
50
0 7.0 14.0 28.0
Co
mp
ress
ive
Str
en
gth
(M
Pa)
Age of Concrete (days)
RLS=0% RLS=20% RLS=40% RLS=60%
RLS=80% RLS=100% RLS=120% RLS=140%
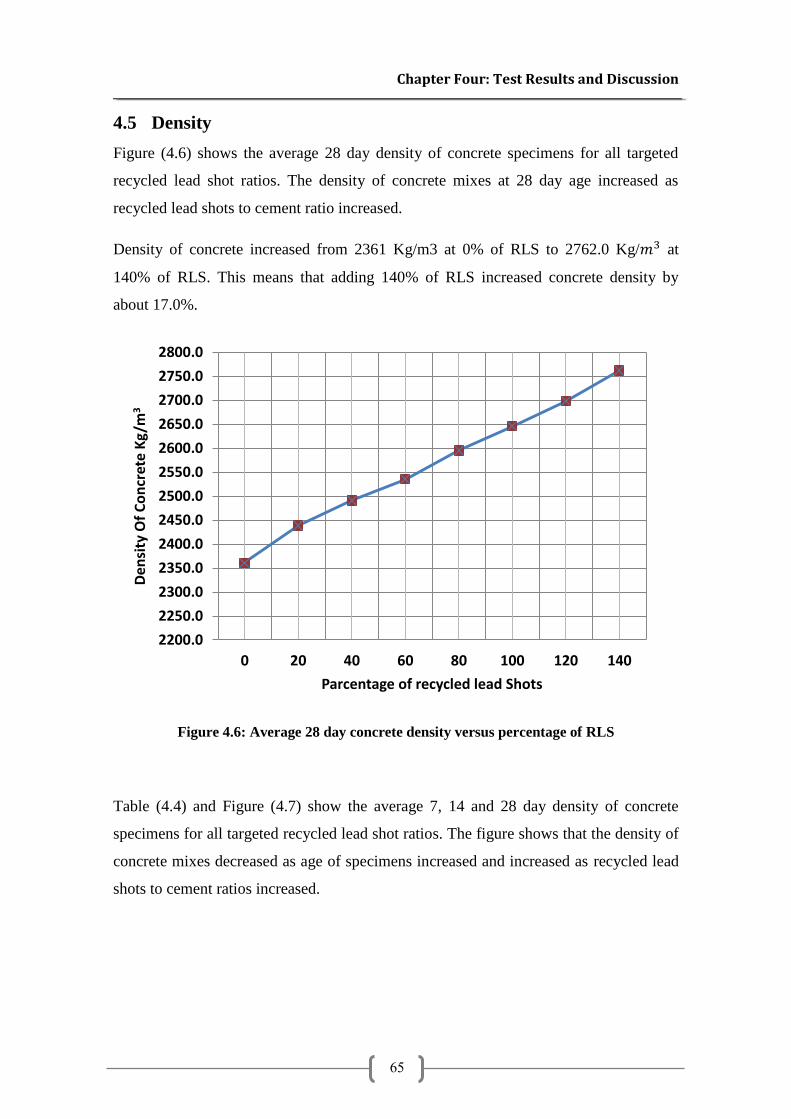
Chapter Four: Test Results and Discussion
65
4.5 Density
Figure (4.6) shows the average 28 day density of concrete specimens for all targeted
recycled lead shot ratios. The density of concrete mixes at 28 day age increased as
recycled lead shots to cement ratio increased.
Density of concrete increased from 2361 Kg/m3 at 0% of RLS to 2762.0 Kg/𝑚3 at
140% of RLS. This means that adding 140% of RLS increased concrete density by
about 17.0%.
Figure 4.6: Average 28 day concrete density versus percentage of RLS
Table (4.4) and Figure (4.7) show the average 7, 14 and 28 day density of concrete
specimens for all targeted recycled lead shot ratios. The figure shows that the density of
concrete mixes decreased as age of specimens increased and increased as recycled lead
shots to cement ratios increased.
2200.0
2250.0
2300.0
2350.0
2400.0
2450.0
2500.0
2550.0
2600.0
2650.0
2700.0
2750.0
2800.0
0 20 40 60 80 100 120 140
Den
sity
Of
Co
ncr
ete
Kg/
m3
Parcentage of recycled lead Shots
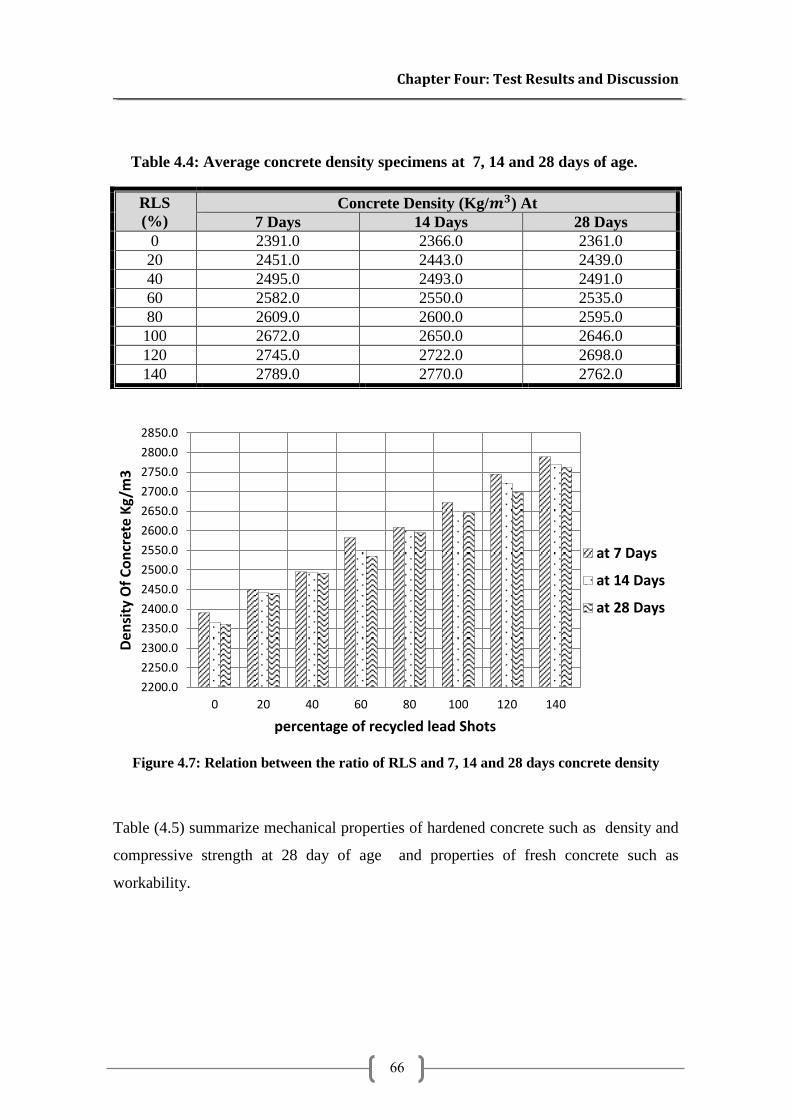
Chapter Four: Test Results and Discussion
66
Table 4.4: Average concrete density specimens at 7, 14 and 28 days of age.
RLS
(%)
Concrete Density (Kg/𝒎𝟑) At
7 Days 14 Days 28 Days
0 2391.0 2366.0 2361.0
20 2451.0 2443.0 2439.0
40 2495.0 2493.0 2491.0
60 2582.0 2550.0 2535.0
80 2609.0 2600.0 2595.0
100 2672.0 2650.0 2646.0
120 2745.0 2722.0 2698.0
140 2789.0 2770.0 2762.0
Figure 4.7: Relation between the ratio of RLS and 7, 14 and 28 days concrete density
Table (4.5) summarize mechanical properties of hardened concrete such as density and
compressive strength at 28 day of age and properties of fresh concrete such as
workability.
2200.0
2250.0
2300.0
2350.0
2400.0
2450.0
2500.0
2550.0
2600.0
2650.0
2700.0
2750.0
2800.0
2850.0
0 20 40 60 80 100 120 140
Den
sity
Of
Co
ncr
ete
Kg/
m3
percentage of recycled lead Shots
at 7 Days
at 14 Days
at 28 Days
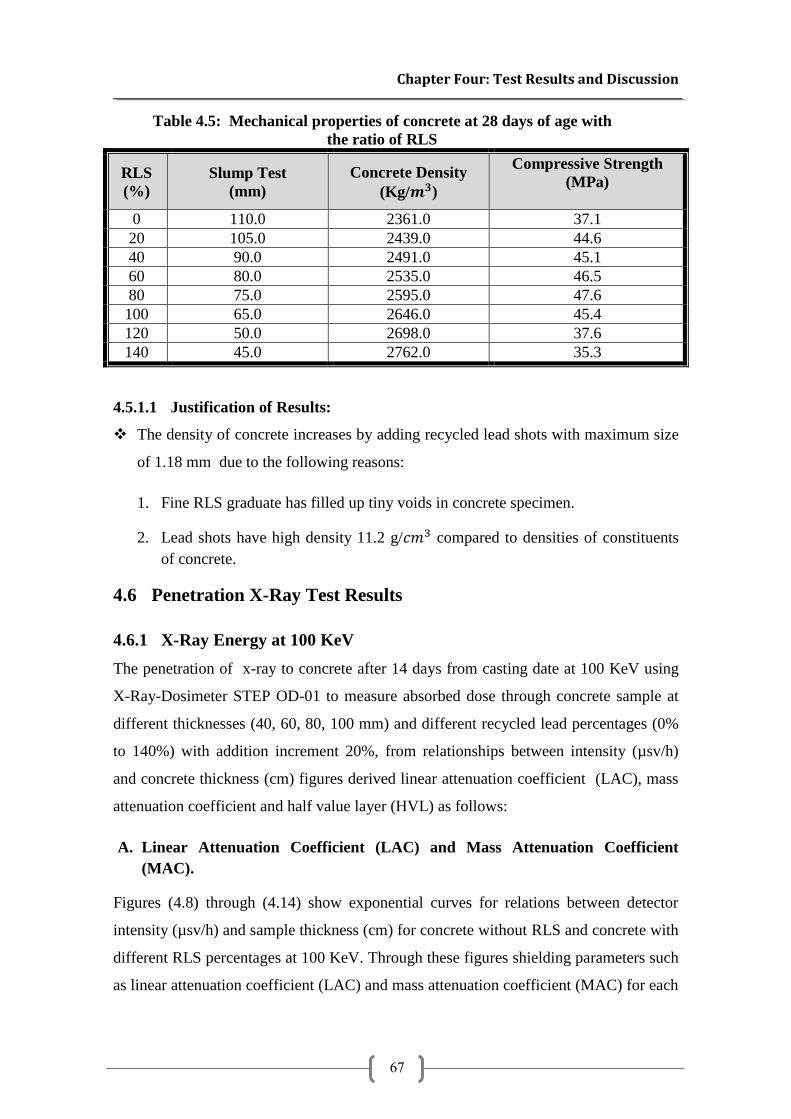
Chapter Four: Test Results and Discussion
67
Table 4.5: Mechanical properties of concrete at 28 days of age with
the ratio of RLS
RLS
(%)
Slump Test
(mm)
Concrete Density
(Kg/𝒎𝟑)
Compressive Strength
(MPa)
0 110.0 2361.0 37.1
20 105.0 2439.0 44.6
40 90.0 2491.0 45.1
60 80.0 2535.0 46.5
80 75.0 2595.0 47.6
100 65.0 2646.0 45.4
120 50.0 2698.0 37.6
140 45.0 2762.0 35.3
4.5.1.1 Justification of Results:
The density of concrete increases by adding recycled lead shots with maximum size
of 1.18 mm due to the following reasons:
1. Fine RLS graduate has filled up tiny voids in concrete specimen.
2. Lead shots have high density 11.2 g/𝑐𝑚3 compared to densities of constituents
of concrete.
4.6 Penetration X-Ray Test Results
4.6.1 X-Ray Energy at 100 KeV
The penetration of x-ray to concrete after 14 days from casting date at 100 KeV using
X-Ray-Dosimeter STEP OD-01 to measure absorbed dose through concrete sample at
different thicknesses (40, 60, 80, 100 mm) and different recycled lead percentages (0%
to 140%) with addition increment 20%, from relationships between intensity (µsv/h)
and concrete thickness (cm) figures derived linear attenuation coefficient (LAC), mass
attenuation coefficient and half value layer (HVL) as follows:
A. Linear Attenuation Coefficient (LAC) and Mass Attenuation Coefficient
(MAC).
Figures (4.8) through (4.14) show exponential curves for relations between detector
intensity (µsv/h) and sample thickness (cm) for concrete without RLS and concrete with
different RLS percentages at 100 KeV. Through these figures shielding parameters such
as linear attenuation coefficient (LAC) and mass attenuation coefficient (MAC) for each
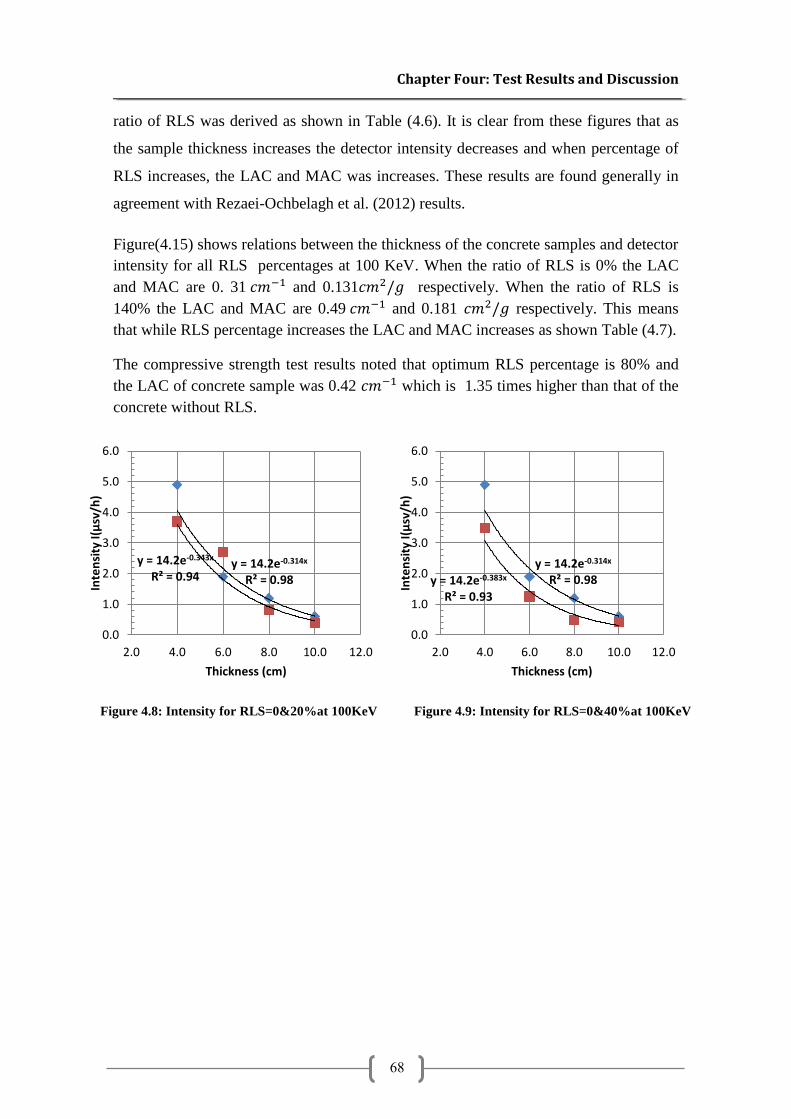
Chapter Four: Test Results and Discussion
68
ratio of RLS was derived as shown in Table (4.6). It is clear from these figures that as
the sample thickness increases the detector intensity decreases and when percentage of
RLS increases, the LAC and MAC was increases. These results are found generally in
agreement with Rezaei-Ochbelagh et al. (2012) results.
Figure(4.15) shows relations between the thickness of the concrete samples and detector
intensity for all RLS percentages at 100 KeV. When the ratio of RLS is 0% the LAC
and MAC are 0. 31 𝑐𝑚−1 and 0.131𝑐𝑚2/𝑔 respectively. When the ratio of RLS is
140% the LAC and MAC are 0.49 𝑐𝑚−1 and 0.181 𝑐𝑚2/𝑔 respectively. This means
that while RLS percentage increases the LAC and MAC increases as shown Table (4.7).
The compressive strength test results noted that optimum RLS percentage is 80% and
the LAC of concrete sample was 0.42 𝑐𝑚−1 which is 1.35 times higher than that of the
concrete without RLS.
Figure 4.8: Intensity for RLS=0&20%at 100KeV Figure 4.9: Intensity for RLS=0&40%at 100KeV
y = 14.2e-0.314x R² = 0.98 y = 14.2e-0.383x
R² = 0.93
0.0
1.0
2.0
3.0
4.0
5.0
6.0
2.0 4.0 6.0 8.0 10.0 12.0
Inte
nsi
ty I(
µsv
/h)
Thickness (cm)
y = 14.2e-0.314x R² = 0.98
y = 14.2e-0.343x R² = 0.94
0.0
1.0
2.0
3.0
4.0
5.0
6.0
2.0 4.0 6.0 8.0 10.0 12.0
Inte
nsi
ty I(
µsv
/h)
Thickness (cm)
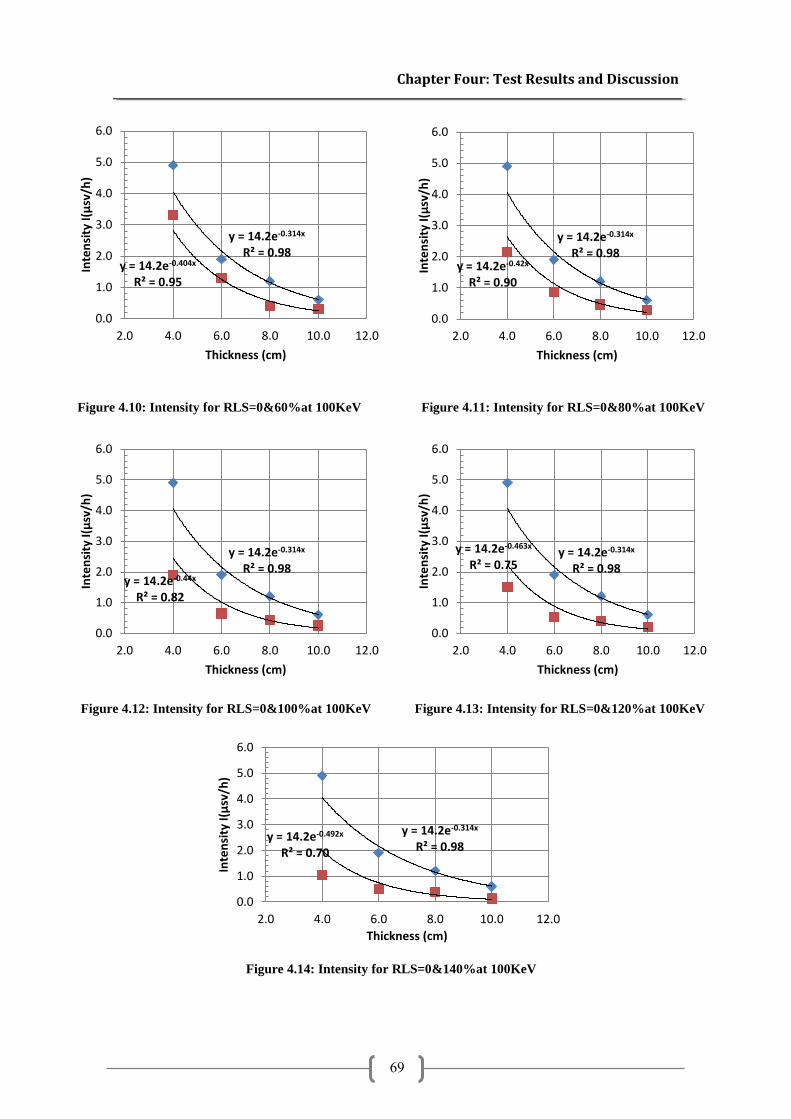
Chapter Four: Test Results and Discussion
69
Figure 4.10: Intensity for RLS=0&60%at 100KeV Figure 4.11: Intensity for RLS=0&80%at 100KeV
Figure 4.12: Intensity for RLS=0&100%at 100KeV Figure 4.13: Intensity for RLS=0&120%at 100KeV
Figure 4.14: Intensity for RLS=0&140%at 100KeV
y = 14.2e-0.314x R² = 0.98
y = 14.2e-0.492x R² = 0.70
0.0
1.0
2.0
3.0
4.0
5.0
6.0
2.0 4.0 6.0 8.0 10.0 12.0
Inte
nsi
ty I(
µsv
/h)
Thickness (cm)
y = 14.2e-0.314x R² = 0.98
y = 14.2e-0.404x R² = 0.95
0.0
1.0
2.0
3.0
4.0
5.0
6.0
2.0 4.0 6.0 8.0 10.0 12.0
Inte
nsi
ty I(
µsv
/h)
Thickness (cm)
y = 14.2e-0.314x R² = 0.98
y = 14.2e-0.42x R² = 0.90
0.0
1.0
2.0
3.0
4.0
5.0
6.0
2.0 4.0 6.0 8.0 10.0 12.0
Inte
nsi
ty I(
µsv
/h)
Thickness (cm)
y = 14.2e-0.314x R² = 0.98
y = 14.2e-0.44x R² = 0.82
0.0
1.0
2.0
3.0
4.0
5.0
6.0
2.0 4.0 6.0 8.0 10.0 12.0
Inte
nsi
ty I(
µsv
/h)
Thickness (cm)
y = 14.2e-0.314x R² = 0.98
y = 14.2e-0.463x R² = 0.75
0.0
1.0
2.0
3.0
4.0
5.0
6.0
2.0 4.0 6.0 8.0 10.0 12.0
Inte
nsi
ty I(
µsv
/h)
Thickness (cm)
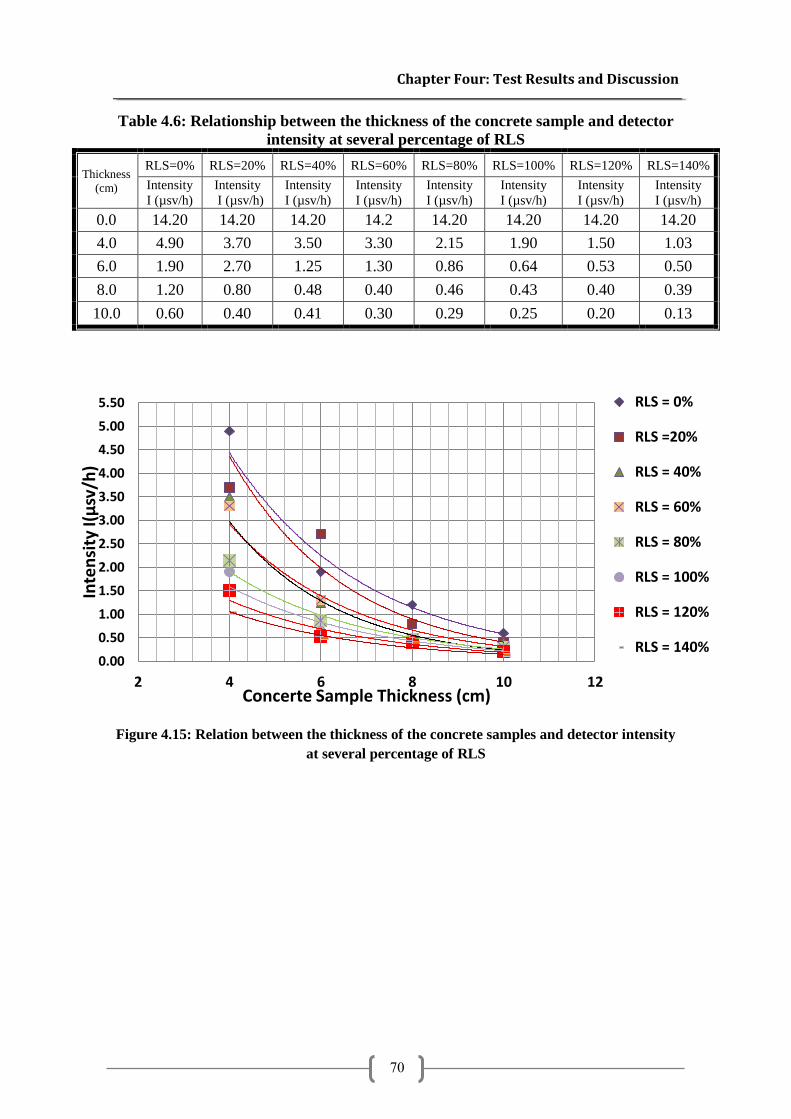
Chapter Four: Test Results and Discussion
70
Table 4.6: Relationship between the thickness of the concrete sample and detector
intensity at several percentage of RLS
Thickness
(cm)
RLS=0% RLS=20% RLS=40% RLS=60% RLS=80% RLS=100% RLS=120% RLS=140%
Intensity
I (µsv/h)
Intensity
I (µsv/h) Intensity
I (µsv/h) Intensity
I (µsv/h) Intensity
I (µsv/h) Intensity
I (µsv/h) Intensity
I (µsv/h) Intensity
I (µsv/h)
0.0 14.20 14.20 14.20 14.2 14.20 14.20 14.20 14.20
4.0 4.90 3.70 3.50 3.30 2.15 1.90 1.50 1.03
6.0 1.90 2.70 1.25 1.30 0.86 0.64 0.53 0.50
8.0 1.20 0.80 0.48 0.40 0.46 0.43 0.40 0.39
10.0 0.60 0.40 0.41 0.30 0.29 0.25 0.20 0.13
Figure 4.15: Relation between the thickness of the concrete samples and detector intensity
at several percentage of RLS
0.00
0.50
1.00
1.50
2.00
2.50
3.00
3.50
4.00
4.50
5.00
5.50
2 4 6 8 10 12
Inte
nsi
ty I(
µsv
/h)
Concerte Sample Thickness (cm)
RLS = 0%
RLS =20%
RLS = 40%
RLS = 60%
RLS = 80%
RLS = 100%
RLS = 120%
RLS = 140%
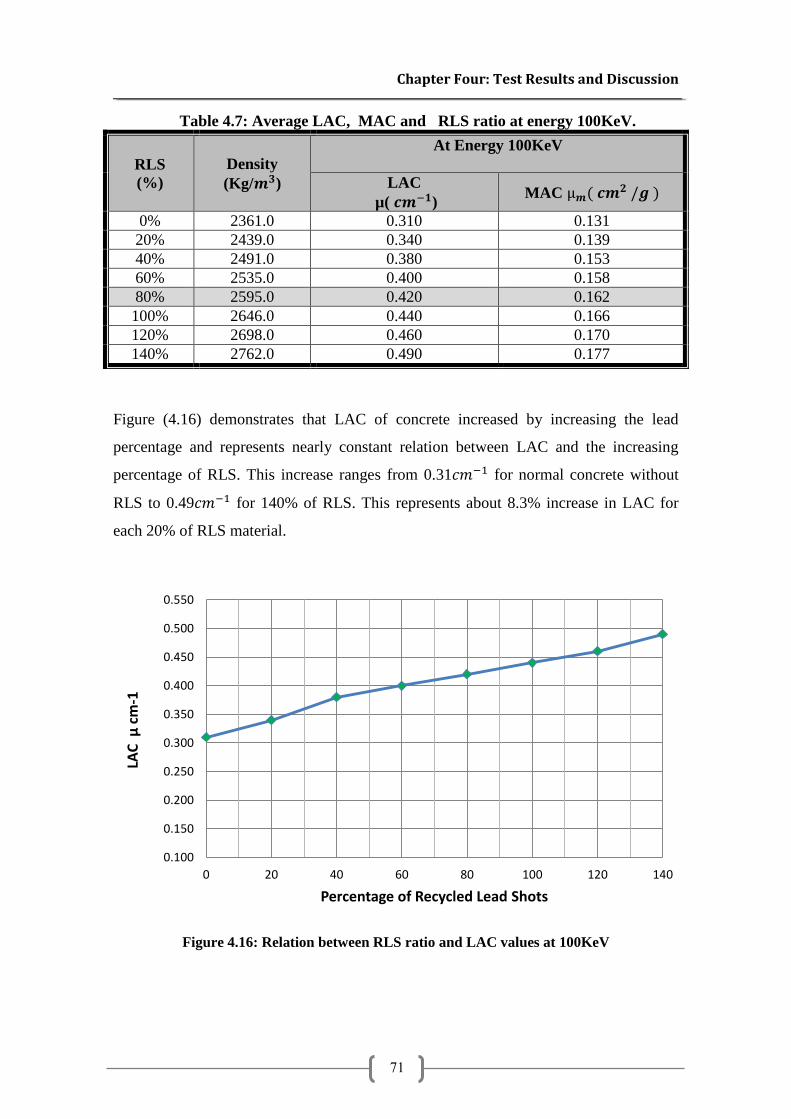
Chapter Four: Test Results and Discussion
71
Table 4.7: Average LAC, MAC and RLS ratio at energy 100KeV.
RLS
(%)
Density
(Kg/𝒎𝟑)
At Energy 100KeV
LAC
µ( 𝒄𝒎−𝟏) MAC µ𝒎( 𝒄𝒎𝟐 /𝒈 )
0% 2361.0 0.310 0.131
20% 2439.0 0.340 0.139
40% 2491.0 0.380 0.153
60% 2535.0 0.400 0.158
80% 2595.0 0.420 0.162
100% 2646.0 0.440 0.166
120% 2698.0 0.460 0.170
140% 2762.0 0.490 0.177
Figure (4.16) demonstrates that LAC of concrete increased by increasing the lead
percentage and represents nearly constant relation between LAC and the increasing
percentage of RLS. This increase ranges from 0.31𝑐𝑚−1 for normal concrete without
RLS to 0.49𝑐𝑚−1 for 140% of RLS. This represents about 8.3% increase in LAC for
each 20% of RLS material.
Figure 4.16: Relation between RLS ratio and LAC values at 100KeV
0.100
0.150
0.200
0.250
0.300
0.350
0.400
0.450
0.500
0.550
0 20 40 60 80 100 120 140
LAC
µ c
m-1
Percentage of Recycled Lead Shots
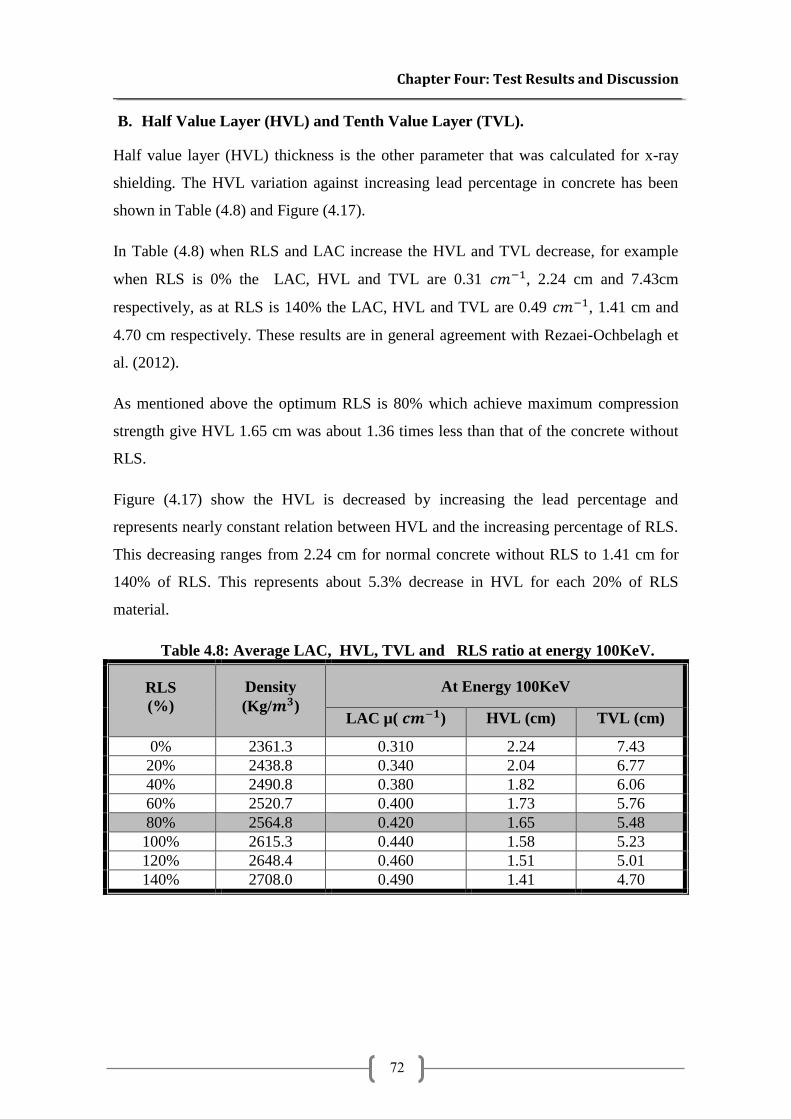
Chapter Four: Test Results and Discussion
72
B. Half Value Layer (HVL) and Tenth Value Layer (TVL).
Half value layer (HVL) thickness is the other parameter that was calculated for x-ray
shielding. The HVL variation against increasing lead percentage in concrete has been
shown in Table (4.8) and Figure (4.17).
In Table (4.8) when RLS and LAC increase the HVL and TVL decrease, for example
when RLS is 0% the LAC, HVL and TVL are 0.31 𝑐𝑚−1, 2.24 cm and 7.43cm
respectively, as at RLS is 140% the LAC, HVL and TVL are 0.49 𝑐𝑚−1, 1.41 cm and
4.70 cm respectively. These results are in general agreement with Rezaei-Ochbelagh et
al. (2012).
As mentioned above the optimum RLS is 80% which achieve maximum compression
strength give HVL 1.65 cm was about 1.36 times less than that of the concrete without
RLS.
Figure (4.17) show the HVL is decreased by increasing the lead percentage and
represents nearly constant relation between HVL and the increasing percentage of RLS.
This decreasing ranges from 2.24 cm for normal concrete without RLS to 1.41 cm for
140% of RLS. This represents about 5.3% decrease in HVL for each 20% of RLS
material.
Table 4.8: Average LAC, HVL, TVL and RLS ratio at energy 100KeV.
RLS
(%)
Density
(Kg/𝒎𝟑)
At Energy 100KeV
LAC µ( 𝒄𝒎−𝟏) HVL (cm) TVL (cm)
0% 2361.3 0.310 2.24 7.43
20% 2438.8 0.340 2.04 6.77
40% 2490.8 0.380 1.82 6.06
60% 2520.7 0.400 1.73 5.76
80% 2564.8 0.420 1.65 5.48
100% 2615.3 0.440 1.58 5.23
120% 2648.4 0.460 1.51 5.01
140% 2708.0 0.490 1.41 4.70
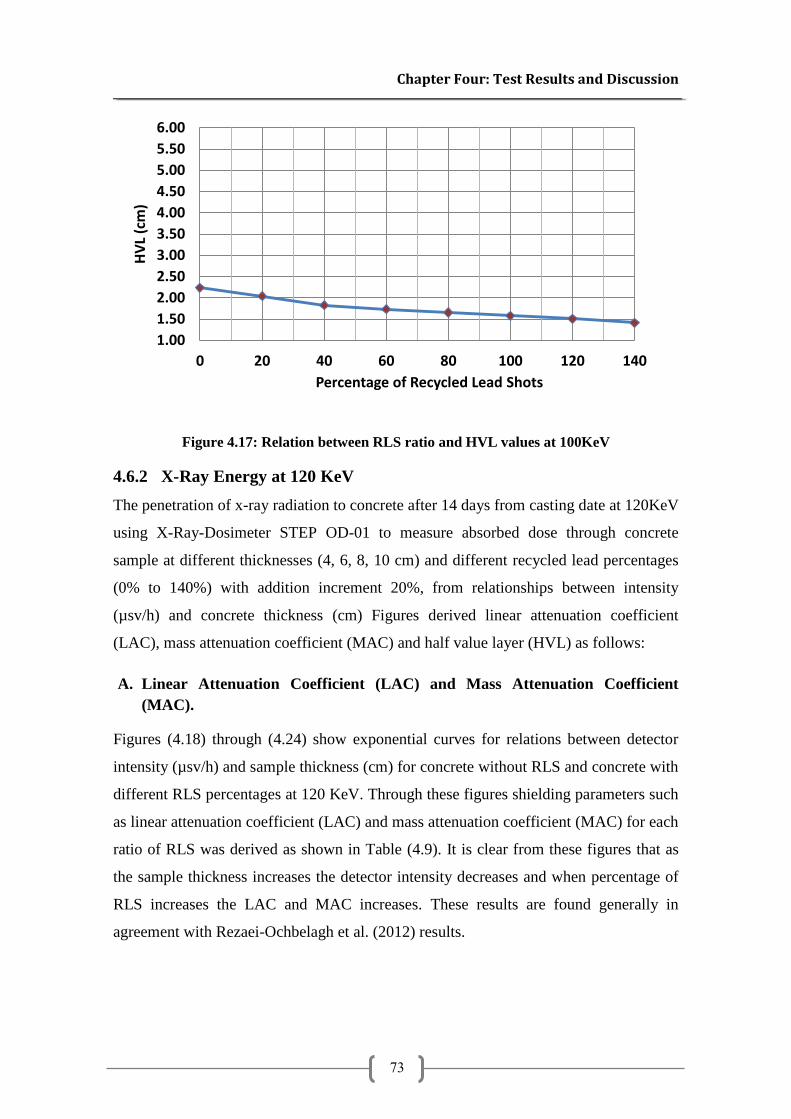
Chapter Four: Test Results and Discussion
73
Figure 4.17: Relation between RLS ratio and HVL values at 100KeV
4.6.2 X-Ray Energy at 120 KeV
The penetration of x-ray radiation to concrete after 14 days from casting date at 120KeV
using X-Ray-Dosimeter STEP OD-01 to measure absorbed dose through concrete
sample at different thicknesses (4, 6, 8, 10 cm) and different recycled lead percentages
(0% to 140%) with addition increment 20%, from relationships between intensity
(µsv/h) and concrete thickness (cm) Figures derived linear attenuation coefficient
(LAC), mass attenuation coefficient (MAC) and half value layer (HVL) as follows:
A. Linear Attenuation Coefficient (LAC) and Mass Attenuation Coefficient
(MAC).
Figures (4.18) through (4.24) show exponential curves for relations between detector
intensity (µsv/h) and sample thickness (cm) for concrete without RLS and concrete with
different RLS percentages at 120 KeV. Through these figures shielding parameters such
as linear attenuation coefficient (LAC) and mass attenuation coefficient (MAC) for each
ratio of RLS was derived as shown in Table (4.9). It is clear from these figures that as
the sample thickness increases the detector intensity decreases and when percentage of
RLS increases the LAC and MAC increases. These results are found generally in
agreement with Rezaei-Ochbelagh et al. (2012) results.
1.00
1.50
2.00
2.50
3.00
3.50
4.00
4.50
5.00
5.50
6.00
0 20 40 60 80 100 120 140
HV
L (c
m)
Percentage of Recycled Lead Shots
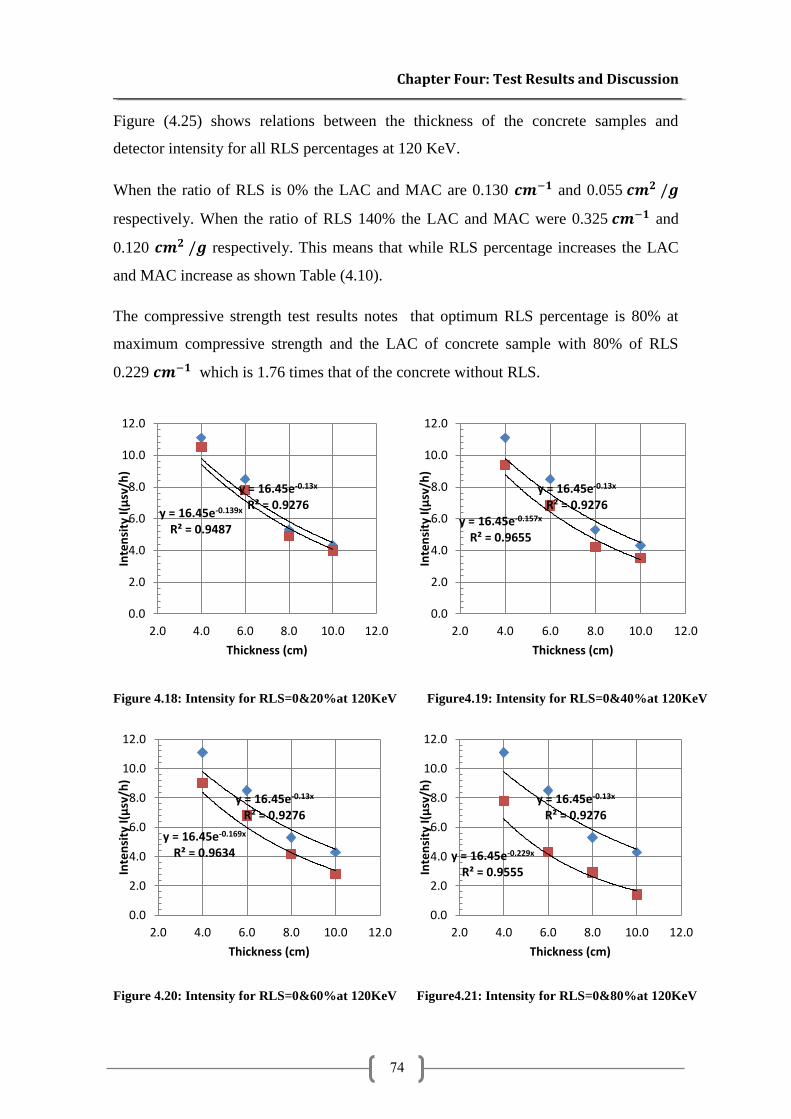
Chapter Four: Test Results and Discussion
74
Figure (4.25) shows relations between the thickness of the concrete samples and
detector intensity for all RLS percentages at 120 KeV.
When the ratio of RLS is 0% the LAC and MAC are 0.130 𝒄𝒎−𝟏 and 0.055 𝒄𝒎𝟐 /𝒈
respectively. When the ratio of RLS 140% the LAC and MAC were 0.325 𝒄𝒎−𝟏 and
0.120 𝒄𝒎𝟐 /𝒈 respectively. This means that while RLS percentage increases the LAC
and MAC increase as shown Table (4.10).
The compressive strength test results notes that optimum RLS percentage is 80% at
maximum compressive strength and the LAC of concrete sample with 80% of RLS
0.229 𝒄𝒎−𝟏 which is 1.76 times that of the concrete without RLS.
Figure 4.18: Intensity for RLS=0&20%at 120KeV Figure4.19: Intensity for RLS=0&40%at 120KeV
Figure 4.20: Intensity for RLS=0&60%at 120KeV Figure4.21: Intensity for RLS=0&80%at 120KeV
y = 16.45e-0.13x R² = 0.9276
y = 16.45e-0.139x R² = 0.9487
0.0
2.0
4.0
6.0
8.0
10.0
12.0
2.0 4.0 6.0 8.0 10.0 12.0
Inte
nsi
ty I(
µsv
/h)
Thickness (cm)
y = 16.45e-0.13x R² = 0.9276
y = 16.45e-0.157x R² = 0.9655
0.0
2.0
4.0
6.0
8.0
10.0
12.0
2.0 4.0 6.0 8.0 10.0 12.0
Inte
nsi
ty I(
µsv
/h)
Thickness (cm)
y = 16.45e-0.13x R² = 0.9276
y = 16.45e-0.169x R² = 0.9634
0.0
2.0
4.0
6.0
8.0
10.0
12.0
2.0 4.0 6.0 8.0 10.0 12.0
Inte
nsi
ty I(
µsv
/h)
Thickness (cm)
y = 16.45e-0.13x R² = 0.9276
y = 16.45e-0.229x R² = 0.9555
0.0
2.0
4.0
6.0
8.0
10.0
12.0
2.0 4.0 6.0 8.0 10.0 12.0
Inte
nsi
ty I(
µsv
/h)
Thickness (cm)
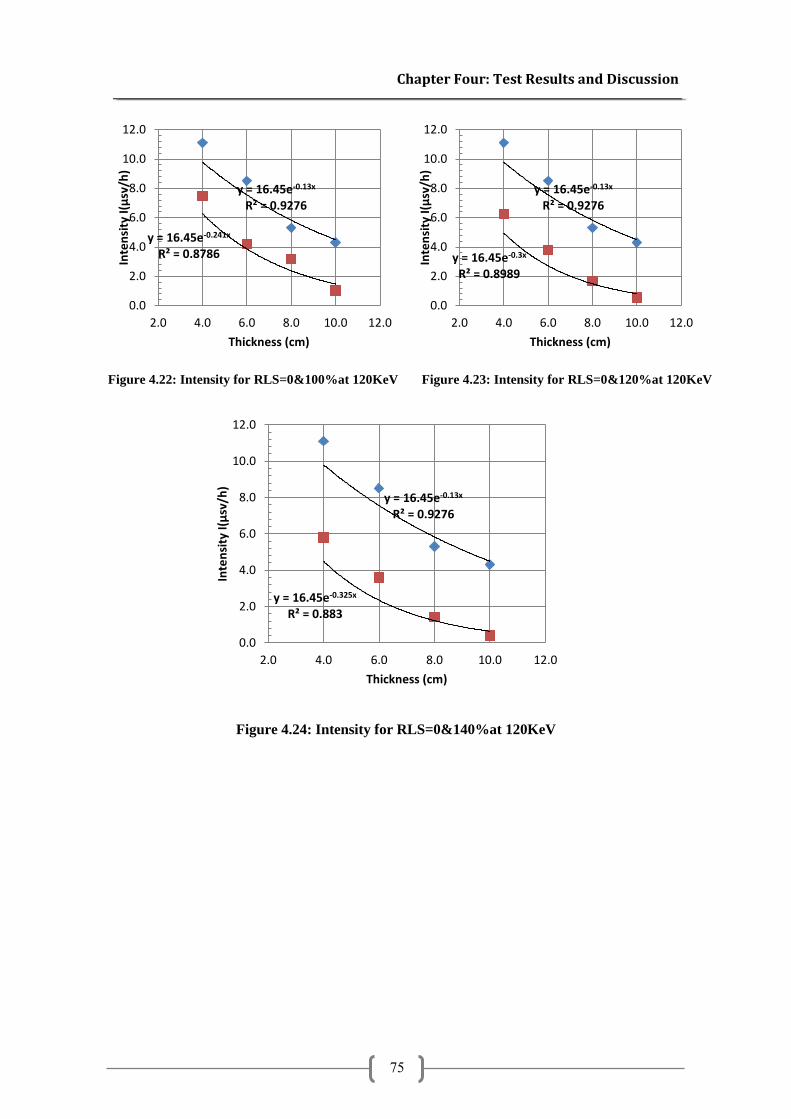
Chapter Four: Test Results and Discussion
75
Figure 4.22: Intensity for RLS=0&100%at 120KeV Figure 4.23: Intensity for RLS=0&120%at 120KeV
Figure 4.24: Intensity for RLS=0&140%at 120KeV
y = 16.45e-0.13x R² = 0.9276
y = 16.45e-0.325x R² = 0.883
0.0
2.0
4.0
6.0
8.0
10.0
12.0
2.0 4.0 6.0 8.0 10.0 12.0
Inte
nsi
ty I(
µsv
/h)
Thickness (cm)
y = 16.45e-0.13x R² = 0.9276
y = 16.45e-0.241x R² = 0.8786
0.0
2.0
4.0
6.0
8.0
10.0
12.0
2.0 4.0 6.0 8.0 10.0 12.0
Inte
nsi
ty I(
µsv
/h)
Thickness (cm)
y = 16.45e-0.13x R² = 0.9276
y = 16.45e-0.3x R² = 0.8989
0.0
2.0
4.0
6.0
8.0
10.0
12.0
2.0 4.0 6.0 8.0 10.0 12.0
Inte
nsi
ty I(
µsv
/h)
Thickness (cm)
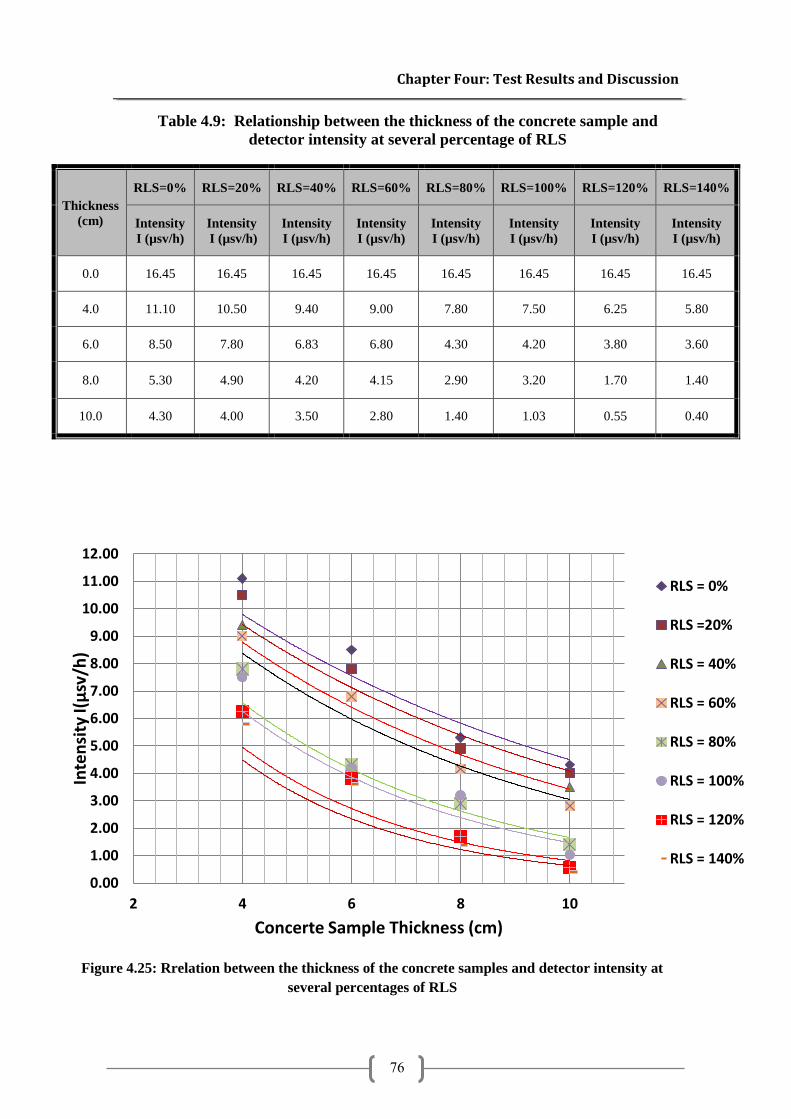
Chapter Four: Test Results and Discussion
76
Table 4.9: Relationship between the thickness of the concrete sample and
detector intensity at several percentage of RLS
Thickness
(cm)
RLS=0% RLS=20% RLS=40% RLS=60% RLS=80% RLS=100% RLS=120% RLS=140%
Intensity
I (µsv/h)
Intensity
I (µsv/h) Intensity
I (µsv/h) Intensity
I (µsv/h) Intensity
I (µsv/h) Intensity
I (µsv/h) Intensity
I (µsv/h) Intensity
I (µsv/h)
0.0 16.45 16.45 16.45 16.45 16.45 16.45 16.45 16.45
4.0 11.10 10.50 9.40 9.00 7.80 7.50 6.25 5.80
6.0 8.50 7.80 6.83 6.80 4.30 4.20 3.80 3.60
8.0 5.30 4.90 4.20 4.15 2.90 3.20 1.70 1.40
10.0 4.30 4.00 3.50 2.80 1.40 1.03 0.55 0.40
Figure 4.25: Rrelation between the thickness of the concrete samples and detector intensity at
several percentages of RLS
0.00
1.00
2.00
3.00
4.00
5.00
6.00
7.00
8.00
9.00
10.00
11.00
12.00
2 4 6 8 10
Inte
nsi
ty I(
µsv
/h)
Concerte Sample Thickness (cm)
RLS = 0%
RLS =20%
RLS = 40%
RLS = 60%
RLS = 80%
RLS = 100%
RLS = 120%
RLS = 140%
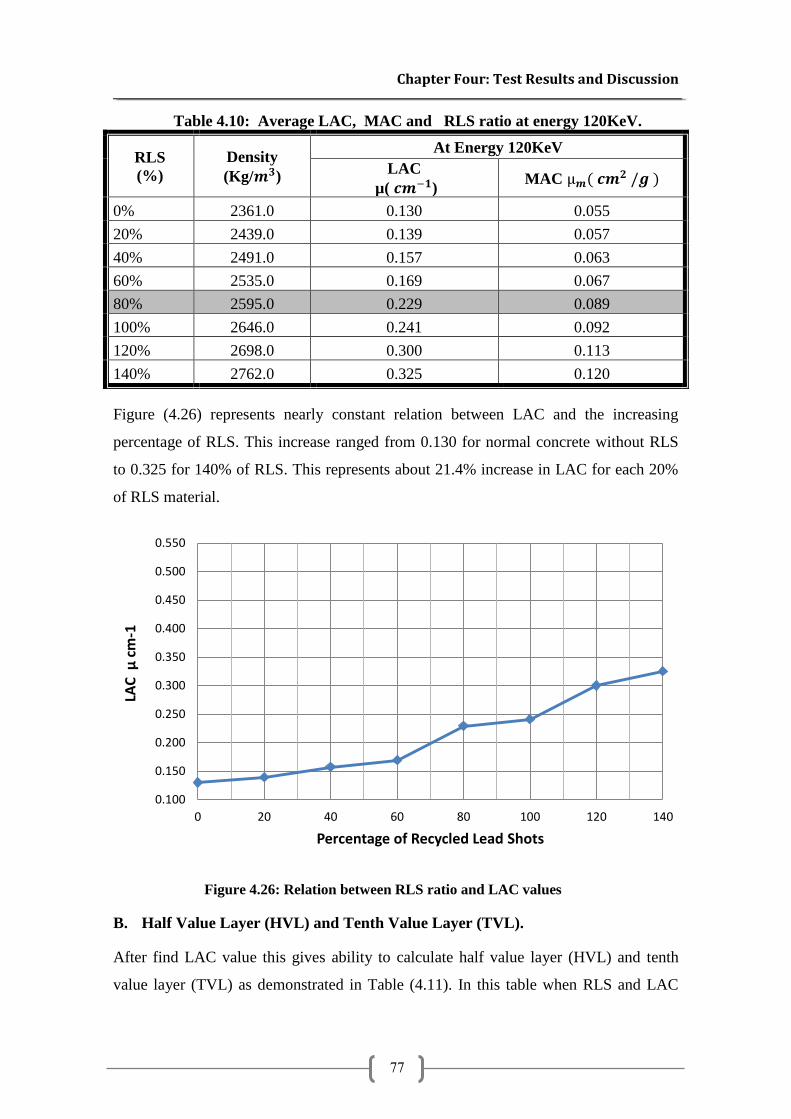
Chapter Four: Test Results and Discussion
77
Table 4.10: Average LAC, MAC and RLS ratio at energy 120KeV.
RLS
(%)
Density
(Kg/𝒎𝟑)
At Energy 120KeV
LAC
µ( 𝒄𝒎−𝟏) MAC µ𝒎( 𝒄𝒎𝟐 /𝒈 )
0% 2361.0 0.130 0.055
20% 2439.0 0.139 0.057
40% 2491.0 0.157 0.063
60% 2535.0 0.169 0.067
80% 2595.0 0.229 0.089
100% 2646.0 0.241 0.092
120% 2698.0 0.300 0.113
140% 2762.0 0.325 0.120
Figure (4.26) represents nearly constant relation between LAC and the increasing
percentage of RLS. This increase ranged from 0.130 for normal concrete without RLS
to 0.325 for 140% of RLS. This represents about 21.4% increase in LAC for each 20%
of RLS material.
Figure 4.26: Relation between RLS ratio and LAC values
B. Half Value Layer (HVL) and Tenth Value Layer (TVL).
After find LAC value this gives ability to calculate half value layer (HVL) and tenth
value layer (TVL) as demonstrated in Table (4.11). In this table when RLS and LAC
0.100
0.150
0.200
0.250
0.300
0.350
0.400
0.450
0.500
0.550
0 20 40 60 80 100 120 140
LAC
µ c
m-1
Percentage of Recycled Lead Shots
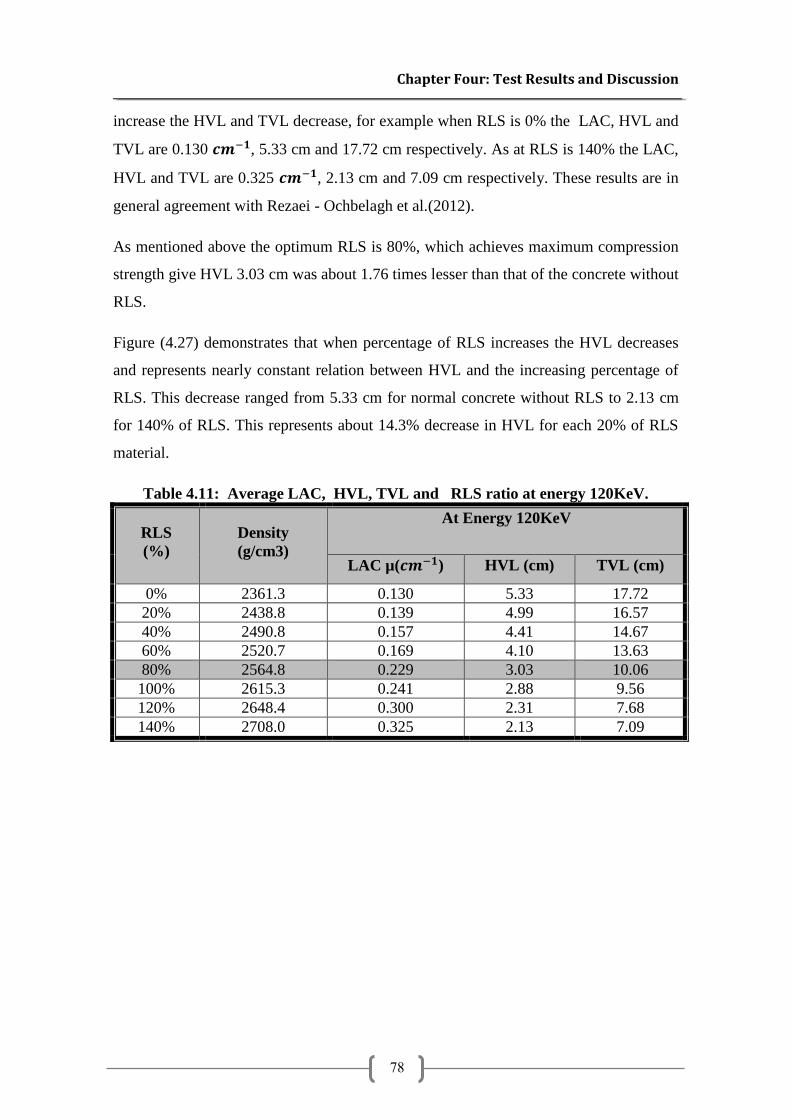
Chapter Four: Test Results and Discussion
78
increase the HVL and TVL decrease, for example when RLS is 0% the LAC, HVL and
TVL are 0.130 𝒄𝒎−𝟏, 5.33 cm and 17.72 cm respectively. As at RLS is 140% the LAC,
HVL and TVL are 0.325 𝒄𝒎−𝟏, 2.13 cm and 7.09 cm respectively. These results are in
general agreement with Rezaei - Ochbelagh et al.(2012).
As mentioned above the optimum RLS is 80%, which achieves maximum compression
strength give HVL 3.03 cm was about 1.76 times lesser than that of the concrete without
RLS.
Figure (4.27) demonstrates that when percentage of RLS increases the HVL decreases
and represents nearly constant relation between HVL and the increasing percentage of
RLS. This decrease ranged from 5.33 cm for normal concrete without RLS to 2.13 cm
for 140% of RLS. This represents about 14.3% decrease in HVL for each 20% of RLS
material.
Table 4.11: Average LAC, HVL, TVL and RLS ratio at energy 120KeV.
RLS
(%)
Density
(g/cm3)
At Energy 120KeV
LAC µ(𝒄𝒎−𝟏) HVL (cm) TVL (cm)
0% 2361.3 0.130 5.33 17.72
20% 2438.8 0.139 4.99 16.57
40% 2490.8 0.157 4.41 14.67
60% 2520.7 0.169 4.10 13.63
80% 2564.8 0.229 3.03 10.06
100% 2615.3 0.241 2.88 9.56
120% 2648.4 0.300 2.31 7.68
140% 2708.0 0.325 2.13 7.09
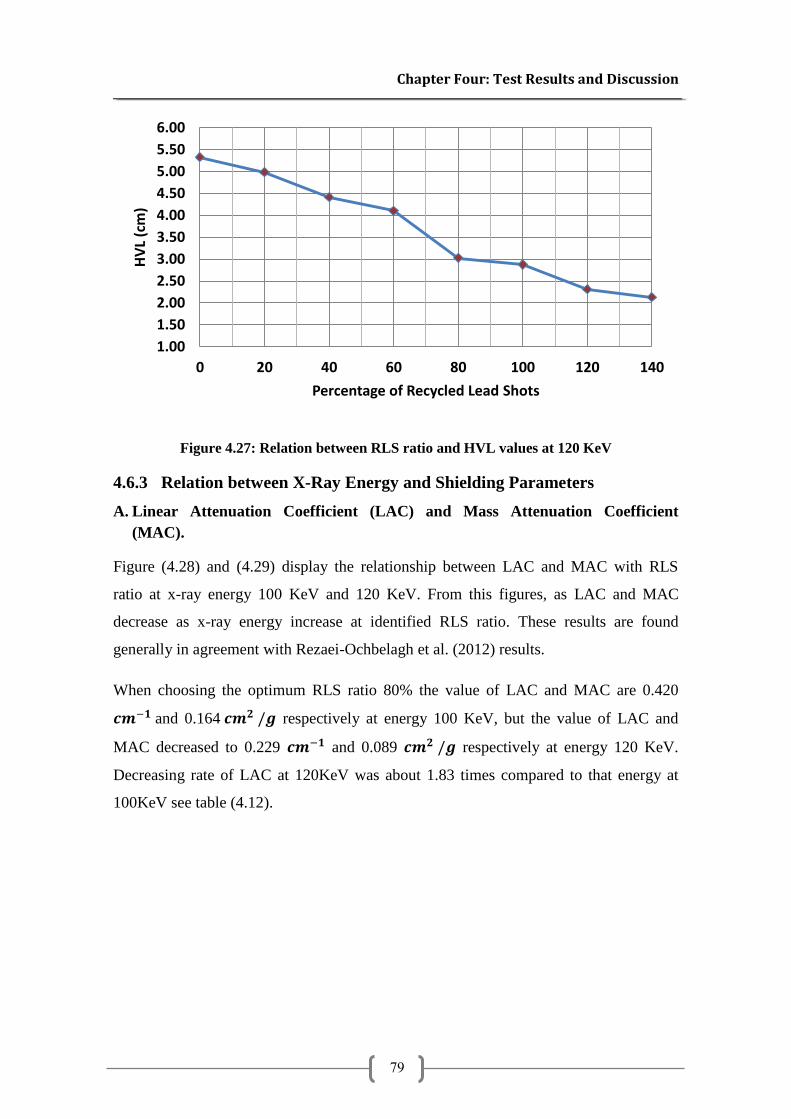
Chapter Four: Test Results and Discussion
79
Figure 4.27: Relation between RLS ratio and HVL values at 120 KeV
4.6.3 Relation between X-Ray Energy and Shielding Parameters
A. Linear Attenuation Coefficient (LAC) and Mass Attenuation Coefficient
(MAC).
Figure (4.28) and (4.29) display the relationship between LAC and MAC with RLS
ratio at x-ray energy 100 KeV and 120 KeV. From this figures, as LAC and MAC
decrease as x-ray energy increase at identified RLS ratio. These results are found
generally in agreement with Rezaei-Ochbelagh et al. (2012) results.
When choosing the optimum RLS ratio 80% the value of LAC and MAC are 0.420
𝒄𝒎−𝟏 and 0.164 𝒄𝒎𝟐 /𝒈 respectively at energy 100 KeV, but the value of LAC and
MAC decreased to 0.229 𝒄𝒎−𝟏 and 0.089 𝒄𝒎𝟐 /𝒈 respectively at energy 120 KeV.
Decreasing rate of LAC at 120KeV was about 1.83 times compared to that energy at
100KeV see table (4.12).
1.00
1.50
2.00
2.50
3.00
3.50
4.00
4.50
5.00
5.50
6.00
0 20 40 60 80 100 120 140
HV
L (c
m)
Percentage of Recycled Lead Shots
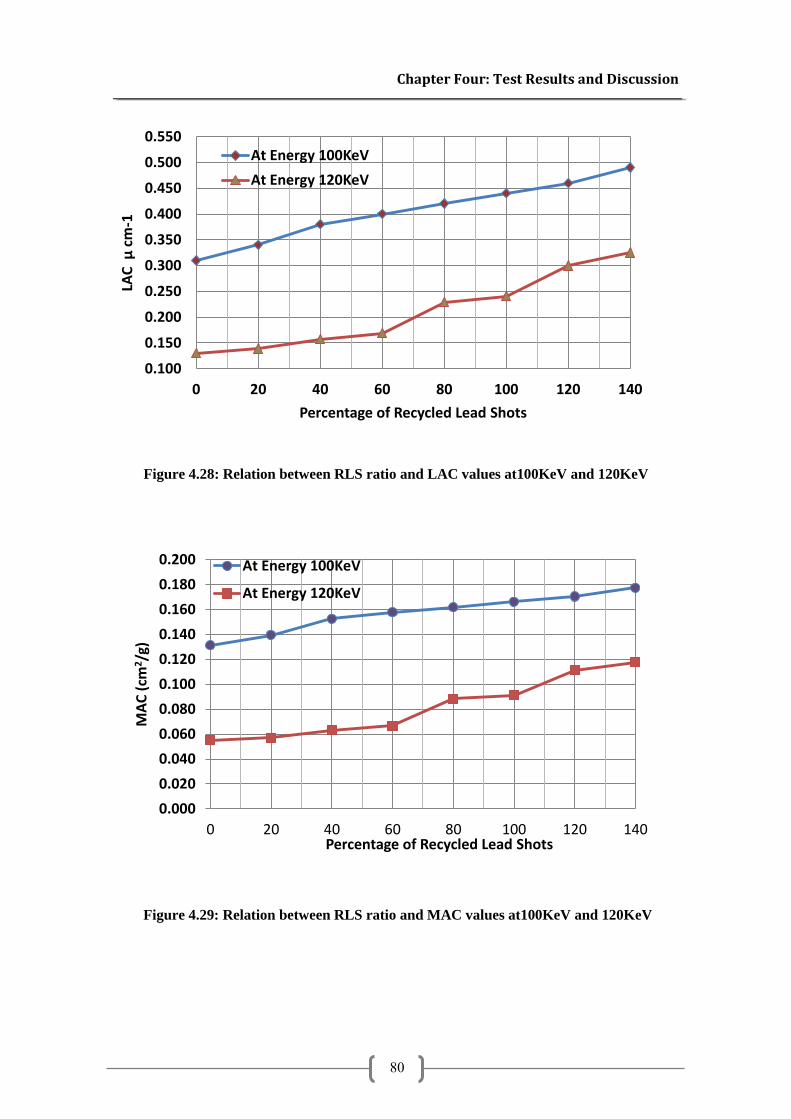
Chapter Four: Test Results and Discussion
80
Figure 4.28: Relation between RLS ratio and LAC values at100KeV and 120KeV
Figure 4.29: Relation between RLS ratio and MAC values at100KeV and 120KeV
0.100
0.150
0.200
0.250
0.300
0.350
0.400
0.450
0.500
0.550
0 20 40 60 80 100 120 140
LAC
µ c
m-1
Percentage of Recycled Lead Shots
At Energy 100KeV
At Energy 120KeV
0.000
0.020
0.040
0.060
0.080
0.100
0.120
0.140
0.160
0.180
0.200
0 20 40 60 80 100 120 140
MA
C (
cm2/g
)
Percentage of Recycled Lead Shots
At Energy 100KeV
At Energy 120KeV
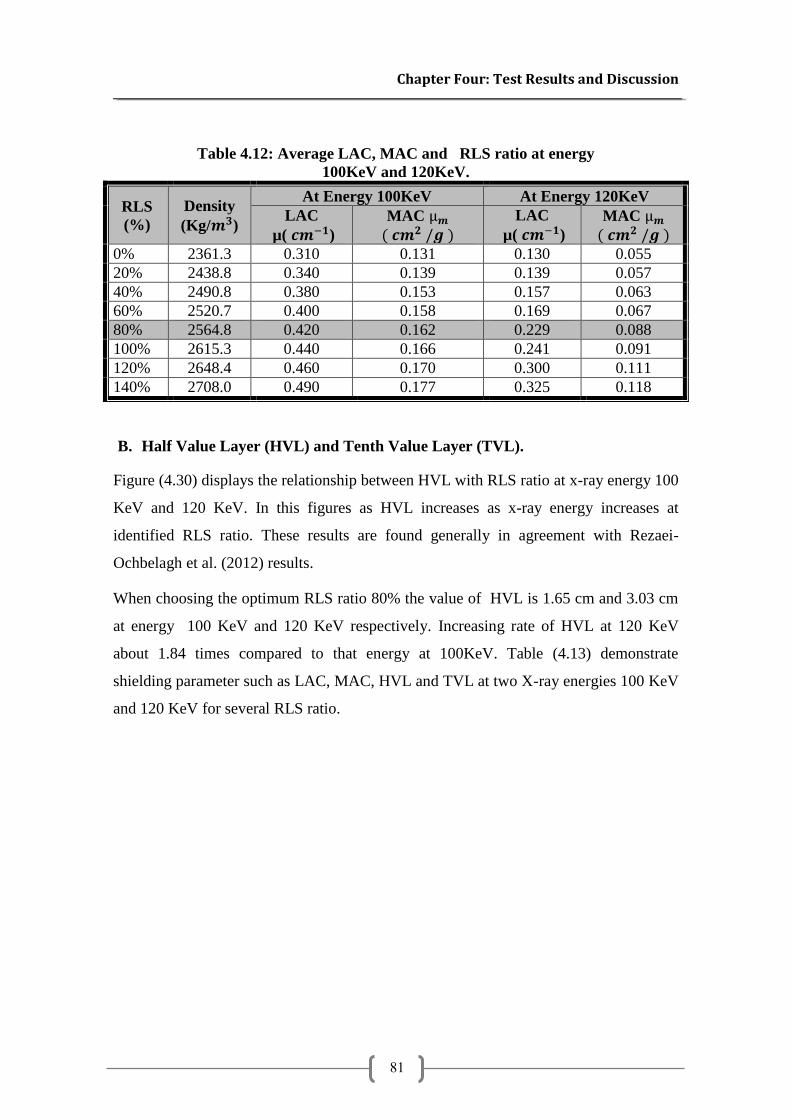
Chapter Four: Test Results and Discussion
81
Table 4.12: Average LAC, MAC and RLS ratio at energy
100KeV and 120KeV.
RLS
(%)
Density
(Kg/𝒎𝟑)
At Energy 100KeV At Energy 120KeV
LAC
µ( 𝒄𝒎−𝟏)
MAC µ𝒎 ( 𝒄𝒎𝟐 /𝒈 )
LAC
µ( 𝒄𝒎−𝟏)
MAC µ𝒎 ( 𝒄𝒎𝟐 /𝒈 )
0% 2361.3 0.310 0.131 0.130 0.055
20% 2438.8 0.340 0.139 0.139 0.057
40% 2490.8 0.380 0.153 0.157 0.063
60% 2520.7 0.400 0.158 0.169 0.067
80% 2564.8 0.420 0.162 0.229 0.088
100% 2615.3 0.440 0.166 0.241 0.091
120% 2648.4 0.460 0.170 0.300 0.111
140% 2708.0 0.490 0.177 0.325 0.118
B. Half Value Layer (HVL) and Tenth Value Layer (TVL).
Figure (4.30) displays the relationship between HVL with RLS ratio at x-ray energy 100
KeV and 120 KeV. In this figures as HVL increases as x-ray energy increases at
identified RLS ratio. These results are found generally in agreement with Rezaei-
Ochbelagh et al. (2012) results.
When choosing the optimum RLS ratio 80% the value of HVL is 1.65 cm and 3.03 cm
at energy 100 KeV and 120 KeV respectively. Increasing rate of HVL at 120 KeV
about 1.84 times compared to that energy at 100KeV. Table (4.13) demonstrate
shielding parameter such as LAC, MAC, HVL and TVL at two X-ray energies 100 KeV
and 120 KeV for several RLS ratio.
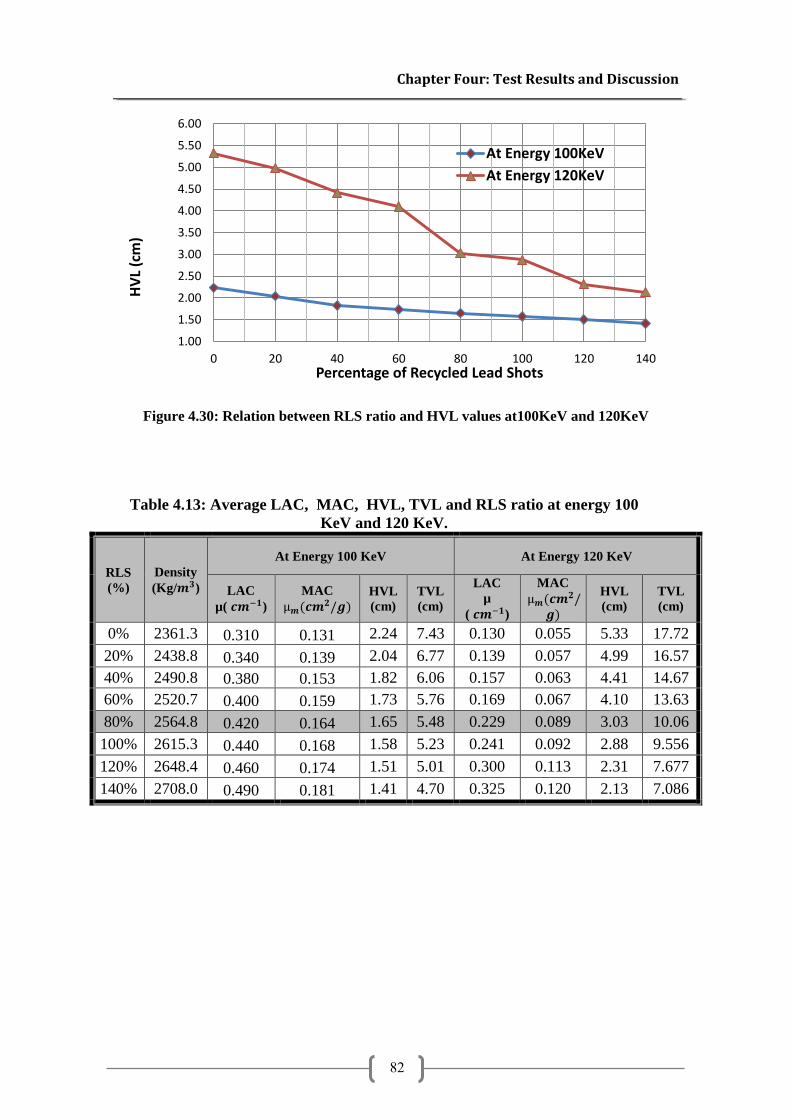
Chapter Four: Test Results and Discussion
82
Figure 4.30: Relation between RLS ratio and HVL values at100KeV and 120KeV
Table 4.13: Average LAC, MAC, HVL, TVL and RLS ratio at energy 100
KeV and 120 KeV.
RLS
(%)
Density
(Kg/𝒎𝟑)
At Energy 100 KeV At Energy 120 KeV
LAC
µ( 𝒄𝒎−𝟏)
MAC
µ𝒎(𝒄𝒎𝟐/𝒈)
HVL
(cm)
TVL
(cm)
LAC
µ
( 𝒄𝒎−𝟏)
MAC
µ𝒎(𝒄𝒎𝟐/𝒈)
HVL
(cm)
TVL
(cm)
0% 2361.3 0.310 0.131 2.24 7.43 0.130 0.055 5.33 17.72
20% 2438.8 0.340 0.139 2.04 6.77 0.139 0.057 4.99 16.57
40% 2490.8 0.380 0.153 1.82 6.06 0.157 0.063 4.41 14.67
60% 2520.7 0.400 0.159 1.73 5.76 0.169 0.067 4.10 13.63
80% 2564.8 0.420 0.164 1.65 5.48 0.229 0.089 3.03 10.06
100% 2615.3 0.440 0.168 1.58 5.23 0.241 0.092 2.88 9.556
120% 2648.4 0.460 0.174 1.51 5.01 0.300 0.113 2.31 7.677
140% 2708.0 0.490 0.181 1.41 4.70 0.325 0.120 2.13 7.086
1.00
1.50
2.00
2.50
3.00
3.50
4.00
4.50
5.00
5.50
6.00
0 20 40 60 80 100 120 140
HV
L (c
m)
Percentage of Recycled Lead Shots
At Energy 100KeV
At Energy 120KeV

Chapter Five: Conclusions & Recommendations
83
Chapter Five:
Conclusions &
Recommendations
Chapter Five: Conclusions & Recommendations
5.1 Introduction
5.2 Conclusions
5.3 Recommendations for Further Studies
Chapter Five: Conclusions & Recommendations
84
5 Chapter Five: Conclusions & Recommendations
5.1 Introduction:
This research investigates the effect of recycled lead shots (RLS) on the mechanical and
shielding properties of fresh and hardened concrete. This investigation made by adding
seven different percentages of RLS material to normal concrete. The mechanical
property of fresh concrete made by conducting slump test for every mix “8 mixes”. The
primary mechanical property of hardened concrete “compressive strength” made by
crushing 4 cubic molds for investigation compressive strength for every age (7, 14 and
28 days) and ability of concrete sample to absorb dose was measured. Then the
optimum ratio of RLS to enhance the shielding and the compressive strength can be
defined.
Based on the limited experimental work carried out in this particular study, the
following conclusions may be drawn out.
Recommendations for future work also presented in this chapter that may be taken in
consideration.
5.2 Conclusions:
The result of this research showed that adding recycled lead in shots form with
maximum size 1.18 mm can enhance the mechanical property of hardened concrete as
compressive strength and shielding properties, with different percent of enhancing. The
used RLS is considered a low cost material and disposed from danger substance has
negative effects on human health and environment. The next concluding remarks were
based on the obtained experimental observation:
1. Density of normal concrete without RLS was 2361.3 Kg/𝑚3, after adding 140% of
RLS the density of concrete increased to 2762.0 Kg/𝑚3. This means that adding
140% of RLS increases concrete density to about 17.0%.
Chapter Five: Conclusions & Recommendations
85
2. The workability of concrete decreases as RLS ratio increases. This decrease ranged
from 110 mm for normal concrete without RLS to 45 mm for 140% of RLS by
about 8.4% decreases for each 20% of RLS material.
3. The compressive strength increased from 37.06 MPa at 0% of RLS to 47.57 MPa at
80% of RLS. After that, when the RLS to cement ratio was increased from 80% to
140% concrete compressive strength decreased from 47.57 MPa at 80% of RLS to
35.33 MPa at 140% of RLS.
4. The optimum percentage of RLS to be used in improving X-Ray radiation resistance
concrete used in Radio-Diagnostic centers is about 80% of the cement weight. The
measured half value layer (HVL) thickness of 80% RL concrete samples for x- rays
(100 and 120 KeV) was much less than that of ordinary concrete (1.65 and 3.03 cm
compared to 2.24 and 5.33 cm). Furthermore, 80% RL concrete samples had a
significantly higher compressive strength (47.57 MPa compared to 37.06 MPa) and
the slump value was 75mm with true shape and without segregation.
5. While the thickness of the concrete sample increased, absorbed dose through
concrete sample increased by exponential curve relation .
6. Proportional relation between linear attenuation coefficient(LAC), mass attenuation
coefficient (MAC) and percentage of RLS. As percentage of RLS increased from
0% to 140% LAC and MAC was increased from 0.310 𝒄𝒎−𝟏 and 0.131 𝒄𝒎𝟐/𝒈 to
0.490 𝒄𝒎−𝟏 and 0.181 𝒄𝒎𝟐/𝒈 respectively at 100 KeV but increased from 0.130
𝒄𝒎−𝟏 and 0.055 𝒄𝒎𝟐/𝒈 to 0.325 𝒄𝒎−𝟏 and 0.120 𝒄𝒎𝟐/𝒈 respectively at 120 KeV.
7. Inversely relation between half value layer (HVL) and percentage of recycled lead
shot RLS, As percentage of RLS increased from 0% to 140% HVL was decreased
from 2.24 cm to 1.41 cm respectively at 100KeV but decreased from 5.33 cm to
2.13 cm respectively at 120 KeV
8. Increasing in x-ray energy led to decrease in LAC and increase in HVL at the same
RLS ratio. For normal concrete without RLS when x-ray energy increases from 100
KeV to 120 KeV the LAC was decreased from 0.31 𝒄𝒎−𝟏 to 0.13 𝒄𝒎−𝟏 respectively
and HVL was increased from 2.24 cm to 5.33 cm respectively .
Chapter Five: Conclusions & Recommendations
86
9. When using the optimum RLS ratio 80% the LAC and HVL were 0.420 𝒄𝒎−𝟏 and
1.65 cm respectively at energy 100 KeV, but these values change to 0.229 𝒄𝒎−𝟏 and
3.03 mm respectively at energy 120 KeV.
10. For two photon energies, it can be deduced that for reduction of x-ray intensity
below a certain rate, ordinary concrete with minimum density (about 2.3 /cm−3 ) is
required in more thickness than other concretes.
5.3 Recommendations for Further Studies
While studies have shown that high density concrete can be used as good shielding
concrete, there is a need to add dense material or replace constituents concrete such
as aggregate by high dense aggregate then assess its durability and shielding
performance. Using recycled lead in concrete mixes leads to conserve high cost
waste to buy new plate and construct thick concrete wall and to reduce the amount
of danger waste that must be disposed of in landfills.
Recommendations for further studies are suggested as follows:
1. It's recommended to use recycled lead shots in concrete slabs because of its
good contribution to improve x-ray radiation resistance of concrete and the
compression strength of new concrete was improved
2. It is recommended that natural aggregate can be replaced by denser aggregate
with larger specific gravity to improve shielding properties of concrete such as
basalts.
3. Exposed concrete sample to gamma radiations has high energy several MeV
that are use in therapeutic purposes. Studying its influence on shielding
properties LAC and HVL should be done.
4. Organic material such as polymers may be added to concrete. The strength and
penetration x-ray radiation characteristics identified for anew concrete.
5. Adding recycled lead shots should be done on other concretes form such as
concrete slabs, blocks by different size and plaster and study its influence on
strength and shielding properties.

Chapter Five: Conclusions & Recommendations
87
6. More research is needed in the area of " Improving X-Ray Radiation
Resistance Of Concrete Used In Radio-Diagnostic Centers", due to its
importance and due to lack of studies in this field in our country.
7. Local testing laboratories should provide x-ray and gamma radiation sources in
addition to indector, so as to encourage researches in this important area of
researches.
8. Performing recycled lead operation under technical supervision to avoid any
negative effect on worker and people health needs to identify special place to
collect rubbish batteries and recycled operation.
9. More trials with different particle sizes of recycled lead shots and percentage of
addition of recycled aggregate to cement ratio are recommended to get higher
strength and shielding characteristics in the new concrete.
10. Using other recycled lead forms such as powder and plate to study its effects
on strength and shielding properties of concrete.
11. More studies on the economic aspect of lead processing and recycling are
required.
12. Investigated new concrete for durability use several tests such as fire
resistance, chemical attack, freezing and thawing.
References
88
References
Akkurt, I., Akhyildirim, H., Mavi, B., Kilincarslan, S., & Basyigit, C. (2010). Gamma-ray shielding
properties of concrete including barite at different energies. Prog. Nucl. Energy 52, 620-623.
Akkurt, I., Akhyildirim, H., Mavi, B., Kilincarslan, S., & Basyigit, C. (2010). Photon attenuation
coefficients of concrete includes barite in different rate. Ann. Nucl. Energy 37,910-914.
American Society for Testing and Materials . (2004). ASTM C33, Standard Specification for
Concrete Aggregates. Philadelphia, Pennsylvania: American Society for Testing and
Materials.
American Society for Testing and Materials. (2004). ASTM C109, Standard Test Method for
Compressive Strength of cube Concrete Specimens. Philadelphia, Pennsylvania:
American Society for Testing and Materials.
American Society for Testing and Materials. (2004). ASTM C127, Standard Test Method for
Specific gravity and absorption of coarse aggregate. Philadelphia, Pennsylvania:
American Society for Testing and Materials.
American Society for Testing and Materials. (2004). ASTM C128, Standard Test Method for
Specific gravity and absorption of fine aggregate. Philadelphia, Pennsylvania: American
Society for Testing and Materials.
American Society for Testing and Materials. (2004). ASTM C136, Standard Test Method for
Aggregate size distribution. Philadelphia, Pennsylvania: American Society for Testing
and Materials.
American Society for Testing and Materials. (2004). ASTM C143, Standard Test Method for
Slump of Hydraulic-Cement Concrete. Philadelphia, Pennsylvania: American Society for
Testing and Materials.
American Society for Testing and Materials. (2004). ASTM C192, Standard practice for making
concrete and curing tests. Philadelphia, Pennsylvania: American Society for Testing and
Materials.
American Society for Testing and Materials. (2004). ASTM C566, Standard Test Method for Bulk
density (Unit weight) and Voids in aggregate. Philadelphia, Pennsylvania: American
Society for Testing and Materials.
Balter, S., Hopewell, J., Miller, D., Wagner, L., & M., Z. (2010). Fluoroscopically guided
interventional procedures. A review of radiation effects on patients' skin and hair.
Radiology Journal. Vol: 254, No:2, P: 326-341.
Berger, M.J., & Hubbell, J.H. (1987). XCOM: photon cross sections on apersonal computer
NBSIR 87–3597. NBS, Washington, DC.
References
89
Berna, O., & Aycan, G. (2013). Determination of mass attenuation coefficients of concretes
containing ulexite and ulexite concentrator waste. Annals of Nuclear Energy 59 .72-74.
Biller, N. (2014). Abolishing Mammography Screening Programs? A View from the Swiss
Medical Board. The New England Journal of Medicine. Vol: 370, P: 1965-1967.
Brenner, D. (2010). Should we be concerned about the rapid increase in CT usage? Reviews on
environmental health. Vol: 25, No: 1, P: 63-68.
Burnham, J. (2001). Radiation protection, NB Power Corporation. Point Lepreau, New
Brunswick Power Corporation. Fourth edition.
Bushberg J., Seibert A., Leidholdt J., Edwin M., & Boone M. (2001). The essential physics of
medical imaging. Lippincott Williams & Wilkins. 2nd edition.
Dabbour, B. (2008). Engineering tests for building, soil and roads materials. College of science
and technology.Palestine.
Eaves, G. (1964). Principles of Radiation Protection. Iliffe Books Ltd, London.
El-Hosiny, F., & El-Faramawy, N. (2000). Shielding of gamma radiation by hydrated Portland
cement–lead pastes. Radiat. Meas. 32, 93-99.
El-Sayed,A. (2002). Calculation of the cross-sections for fast neutrons and gamma rays in
concrete shields. Ann. Nucl. Energy 29,1977.
Erdem, M., Baykara, O., Dogru, M., & Kuluozturk, F. (2010). A novel shielding material prepared
from solid waste containing lead for gamma ray. Radiation Physics and Chemistry 79 .
917–922.
Francis Young, J., & Darwin, D. (n.d.). "Concrete",Second Edition. SidneyMindess.
Hall, J., & A., G. (2006). Clinical response of normal tissues. Radiobiology for the Radiologist.
Vol: 6, P: 333-337.
Hall, J., & Brenner, D. (2008). Cancer risks from diagnostic radiology. The British Journal of
Radiology. Vol: 81, P: 362-378.
Herman, T., & T., G. (2009). Fundamentals of Computerized Tomography: Image
Reconstruction from Projections (2nd ed.). Springe.
Kharita, M., Yousef, S., & AlNassar, M. (2009). The effect of carbon powder addition on the
properties of hematite radiation shielding concrete. Progress in Nuclear Energy 51 .
388-392.
Kharita, M., Yousef, S., & AlNassar, M. (2010). The effect of the initial water to cement ratio on
shielding properties of ordinary concrete. Progress in Nuclear Energy 52 . 491-493.
References
90
Kontani, O., Ichikawa, Y., Ishizawa, A., Takizawa, M., & Sato, O. (2010). Irradiation Effects on
Concrete Structures. Proc. of International Symposium on the Ageing Management &
Maintenance of Nuclear Power Plants, 173-182.
Lawrence, S., Haken, K., & Giaccia, A. (2008). Principles of radiation oncology. In:Vita T. ;
Lawrence S., Rosenberg A., editors. Cancer: Principles and Practice of Oncology. 8th
edition. Philadelphia: Lippincott Williams and Wilkins.
lead Industries Association. (2011). aguide to the use of lead for radiation shielding. 292
Madison ave., New York, NY 1001.
Makarious,A.S., Bashter,I.I., Sayad Abdo,A.El., Sameer Abdul Azim,M., & Kansouh,W.A. (1996).
On the utilization of heavy concrete for radiation shielding. Annals of Nuclear
Energy23,195-206.
Martin, J. (2006). Physics for Radiation Protection, second ed. Wiley-VCH,Germany.
Morgan, F. (2003). Non-targeted and delayed effects of exposure to ionizing radiation: II.
Radiation-induced genomic instability and bystander effects in vivo, clastogenic factors
and transgenerational effects. Radiation research. Vol: 159, No: 5, P: 581-596.
Mortazavi, S., Mosleh-Shirazi, M., Maheri, M., H.Yousefnia, Zolghadri, S., & Haji-pour, A.
(2007). Production of an economic high-density concrete for shielding megavoltage
radiotherapy rooms and nuclear reactors. Iran: J. Radiat. Res., 5 (3): 143-146.
Mulle J. (1927). Artificial transmutation of the gene. Science. Vol: 46, P: 84-87.
Muller, S., & Richard, T. (2010). Physics for Future Presidents. Princeton University Press.
NCRP Report No. 151. (n.d.). Struct`ural shielding design and evaluation for megavoltage X-
and gamma-ray radio- therapy facilities. Bethesda, MD, USA: NCRP Report No. 151.
Neville, A. (1996). 4th edition Properties of Concrete. John Wiley and Sons, Inc., New York, pp.
844.
Occupational Safety and Health Council (OSHC). (2006). The ocular radiation hazard for health
care practitioners involving radiation exposure and the solutions for reducing this
hazard. Occupational Safety and Health Council (OSHC).
Rezaei-Ochbelagh, & Azimkhani, S. (2012). Investigation of gamma-ray shielding properties of
concrete containing different percentages of lead. Applied Radiation and Isotopes 70 .
2282-2286.
Rezaei-Ochbelagh, D., Azimkhani, S., & Gasemzadeh-Mosavinejad, H. (2011). Effect of gamma
and lead as an additive material on the resistance and strength of concrete. Nucl. Eng.
Des. 241, 2359-2363.
References
91
Rezaei-Ochbelagh, D., Gasemzadeh Mosavinejad, H., Molaei, M., Azimkhani, S., & Khodadoost,
M. (2010). Effect of low dose gamma radiation on concrete during solidification. IJPS 5
(10), 1496-1500.
Salinas, I., Conti, C., & Lopes, R. (2006). Effective density and mass attenuation coefficient for
building material in Brazil. Appl. Radiat. Isot. 64, 13-18.
Samarin, A. (2013). Use of Concrete as a Biological Shield from Ionising Radiation. Energy and
Environmental Engineering 1(2):90-97, University of Technology, Sydney, Australia,.
Santis, M., Cesari, E., Nobili, E., Straface, G., Cavaliere, F., & Caruso, A. (2007). Radiation effects
on development. Birth Defects Research Part C: Embryo Today: Reviews. Vol: 81, No: 3,
P:177-182.
Sharifi, S., Bagheri, R., & Shirmardi, S. (2013). Comparison of shielding properties for ordinary,
barite, serpentine and steel–magnetite concretes using MCNP-4C code and available
experimental results. Annals of Nuclear Energy 53. 529-534.
Shivaramu, M., Vijayakumar, R., Rajasekaran, L., & Ramamurthy, N. (2001). Effective atomic
numbers for photon energy absorption of some low-Zsubstances of dosimetric interest.
Radiat. Phys. Chem. 62, 371-377.
Shleien B. (1992). The Health Physics and Radiological Health Handbook. Revised Edition,
Scinta.
Shrimpton, P. (2001). The world of medical radiation exposures. Radiological Protection
Bulletin. Vol: 231, P: 18-23.
Singh, C. S. (2004). Energy and chemical composition dependence of mass attenuation
coefficients of building materials. Ann. Nucl. Energy 31, 1199-1205.
Singh, K., Singh, H., Sharma, V., Nathuram, R., Khanna, A., Kumar, R., et al. (2002). Gamma-ray
attenuation coefficients in bismuth borate glasses. Nucl. Instrum. Meth. B 194, 1-6.
Singh, K., Singh, N., Kaundal, R., & Singh, K. (2008). Nuclear Instruments and Methods in Physics
Research. B, 266, p. 944.
Whaites E., & Roderick C. (2002). Essentials of dental radiography and radiology. Elsevier
Health Sciences. P: 15-20.
Woods, J. (1982). Computational methods in Reactor Shielding. New York.: Pergamon Press.
Yousef,S., AlNassar,M., Naoom,B., Alhajali,S., & Kharita,M.H. (2008). Heat effect on the
shielding and strength properties of some local concretes. Progress in Nuclear Energy
50,22-26.

Appendices
92
Appendices

Appendices
93
APPENDIX A
RESEARCH PHOTOS
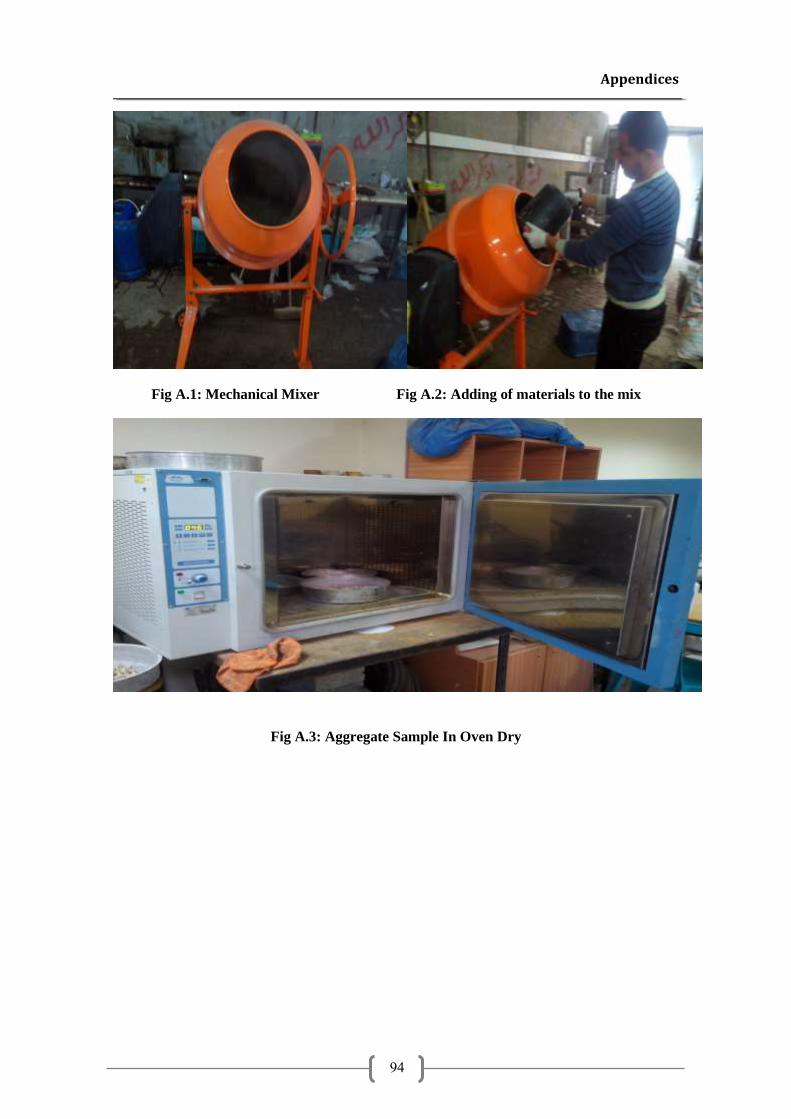
Appendices
94
Fig A.1: Mechanical Mixer Fig A.2: Adding of materials to the mix
Fig A.3: Aggregate Sample In Oven Dry
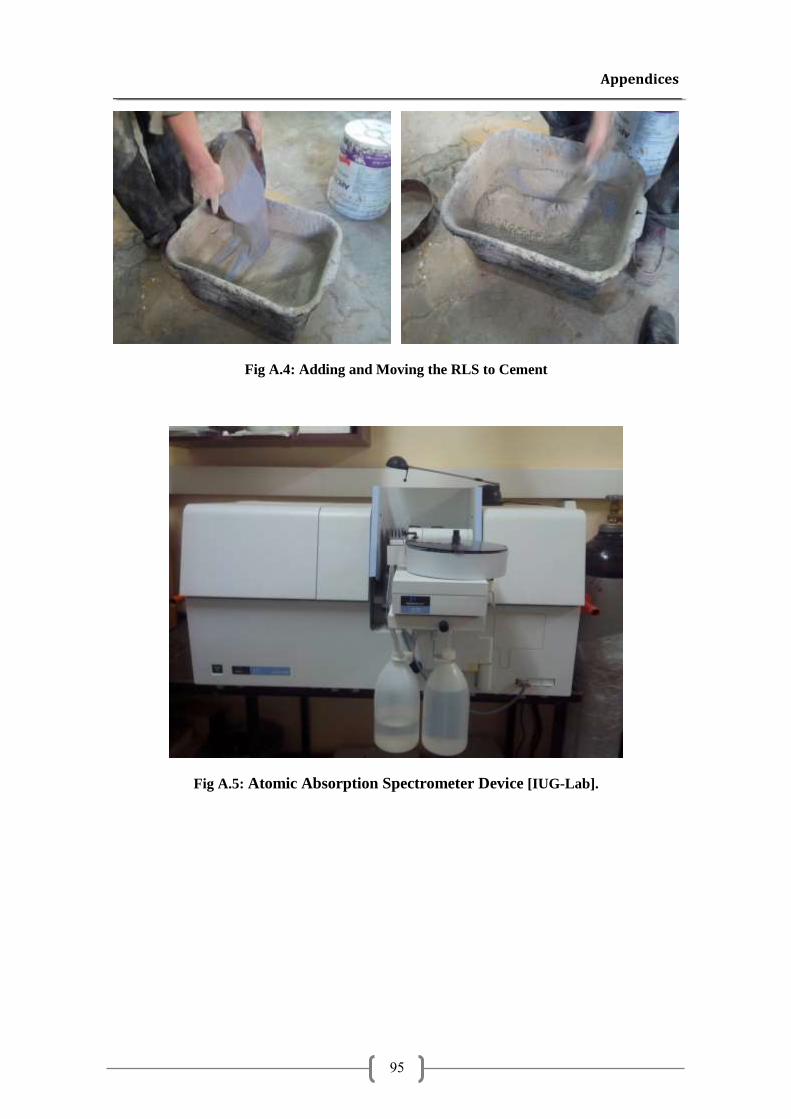
Appendices
95
Fig A.4: Adding and Moving the RLS to Cement
Fig A.5: Atomic Absorption Spectrometer Device [IUG-Lab].
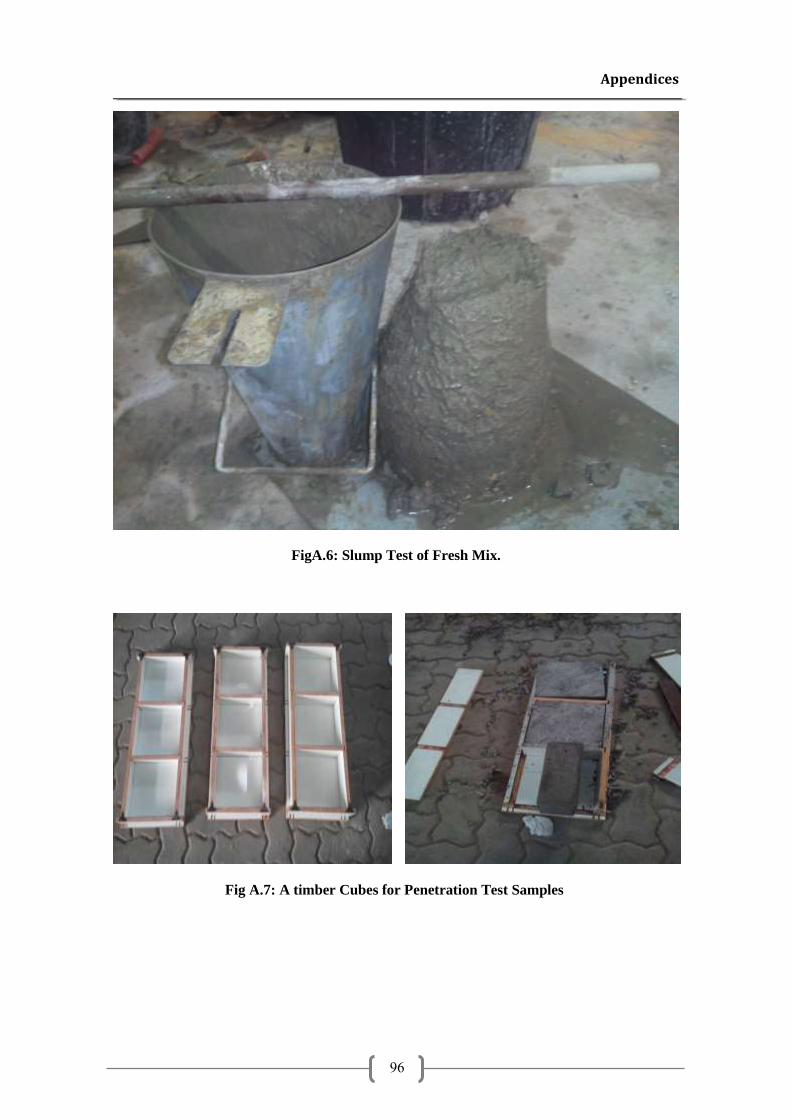
Appendices
96
FigA.6: Slump Test of Fresh Mix.
Fig A.7: A timber Cubes for Penetration Test Samples
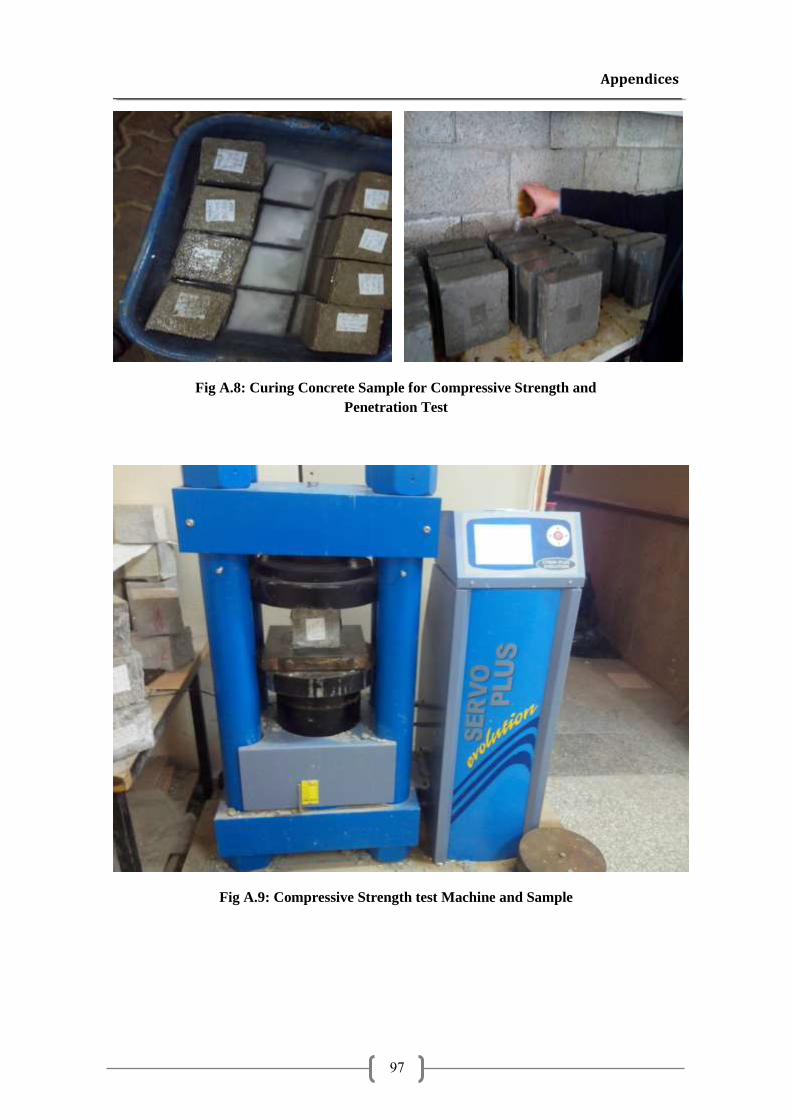
Appendices
97
Fig A.8: Curing Concrete Sample for Compressive Strength and
Penetration Test
Fig A.9: Compressive Strength test Machine and Sample
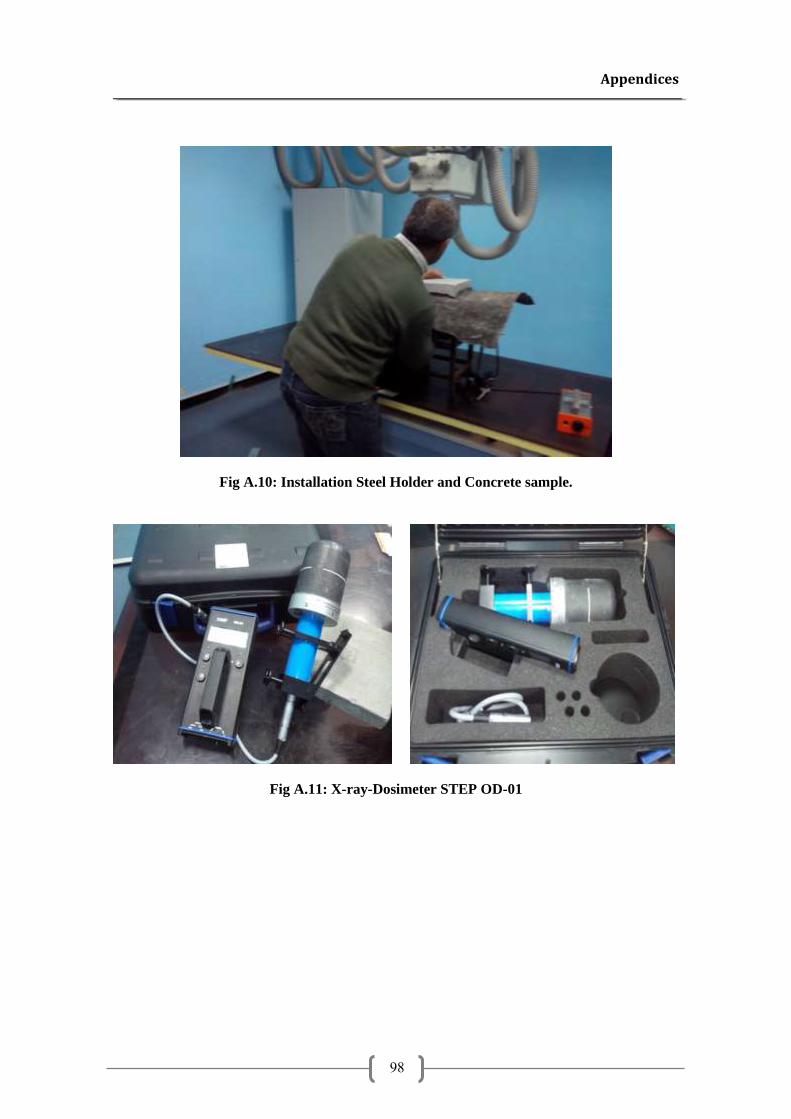
Appendices
98
Fig A.10: Installation Steel Holder and Concrete sample.
Fig A.11: X-ray-Dosimeter STEP OD-01
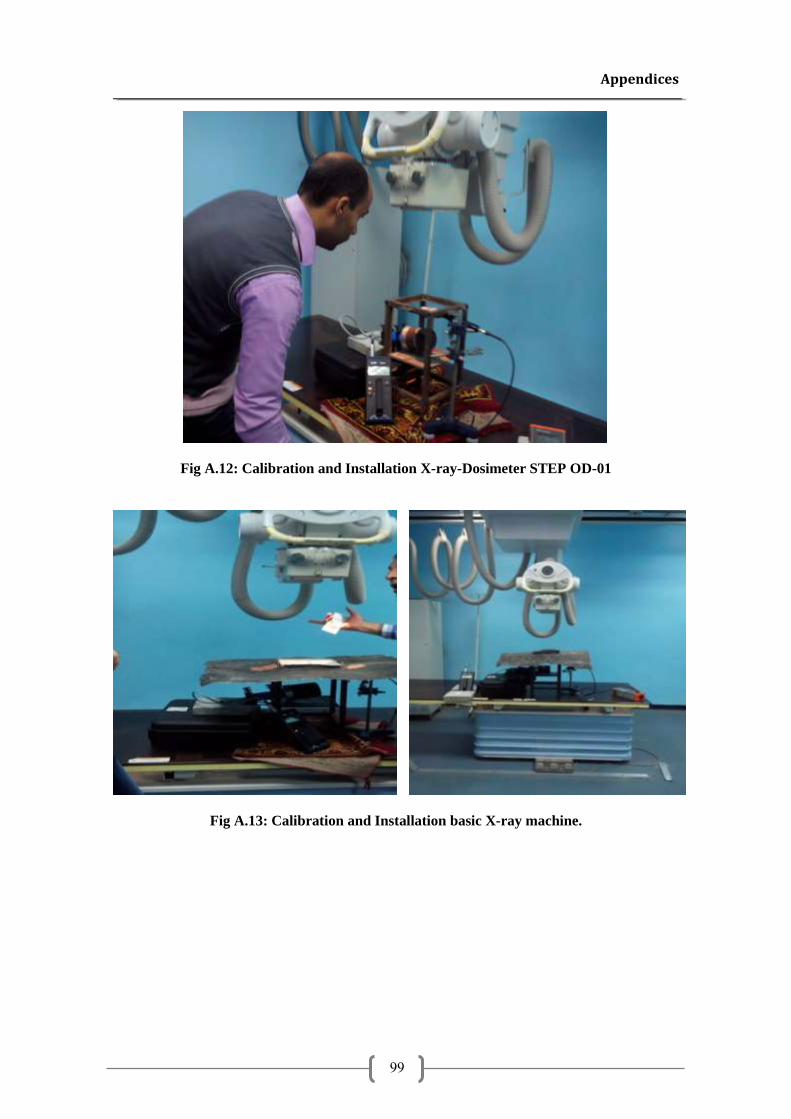
Appendices
99
Fig A.12: Calibration and Installation X-ray-Dosimeter STEP OD-01
Fig A.13: Calibration and Installation basic X-ray machine.
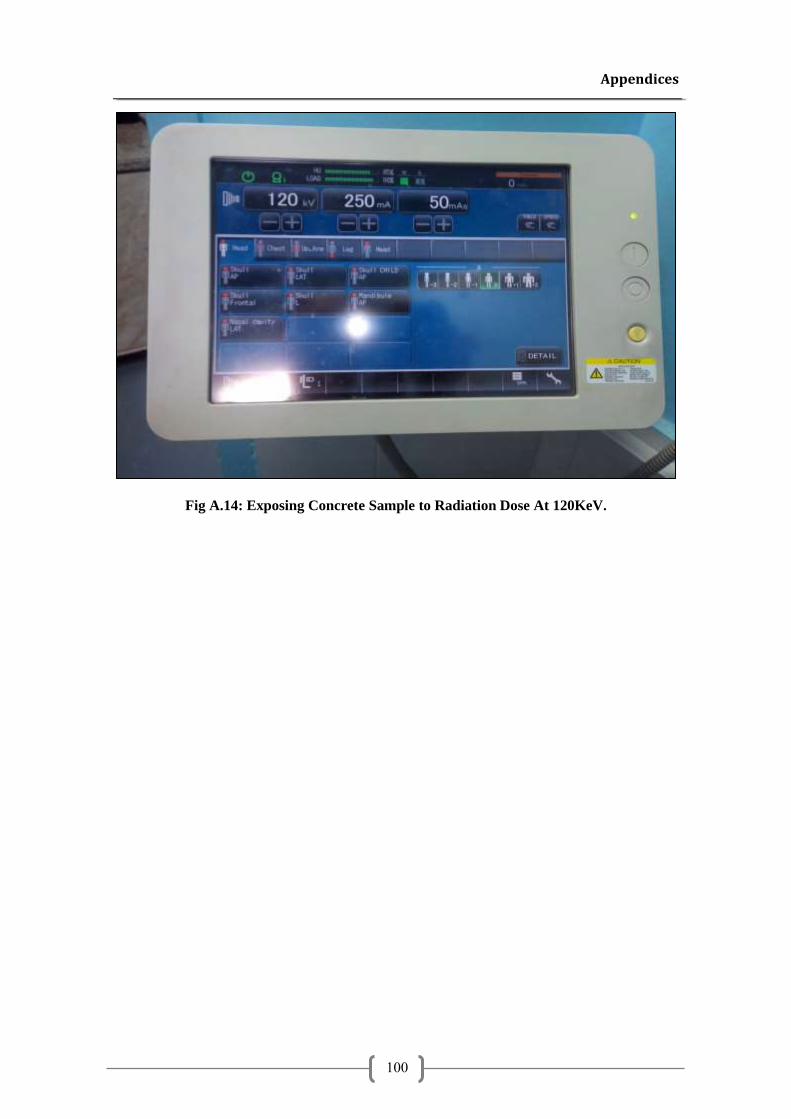
Appendices
100
Fig A.14: Exposing Concrete Sample to Radiation Dose At 120KeV.
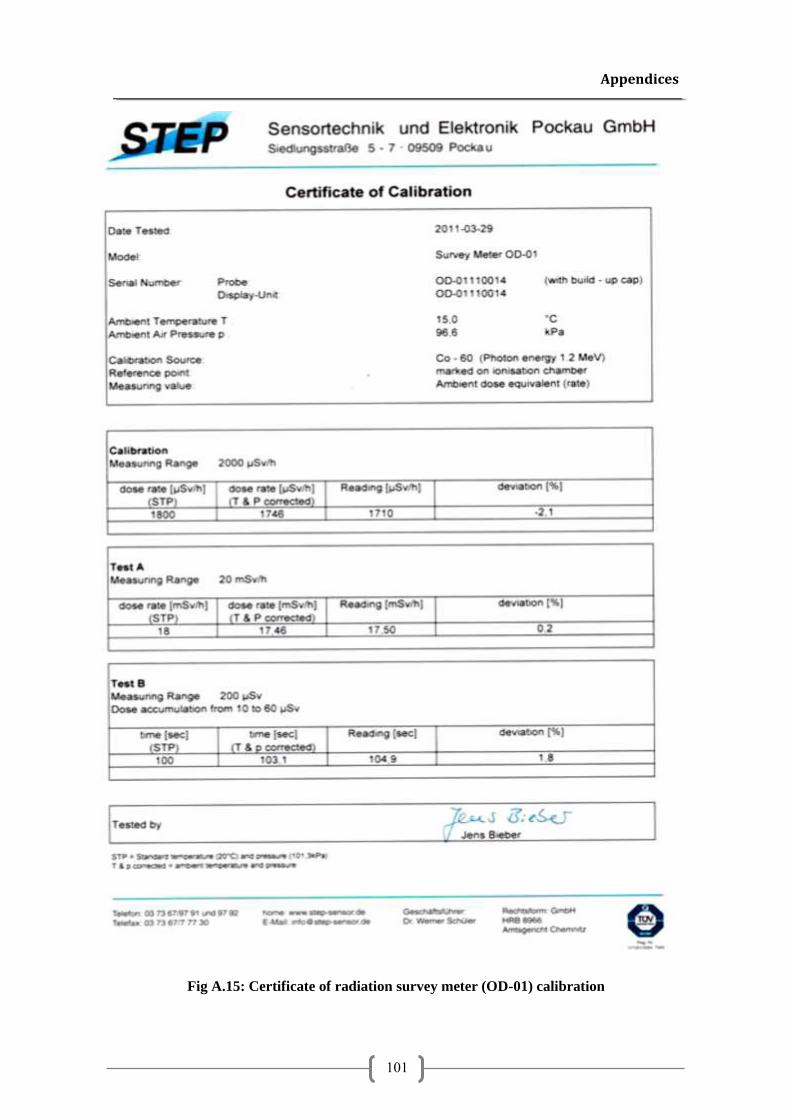
Appendices
101
Fig A.15: Certificate of radiation survey meter (OD-01) calibration
Appendices
102
APPENDIX B
RECYCLEDD LEAD SHEETS PHOTOS
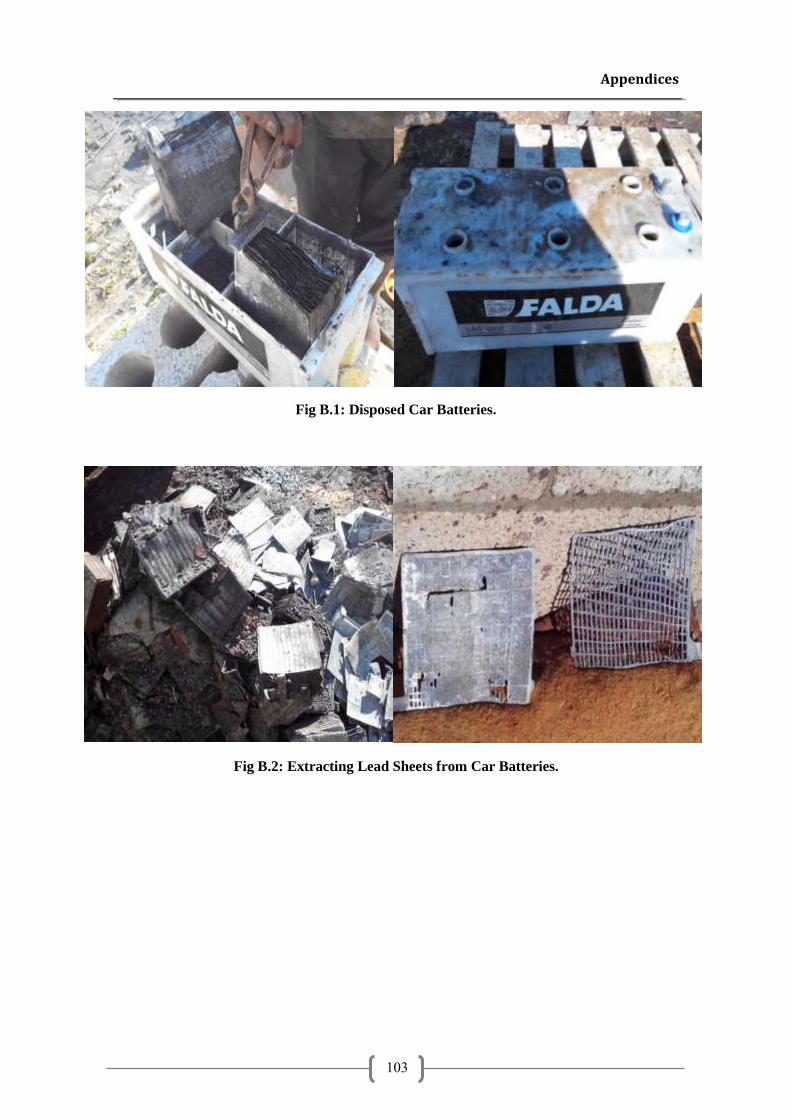
Appendices
103
Fig B.1: Disposed Car Batteries.
Fig B.2: Extracting Lead Sheets from Car Batteries.
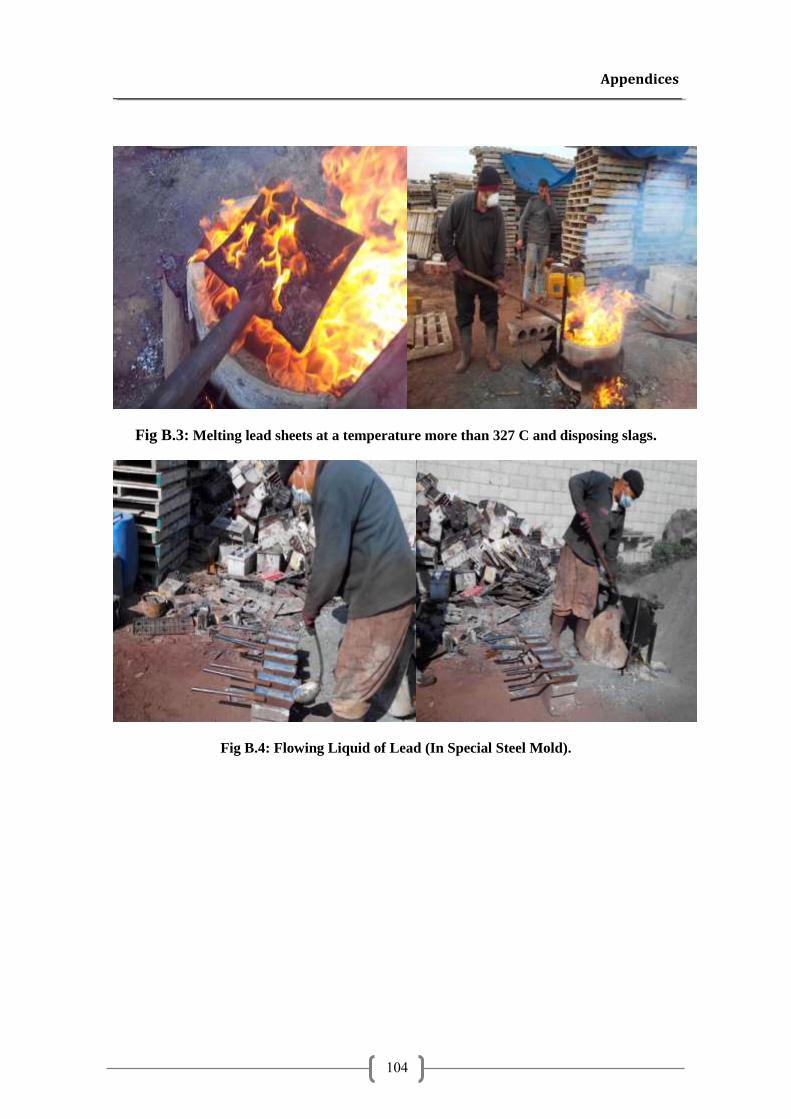
Appendices
104
Fig B.3: Melting lead sheets at a temperature more than 327 C and disposing slags.
Fig B.4: Flowing Liquid of Lead (In Special Steel Mold).
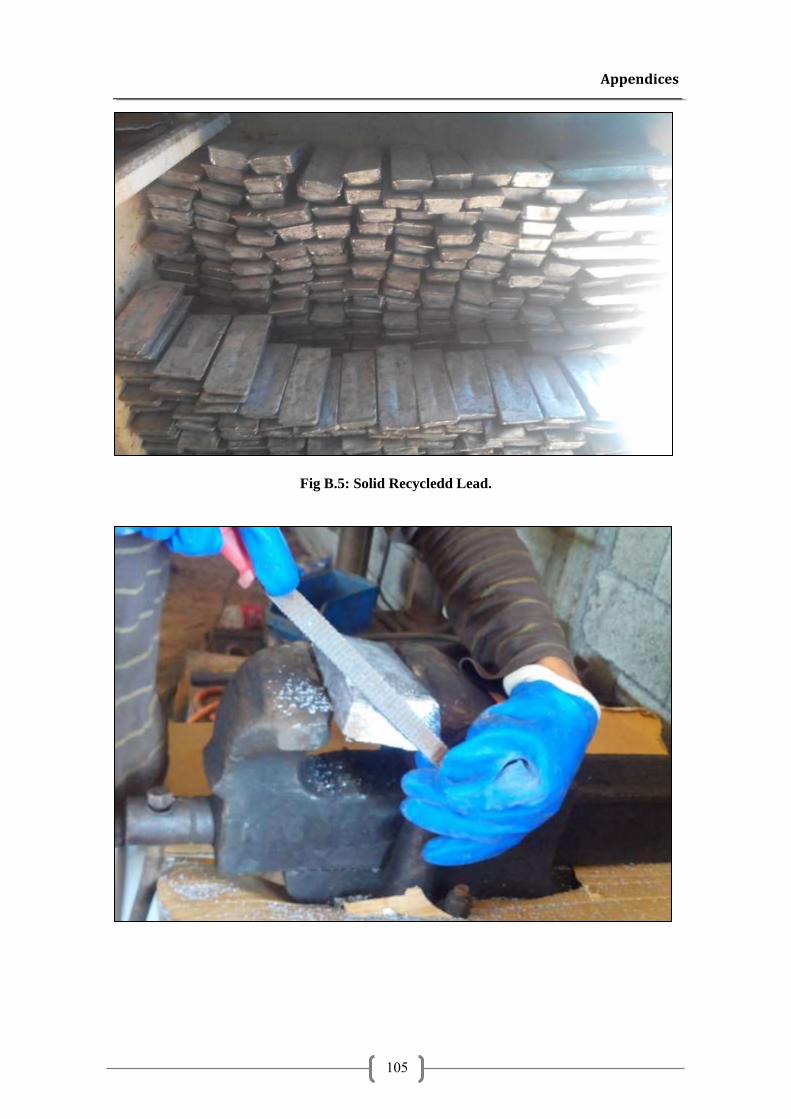
Appendices
105
Fig B.5: Solid Recycledd Lead.
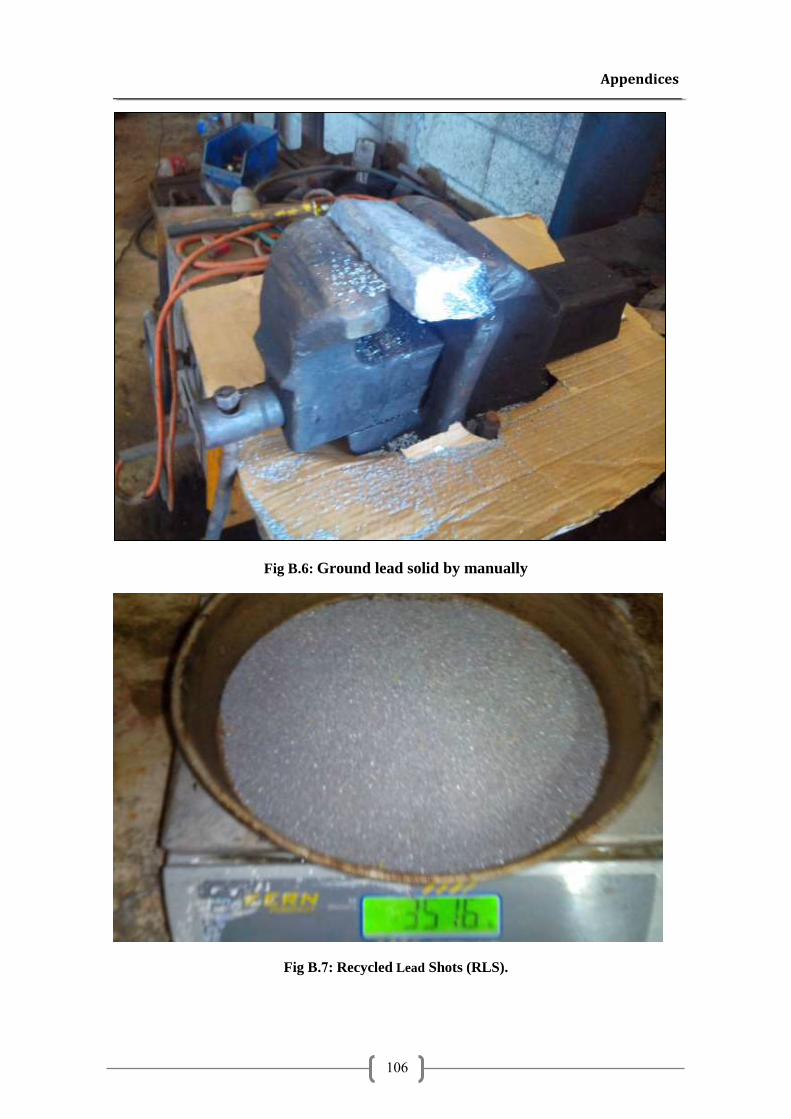
Appendices
106
Fig B.6: Ground lead solid by manually
Fig B.7: Recycled Lead Shots (RLS).