Embed Size (px)
Citation preview
1
EBHA 15th
Annual Conference
“Business, Finance and the State in the Twentieth Century: European
Comparisons in Historical Perspective. Crisis and Transformation”
Athens, 24-26 August 2011
The Italian Corporate Network: 1913-2001
Alberto Rinaldi ([email protected]) (Dipartimento di Economia Politica, Università di Modena e Reggio Emilia and RECent)
Michelangelo Vasta ([email protected]) (Dipartimento di Economia Politica e Statistica, Università di Siena)
ABSTRACT:
This paper analyses the Italian corporate network from 1913 to 2001 by using the interlocking directorates technique
and focusing on seven benchmark years (1913, 1927, 1936, 1960, 1972, 1983, and 2001). For each benchmark year, the
top 250 companies (50 financial and 200 non financial companies) by total assets have been selected. For each
benchmark year, After showing a descriptive statistics of the companies and the directors included in the sample, the
paper develops a network connectivity analysis of the system. This is integrated by a historical and structural analysis.
The paper reveals some distinct phases in the long term evolution of the Italian corporate network, consequent on some
major institutional break-ups (the crisis of the German-type universal banks and the creation of large state-owned sector
of the economy in the early 1930s; the nationalisation of the electricity industry in 1962; a massive privatisation of
state-owned enterprises in the 1990s) and the emergence of the technological trajectory of the third industrial revolution
in the 1970s.
JEL CLASSIFICATION: N24; P12; C63
First very preliminary draft. Do not quote without permission.

2
1. Introduction1
The literature on “varieties of capitalism” has identified two principal “ideal” typologies of political
economies among industrialized countries on the basis of the way in which firms solve their
coordination problems. In “liberal market economies” (LME), firms coordinate their activities
primarily via hierarchies and competitive market mechanisms. Instead, in “coordinated market
economies” (CME) inter-firm coordination takes place by resorting to a large extent to non-market
collaborative relationships, such as the exchange of information inside networks, which act as
monitoring systems and facilitate the construction of the firms‟ competencies. In this respect, LME
lack close-knit corporate networks, whereas CME have strong inter-firm networks which make easy
strategic interaction among firms and other actors. Although Italian capitalism has been mainly
described as a CME, it has many peculiar features. Probably the most important of these is that
Italy‟s industrialization was prompted by state intervention that left the system with specific
capacities for non-market coordination in the sphere of corporate finance (Hall and Soskice 2001).
During the XX century the Italian corporate system was characterized by the presence of big
holdings, a wide diffusion of family properties and a large weight of state-owned enterprises
(henceforth SOEs) (Colli and Vasta 2010). From Grifone‟s (1945) formulation on the centrality of
finance capital to Bonelli‟s (1979) arguments on capitalism and the state-controlled enterprise, up to
the Chandlerian interpretation of the same phenomenon (Amatori 1995; Chandler, Amatori and
Ikino 1997), the subject has passed through the various seasons of Italian economic historiography.
Company control is the exercise of influence over its strategic directions and allocation choices.
This subject has assumed considerable importance in all industrial economies. The analysis of the
relationships between those who have the wealth and those who manage it has attracted the
attention of numerous scholars, who have discussed the efficiency of various configurations
(Grossman and Hart 1986; Chandler 1990; Kreps 1990, Milgrom and Roberts 1992).
The aim of this study is to identify, using the interlocking directorates (henceforth ID) technique,
some features of the Italian corporate system from 1913 to 2001. An interlock is the link created
between two units when a subject belongs to both; that is, a director of two or more companies in
the case of ownership structure.
The paper is organised as follows. After this Introduction, Section 2 presents a review of the
literature on the Italian corporate structure; Section 3 illustrates the source utilised for this study;
Section 4 presents some descriptive statistics of the network; Section 5 analyses the structure of the
system through the use of network analysis techniques; Section 6 examines the central actors of the
network. Finally, Section 7 concludes.
2. Literature review
In recent years, some theoretical approaches have been developed to analyze the features of
ownership structures. The “law and finance” approach suggests that legal protection of investors is
the crucial determinant of capital market development, ownership concentration, and organizational
structures, and argues that legal protection is ultimately a by-product of a country‟s legal origin (La
Porta, Lopez de Silanes, Shleifer and Vishny 1998; La Porta, Lopez de Silanes and Shleifer 1999).
According to this view, if a country offers a high level of protection to shareholders, typical of
common law regulation, its economy will be characterized by a higher incidence of widely held
1 This work has relied on the use of Imita.db, a large dataset funded by Miur, the Italian Ministry for University and
Scientific Research, on Infocamere, the large dataset of Unioncamere, the association of the Italian chambers of
commerce and on R&S Mediobanca dataset on the Italian top companies. We thank the Chamber of Commerce of
Modena for letting us have access to Infocamere and on R&S Mediobanca for providing precious information on
balance sheets of the Italian firms. A special thank is due to Fulvio Coltorti, head of R&S-Mediobanca, for his valuable
and generous help.

3
companies à la Berle and Means (1932). Countries with a low level of shareholder protection,
typical of civil law regulation, are generally characterized by a greater ownership concentration
with a large diffusion of cross-shareholdings, differential voting rights, and pyramidal groups
(Wolfenzon 1998). Control is so valuable in such latter countries that companies will strive to make
it uncontestable (La Porta, Lopez de Silanes and Shleifer 1999). Thus, advocates of the “law and
finance” theory identified the lack of safeguards for minority shareholders as the main cause of the
high ownership concentration in Italy that prevented the development of the stock market by
restricting companies‟ contestability (Bianchi, Bianco and Enriques 2001).
Recently the “law and finance” approach has been criticized, even on the basis of new empirical
findings (Braendle 2006; Spamann 2006 and 2010; Siems 2008; Armour et al. 2009). Firstly, it has
been shown that there is not a robust correlation between the legal origin of a country and its
capacity to growth in the long run. Secondly, the patterns of evolution in different legal systems do
not follow the linear direction suggested by the “law and finance” theory: in fact, changes in legal
rules show much variety amongst countries of the same legal family as amongst countries of
different legal origin. In order to meet the criticisms received, La Porta et al. have reformulated the
legal origin claim by suggesting that legal origins do not refer only the legal institutions of a nation
but in broader sense to “highly persistent systems of social control of economic life” which include
culture and ideologies (La Porta, Lopez-de-Silanes and Shleifer 2008: 326).
On the one hand, now these authors do not point to the overall superiority of either of the two legal
families: civil law is more suitable when economic “disorder” is severe and common law when the
economic situation is “calm”. On the other hand, they admit that there are some factors – in
particular globalization and increased international competition – that can promote “convergence”
amongst different legal systems. Thus, according to this reformulation of the “law and finance”
approach, a nation is not locked in a path dependency pattern but can move in various directions in
the face of different situations.
An alternative approach, known as “political economy,” has resulted from observing that the
structure of financial systems is not uniform over time. Proponents of this view maintain that a
country‟s financial system and governance structure are not determined by unchanging institutional
factors, but mainly by the behaviour and structure of interest groups that change over time. One
prediction of these theorists is that ownership is more concentrated in countries where the state
plays a bigger role in the economy (Pagano and Volpin 2001; Rajan and Zingales 2003).
By adopting a “political economy” perspective, Aganin and Volpin (2005) argued that Italy is
locked in a sort of state and family capitalism in which a central position is occupied by a restricted
elite of politically appointed bureaucrats and of wealthy families. The extensive role of the state
produced, on the one hand, a scarce development of the stock market and, on the other hand, a high
ownership concentration. This evidence is coherent with that perspective‟s view that when the
government plays a big role in the economy, firms need political support to grow, and to maximize
their political weight they tend to maximize the value of the assets under their control.
By adopting an evolutionary approach, Pagano and Trento (2003) proposed an interpretation of the
dynamics of the Italian capitalism based on the complementarity between technology and
institutional setting. According to this view, the passage from one technological trajectory to
another can foster either an homogenization of the varieties of capitalism or the emergence of new
viable idiosyncratic organizational forms, depending on the comparative institutional advantage of
each nation. In turn, the system of corporate governance can affect the way in which new
technologies evolve and are adopted, thereby regenerating institutional diversity.
Thus, the creation of German-type universal banks in the last decade of the XIX century allowed
Italy to catch up with the technological trajectories of the second industrial revolution and
guaranteed a relative equilibrium to the Italian corporate system. The early 1930s represented a
turning point as, to face the Great Depression, the fascist government promoted state intervention
and, in 1933, created the Istituto per la Ricostruzione Industriale (Iri), which took over the universal
banks and their industrial securities. The result was the substitution of the state for the mixed banks,

4
as the linchpin of the system of financial intermediation (Toniolo 1980; Zamagni 1993). The end of
the fascist regime in 1945 did not change much in this respect. The boundaries of SOEs further
expanded after World War II: Iri still remained the main pillar of the system but a second pillar, the
state energy super-holding, Ente Nazionale Idrocarburi (Eni), was founded in 1953 (Carnevali
2000). The role of these two state holdings was part of a larger strategy of state intervention
(planning, anti-cyclical policies, and support to private enterprises) which characterized the Golden
Age and made possible a Gerschenkron-type convergence toward the technological frontier of the
mass production. The oil crises of the 1970s and the advent of a new technological trajectory, based
on ICT, marked a big change for the industrial structure of the Western economies. Italy was
severely hit by this new situation. The structure of Italian corporate system turned noticeably
between the 1970s and the 1980s: the new technological trajectory contributed both to speed up the
crisis of the SOEs system and to the soaring of industrial districts and networks of small and
medium-sized enterprises.
In the 1990s massive privatizations reduced the area of SOEs and opened a new era of state
entrepreneurship in Italy (Toninelli 2004). However, the state managed to retain control of national
champions in such strategic sectors as energy, aerospace and defence. The stock of these companies
was also partially sold off to raise funds from private investors. As a result, Italian enterprises in
these sectors became competitive in the international arena (Felice 2010).
This paper deals with the control structures of the Italian corporate system by using the ID
technique, which was fairly widespread during the first half of the twentieth century; it has been re-
utilized by sociologists, economists, and economic historians for a variety of purposes, including
analysis of inter-company links.
There is a strand of literature that analyzed the role of ID in the Italian corporate system. By being
inspired to Hilferding‟s (1910) theory of the hegemony of finance capital, that states that the control
of credit flows, and more rarely, part of the company‟s equity, enables banks to determine
companies‟ policy, most of these studies focused on the ID between banks and industries, on the
basis of the assumption that the presence of bank fiduciaries on company boards served as a major
instrument to enforce this control. As a general result, this literature stressed the persistent relevance
of ID in the Italian corporate system throughout the XX century that assured a high degree of
collusion among the major corporate groups.
For the fascist period, available studies are limited to a couple of pioneering studies. Zorzini (1925)
used ID analysis to study the structure of the hydroelectric industry. He found that industry very
concentrated around a few pivotal holding companies and a considerable presence of fiduciaries of
the two largest universal banks on boards of electric companies. A few years after Luzzatto Fegiz
(1928) also found that the Italian corporate sector was highly concentrated so that two per cent of
directors controlled more than one third of the capital of the nation‟s joint-stock companies. A more
recent study by Vasta and Baccini (1997) showed a substantial growth in the cohesion of the Italian
corporate system between 1911 and 1927, which was followed by a decline between 1927 and
1936. These changes were mainly due to the ID created by banks, even if there also seemed to
persist an autonomous ID structure, impermeable to the bank‟s influence. If banks occupied a
central position in the system in both 1911 and 1927, this was no longer the case in 1936 after the
crisis of the universal banks.
The panorama of available studies for the period after World War II is unquestionably more
consistent. Immediately after the war, the Economic Commission of the Ministry for the
Constituent Assembly made a very detailed survey of Italian joint-stock companies (Ministero per
la Costituente 1947). The study eventually became the object of a political clash and was never
published. Nevertheless, the results were made known in numerous works, due to the commitment
of one of the members of the Commission, Emanuele Rienzi of the Socialist Party (Zerini 1947;
Rienzi 1947-8; Cgil 1948; Radar 1948). The results of the survey verified that a few large corporate
groups dominated Italy‟s entire economic life by controlling, directly or indirectly, three-quarters of
the share capital of private firms, despite the presence of many small shareholders. The
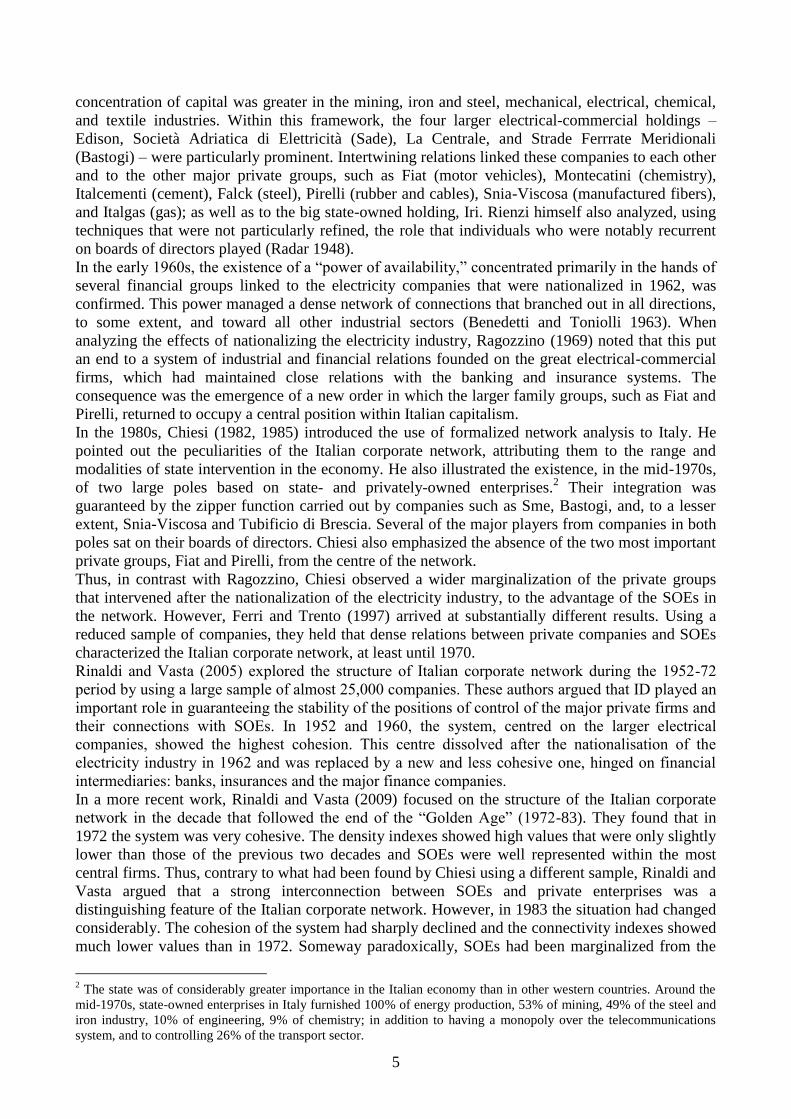
5
concentration of capital was greater in the mining, iron and steel, mechanical, electrical, chemical,
and textile industries. Within this framework, the four larger electrical-commercial holdings –
Edison, Società Adriatica di Elettricità (Sade), La Centrale, and Strade Ferrrate Meridionali
(Bastogi) – were particularly prominent. Intertwining relations linked these companies to each other
and to the other major private groups, such as Fiat (motor vehicles), Montecatini (chemistry),
Italcementi (cement), Falck (steel), Pirelli (rubber and cables), Snia-Viscosa (manufactured fibers),
and Italgas (gas); as well as to the big state-owned holding, Iri. Rienzi himself also analyzed, using
techniques that were not particularly refined, the role that individuals who were notably recurrent
on boards of directors played (Radar 1948).
In the early 1960s, the existence of a “power of availability,” concentrated primarily in the hands of
several financial groups linked to the electricity companies that were nationalized in 1962, was
confirmed. This power managed a dense network of connections that branched out in all directions,
to some extent, and toward all other industrial sectors (Benedetti and Toniolli 1963). When
analyzing the effects of nationalizing the electricity industry, Ragozzino (1969) noted that this put
an end to a system of industrial and financial relations founded on the great electrical-commercial
firms, which had maintained close relations with the banking and insurance systems. The
consequence was the emergence of a new order in which the larger family groups, such as Fiat and
Pirelli, returned to occupy a central position within Italian capitalism.
In the 1980s, Chiesi (1982, 1985) introduced the use of formalized network analysis to Italy. He
pointed out the peculiarities of the Italian corporate network, attributing them to the range and
modalities of state intervention in the economy. He also illustrated the existence, in the mid-1970s,
of two large poles based on state- and privately-owned enterprises.2 Their integration was
guaranteed by the zipper function carried out by companies such as Sme, Bastogi, and, to a lesser
extent, Snia-Viscosa and Tubificio di Brescia. Several of the major players from companies in both
poles sat on their boards of directors. Chiesi also emphasized the absence of the two most important
private groups, Fiat and Pirelli, from the centre of the network.
Thus, in contrast with Ragozzino, Chiesi observed a wider marginalization of the private groups
that intervened after the nationalization of the electricity industry, to the advantage of the SOEs in
the network. However, Ferri and Trento (1997) arrived at substantially different results. Using a
reduced sample of companies, they held that dense relations between private companies and SOEs
characterized the Italian corporate network, at least until 1970.
Rinaldi and Vasta (2005) explored the structure of Italian corporate network during the 1952-72
period by using a large sample of almost 25,000 companies. These authors argued that ID played an
important role in guaranteeing the stability of the positions of control of the major private firms and
their connections with SOEs. In 1952 and 1960, the system, centred on the larger electrical
companies, showed the highest cohesion. This centre dissolved after the nationalisation of the
electricity industry in 1962 and was replaced by a new and less cohesive one, hinged on financial
intermediaries: banks, insurances and the major finance companies.
In a more recent work, Rinaldi and Vasta (2009) focused on the structure of the Italian corporate
network in the decade that followed the end of the “Golden Age” (1972-83). They found that in
1972 the system was very cohesive. The density indexes showed high values that were only slightly
lower than those of the previous two decades and SOEs were well represented within the most
central firms. Thus, contrary to what had been found by Chiesi using a different sample, Rinaldi and
Vasta argued that a strong interconnection between SOEs and private enterprises was a
distinguishing feature of the Italian corporate network. However, in 1983 the situation had changed
considerably. The cohesion of the system had sharply declined and the connectivity indexes showed
much lower values than in 1972. Someway paradoxically, SOEs had been marginalized from the
2 The state was of considerably greater importance in the Italian economy than in other western countries. Around the
mid-1970s, state-owned enterprises in Italy furnished 100% of energy production, 53% of mining, 49% of the steel and
iron industry, 10% of engineering, 9% of chemistry; in addition to having a monopoly over the telecommunications
system, and to controlling 26% of the transport sector.

6
centre of the system just when they had reached their largest size and extent in the Italian economy.
A new private centre hinged on Italy‟s largest merchant bank, Mediobanca, had emerged.
Bianco and Pagnoni (1997) analysed the ID among the Italian listed companies from 1985 to 1995.
This study showed that the sharing of board members was a common practice between the
companies of the sample. Memberships superimposed on share control relationships were diffused
among manufacturing groups; in this case ID functioned mainly as a way to strengthen the position
of the controlling subject placed at the head of the pyramidal groups. Conversely, in the presence of
a legislation which strongly limited banks‟ participations in non financial companies (and vice
versa) ID between banks and industrial companies served above all as substitutes for share
relationships.
A subsequent work by Bianco, Drago, Giacomelli and Santella (2009) analysed the ID among the
Italian listed companies from 1998 to 2008. The main results were that over the entire period a high
percentage of the companies in the sample were connected with each other through ID. The
company network was centred around the financial and non-financial Blue Chips. The directors
who ensured the bulk of the connectivity by serving in a higher number of boards were mainly
relevant shareholders or managers of the Blue Chips. The turnover of the main board interlockers
tended to follow their turnover as shareholders in the same companies.
3. The source
The source we used in this work for the benchmark years from 1913 to 1983 is Notizie statistiche
sulle principali società italiane per azioni, edited by the Associazione fra le Società Italiane per
Azioni (Assonime). The Imita.db database is an electronic version of this source.3 This dataset
contains information regarding companies, boards of directors, and balance sheets of a large sample
of Italian joint-stock companies for several benchmark years.4 The source includes all the joint-
stock companies listed on one of the Italian stock exchanges, together with those companies located
in Italy whose share capital at the closure of the last balance was higher than a set threshold, which
varied from year to year.5 On the whole, the dataset contains data on more than 38,000 companies,
almost 300,000 directors, and more than 100,000 balance sheets. Representativeness, in terms of
capital, is very high as the sample covers well over 90 percent of the total universe in all but the
first two benchmark years (1911 and 1913) and the last one (1983), for which the proportion is
around 85 percent.6
For the benchmark year 2001 we selected the top 250 companies from Le principali società
italiane, the annual report on Italian joint-stock companies edited by R&S-Mediobanca. As this
source does not report the names of the board members, we extracted them from Infocamere, a large
dataset of Unioncamere, the association of the Italian chambers of commerce. Infocamere contains
information regarding all businesses (both corporate and non-corporate) registered at any Italian
chamber of commerce, including shareholders, boards of directors, attorneys and balance sheets,
starting from the late 1980s.
This paper focuses on seven benchmark years: 1913, 1927, 1936, 1960, 1972, 1983, and 2001. In
compliance with the guidelines of the comparative research project “Corporate networks in the 20th
century: structural changes and performance”, for each benchmark year we have selected the top
3 Imita.db is one of the largest datasets on joint-stock companies in historical perspective in the world. For details on the
database, see Vasta (2006). The database is available on line: http://imitadb.unisi.it 4 Data for companies and boards of directors are available for 1911, 1913, 1921, 1927, 1936, 1952, 1960, 1972, and
1983; for balance sheets, time series are available for the span from 1900 to 1971 and for 1982 and 1983. 5 The threshold was set at 1 million Italian lire until 1940, with the sole exception of 1914, when it amounted to 500,000
lire. In 1952, the threshold was raised to 10 million, then to 25 in 1956, 50 in 1961, and 100 from 1964 through 1972.
Finally, for the benchmark year 1983 the threshold was further raised to 2 billion lire. 6 For 1983, there are not enough official data on the representativeness of the sample. According to a recent estimate,
such a weight could, nevertheless, reach 83.3 percent of the total of Italian joint-stock companies (Cerise 2006).

7
250 companies by total assets, with the exclusion of subsidiaries. The top 250 companies have been
selected according to the following repartition: 50 financials and 200 non financials.
As for the directors, we used only data for members of a board of directors in the strict sense,
leaving out the members of Collegi sindacali.7 We have carefully standardized the names of the
directors to make them as homogeneous as possible. However, we estimate that the information on
boards of directors contained in Imita.db has a margin of error of about one percent, as is the case
with other similar databases (Mintz and Schwartz 1985). These errors are mainly due to cases of
homonymy, misprints, or shortcomings in the source.
4. Descriptive statistics of the network
An interlock, as noted, is the link formed between two companies when a person is a director of
both. In this work, we have used primary interlocks without taking into account either the
directionality or the strength of the links.8
Table 1 gives a summary of the general statistics of the sample. The number of total seats was
highest in 1927 with 3,024 board positions and an average of 12.1 members per board. The average
size remained stable until 1972 at about 11-12 members per board, but then it dropped considerably
with a minimum of 9.1 members in 2001.
An important measure in the description of the system is the cumulation ratio (CR), that is, the
average number of positions held by a single director. This, too, reached a maximum in 1927. Then
it decreased: firstly slightly in 1936 and 1960, but then substantially since 1972.
Table 2 classifies the 250 companies of each benchmark year into several industries. The weight of
the different industries varies over the time. Manufacturing companies were always the most
represented industry. Their number dropped from 101 to 85 between 1913 and 1927, but then
increased and reached a maximum of 148 in 1972. They remained stable at 142 in 1983, which
marked a new turning point. In fact, manufacturing companies dropped substantially to 111 in 2001.
However, the biggest change concerned the weight of the public utilities companies. These were
highly represented from 1913 to 1960 when they accounted for about one quarter of all non
financial companies. Then they nearly disappeared in 1972 and 1983 as a consequence of the
nationalisation of the electricity industry in 1962. Finally, they showed a staggering increase in
2001 as a consequence of the massive wave of privatisations of state-owned and municipal
enterprises that was carried out in Italy in the 1990s and of the take-off of the mobile telephone
industry.
7 Collegi sindacali are special committees of auditors for firms, and are similar to supervisory boards (Scott 1985).
8 In the case of directionality, it is assumed that the direction of the interlock goes from the company in which an
individual director has a more important position to that in which the position is of lesser importance. In the case of
strength, the connections between two companies are weighted by taking into account the number of directors who sit
on both boards of directors. See Pennings (1980) and Wasserman and Faust (1994).

8
Table 1. Descriptive statistics of the network
1913 1927 1936 1960 1972 1983 2001
A: Number of non-financial firms 200 200 200 200 200 200 200
Total number of seats 1,781 2,236 1,841 2,150 2,106 1,813 1,536
Average size of the board 8.9 11.2 9.2 10.8 10.5 9.1 7.7
Total number of directors 1,166 1,356 1,371 1,457 1,641 1,456 1,307
B: Number of financial firms 50 50 50 50 50 50 50
Total number of seats 611 788 705 783 909 865 727
Average size of the board 12.2 15.8 14.1 15.7 18.2 17.3 14.5
Total number of directors 554 668 592 653 761 752 602
A+B : Total number of firms 250 250 250 250 250 250 250
Total number of seats 2,392 3,024 2,546 2,933 3,015 2,678 2,263
Average size of the board 9.6 12.1 10.2 11.7 12.1 10.7 9.1
Total number of directors 1,571 1,827 1,618 1,932 2,230 2,108 1,850
CR: Cumulation Ratio 1.52 1.66 1.57 1.52 1.35 1.27 1.22
Table 2. Firms by sector
Total
o
1 3 4 5 6 7 8 9 10 11 12 13
1913 250 50 8 37 4 101 9 - 8 21 7 4 -
1927 250 50 10 62 8 85 10 - 13 6 3 3 -
1936 250 50 5 66 4 98 7 - 2 9 3 4 2
1960 250 50 4 46 6 118 9 - 8 2 2 - 5
1972 250 50 5 5 5 148 6 - 10 - 1 3 17
1983 250 50 15 7 9 142 2 - 8 - 1 7 9
2001 250 50 10 41 11 111 1 - 2 3 - 11 9
Legend: 1: Financials; 3: Service industry; 4: Electric utility. Water, Telephone, and Gas; 5: Trade companies; 6:
Manufacturing companies; 7: Mining industry; 8: Oil companies; 9: Shipping industry; 10: Railway companies; 11:
Tramway companies; 12: Building companies; 13: Transport, Warehousing, and Communication.
5. The structure of the network9
For most of the period investigated the Italian corporate network consisted of a large main
component that included about 90% of the firms of the sample (Table 3). However, from 1983 the
proportion of the firms in the main component started to decline, and in 2001 dropped to 61.2%. In
that year the network appeared much more fragmented than in the past and – apart from isolated
firms – there were another 11 small components in addition to the main component.
Isolated firms remained stable from 1913 to 1960 but then their number started to increase. The rise
was slight in 1972 and 1983 but became massive in 2001 when isolated firms more than doubled
with regard to the previous benchmark (from 33 to 71 firms) year and came to account for nearly
30% of total firms.
Also marginal firms were stable from 1913 to 1960 and increased starting from 1972. However, in
this case the most of the surge occurred between 1960 and 1983 while in the interval from 1983 and
2001 marginal firms rose only from 63 to 70.
The overall proportion of isolated and marginal firms remained quite stable around 19% prior to the
Second World War. It dropped to 15% in 1960 but then it began to rise and reached a maximum of
9 We have used Pajek software and the books by De Nooy, Mrvar and Batagelj (2005) and Wasserman and Faust (1994)
for the definitions and calculations of the various indexes and measures presented in this paper.
9
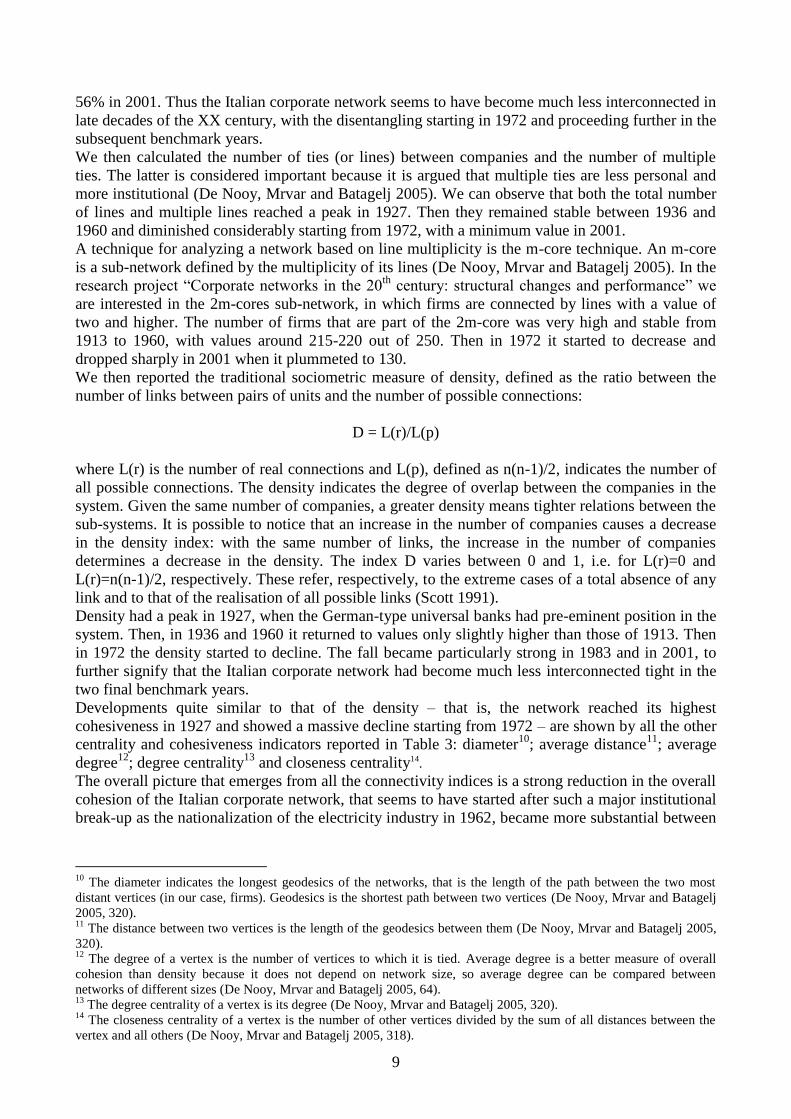
56% in 2001. Thus the Italian corporate network seems to have become much less interconnected in
late decades of the XX century, with the disentangling starting in 1972 and proceeding further in the
subsequent benchmark years.
We then calculated the number of ties (or lines) between companies and the number of multiple
ties. The latter is considered important because it is argued that multiple ties are less personal and
more institutional (De Nooy, Mrvar and Batagelj 2005). We can observe that both the total number
of lines and multiple lines reached a peak in 1927. Then they remained stable between 1936 and
1960 and diminished considerably starting from 1972, with a minimum value in 2001.
A technique for analyzing a network based on line multiplicity is the m-core technique. An m-core
is a sub-network defined by the multiplicity of its lines (De Nooy, Mrvar and Batagelj 2005). In the
research project “Corporate networks in the 20th
century: structural changes and performance” we
are interested in the 2m-cores sub-network, in which firms are connected by lines with a value of
two and higher. The number of firms that are part of the 2m-core was very high and stable from
1913 to 1960, with values around 215-220 out of 250. Then in 1972 it started to decrease and
dropped sharply in 2001 when it plummeted to 130.
We then reported the traditional sociometric measure of density, defined as the ratio between the
number of links between pairs of units and the number of possible connections:
D = L(r)/L(p)
where L(r) is the number of real connections and L(p), defined as n(n-1)/2, indicates the number of
all possible connections. The density indicates the degree of overlap between the companies in the
system. Given the same number of companies, a greater density means tighter relations between the
sub-systems. It is possible to notice that an increase in the number of companies causes a decrease
in the density index: with the same number of links, the increase in the number of companies
determines a decrease in the density. The index D varies between 0 and 1, i.e. for L(r)=0 and
L(r)=n(n-1)/2, respectively. These refer, respectively, to the extreme cases of a total absence of any
link and to that of the realisation of all possible links (Scott 1991).
Density had a peak in 1927, when the German-type universal banks had pre-eminent position in the
system. Then, in 1936 and 1960 it returned to values only slightly higher than those of 1913. Then
in 1972 the density started to decline. The fall became particularly strong in 1983 and in 2001, to
further signify that the Italian corporate network had become much less interconnected tight in the
two final benchmark years.
Developments quite similar to that of the density – that is, the network reached its highest
cohesiveness in 1927 and showed a massive decline starting from 1972 – are shown by all the other
centrality and cohesiveness indicators reported in Table 3: diameter10
; average distance11
; average
degree12
; degree centrality13
and closeness centrality14.
The overall picture that emerges from all the connectivity indices is a strong reduction in the overall
cohesion of the Italian corporate network, that seems to have started after such a major institutional
break-up as the nationalization of the electricity industry in 1962, became more substantial between
10
The diameter indicates the longest geodesics of the networks, that is the length of the path between the two most
distant vertices (in our case, firms). Geodesics is the shortest path between two vertices (De Nooy, Mrvar and Batagelj
2005, 320). 11
The distance between two vertices is the length of the geodesics between them (De Nooy, Mrvar and Batagelj 2005,
320). 12
The degree of a vertex is the number of vertices to which it is tied. Average degree is a better measure of overall
cohesion than density because it does not depend on network size, so average degree can be compared between
networks of different sizes (De Nooy, Mrvar and Batagelj 2005, 64). 13
The degree centrality of a vertex is its degree (De Nooy, Mrvar and Batagelj 2005, 320). 14
The closeness centrality of a vertex is the number of other vertices divided by the sum of all distances between the
vertex and all others (De Nooy, Mrvar and Batagelj 2005, 318).
10
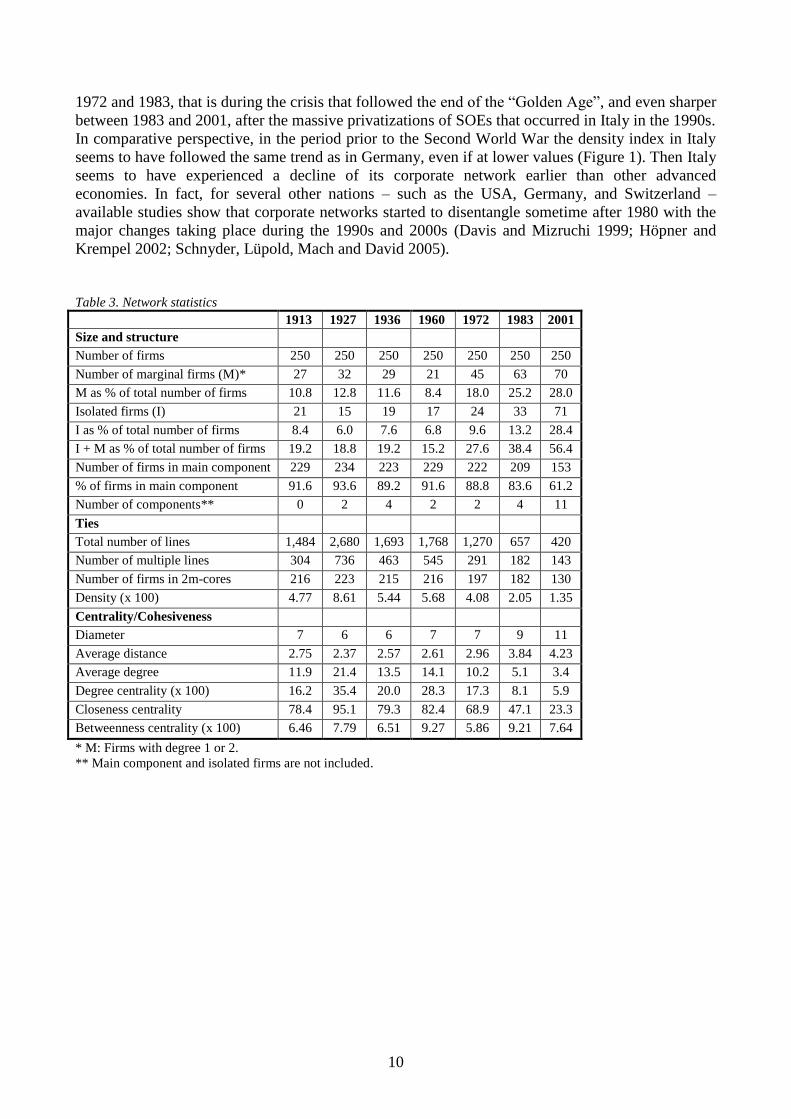
1972 and 1983, that is during the crisis that followed the end of the “Golden Age”, and even sharper
between 1983 and 2001, after the massive privatizations of SOEs that occurred in Italy in the 1990s.
In comparative perspective, in the period prior to the Second World War the density index in Italy
seems to have followed the same trend as in Germany, even if at lower values (Figure 1). Then Italy
seems to have experienced a decline of its corporate network earlier than other advanced
economies. In fact, for several other nations – such as the USA, Germany, and Switzerland –
available studies show that corporate networks started to disentangle sometime after 1980 with the
major changes taking place during the 1990s and 2000s (Davis and Mizruchi 1999; Höpner and
Krempel 2002; Schnyder, Lüpold, Mach and David 2005).
Table 3. Network statistics
1913 1927 1936 1960 1972 1983 2001
Size and structure
Number of firms 250 250 250 250 250 250 250
Number of marginal firms (M)* 27 32 29 21 45 63 70
M as % of total number of firms 10.8 12.8 11.6 8.4 18.0 25.2 28.0
Isolated firms (I) 21 15 19 17 24 33 71
I as % of total number of firms 8.4 6.0 7.6 6.8 9.6 13.2 28.4
I + M as % of total number of firms 19.2 18.8 19.2 15.2 27.6 38.4 56.4
Number of firms in main component 229 234 223 229 222 209 153
% of firms in main component 91.6 93.6 89.2 91.6 88.8 83.6 61.2
Number of components** 0 2 4 2 2 4 11
Ties
Total number of lines 1,484 2,680 1,693 1,768 1,270 657 420
Number of multiple lines 304 736 463 545 291 182 143
Number of firms in 2m-cores 216 223 215 216 197 182 130
Density (x 100) 4.77 8.61 5.44 5.68 4.08 2.05 1.35
Centrality/Cohesiveness
Diameter 7 6 6 7 7 9 11
Average distance 2.75 2.37 2.57 2.61 2.96 3.84 4.23
Average degree 11.9 21.4 13.5 14.1 10.2 5.1 3.4
Degree centrality (x 100) 16.2 35.4 20.0 28.3 17.3 8.1 5.9
Closeness centrality 78.4 95.1 79.3 82.4 68.9 47.1 23.3
Betweenness centrality (x 100) 6.46 7.79 6.51 9.27 5.86 9.21 7.64
* M: Firms with degree 1 or 2.
** Main component and isolated firms are not included.

11
Figure 1. Density of the top 250 companies in some selected countries*
0.0
2.0
4.0
6.0
8.0
10.0
12.0
14.0
16.0
18.0
end 1800 - beginning1900
pre WWI 1927-1928 1936-1938 1993-1996
Germany USA UK France Italy
* Data for France, Germany, USA and UK are drawn from Windolf (2010)
6. Actor centrality
In network analysis it is presumed that actors that are central have better access to information,
better opportunities to spread information and someway a “power” to coordinate the whole network.
In this paper we use two measures to calculate the centrality of firms: degree centrality and
betweenness centrality.
Degree centrality is the simplest and most intuitive measure of actor centrality. It simply counts the
number of actors to which an actor is tied: this is its degree. However, degree centrality is a local
centrality measure as it does not take into account the centrality of the neighbours to which an actor
is linked. Thus an actor can have many neighbours but still be at the periphery of the network as a
whole. This shortcoming is overcome by betweenness centrality. This measures is based on the idea
that a firm is more central if it is more important as an intermediary in the communication network.
So it calculates for each actor the number of shortest paths between any pairs of actors in the
network that pass through this actor (De Nooy, Mrvar and Batagelj 2005).
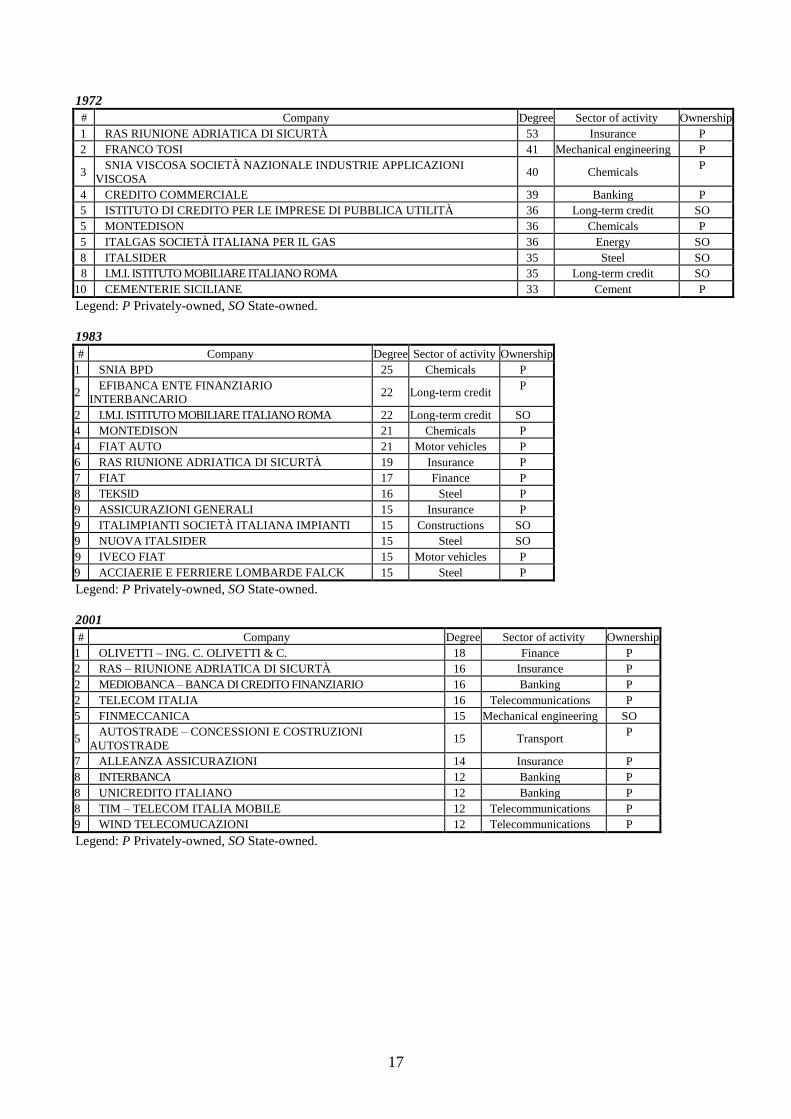
By analysing degree centrality, we observe that in 1913 the banking sector was the most represented
among the most central companies, with four presences out of ten (Table 4).
The three larger universal banks (Banca Commerciale, Credito Italiano and Società Bancaria
Italiana) and the Bank of Italy (which at that time was still a privately-owned joint-stock company)
seemed to play a central role in the system15.
In 1927 the centre appeared to have been enlarged and reached its highest connectivity. The two
larger universal banks had further strengthened their links with industry and especially with
electrical companies. Now the centre included, together Banca Commerciale and Credito Italiano,
the major electrical companies and the Società Italiana per le Strade Meridionali, a former railway
company which, after the nationalisation of the Italian railways in 1905, had turned into a finance
company that invested the sums it had received from the state, in compensation for the railway
nationalisation, mainly in securities of the major electrical-commercial companies.
15
The list of the top ten companies according to degree centrality for each benchmark year is reported in Appendix 1.

12
The economic crisis of the early 1930s pushed the government to create, in 1933, the big state-
owned holding Iri that took over the universal banks and their industrial securities. In 1936 a new
banking law imposed a clear-cut separation between banks and industry. Banks were allowed to
practice only short-term credit, while their share participations in non financial companies were
strictly limited. At the same time, industrial credit was entrusted to newly-created specialised
institutes.
These changes had profound effects on the structure of the Italian corporate network and resulted in
a remarkable decrease in the cohesion of the system. In 1936, the most central companies had little
more than one-half of the links of their counterparts in 1927. The former universal banks had lost
their pre-eminent position, while a central position to ensure the cohesion of the system was now
occupied by the larger electrical groups, the two bigger insurance companies, and the Società
Italiana per le Strade Meridionali.
The situation little changed in 1960, with four large electrical companies and two finance
companies deeply involved in the electricity industry among the top ten.
The nationalisation of the electricity industry in 1962 led to a dissolving of the old centre of the
system. In fact, in 1972 electrical companies had disappeared from the top ten, that now included a
higher proportion of manufacturing companies (five out of ten) than ever before. In 1972, it is also
possible to observe a larger presence of SOEs among the most central companies: four of the top
ten companies (as compared with two in 1960) were now state-owned. The fact that two of the latter
were industrial credit institutes highlights the central role that the state had come to play in
channelling funds to industry.
The year 1983 saw a dramatic decrease in the number of interlocks of the most central companies,
that halved with regard to 1972. The central role of manufacturing companies was further
strengthened as these now accounted for seven of the top 13 companies. Yet, the most important
change was the marginalisation of SOEs from the centre of the system, as they now numbered only
three of the top thirteen.
In the face of the marginalization of SOEs, between 1972 and 1983 the system‟s centre seems to
have been reshaped around the pivotal role Mediobanca played, as the only merchant bank
operating in Italy at that time. Mediobanca did not appeared in the list of the more central
companies in that year. However, nine of the 13 companies on the 1983 list, especially those
belonging to the Fiat and Montedison groups, and the two big insurance companies Assicurazioni
Generali and Ras were closely tied to it through credit relations, cross participations, and
Mediobanca‟s presence in their controlling syndicates.
The massive wave of privatizations of SOEs in the 1990s marked another major institutional break-
up. As a result, in 2001 the Italian corporate network had become even more disentangled with all
the connectivity indicators showing their lowest values. Manufacturing companies had nearly
disappeared from the more central companies, with only the big aerospace and defence state-owned
company Finmeccanica remaining. Now the most represented sectors among the top ten companies
by degree centrality were telecommunications and banks with three presences each. At the same
time, insurance companies confirmed their importance at the core of the network with two
presences.
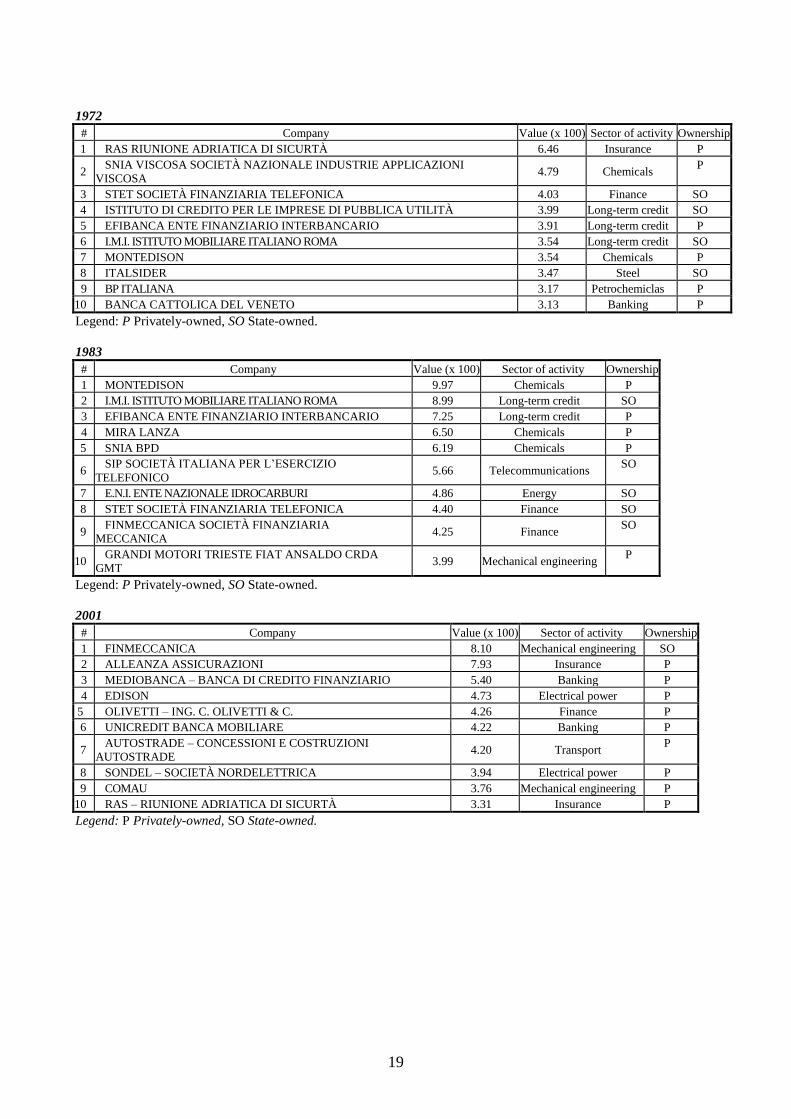
An analysis of the top ten companies according to betweenness centrality shows results that are
very similar to those obtained with degree centrality (Table 5).
The major differences between the two measures concerns the place of SOEs in 1983 and that of
telecommunications and electricity companies in 200116.
As to the former, in 1983 SOEs are marginalized from the centre of the network according to degree
centrality, but they have a stronger position according to betweenness centrality. A possible
explanation is of this apparent paradox is that it can someway be a consequence of the change in the
structure of the network that occurred between 1972 and 1983, with the passage from one large
16
The list of the top ten companies according to betweenness centrality for each benchmark year is reported in
Appendix 2.
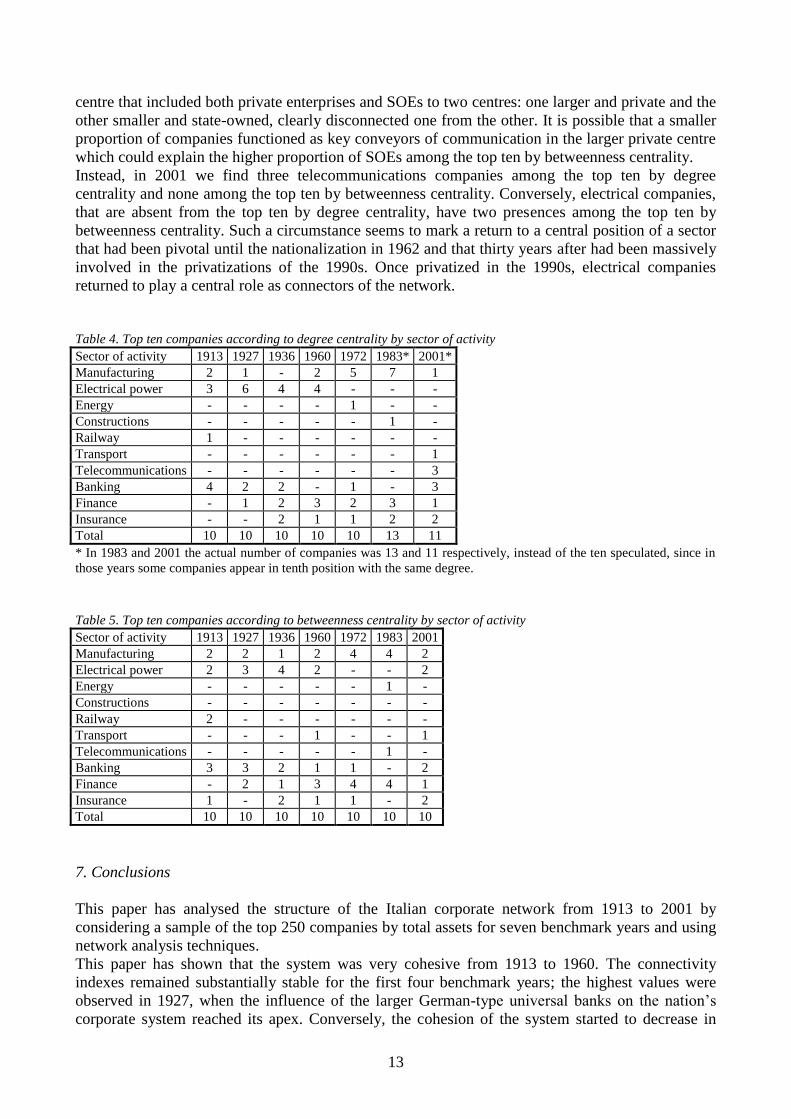
13
centre that included both private enterprises and SOEs to two centres: one larger and private and the
other smaller and state-owned, clearly disconnected one from the other. It is possible that a smaller
proportion of companies functioned as key conveyors of communication in the larger private centre
which could explain the higher proportion of SOEs among the top ten by betweenness centrality.
Instead, in 2001 we find three telecommunications companies among the top ten by degree
centrality and none among the top ten by betweenness centrality. Conversely, electrical companies,
that are absent from the top ten by degree centrality, have two presences among the top ten by
betweenness centrality. Such a circumstance seems to mark a return to a central position of a sector
that had been pivotal until the nationalization in 1962 and that thirty years after had been massively
involved in the privatizations of the 1990s. Once privatized in the 1990s, electrical companies
returned to play a central role as connectors of the network.
Table 4. Top ten companies according to degree centrality by sector of activity
Sector of activity 1913 1927 1936 1960 1972 1983* 2001*
Manufacturing 2 1 - 2 5 7 1
Electrical power 3 6 4 4 - - -
Energy - - - - 1 - -
Constructions - - - - - 1 -
Railway 1 - - - - - -
Transport - - - - - - 1
Telecommunications - - - - - - 3
Banking 4 2 2 - 1 - 3
Finance - 1 2 3 2 3 1
Insurance - - 2 1 1 2 2
Total 10 10 10 10 10 13 11
* In 1983 and 2001 the actual number of companies was 13 and 11 respectively, instead of the ten speculated, since in
those years some companies appear in tenth position with the same degree.
Table 5. Top ten companies according to betweenness centrality by sector of activity
Sector of activity 1913 1927 1936 1960 1972 1983 2001
Manufacturing 2 2 1 2 4 4 2
Electrical power 2 3 4 2 - - 2
Energy - - - - - 1 -
Constructions - - - - - - -
Railway 2 - - - - - -
Transport - - - 1 - - 1
Telecommunications - - - - - 1 -
Banking 3 3 2 1 1 - 2
Finance - 2 1 3 4 4 1
Insurance 1 - 2 1 1 - 2
Total 10 10 10 10 10 10 10
7. Conclusions
This paper has analysed the structure of the Italian corporate network from 1913 to 2001 by
considering a sample of the top 250 companies by total assets for seven benchmark years and using
network analysis techniques.
This paper has shown that the system was very cohesive from 1913 to 1960. The connectivity
indexes remained substantially stable for the first four benchmark years; the highest values were
observed in 1927, when the influence of the larger German-type universal banks on the nation‟s
corporate system reached its apex. Conversely, the cohesion of the system started to decrease in

14
1972, after the nationalisation of the electricity industry and the first appearance of the ICT which
both contribute to mark a break-up of the institutional structures of the Italian corporate sector. The
fall in the degree of cohesion of the system became sharper in 1983 and 2001, when the
connectivity indexes plummeted to their lowest values, probably as a consequence of the full
emergence of the new technological trajectory of the third industrial revolution and of the transition
from fordism to post-fordism. Moreover, multiple ties became rarer and the inclusiveness of the
network sharply declined, with a strong increase of isolated firms.
Thus, Italy seems to have experienced an earlier decline in the cohesion of its corporate network
than other advanced economies – such as the USA, Germany, and Switzerland – where corporate
networks started to disentangle after 1980 with the major changes taking place during the 1990s and
2000s.
One major consequence of the massive privatizations that occurred in the 1990s was a return of
banks in a central position in the now weaker network from which they had disappeared in the
1930s. This come-back of the banking sector was favored by the 1990 banking law that
reintroduced universal banking in Italy. Another come-back to the centre of the system was that of
the electricity industry from which it had disappeared after the nationalization in 1962. The
privatizations missed the goal they purported: to give rise to North American-style public
companies in Italy. Instead, the privatizations had eventually the result to prompt a return to the
core of the system of two traditional actors of Italian capitalism: the banks and the electrical
companies. In this respect, the exemplary case was Edison: prior to the nationalization of the
electricity industry in 1962 Edison was the largest electrical company in Italy and always appeared
among the more central companies in our sample. Then in 1972 and 1983 it disappeared from the
dataset. Lastly, in 2001, after the privatizations, Edison returned among the more central companies.
Finally, we can observe that in the first four benchmark years nearly all the more central companies
in the Italian corporate network served principally or exclusively the domestic market: this was the
case for the universal banks and the electrical companies in 1913 and 1927, and for the electrical
companies and the major insurance and finance companies in 1936 and 1960. This can seem
paradoxical for an economy that is widely known as export-oriented.
In 1972 and 1983 the disappearance of the electrical companies and the entry of several
manufacturing companies among the top ten implied that for the first time a substantial proportion
of the central companies exported a remarkable part of their production. Maybe not by chance, the
entry of exporting companies among the more central companies of the Italian corporate network
occurred when the degree of openness (the ratio of the sum of total imports and exports to GDP) of
the Italian economy jumped from about 25% in the early 1960s to nearly 50% in the early 1970s
(Vasta 2010).
However, the situation was reversed in 2001: exporting companies were marginalised and, as a
consequence of the privatizations of the 1990s, a central position in the network was once again
occupied by the sectors that served mainly or exclusively the domestic market: banks, electricity,
telecommunications and insurance companies. The marginalization of exporting firms was also a
consequence of the fact that by the beginning of the XXI century nearly all large Italian
manufacturing companies had disappeared and now the exporting sector consisted nearly totally of
small and medium sized enterprises that were part of local networks constituted by firms that were
too small to be included in our sample.
So the reshaping and the further weakening of the Italian corporate network after the privatizations
of the 1990s seems to reflect the dualism of the Italian corporate system and the different dynamics
of its two components. On the one hand, there is the exporting sector, constituted principally by
small and medium-sized manufacturing firms operating in the sectors of the “Made in Italy”,
mechanical engineering and motor-vehicles, whose share in the nation‟s economy increased since
the 1980s but for which the declining importance of the domestic market decreased also the
importance of being inserted into a national corporate network. On the other hand, there is the
sector serving the domestic market, whose weight in the national economy has diminished over the

15
course of time but for which the integration in a national corporate network remains important. This
can explain the weakening of the network as a whole and the monopolization of the centre by
companies operating in the latter sector.

16
Appendix 1: Top ten companies according to degree centrality
1913
# Company Degree Sector of activity Ownership
1 BANCA COMMERCIALE ITALIANA 52 Banking P
2 SOCIETÀ BANCARIA ITALIANA 51 Banking P
2 SOCIETÀ ELETTRICA RIVIERA DI PONENTE ING. R. NEGRI 51 Electrical power P
4 SOCIETÀ ITALIANA PER LE STRADE FERRATE DEL MEDITERRANEO 45 Railway P
5 SOCIETÀ GENERALE ITALIANA EDISON DI ELETTRICITÀ 43 Electrical power P
6 ILVA 42 Steel P
7 A.E.G. THOMSON HOUSTON 41 Mechanical engineering P
8 BANCA D‟ITALIA 38 Banking P
9 CREDITO ITALIANO 35 Banking P
9 UNES UNIONE ESERCIZI ELETTRICI 35 Electrical power P
Legend: P Privately-owned.
1927
# Company Degree Sector of activity Ownership
1 BANCA COMMERCIALE ITALIANA 109 Banking P
2 SOCIETÀ ITALIANA PER LE STRADE FERRATE MERIDIONALI 89 Finance P
3 SOCIETÀ GENERALE ELETTRICA TRIDENTINA 85 Electrical power P
4 SOCIETÀ GENERALE ITALIANA EDISON DI ELETTRICITÀ 81 Electrical power P
5 ANSALDO 78 Manufacturing P
5 SOCIETÀ IDROELETTRICA PIEMONTE 78 Electrical power P
7 CREDITO ITALIANO 69 Banking P
8 CIELI COMPAGNIA IMPRESE ELETTRICHE LIGURI 67 Electrical power P
9 TERNI SOCIETÀ PER L‟INDUSTRIA E L‟ELETTRICITÀ 64 Electrical power P
10 GENERALE ELETTRICA DELLA SICILIA 63 Electrical power P
Legend: P Privately-owned.
1936
# Company Degree Sector of activity Ownership
1 SOCIETÀ ITALIANA PER LE STRADE FERRATE MERIDIONALI 63 Finance P
2 SME SOCIETÀ MERIDIONALE DI ELETTRICITÀ 59 Electrical power P
3 RAS RIUNIONE ADRIATICA DI SICURTÀ 56 Insurance P
4 SOCIETÀ GENERALE ITALIANA EDISON DI ELETTRICITÀ 54 Electrical power P
5 ASSICURAZIONI GENERALI 53 Insurance P
6 BANCA COMMERCIALE ITALIANA 50 Banking SO
7 ISTITUTO DI CREDITO PER LE IMPRESE DI PUBBLICA UTILITÀ 47 Long-term credit SO
7 CIELI COMPAGNIA IMPRESE ELETTRICHE LIGURI 47 Electrical power P
9 CREDITO ITALIANO 44 Banking SO
10 GENERALE ELETTRICA CISALPINA 43 Electrical power P
Legend: P Privately-owned, SO State-owned.
1960
# Company Degree Sector of activity Ownership
1 SOCIETÀ ITALIANA PER LE STRADE FERRATE MERIDIONALI 84 Finance P
2 RAS RIUNIONE ADRIATICA DI SICURTÀ 66 Insurance P
3 MONTECATINI SOCIETÀ GENERALE PER L‟INDUSTRIA MINERARIA E
CHIMICA 58 Chemicals
P
4 SOCIETÀ GENERALE ITALIANA EDISON DI ELETTRICITÀ 56 Electrical power P
5 SME SOCIETÀ MERIDIONALE DI ELETTRICITÀ 51 Electrical power P
6 FINSIDER SOCIETÀ FINANZIARIA SIDERURGICA 48 Finance SO
6 EDISONVOLTA 48 Electrical power P
8 FRANCO TOSI 47 Mechanical engineering P
9 STEI SOCIETÀ TERMOELETTRICA ITALIANA 44 Banking P
10 FINELETTRICA FINANZIARIA ELETTRICA NAZIONALE 42 Finance SO
Legend: P Privately-owned, SO State-owned.
17
1972
# Company Degree Sector of activity Ownership
1 RAS RIUNIONE ADRIATICA DI SICURTÀ 53 Insurance P
2 FRANCO TOSI 41 Mechanical engineering P
3 SNIA VISCOSA SOCIETÀ NAZIONALE INDUSTRIE APPLICAZIONI
VISCOSA 40 Chemicals
P
4 CREDITO COMMERCIALE 39 Banking P
5 ISTITUTO DI CREDITO PER LE IMPRESE DI PUBBLICA UTILITÀ 36 Long-term credit SO
5 MONTEDISON 36 Chemicals P
5 ITALGAS SOCIETÀ ITALIANA PER IL GAS 36 Energy SO
8 ITALSIDER 35 Steel SO
8 I.M.I. ISTITUTO MOBILIARE ITALIANO ROMA 35 Long-term credit SO
10 CEMENTERIE SICILIANE 33 Cement P
Legend: P Privately-owned, SO State-owned.
1983
# Company Degree Sector of activity Ownership
1 SNIA BPD 25 Chemicals P
2 EFIBANCA ENTE FINANZIARIO
INTERBANCARIO 22 Long-term credit
P
2 I.M.I. ISTITUTO MOBILIARE ITALIANO ROMA 22 Long-term credit SO
4 MONTEDISON 21 Chemicals P
4 FIAT AUTO 21 Motor vehicles P
6 RAS RIUNIONE ADRIATICA DI SICURTÀ 19 Insurance P
7 FIAT 17 Finance P
8 TEKSID 16 Steel P
9 ASSICURAZIONI GENERALI 15 Insurance P
9 ITALIMPIANTI SOCIETÀ ITALIANA IMPIANTI 15 Constructions SO
9 NUOVA ITALSIDER 15 Steel SO
9 IVECO FIAT 15 Motor vehicles P
9 ACCIAERIE E FERRIERE LOMBARDE FALCK 15 Steel P
Legend: P Privately-owned, SO State-owned.
2001
# Company Degree Sector of activity Ownership
1 OLIVETTI – ING. C. OLIVETTI & C. 18 Finance P
2 RAS – RIUNIONE ADRIATICA DI SICURTÀ 16 Insurance P
2 MEDIOBANCA – BANCA DI CREDITO FINANZIARIO 16 Banking P
2 TELECOM ITALIA 16 Telecommunications P
5 FINMECCANICA 15 Mechanical engineering SO
5 AUTOSTRADE – CONCESSIONI E COSTRUZIONI
AUTOSTRADE 15 Transport
P
7 ALLEANZA ASSICURAZIONI 14 Insurance P
8 INTERBANCA 12 Banking P
8 UNICREDITO ITALIANO 12 Banking P
8 TIM – TELECOM ITALIA MOBILE 12 Telecommunications P
9 WIND TELECOMUCAZIONI 12 Telecommunications P
Legend: P Privately-owned, SO State-owned.

18
Appendix 2: Top ten companies according to betweenness centrality
1913
# Company Value (x 100) Sector of activity Ownership
1 SOCIETÀ BANCARIA ITALIANA 7.03 Banking P
2 BANCA COMMERCIALE ITALIANA 6.17 Banking P
3 SOCIETÀ GENERALE ITALIANA EDISON DI ELETTRICITÀ 4.20 Electrical power P
4 BANCA D‟ITALIA 4.09 Banking P
5 SOCIETÀ ELETTRICA RIVIERA DI PONENTE ING. R. NEGRI 3.37 Electrical power P
6 ILVA 3.21 Steel P
7 SOCIETÀ ITALIANA PER LE STRADE FERRATE DEL MEDITERRANEO 3.05 Railway P
8 COTONIFICIO VENEZIANO 3.03 Cotton P
9 TORINESE DI TRAMWAYS E FERROVIE ECONOMICHE 3.00 Railway P
10 ITALIA SOCIETÀ DI ASSICURAZIONI MARITTIME FLUVIALI E TERRESTRI 2.66 Insurance P
Legend: P Privately-owned.
1927
# Company Value (x 100) Sector of activity Ownership
1 BANCA COMMERCIALE ITALIANA 8.25 Banking P
2 SOCIETÀ IDROELETTRICA PIEMONTE 4.81 Electrical power P
3 BANCA NAZIONALE DI CREDITO 3.82 Banking P
4 SOCIETÀ GENERALE ELETTRICA TRIDENTINA 3.50 Electrical power P
5 ANSALDO 3.34 Mechanical engineering P
6 SOCIETÀ ITALIANA PER LE STRADE FERRATE MERIDIONALI 3.33 Finance P
7 CREDITO ITALIANO 3.30 Banking P
8 COTONIFICIO VENEZIANO 3.28 Cotton P
9 SOCIETÀ GENERALE ITALIANA EDISON DI ELETTRICITÀ 2.68 Electrical power P
10 CONSORZIO DI CREDITO PER LE OPERE PUBBLICHE 2.42 Long-term credit SO
Legend: P Privately-owned, SO State-owned.
1936
# Company Value (x 100) Sector of activity Ownership
1 ASSICURAZIONI GENERALI 6.98 Insurance P
2 RAS RIUNIONE ADRIATICA DI SICURTÀ 4.66 Insurance P
3 SME SOCIETÀ MERIDIONALE DI ELETTRICITÀ 4.66 Electrical power P
4 SOCIETÀ GENERALE ITALIANA EDISON DI ELETTRICITÀ 4.35 Electrical power P
5 BANCA COMMERCIALE ITALIANA 4.22 Banking SO
6 SAN GIORGIO SOCIETÀ ANONIMA INDUSTRIALE 4.17 Mechanical engineering SO
7 SOCIETÀ ITALIANA PER LE STRADE FERRATE MERIDIONALI 3.99 Finance P
8 CREDITO ITALIANO 3.39 Banking SO
9 CIELI COMPAGNIA IMPRESE ELETTRICHE LIGURI 2.92 Electrical power P
10 GENERALE ELETTRICA CISALPINA 2.65 Electrical power P
Legend: P Privately-owned, SO State-owned.
1960
# Company Value (x 100) Sector of activity Ownership
1 SOCIETÀ ITALIANA PER LE STRADE FERRATE MERIDIONALI 9.78 Finance P
2 RAS RIUNIONE ADRIATICA DI SICURTÀ 4.49 Insurance P
3 MONTECATINI SOCIETÀ GENERALE PER L‟INDUSTRIA MINERARIA E
CHIMICA 4.12 Chemicals
P
4 FINSIDER SOCIETÀ FINANZIARIA SIDERURGICA 3.90 Finance SO
5 BANCA D‟AMERICA E D‟ITALIA 3.80 Banking P
6 SOCIETÀ GENERALE ITALIANA EDISON DI ELETTRICITÀ 3.79 Electrical power P
7 FIAT 3.43 Motor vehicles P
8 EFIBANCA ENTE FINANZIARIO INTERBANCARIO 3.21 Long-term credit P
9 STEI SOCIETÀ TERMOELETTRICA ITALIANA 2.93 Electrical power P
10 AUTOSTRADA CEVA-SAVONA 2.85 Transport P
Legend: P Privately-owned, SO State-owned.
19
1972
# Company Value (x 100) Sector of activity Ownership
1 RAS RIUNIONE ADRIATICA DI SICURTÀ 6.46 Insurance P
2 SNIA VISCOSA SOCIETÀ NAZIONALE INDUSTRIE APPLICAZIONI
VISCOSA 4.79 Chemicals
P
3 STET SOCIETÀ FINANZIARIA TELEFONICA 4.03 Finance SO
4 ISTITUTO DI CREDITO PER LE IMPRESE DI PUBBLICA UTILITÀ 3.99 Long-term credit SO
5 EFIBANCA ENTE FINANZIARIO INTERBANCARIO 3.91 Long-term credit P
6 I.M.I. ISTITUTO MOBILIARE ITALIANO ROMA 3.54 Long-term credit SO
7 MONTEDISON 3.54 Chemicals P
8 ITALSIDER 3.47 Steel SO
9 BP ITALIANA 3.17 Petrochemiclas P
10 BANCA CATTOLICA DEL VENETO 3.13 Banking P
Legend: P Privately-owned, SO State-owned.
1983
# Company Value (x 100) Sector of activity Ownership
1 MONTEDISON 9.97 Chemicals P
2 I.M.I. ISTITUTO MOBILIARE ITALIANO ROMA 8.99 Long-term credit SO
3 EFIBANCA ENTE FINANZIARIO INTERBANCARIO 7.25 Long-term credit P
4 MIRA LANZA 6.50 Chemicals P
5 SNIA BPD 6.19 Chemicals P
6 SIP SOCIETÀ ITALIANA PER L‟ESERCIZIO
TELEFONICO 5.66 Telecommunications
SO
7 E.N.I. ENTE NAZIONALE IDROCARBURI 4.86 Energy SO
8 STET SOCIETÀ FINANZIARIA TELEFONICA 4.40 Finance SO
9 FINMECCANICA SOCIETÀ FINANZIARIA
MECCANICA 4.25 Finance
SO
10 GRANDI MOTORI TRIESTE FIAT ANSALDO CRDA
GMT 3.99 Mechanical engineering
P
Legend: P Privately-owned, SO State-owned.
2001
# Company Value (x 100) Sector of activity Ownership
1 FINMECCANICA 8.10 Mechanical engineering SO
2 ALLEANZA ASSICURAZIONI 7.93 Insurance P
3 MEDIOBANCA – BANCA DI CREDITO FINANZIARIO 5.40 Banking P
4 EDISON 4.73 Electrical power P
5 OLIVETTI – ING. C. OLIVETTI & C. 4.26 Finance P
6 UNICREDIT BANCA MOBILIARE 4.22 Banking P
7 AUTOSTRADE – CONCESSIONI E COSTRUZIONI
AUTOSTRADE 4.20 Transport
P
8 SONDEL – SOCIETÀ NORDELETTRICA 3.94 Electrical power P
9 COMAU 3.76 Mechanical engineering P
10 RAS – RIUNIONE ADRIATICA DI SICURTÀ 3.31 Insurance P
Legend: P Privately-owned, SO State-owned.

20
REFERENCES
Aganin, A., and Volpin, P., “History of Corporate Ownership in Italy”, in R.K. Morck (ed.), A History of corporate
governance around the world: family business groups to professional managers (Chicago, 2005), pp. 325-361.
Amatori, F., “Il tormentato sviluppo della grande impresa industriale fra Stato e famiglie: il caso italiano in prospettiva
storica”, in G. Airoldi, F. Amatori and G. Invernizzi (eds), Proprietà e governo delle imprese italiane (Milan, 1995), pp.
241-252.
Armour, J., Deakin, S., Lele, P., and Siems, M.M., “How Do Legal Rules Evolve? Evidence From a Cross-Country
Comparison of Shareholder, Creditor and Worker Protection”, American Journal of Comparative Law, 57(3) (2009),
pp. 579-629.
Benedetti, E., and Toniolli, M., “Concentrazione industriale e potere di disposizione”, Rivista internazionale di scienze
economiche e commerciali, 10 (1963), pp. 633-652.
Berle, A.A., and Means, G.C., The Modern Corporation and Private Property (New York, 1932).
Bianchi, M., Bianco, M., and Enriques, L., “Pyramidal Groups and the Separation Between Ownership and Control in
Italy”, in F. Barca and M. Becht (eds), The Control of Corporate Europe (Oxford-New York, 2001), pp. 154-187.
Bianco, M., and Pagnoni, E., “I legami creati tra le società quotate dagli interlocking directorates: il caso delle banche”,
Quaderno di Moneta e Credito, March 1997, pp. 215-244.
Bianco, M., Drago, C., Giacomelli, S., and Santella, P., “Eleven Years of Intelocking Directorships in Italy: Who are
the Interlockers?”, mimeo Bank of Italy (Rome, 2009).
Bonelli, F., “Il capitalismo italiano: linee generali di interpretazione”, in R. Romano and C. Vivanti (eds), Storia
d’Italia Einaudi. Annali I. Dal feudalesimo al capitalismo (Turin, 1979), pp. 1195-1255.
Braendle, U.C., “Shareholder Protection in the USA and Germany - “Law and Finance” Revisited”, German Law
Journal, 7(3) (2006), pp. 257-278.
Carnevali, F., “State Enterprise and Italy‟s “Economic Miracle”: The Ente Nazionale Idrocarburi, 1945-1962”,
Enterprise & Society ,1 (2000), pp. 249-278.
Cerise, Rapporto finale dello Studio di fattibilità per: Dimensione e performance dell’impresa pubblica italiana (1993-
1991) (Siena, 2006).
Cgil, Struttura dei monopoli industriali in Italia (Rome, 1948).
Chandler, A.D., Scale and Scope (Cambridge, MA, 1990).
Chandler, A.D., Amatori, F., and Hikino, T., “Historical and comparative contours of big business”, in A.D. Chandler,
F. Amatori and T. Hikino (eds), Big Business and the Wealth of Nations (Cambridge, MA., 1997), pp. 3-23.
Chiesi, A.M., “L‟élite finanziaria italiana”, Rassegna italiana di sociologia, 23 (1982), pp. 571-595.
Chiesi, A.M., “Property, capital and network structure in Italy”, in F.N. Stokman, R. Ziegler and J. Scott (eds),
Networks of Corporate Power (Cambridge, 1985), pp.199-214.
Colli, A., and Vasta, M. (eds), Forms of enterprise in 20th
century Italy. Boundaries, structures and strategies
(Cheltenham, UK-Northampton, MA, 2010).
Davis, G.F., and Mizruchi, M.S., “The Money Center Cannot Hold: Commercial Banks in the U.S. System of Corporate
Governance”, Administrative Science Quarterly, 44(2) (1999), pp. 215-239.
De Nooy, W., Mrvar A., and Batagelj, V., Explanatory Social Network Analysis with Pajek (New York, 2005).
Felice, E., “State Ownership and International Competitiveness: The Italian Finmeccacnica from Alfa Romeo to
Aerospace and Defence (1947-2007)”, Enterprise & Society, 11 (2010), pp. 594-635.

21
Ferri, F., and Trento, S., “La dirigenza delle grandi banche e delle grandi imprese: ricambio e legami”, in F. Barca (ed.),
Storia del capitalismo italiano dal dopoguerra a oggi (Rome, 1997), pp. 405-427.
Grifone, P., Il capitale finanziario in Italia. La politica economica del fascismo (Turin, 1945).
Grossman, S.J., and Hart, O.S.D., “The costs and benefits of ownership: a theory of vertical and lateral integration”,
Journal of Political Economy, 94 (1986), pp. 691-719.
Hall, P., and Soskice, D. (eds), Varieties of capitalism: the institutional foundation of comparative advantage (Oxford,
2001).
Hilferding, R., Das Finanzkapital (München, 1910).
Höpner, M., and Krempel, L., “The Politics of the German Company Network”, Competition and Change, 8(4) (2002),
pp. 339-356.
Kreps, D.M., “Corporate culture and economic theory”, in J.E. Alt and K.A. Shepsle (eds), Perspectives on positive
political economy (Cambridge, 1990), pp. 90-143.
La Porta, R., Lopez de Silanes, F., and Shleifer, A., “Corporate Ownership around the World”, The Journal of Finance,
54 (1999), pp. 471-517.
La Porta, R., Lopez-de-Silanes, F., and Shleifer, A., “The Economic Consequences of Legal Origins.” Journal of
Economic Literature, 46(2) (2008), pp. 285-332.
La Porta, R., Lopez de Silanes, F., Shleifer, A., and Vishny, R.W., “Law and Finance”, The Journal of Political
Economy, 106 (1998), pp.1113-1155.
Luzzatto Fegiz, P., “Il consiglio di amministrazione e l‟interdipendenza delle imprese”, Giornale degli economisti, 43
(1928), pp. 197-231.
Milgrom, P., and Roberts, J., Economics, organization and management (Englewood Cliffs, 1992).
Ministero per la Costituente, Rapporto della commissione economica (Roma, 1947).
Mintz, B., and Schwarz, M., The Power Structure of American Business (Chicago, 1985).
Mizruchi, M.S., The American Corporate Network, 1904-1974 (Bervely Hills, 1982).
Pagano, M., and Volpin, P., “The Political Economy of Finance”, Oxford Review of Economic Policy, 17 (2001), pp.
502-519.
Pagano, U., and Trento, S., “Continuity and Change in Italian Corporate Governance. The Institutional Stability of One
Variety of Capitalism”, in M. Di Matteo and P. Piacentini (eds), The Italian Economy at the Dawn of the XXI Century
(Aldershot, UK-Burlington, VT), pp. 177-211.
Pennings, J.M., Interlocking Directorates (San Francisco/London, 1980)
Radar (pseud. of E. Rienzi), Organizzazione del capitale finanziario italiano (Roma, 1948).
Ragozzino, G., „Una mappa del grande capitale in Italia‟, Rassegna sindacale. Quaderni, 7 (1969), pp. 39-73.
Rajan, R., and Zingales, L., “The great reversals: the politics of financial development in the 20th
century”, Journal of
Finance Economics, 69 (2003), pp. 5-50.
Rienzi, E., “The distribution of share capital of Italian Banking Companies”, Banca Nazionale del Lavoro Quarterly
Review, 1 (1947-8), pp. 10-19.
Rinaldi, A., and Vasta, M., “The structure of Italian capitalism, 1952-72: new evidence using the interlocking
directorates technique”, Financial History Review, 12 (2005), pp.173-198.

22
Rinaldi, A., and Vasta, M., “State-owned enterprises in the Italian corporate network, 1972-1983”, Business and
Economic History On-Line, 7 (2009) (http://www.thebhc.org/publications/BEHonline/2009/rinaldiandvasta.pdf.)
Scott, J., “Theoretical framework and research design”, in F.N. Stokman, R. Ziegler and J. Scott (eds), Networks of
Corporate Power (Cambridge, 1985), pp. 1-19.
Scott, J., Social Network Analysis: a handbook (London, Newbury Park and New Delhi, 1991).
Toniolo, G., L’economia dell’Italia fascista (Bari, 1980).
Schnyder, G., Lüpold, M., Mach, A., and David, T., “The Rise and Decline of the Swiss Company Network during the
20th
Century.” Université de Lausanne, Institut d‟études politiques et internationals, Travaux de Science Politique,
Nouvelle Série, no. 22 (2005).
Siems, M.M., “Shareholder Protection Around the World („Leximetric II‟)”, Delaware Journal of Corporate Law, 33(1)
(2008), pp. 111-147.
Spamann, H., “On the Insignificance and/or Endogeneity of La Porta et al.‟s “Anti-Director Rights Index” under
Consistent Coding”. Harvard John M. Olin Center for Law, Economics, and Business Fellows‟ Discussion Paper
7/2006, Harvard Law School; ECGI Law Working Paper 67/2006, ECGI (2006).
Spamann, H., “The “Antidirector Rights Index” Revisited”, Review of Financial Studies, 23(2) (2010), pp. 467-486.
Toninelli, P.A., “Between state and market. The parabola of Italian Public enterprise in the 20th
century”, Entreprises et
histoire, 37 (2004), pp. 53-74.
Vasta, M., “Appendix: the source and the Imita.db dataset”, in R. Giannetti and M. Vasta (eds), Evolution of Italian
Enterprises in the 20th
Century (Heidelberg-New York, 2006), pp. 269-73.
Vasta, M. (2010), “Italian export capacity in a long run perspective (1861-2009): a tortuous path to stay in place”,
Journal of Modern Italian Studies, 15(1), pp. 133-156.
Vasta, M., and Baccini, A., “Banks and industry in Italy, 1911-36: new evidence using the interlocking directorates
technique”, Financial History Review, 4 (1997), pp. 139-159.
Wasserman, S., and Faust, K. (eds), Social Network Analysis. Methods and Applications (Cambridge, MA, 1994).
Windolf, P. (2010), “Germany, France and the US: A Statistical Network Anlysis (1900-1938)”, paper presented at the
international workshop “Corporate Networks in Europe during the 20th
Century”, Utrecht, 11-12 November 2010.
Wolfenzon, D., A Theory of Pyramidal Ownership, mimeo Harvard University (Cambridge, MA, 1998).
Zamagni, V., The Economic History of Italy 1860-1990. Recovery after Decline (Oxford, 1993).
Zerini, E. (pseud. of E. Rienzi), “L‟economia capitalistica e i vari aspetti delle egemonie economiche in Italia”, parts I,
II and III, Critica economica, 5, 6, 7 (1947), pp. 75-102, 108-142, 67-98.
Zorzini, M., “L‟organizzazione dell‟industria idro-elettrica in Italia”, Economia, 7 (1925), pp. 166-176.