Embed Size (px)
Citation preview
The Italian Data Buoy Network (RON)
M. Bencivenga1, G. Nardone1, F. Ruggiero2 & D. Calore2 1ISPRA - Italian Institute for Environmental Protection and Research, Rome, Italy 2Envirtech S.p.A., Venice, Italy
Abstract
The Italian Data Buoy Network consists of 15 oceanographic buoys, deployed along Italian coasts, on a seabed 100 meters deep. It collects directional sea wave data, meteorological data, sea surface temperature and in some cases quality parameters. Acoustic Doppler Current Profilers (ADCP) and hyperspectral probes will be added in the future. The network will be also the main framework for tsunami wave study in the central Mediterranean Sea, and an early technological platform to study low-frequency sea motion detected in open sea using high-precision, multichannel, multisatellite GPS/Glonass/Galileo receivers and sea bottom instrumentation equipped with nano-resolution pressure sensors. Keywords: data buoys, coastal management, directional wave measurement, gravity waves, physical oceanography, iSSH, SST, tide, tidal waves, tsunami.
1 Introduction
The Italian Data Buoy Network (RON) owned and managed by ISPRA, was completely redesigned by Envirtech in 2009 to acquire more oceanographic parameters and to increase nautical capabilities, reducing accidental buoy adrift events. The network goals comprise the Mediterranean Tsunami Assessment System (MeTAS) project. Since 1989, a network has been in place along Italian coasts, but this was only able to measure directional sea waves and sea surface temperature. It consisted of eight ‘slope-following’ Datawell Wavec buoys, and was called the Rete Ondametrica Nazionale (RON). It was a semi-real-time network with reduced capabilities in terms of prompt data accessibility, as only a small part of the collected data was available at the control centre. All data were stored at shore stations and manually downloaded on a quarterly basis using magnetic disks. In 1999, the number of buoys was increased to 10, introducing
www.witpress.com, ISSN 1743-3533 (on-line) WIT Transactions on Engineering Sciences, Vol 74, © 201 WIT Press2
doi:10.2495/AFM120291
Advances in Fluid Mechanics IX 321

two more Datawell Waverider buoys; furthermore, the data management system was centralised and upgraded to real-time. In 2002, all buoys were changed to ‘particle-following’ Triaxys, and the number of buoys was increased to 14. A new Control Centre architecture was introduced to maintain a stable, fault-tolerant SQL database to centralise all measures and to generate easier data access and processing. The Triaxys network was in place until 2009, when a completely renewed network was deployed based on 15 new Watchkeeper buoys, using the same sensor technology (Triaxys).
2 Network description
Figure 1 shows the buoys’ positions along Italian coasts.
Figure 1: Buoys’ location.
Buoys transmit data to shore stations within 15 NM and a small dataset via Inmarsat. All shore stations are connected to the control centre based in Rome, using 2 Mbps xDSL channels, implementing a virtual private network. Users can
www.witpress.com, ISSN 1743-3533 (on-line) WIT Transactions on Engineering Sciences, Vol 74, © 201 WIT Press2
322 Advances in Fluid Mechanics IX

access data via the Web, GTS, the Italian Broadcast Teletext Service (Rai-1 televideo) and via scheduled FTP uploads. At the control centre, a server array based on six quad-processors nodes, in a cluster configuration, processes and stores all data collected using a Microsoft SQL Server. Table 1 shows the shore stations names, the buoys’ positions and sea bottom depths.
Table 1: Buoys' coordinates and sea bottom depth.
BUOY
CODE
SHORE STATION
LATITUDE LONGITUDE Depth
(meters)
61207 CATANIA 37°26’24’N 15°08’48’E 90
61208 MAZARA 37°31’05’N 12°32’00’E 85
61209 PALERMO 38°15’30’N 13°20’00’’E 145
61210 CROTONE 39°01'25’N 17°13'12’E 80
61211 CETRARO 39°27’12’N 15°55’06’E 100
61212 SINISCOLA 40°37’00’N 09°53’30’E 130
61213 ALGHERO 40°32’55’N 08°06’25’E 85
61214 PONZA 40°52’00’N 12°57’00’E 115
61215 MONOPOLI 40°58’30’N 17°22’40’E 85
61216 CIVITAVECCHIA
42°14’41’N 11°33’14’E 62
61217 ORTONA 42°24’24’N 14°32’12’’E 72
61218 ANCONA 43°49'26’N 13°43'10’E 70
61219 LA SPEZIA 43°55’45’N 09°49’40’E 85
61220 VENEZIA 45°20’00’N 12°31’00’E 17
61221 CAGLIARI 39°06’54’N 09°24’18’E 150
2.1 Network goals
According to Shih [1], surface gravity waves provide the principle energy inputs related to many near-shore processes such as longshore currents, changes in beach profiles and the longshore transportation of sand. Further interest in coastal wave information comes from environmental managers, the engineering and scientific communities and maritime commerce. It has been found that surface wave observations and forecasts are usually one of the top three variables requested or used by marine users. The other two variables are surface winds and currents. Moreover, waves have number three priority under physical observations, following temperature and salinity.
www.witpress.com, ISSN 1743-3533 (on-line) WIT Transactions on Engineering Sciences, Vol 74, © 201 WIT Press2
Advances in Fluid Mechanics IX 323
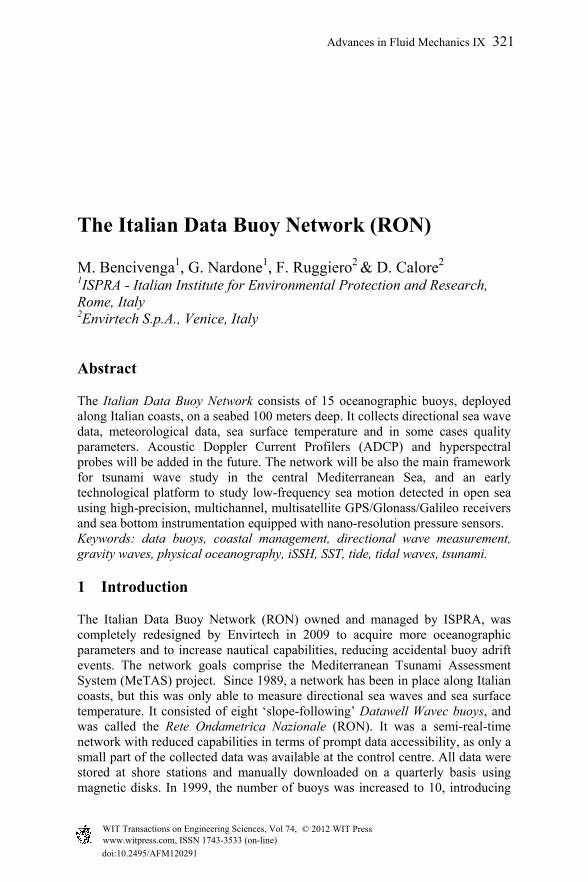
Figure 2: Network scheme.
www.witpress.com, ISSN 1743-3533 (on-line) WIT Transactions on Engineering Sciences, Vol 74, © 201 WIT Press2
324 Advances in Fluid Mechanics IX
Further applications include wave nowcast/forecast model verification, determining marsh restoration and shore erosion, hazardous material spill response, assessing coastal storm induced flooding, engineering design and construction, dredging, ship routing and scheduling, cargo loading and unloading and recreational boating. The new Italian Data Buoy Network was designed with the above-mentioned priorities in mind, and new buoys were acquired to implement the following measurements:
Directional sea waves High-accuracy Sea Surface Temperature (SST) and salinity Meteorological parameters like wind speed and direction, air
temperature and barometric pressure.
New buoys have been equipped with a special moon-pool to improve the implementation of quality multiparameter probes and Acoustic Doppler Current Profiler (ADCP). The redesign of the data management architecture, as well as the implementation of a shore station network that is well connected to the control centre located in Rome, will allow for the further increase of data buoys and sensors to monitor low-frequency sea motion, including infragravity waves, to be measured in open sea using GPS buoys and nano-resolution pressure transducers deployed on the sea bed. According to Webb et al. [2], tsunamis are large-amplitude infragravity waves generated by the displacement of the seafloor during earthquakes or because of landslides. Since 2002, after the Stromboli Volcano Tsunami Event, the authors started to project and build a new class of underwater modules, called the ‘Vulcan Class’, which are able to collect both high-resolution pressure data and seismic waves in real-time. The device was the leading part of the MeTAS project, after the Tsunami Event in the Indian Ocean. Figure 3 shows all the data that will be collected by the network within the next five years. At present, Surface Gravity Waves, SST and meteorological measurement data are being taken. By the end of the year, the first Envirtech MKIII buoy [3], for the study of very low frequency waves will be moored. At present, an MKI-2 [4] is under testing for tide measurements in open sea and biochemical data collection.
2.2 Nautical capabilities of buoys
After the first five years of network operation, it was clear that having four or five buoys off-mooring every year was acceptable in consideration of the very high level of fishing boat traffic. This means more or less one buoy adrift episode for each two buoys moored per year. Buoys adrift and vandalization are well recognized problems worldwide as reported by Teng et al. [5] and highlighted by the Data Buoy Cooperation Panel (DBCP). Unfortunately, the small dimensions of Triaxys and Waverider hulls did not fulfil the necessary nautical capabilities, taking into account the increased fishing boat traffic revealed during the first years of the 21st century. In 2001–2003, the
www.witpress.com, ISSN 1743-3533 (on-line) WIT Transactions on Engineering Sciences, Vol 74, © 201 WIT Press2
Advances in Fluid Mechanics IX 325

Physical
T/C in Water Column
Biochemical
Datawell WavecDatawell Waverider
Axys TriaxysAxys Watchkeeper
Envirtech MKI-2
Period 1-30 sec
Short PeriodLong Period
OPEN SEA measurement of very low frequency wavesEnvirtech GPS Buoy Or Envirtech MKIII Relay Buoy + Underwater Module(Vulcan, Poseidon or Calypso)
Period > 30 sec
Current in Water Column
Surface Gravity Waves
Axys WatchkeeperEnvirtech MKI-2
+ADCP
+T/C CHAIN
+Multiparameter Probe
+Hyper spectral underwater
radiometer
pH, Redox, Clorophyll, Turbidity, etc.
ITALIAN DATA BUOY NETWORK REAL-TIME OCEANOGRAPHIC MEASUREMENTS GOALS
MeteorologicalWind Speed, Direction, Air Pressure,
Temperature, Humidity, etc.
Figure 3: Network goals.
data buoy network, based on 15 Triaxys buoys, reported about 100 off-mooring cases (more than two adrift events per moored buoy per year), mainly due to fishing boats or acts of vandalism. As a consequence, the network produced a very low volume of data. To address this unplanned adrift rate, in 2005, experimentation began regarding the use of bigger buoys with good nautical capabilities in terms of stronger mooring and visibility, but with acceptable sea wave measurement accuracy at the same time. The Watchkeeper buoys from Axys were chosen. These buoys have proven hull visibility in any condition, and embed the same payload as Triaxys buoys. The experiment consisted of mooring a Triaxys buoy and a Watchkeeper buoy sufficiently close to one another and collecting the same data from both of them, which was sampled at 4 sps for one year.
www.witpress.com, ISSN 1743-3533 (on-line) WIT Transactions on Engineering Sciences, Vol 74, © 201 WIT Press2
326 Advances in Fluid Mechanics IX

The test showed acceptable compatibility in the period range of 2–15 seconds, and the new buoys were proposed as potential substitutes for Triaxys buoys in the network.
2.3 Data Buoys in the Italian Network
One of the very basic requirements of a data buoy network is to maintain as many buoys as possible in position for a long time to collect an uninterrupted, good-quality data series. This goal can easily be reached in sea water that is not crossed by too many fishing boats or vandals. Unfortunately, this is not the standard situation in Italian seas or, generally speaking, in Mediterranean coastal waters. Moreover, to collect an accurate sea wave series, it is mandatory to ensure that the buoy hulls are as small as possible. This further condition conflicts with the requirement of having good visibility (night and day) to avoid collisions, and is the main issue that needs to be addressed to create a stable data buoy network. To find the best performat buoy, in terms of accuracy and nautical capabilities, in the last 15 years, the authors have tested many buoys from different manufacturers. To better understand the differences between all available systems, the principal method of collecting directional sea wave data using buoys is now briefly described.
2.3.1 Slope-following buoys Heave-pitch-roll buoys such as the old Wavec and Fugro Oceanor Wavescan. Advantages: The buoys have great dimensions. This was the only available way to measure waves in open sea until the 1990s. Disadvantages: The hull and mooring system are expensive; accurate measurement requires that the buoy be designed to follow the water’s surface and ensuring that the accelerometer remains vertical. The cardanic suspension of the heave sensor could results in many mechanical faults as a consequence of impact during land transportation and small collisions at sea.
2.3.2 Small Particle-following buoys These include Waverider and Triaxys. Typically spherical shape; use a compliant mooring system; the Waverider sensing package consists of a gyroscopically stabilised platform, accelerometers (heave), surface slope (pitch and roll) and a compass. The Triaxys sensing package consists of accelerometers, rate gyros and a compass. Advantages: Less expensive; very high accuracy; widely used. Disadvantages: Susceptible to theft, vandalism and damage from shipping; could be overturned by steep breaking waves (this often occurs in shallow waters less than 8 m); accurate measurement requires that the buoy be designed to follow water particles; accuracy degrades in the very highest waves or short crest seas, and measuring nonlinear wave properties.
www.witpress.com, ISSN 1743-3533 (on-line) WIT Transactions on Engineering Sciences, Vol 74, © 201 WIT Press2
Advances in Fluid Mechanics IX 327
2.3.3 Big Particle-following buoys These include Watchkeeper and Envirtech Deep Sea MKI-2 buoys. To address the issues related to the small dimensions of Triaxys buoys, a class of medium displacement buoys has been developed (by Axys Canada and Envirtech Italy), embedding inertial platform sensors. In these buoys, the transfer function is very important to assure a good response in frequency over the classical frequency band; the hull shape also has a relevant impact on the accuracy of wave height measurement. To increase the accuracy of sea wave measurement, in 2000, Triaxys buoys were introduced to substitute for Datawell Wavec and Waverider buoys. As mentioned, Triaxys buoys, like the Datawell Directional Waverider buoys, the Watchkeeper and the Envirtech Deep Sea MKI-2, are ‘particle-following’ buoys that measure the water particle motion in three orthogonal directions. While Axys and Envirtech sensors work similarly to one another, the wave-measuring techniques of the Waverider are different. The Triaxys buoy uses three accelerometers to measure total accelerations along the mutually orthogonal X, Y, Z axes of the buoy; three angular rate sensors to measure rotation rates about the roll, pitch and yaw axes; and a gimbaled compass to measure sensor heading. An algorithm for a six-degrees-of-freedom non-linear equation of motion of the sensor and the Maximum Entropy Method (Kalman filter) are used to derive wave height and directional frequency spectra. In comparison, the Waverider buoy uses heave-pitch-roll sensors, two horizontal hull-fixed accelerometers and a compass to determine directional wave information. Starting in 2009, the new network has been composed of Watchkeeper buoys. In 2011, an Envirtech buoy, Deep Sea MKI-2, was introduced to the network to collect more sea water quality data and to test high-precision, multichannel, multisatellite receivers to implement instantaneous Sea-Surface Height (iSSH) measurement in open sea and to start a comparative test with the Watchkeeper buoys. The new buoy is in addition to the next deployment of Envirtech MKIII Tsunami Buoy, which have been built to study very low frequency sea motion within the MeTAS project, which began in 2005.
3 Directional wave data acquisition and processing
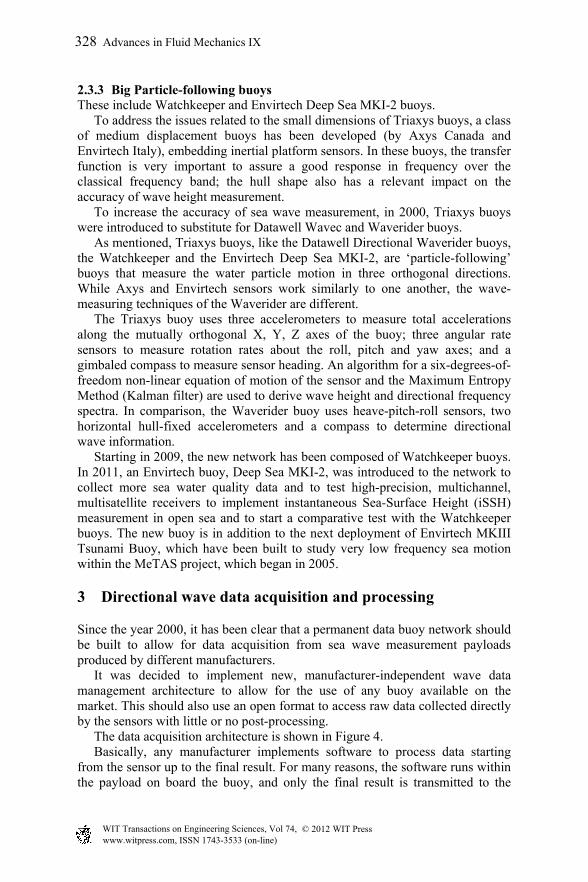
Since the year 2000, it has been clear that a permanent data buoy network should be built to allow for data acquisition from sea wave measurement payloads produced by different manufacturers. It was decided to implement new, manufacturer-independent wave data management architecture to allow for the use of any buoy available on the market. This should also use an open format to access raw data collected directly by the sensors with little or no post-processing. The data acquisition architecture is shown in Figure 4. Basically, any manufacturer implements software to process data starting from the sensor up to the final result. For many reasons, the software runs within the payload on board the buoy, and only the final result is transmitted to the
www.witpress.com, ISSN 1743-3533 (on-line) WIT Transactions on Engineering Sciences, Vol 74, © 201 WIT Press2
328 Advances in Fluid Mechanics IX
WaveMonitoring
Buoy(step 1)
On LandData Centre
(step 2)Sea waves
Absolute 3D Buoy displacements
Waves statisticalparameters
Figure 4: Data acquisition architecture.
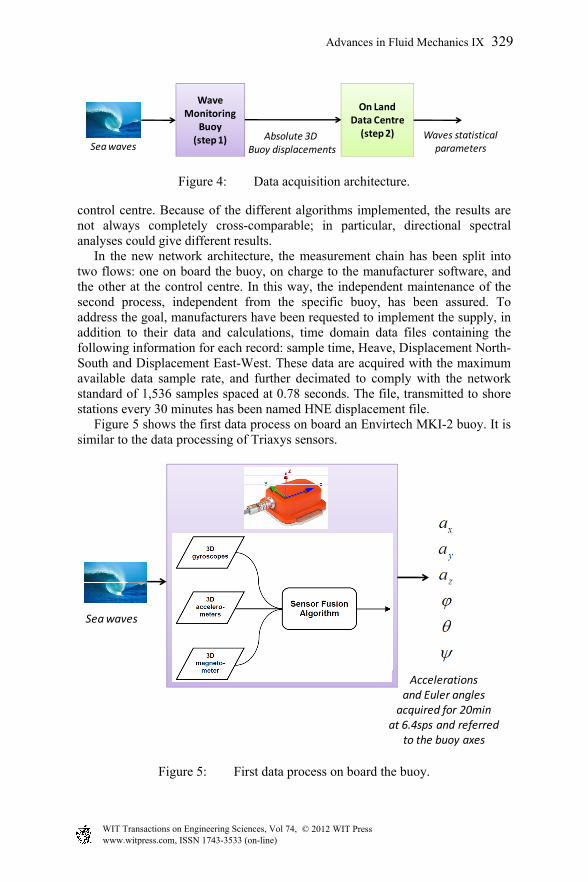
control centre. Because of the different algorithms implemented, the results are not always completely cross-comparable; in particular, directional spectral analyses could give different results. In the new network architecture, the measurement chain has been split into two flows: one on board the buoy, on charge to the manufacturer software, and the other at the control centre. In this way, the independent maintenance of the second process, independent from the specific buoy, has been assured. To address the goal, manufacturers have been requested to implement the supply, in addition to their data and calculations, time domain data files containing the following information for each record: sample time, Heave, Displacement North-South and Displacement East-West. These data are acquired with the maximum available data sample rate, and further decimated to comply with the network standard of 1,536 samples spaced at 0.78 seconds. The file, transmitted to shore stations every 30 minutes has been named HNE displacement file. Figure 5 shows the first data process on board an Envirtech MKI-2 buoy. It is similar to the data processing of Triaxys sensors.
Sea waves
Accelerationsand Euler anglesacquired for 20min
at 6.4sps and referred to the buoy axes
Figure 5: First data process on board the buoy.
www.witpress.com, ISSN 1743-3533 (on-line) WIT Transactions on Engineering Sciences, Vol 74, © 201 WIT Press2
Advances in Fluid Mechanics IX 329

The sensor is programmed to produce accelerometric samples (three accelerations and three Euler angles) with a rate of 6.4 sps. In the Italian network, 20 minute series are collected every 30 minutes. The technique used to produce a motion history from these data consists of the following steps:
Acquiring data for 20 minutes Preprocessing raw data (filtering, anti-spike, etc.) Finding the rotational matrix Finding the inertial accelerations Applying a mirror to the last samples to obtain a 2^N sample vector Applying the Hamming window Applying band-pass filtering in the frequency domain Double-integrating accelerations to obtain the motion history.
These steps are explained in detail in Figures 6 and 7.
Accelerationsand Euler anglesacquired for 20min
at 6.4sps and referred to the buoy axes
Inertial AccelerationsReferred to thesystem XYZ
X = East to WestY = North to SouthZ = Down to Top
Figure 6: Reference system transformations to get the inertial accelerations.
FFTInertial Accelerations
Pass Band filter(0.03Hz ..1Hz)
-1/ω2
Double Integrator
FFT of absolute displacements of the buoy
Reverse BuoyTransfer function
(to correct the amplitudeeffect at higher frequencies)
FFT-1
Decimation at 1/(0.78) Hzto get 1536 samplestime spaced of 0.78s
File HNE (1536 samplestime spaced of 0.78s)
Figure 7: Processing steps to get buoy displacements in the frequency domain, correction of buoy characteristic effect, passage to the time domain and decimation to get HNE data file.
www.witpress.com, ISSN 1743-3533 (on-line) WIT Transactions on Engineering Sciences, Vol 74, © 201 WIT Press2
330 Advances in Fluid Mechanics IX

3.1 Manufacturer-independent open architecture HNE processing
The next illustrations show the calculation chain implemented at the Control Centre, which is able to transform the above-mentioned HNE files received from the buoy each 30 minutes to the final statistical data output and directional power spectra. Modelling the HNE sequences as ergodic stochastic signals, it is possible to get related auto, cross and quadrature spectral correlations with the following relationships where
X ,Y and Z are the Fourier transformations of
the displacements in the HNE data file:
Fourier transforms
*ZZZZC
*XXXXC
*YYYYC
*XZZX REC
*YZZY REC
*YXXY REC
*XZZX IMQ
*YZZY IMQ
*YXXY IMQ Spectrum
correlations
The spectrum correlations allow us to get the typical waves statistical parameters with the following formulas:
SpectrumCorrelations
Tp corrisponds to thefrequency of the max Czz(ω)
Significant wave height HsAverage spetral period TmZero crossing period Tz
Peak Period Tp
Directional wave parametersEvaluation of frequency directional distribution Df(Ѳ)
The frequency directional distribution )(fD provides for each frequency
the wave probability distribution along the direction range [0, 2]. We refer to Kahama et al. [6] for the derivation of )(fD that assumes
)(/),()( fCfED zzf where ),( fE is the energy directional spectrum and
)( fC zz the elevation auto-spectrum also called energy density: it is possible to
get )(fD with the following approximation:
Spectrumcorrelations
www.witpress.com, ISSN 1743-3533 (on-line) WIT Transactions on Engineering Sciences, Vol 74, © 201 WIT Press2
Advances in Fluid Mechanics IX 331

The mean propagation direction for frequency band is obtained as:
))(/)(arctan()( 110 fafbf It is clear to the user that the energy directional spectrum ),( fE allows to
get all statistical parameters of the wave as function of the period and direction. It contains all information related to the wave data collected.
4 Conclusions
In this paper, the state-of-the-art Italian Data Buoy Network has been described, along with further improvements planned for the next five years. Collected data are accessible via GTS, Web [7] and Televideo-RAI teletext service [8]. The network capabilities will be extended to infragravity wave measurement and biochemical data gathering. The manufacturer-independent data processing algorithm implemented at the Control Centre in Rome was also described; this allows for experimentation on all devices available on the market while maintaining the legacy data structure.
References
[1] Shih, H.H., Triaxys Directional Wave Buoy for Nearshore Wave Measurements - Test and Evaluation Plan, NOAA Technical Report NOS CO-OPS 38, Silver Spring, Maryland, Jan 2003.
[2] Spahr C. Webb, X.Zhang, W.Crawford, Infragravity Waves in the Deep Ocean, Journal Of Geophysical Research, Vol. 96, No.C2, Pages 2723-2796, February 15, 1991.
[3] Envirtech Tsunami Warning System: Technical Specifications of Surface Buoy. Doc 20003-SPE-200.0 – Venice February 15, 2011, Envirtech S.p.A., Italy.
[4] Envirtech Deep Sea MKI-2 Directional Wave buoy – Technical Specification. Doc 21004-001.1 – Venice March 1, 2010 Envirtech S.p.A., Italy.
[5] C.C. Teng, S.Cucullu, S. McArthur, C. Kohler, B. Burnett, L. Bernard, Buoy Vandalism Experienced by NOAA National Data Buoy Center, June 2010, Office of Naval Research, 875 N. Randolph St., Arlington, VA 22203-1995.
[6] Kahma, Hauser, Krogstad, Lehner, Monbaliu, Wyatt, 2005. Measuring and Analysing Directional Spectra of Ocean Waves, COST Action 714, Bruxells.
[7] The Italian Data Buoys network web site: www.telemisura.it [8] Rete Ondametrica Nazionale, Pag. 719 – Televideo Rai-1.
www.witpress.com, ISSN 1743-3533 (on-line) WIT Transactions on Engineering Sciences, Vol 74, © 201 WIT Press2
332 Advances in Fluid Mechanics IX