Embed Size (px)
Citation preview

The Journal of AHRA: The Association for Medical Imaging Management
November/December 2016volume 38 number 6
Accounting Basics, Part 2: Justify Capital SpendingBy Jason C. Porter, PhD and Carole A. South-Winter, EdD, CNMT, RT, FAEIRS
A Team Approach for CT Protocol OptimizationBy Timothy P. Szczykutowicz, PhD and Myron Pozniak, MD
MRI Ferromagnetic Detector System: Fatigue StudyBy Ronald Bucci, PhD, Robert Ferguson, MD, Holly Frank, RT(M)
The Diagnostic Imagination in Radiology: Part 1By Rodney Sappington, PhD

3
contentsAccounting Basics, Part 2: Justify Capital SpendingBy Jason C. Porter, PhD and Carole A. South-Winter, EdD, CNMT, RT, FAEIRSThis article discusses how accounting numbers can be used to support a decision or make a recommendation to the management team. It focuses on a capital budgeting decision, but the basic principles are universal.
A Team Approach for CT Protocol OptimizationBy Timothy P. Szczykutowicz, PhD and Myron Pozniak, MDUsing several protocol change scenarios illustrates how combining the expertise of a radi-ologist, CT technologist, a medical physicist, schedulers, and IT personnel results in a better outcome for protocol optimization, management, and review.
MRI Ferromagnetic Detector System: Fatigue StudyBy Ronald Bucci, PhD, Robert Ferguson, MD, Holly Frank, RT(M)While a metal detection system is capable of reducing the number of incidents in which metal objects are brought into the MRI suite, technologists do become fatigued with the alarms in an MRI system and do not always consciously hear it.
The Diagnostic Imagination in Radiology: Part 1By Rodney Sappington, PhDIn radiology, machine intelligence has been extremely useful and built into just about every major technical innovation. But it has only been the last several years that a subfield of AI, machine learning, has begun to show remarkably fast development.
• f e a t u r e s
12
19
27
39
N o v e m b e r / D e c e m b e r 2 0 1 6 • v o l u m e 3 8 : 6
46 Index to Advertisers
47 The Marketplace
• d e p a r t m e n t s
Cover: CRA Alumni Reception at the 2016 Annual Meeting in Nashville, TN.

4
viewpoint 6
editorial 7
regulatory affairs 9
in the industry 17
workforce planning 25
coding 31
coding: ICD-10 37
on that note 48
contents• c o l u m n s
Servant LeadersDebra L. MurphyThe average patient may not appreciate the mountains you’re trying to move in helping to provide better quality, more affordable care.
More than Just One Week in NovemberPaul Dubiel, MS, RT(R), CRA, FAHRAAs another Rad Tech Week ends don’t forget that the celebration of what we do should be done every day.
Site Neutral Payments Coming for New HOPDs in 2017Bill Finerfrock and Nathan BaughHelp convince Congress and CMS that expanding the site neutral policy is bad for patients and bad for providers.
How to Market an IDTFR. Daniel Cinotto, MBAThe key is to remain compliant with anti-kickback and Stark laws, yet still provide an avenue to communicate services and differentiations.
Lean InMark LernerOne way to make sure that you are treating talented professionals as equivalents is to practice the behavior at home.
Oh No, New Codes!Melody W. Mulaik, MSHS, CRA, FAHRA, RCC, CPC, CPC-HThis year there are more changes for interventional services than regular diagnostic services, but they will impact every radiology organization.
ICD-10: COPDMelody W. Mulaik, MSHS, CRA, FAHRA, RCC, CPC, CPC-HCategory J44 (Other chronic obstructive pulmonary disease) includes a variety of obstructive airway conditions.
The Joint CommotionGordon Ah Tye, FAHRAIt always seems that the review is dependent on the temperament and personality of the surveyors.
The Journal of AHRA: The Association for Medical Imaging Management
November/December 2016 • Volume 38 Number 6
Editor-in-ChiefPaul Dubiel, RT(R), MS, FAHRA, CRADirector of ImagingSeton Family of HospitalsAustin, TX
AHRA Managing EditorDebra L. Murphy
DesignMary McKeon
ProductionCenveo® Publisher Services
AHRA Associate EditorKerri Hart-Morris
Editorial Review Board
viewpoint
Bill AlgeeRadiology ManagerColumbus Regional HospitalColumbus, IN
Kelly J. Bergeron, MHA, BS, RT(R)(MR), CRASr. Lead MRI Technologist Alliance HealthCare ServicesNew Hampshire
Kelly Firestine, BSRT(CT)(M), CRADirector of Clinical OperationsOutpatient Imaging AffiliatesFranklin, TN
Traci Foster, MSRA, CRA, RT(R)Assistant Director of Radiology Texas Children’s HospitalHouston, TX
Frances H. Gilman, DHSc, RT(R)(CT)(MR)(CV)Chair, Associate Professor Department of Radiologic SciencesThomas Jefferson UniversityPhiladelphia, PA
Margaret A. “Peggy” Kowski, PhD, DABR Physicist / OwnerNational Medical Physics PlusSt. Petersburg, FL
Carrie Stiles, BS, RT(R)(CT), CRAPatient LiaisonHouston Methodist HospitalHouston, TX
Elisabeth Yacoback, CRA, BSRT, CPHQ, CCAAdministrative AnalystMedical College Physicians GroupLittle Rock, AR
By Debra L. Murphy
Servant Leaders
By the time you read this, the presidential election will be behind us (FINALLY). As of this writing, however, the outcome is not yet known. If there’s one thing I do know for sure, though, it’s that the contentious, partisan mudslinging discourse will unfortunately not be behind us.
As a relative outsider to the medical imaging world (after all, this is your profession, I’m merely here to support you), I have some perspective that maybe the average American does not. And it’s optimistic. Because I know you, I sit in your conference sessions, I listen to your webinars, I talk to AHRA members every day on issues ranging from compliance and regulatory, to hospital wide restructurings, to physician relationships. I see how you treat your staff, hear how much you care about patients, but also know that sometimes you’re frustrated, overwhelmed, and just want to throw your hands up.
But you don’t. YOU are why I’m optimistic about healthcare in this country. Reform
and culture change take time (oh, man, so much time). And it requires tremendous education, and a willingness to collaborate with those you may not always agree with. It’s a tight rope walk between short term and long term thinking. Your average patient may not understand or appreciate the mountains you’re trying to move in helping to provide better quality, more affordable care, yet you still do the work. I believe that’s called servant leadership (“A philosophy and set of practices that enriches the lives of individuals, builds better organizations and ulti-mately creates a more just and caring world”).
So while you persist and give back to the communities in which you serve, my lofty hope is that Facebook newsfeeds morph back into pictures of babies and puppies, rather than aggravating political rants.
Contact Radiology ManagementAdvertising Sales
Kelly MillerM.J. Mrvica Associates, Inc.2 West Taunton AvenueBerlin, NJ 08009Phone: (856) 768-9360Fax: (856) [email protected]
Editor
Debra L. MurphyAHRA490-B Boston Post Road, Suite 200Sudbury, MA 01776Phone: (800) 334-2472, (978) 443-7591Fax: (978) [email protected]
Publication in Radiology Management does not constitute an endorsement of any product, service or material referred to, nor does publication of an advertisement represent an endorsement by AHRA or the Journal. All articles and columns represent the viewpoints of the author and are not necessarily those of the Journal or the Publisher.
Radiology Management is published 6 times each year (January, March, May, July, September,
and November) by AHRA. For information on subscriptions, contact: AHRA, 490-B Boston Post
Road, Suite 200, Sudbury, MA 01776; phone (978) 443-7591. For advertising and reprints, contact
M.J. Mrvica Associates, phone (856) 768-9360 or 2 West Taunton Avenue, Berlin, NJ 08009.
Subscriptions: Radiology Management is an official publication of AHRA. The annual subscrip-
tion is an integral part of the dues for members of the association. The fee for membership in AHRA is
$175.00 a year with a $25 initial application charge. For information on membership, contact AHRA
at the address above. A nonmember subscription rate is available at an annual cost of $100.00 within the
US, $115.00 within Canada, and $135.00 for other foreign countries. A year’s subscription covers the 6
regularly scheduled issues plus any special issues. All nonmember subscriptions must include payment
(payable to AHRA) with the request and should be forwarded to AHRA at the address above.
Change of Address: Notification should be sent to AHRA at the address above.
Copyright © 2016 by AHRA: The Association for Medical Imaging Management.
ISSN 0198-7097
N o v e m b e r / D e c e m b e r 2 0 1 6 r a D i o l o g y m a N a g e m e N t6
Deb Murphy is the Deputy Executive Director at AHRA. She is also managing editor of Radiology
Management and may be contacted at [email protected].

By Paul Dubiel, MS, RT(R), CRA, FAHRA
More than Just One Week in November
editorial
Before I began my career in healthcare, I used to think the holiday season started when the Macy’s Thanksgiving Day parade ended and Santa Claus was rid-ing down 5th Avenue. Right after that the first Christmas commercials would air with Santa Claus sledding down a hill on a Norelco electric razor. Once I became an x-ray tech I then thought the holiday season started the first week in November: Rad Tech Week. This com-memorated Wilhelm Roentgen taking the first x-ray of his wife’s hand. The proclamation about the first x-ray was usually followed by a sarcastic comment about his wife’s hand falling off, but everyone laughed and went on with the celebration. The week was usually filled with food from radiologists, hospitals, and in the good old days, vendors. You may have even gotten a small gift from administration and maybe a small blurb in the hospital newsletter or a mention in a hospital wide memo. As quickly as the week came with all its celebration and glory it was gone again and we were back to the daily grind of running around the hospital taking x-rays and making sure every study ordered was done to ensure all patients received the diagnosis and care they deserved.
Radiology back then, like most departments, was very compartmental-ized as we kept to ourselves, did our job, and did not really assimilate into the rest of the hospital. We did our jobs well, but we were more comfortable within our
own department, with our own people. After all, no one really understood what we did and how we did it. Reaction to our profession ran the gamut from fasci-nation when we would show a non imag-ing staff member an x-ray of a fracture or a barium filled colon, to condescending from some who thought of us as only button pushers or glorified photogra-phers. When I think back to those days we really did a disservice to our profes-sion and what we really meant to patient care by not promoting our skills as much as we should have. We have always done a great job with getting the study done no matter how hard or complicated it was to get, but we liked to do our jobs in relative obscurity—mostly keeping to ourselves—and liked it that way.
I write this not to point out the errors of our ways. There are plenty of examples of imaging being a bigger part of the patient process, but to point out that we now have a great opportunity to promote our profession and all we do to aid in patient care. In an industry strug-gling to find ways to meet productivity targets and cut expenses, it is imperative for us to be a part of the bigger picture in healthcare and raise up our departments and our profession to administration and to each other.
There are so many advancements in technology, new procedures to help diagnose and treat patients in a cost effi-cient way, and new regulations to help control the rising cost of healthcare and
reduce the amount of radiation patients receive. It is more important than ever to step up and become the subject matter expert to administration and help them understand what is necessary to con-tinue to survive and thrive in this ever changing environment. In addition to us working with administration to show our value, we need to work with our staff to get them to understand their role in patient care. No longer can we just sit in our departments, waiting for the patient to come to us, shoot the x-ray, then send the patient back.
Additionally, with the new empha-sis of patient satisfaction scores and HCAHPS we need to emphasize how imaging staff can have a positive effect on how patients and their families view the hospital and how they score us on our expertise and interpersonal skills. We need to be receptive to changing demands in healthcare. We need to engage in hospital wide programs to help improve patient satisfaction; we need to be part of changing the culture of not only our departments, but of all the departments. We need to be partners with each and every unit to figure out what are the best practices to take care of our patients and break down silos that have existed since that first x-ray was taken in the 1890s. We need to be open to new ideas no matter how counter to what we have always done before. We can no longer be just the imaging person taking advanced images of our patients.
7r a d i o l o g y m a n a g e m e n t n o v e m b e r / d e c e m b e r 2 0 1 6

We need to be vocal advocates and always ready to help both in the depart-ment and in the halls of the hospital. We are compelled to be more than just imag-ing techs—we have to be a part of the new culture needed to better serve both our patients and all our customers.
So as another Rad Tech Week ends and the holiday season begins, don’t forget that the celebration of what we do is not just one week a year—it is an every day celebration of the expertise, knowledge, and commitment of the imaging staff who serve all our custom-ers both internal and external. We must step up and out of the darkroom and be a part of the bigger picture and make a difference for our patients and their families.
Paul A. Dubiel, MS, RT(R), CRA, FAHRA has been the senior director, imaging at Seton Family of Hospitals in Austin, TX since 2002. An AHRA member since 1993, he is currently editor-in-chief of Radiology Management and has volunteered for numerous other task forces and committees. Paul can be contacted at [email protected].
editorial
n o v e m b e r / d e c e m b e r 2 0 1 6 r a d i o l o g y m a n a g e m e n t8
9r a d i o l o g y m a n a g e m e n t n o v e m b e r / d e c e m b e r 2 0 1 6
regulatory affairs
When Pope Francis spoke to Congress on September 25, 2015, no one predicted his visit would set into motion a chain of events that would eventually lead to significant changes in HOPD payment.
Just a day after the Pope spoke to Congress, Speaker John Boehner sent a shock through the political world when he announced that he would resign at the end October 2015. Boehner openly admitted that it was a personal goal of his to have the Pope address Congress, and saw the historic moment as an opening to resign on a high note. But Boehner’s resignation was more than achieving a personal goal, it was a concession to some of his fiercest critics in Congress and led directly to passage of a major budget bill that had been stalled for months.
Despite increasing opposition to his leadership from within the House GOP Caucus, Boehner wanted to complete a budget agreement prior to his departure. He essentially had two choices:
1. Pass a budget package that fiscal con-servatives liked, only to have it vetoed by the President or die in the Senate and risk the political fallout of default-ing on the debt; or
2. Strike a budget deal with Democrats, avoid default, and try to get some con-cessions on spending limits in exchange.
As we now know, Boehner chose the second option.
The budget package, formally known as the Bipartisan Budget Act of 2015, passed the House 266-167 with over two-thirds of Republicans voting against it, and the Senate 64-35 with 35 Repub-licans voting against it. President Obama signed the bill into law on November 2, 2015 just one day before the Treasury Department estimated that the Federal Spending would surpass the debt limit.
While many in the national media focused on the long term fiscal impact of the budget deal, little attention was paid to a provision that for the first time established what has come to be known as “site neutral payment” policy.
For months leading up to the budget deal, many members of Congress and the Medicare Payment Advisory Com-mission (MedPAC) had been expressing concern about the growing trend for hos-pitals to purchase physician practices and have them certified as off-campus hos-pital outpatient departments (HOPDs). Several media outlets had done stories in 2015 about physician offices being purchased by hospitals, converting to HOPDs, and charging Medicare double or triple what that practice charged for a service when it was “physician owned.”
Table 1 provides an example of the financial impact on the technical com-ponent of selected imaging procedures being changed from the Physician Fee Schedule Technical Component (PFS TC)
based payment to the Hospital Outpatient Prospective Payment System (HOPPS) rate for an off-campus hospital outpatient department.
In response to the growing pressure to do something about this, the Bipartisan Budget Act of 2015 included a provision (section 603) which states that any off-campus HOPD established after Novem-ber 2, 2015 is ineligible for payment under the HOPPS beginning January 1, 2017. Instead, these facilities will be paid under the Physician Fee Schedule (PFS) or, in the case of a surgery facility, the Ambulatory Surgical Center (ASC) Payment System.
Because PFS and ASC payments are typically lower than HOPPS payments, it is estimated that calendar year 2017 Medicare Part B expenditures will be $330 million lower than previously estimated.
A February 2016 letter released by the House Energy and Commerce Com-mittee provides some of the rationale behind this new policy: “In principle, the Medicare program should pay the same amount for the same service, regardless of the setting in which it is provided, unless payment differentials are justifiable by differences in patient mix, provider mis-sion, or other justifiable factors.”1
AHRA, along with many hospital and hospital-affiliated organizations, opposed this site neutral policy and maintain that the payment differential is justifiable.
Site Neutral Payments Coming for New HOPDs in 2017By Bill Finerfrock and Nathan Baugh

n o v e m b e r / d e c e m b e r 2 0 1 6 r a d i o l o g y m a n a g e m e n t10
regulatory affairs
Congress likely understood the myriad operational and technical complications such a policy would create and, there-fore, deliberately chose not to prohibit the movement or expansion of excepted off-campus PBDs in any way.
Future OutlookThis is not the last we will hear about Congressional efforts to adopt a site neutral approach to Medicare payment policy. It is a certainty that proponents of a site neutral policy will push to pro-hibit all off-campus HOPDs from billing under the HOPPS payment model. They will likely seek to require these sites to bill using the PFS or ASC.
AHRA and others will continue to oppose expansion of the “site neutral” policy and will notify members of how they can help convince Congress and CMS that expanding the site neutral policy is bad for patients and bad for providers.
References1Upton F, Pallone F. Committee on Energy
and Commerce letter to Member of the Health Care Community. February 5, 2015. Avai lable at : ht tp : / /energy commerce.house.gov/sites/republicans.energycommerce.house.gov/files/114/ Letters/20160205SiteNeutralLetter%5 B1%5D.pdf. Accessed October 5, 2016.
2Centers for Medicare & Medicaid Services. 42 CFR Parts 416, 419, 482, 486, 488, and 495. July 14, 2016. Available at: https://s3.amazonaws.com/public-inspection. federalregister.gov/2016-16098.pdf. Accessed October 5, 2016.
Bill Finerfrock is the president and owner of Capitol Associates, a government relations/consulting firm based in Washington, DC, who has partnered with AHRA on their regulatory affairs issues. Nathan Baugh is an associate with CAI. They can be contacted at [email protected] and [email protected].
CMS, the agency sought public comment on a proposal to expand the new law to prohibit certain grandfathered HOPDs from billing under HOPPS in the future. Specifically, CMS has proposed revoking the grandfathered status of a pre-existing off-campus HOPDs if the HOPD relo-cates or expands.
In the proposed rules, CMS explains their rationale:2
“…[we] are concerned that if we propose to permit excepted off-campus [provider-based departments] PBDs to relocate and continue such status, hospitals would be able to relocate excepted off-campus PBDs to larger facilities, purchase additional phy-sician practices, move these practices into the larger relocated facilities, and receive OPP payment for services furnished by these physicians, which we believe section 603 of Pub. L. 114-74 [Bipartisan Budget Act of 2015] intended to preclude.”
If CMS adopts this interpretation, any grandfathered off-campus PBD that relocates from the physical address listed as of November 2, 2015 would lose the ability to receive HOPPS rates.
AHRA, in comments to CMS, strongly disagreed with the Agency’s interpreta-tion of Congressional intent. There is no language in the Bipartisan Budget Act of 2015 that would prohibit an excepted or “grandfathered” off-campus PBD from moving or expanding. We argued that
Implementation of Site Neutral Payment PolicyThe most important detail to note is that HOPDs billing for services before November 2, 2015 are grandfathered in and will still receive payments according to HOPPS. It should also be noted that Congress is considering a change to the effective date so that facilities “under construction” at the time Section 603 was enacted would also be grandfathered. As of the writing of this article, the legislation modifying the grandfather clause has not been enacted but was slated for consid-eration during the November/December 2016 “lame duck” session of Congress.
Although the site neutral policy adopted as part of the Bipartisan Budget Act of 2015 is limited to “new” facilities, those favoring a site neutral payment policy do not feel Section 603 went far enough. MedPAC and many influential members of Congress will continue to press to expand the site neutral policy for all sites of service as noted in the Energy and Commerce Committee letter.
Next StepsNow that the policy is the law of the land we must turn our attention to how it will be implemented by CMS. In a proposed rule issued earlier this year by
TABLE 1. Financial Impact on the Change from PFS to HOPPS
HCPCS Code Description PFS TC
HOPPS Rate
71020 Chest X-ray $16.83 $60.80
72147 MRI Chest/Spine $232.73 $454.32
70450 CT Head/Brain $73.40 $112.49
76700 Ultrasound abdomen $83.07 $153.58
73120 Hand X-ray $17.54 $100.61
70551 MRI Brain Stem $156.46 $272.83
72127 CT Neck/Spine $208.02 $235.95

Part one of this series walked through some basic accounting termi-nology and logic that can help a new imaging administrator feel more com-fortable with these sometimes stress-ful terms. This article will discuss how accounting numbers can be used to sup-port a decision or make a recommen-dation to the management team. The discussion will focus on a capital budget-ing decision, but keep in mind that the basic principles, just like those explained in part one, are universal. These meth-ods can be used to help justify growing (or shrinking) staff, extending hours, adding a new procedure, creating a ser-vice line, and many other things. Also, the methods and definitions here should also help with the accounting reports and forms administrators have to ana-lyze or create each period for senior management.
While most imaging administrators focus their attention on big decisions, such as the purchase of an MR, let’s start out with something small to help illus-trate the basics. In the emergency depart-ment (ED) of a large hospital it’s noticed that moving trauma patients all the way to radiology, several floors away, for images is slowing things down, causing added pain and discomfort for patients and frustrating providers. Because of the
increased volume of business that has been experienced in the ED, it is pro-posed to executive administration that a dedicated portable x-ray machine and digital reader be purchased for use in the ED. How is that done?
Step 1: Non-Financial SupportThe first step is to go through the “quali-tative” or non-financial reasons sup-porting the purchase. While accountants might start with the numbers, managers will do a better job with the other steps if they have the other justifications of the argument ready to go first. In this case, there are three main non-financial rea-sons to purchase this machine: 1) it will speed up emergency treatments by hav-ing radiology nearby that can take these crucial images without having to move the patient several floors up and down; 2) it will reduce the stress and workload on ED staff to have the technologist right in the ED taking the needed images; and 3) it will save patients discomfort and embarrassment if they don’t have to be moved up and down hospital floors or wait for long periods for results. Now that there are qualitative reasons, the argument needs to move on to the “quantitative” or numerical reasons sup-porting the purchase.
By Jason C. Porter, PhD and Carole A. South-Winter, EdD, CNMT, RT, FAEIRS
Accounting Basics, Part 2: Justify Capital Spending
The credit earned from the Quick CreditTM test accompanying this article may be applied to the
CRA fiscal management (FM) domain.
• Making and justifying capital expendi-tures can be a difficult part of a supervi-sory or managerial position. Under-standing some basic tools for making estimates and calculating values can help simplify this process.
• Breaking down some of the most com-mon accounting methods into a six-step, intuitive process allows everyone, even those with little or no accounting background, to use and understand the results of these tools.
• Accounting tools can seem complex when they are first used, but after walk-ing through them step-by-step and practicing them, they can become an essential tool in working with execu-tives and other administrators.
ExEcutivE Summary
N o v e m b e r / D e c e m b e r 2 0 1 6 r a D i o l o g y m a N a g e m e N t12

Step 2: Gather Up-Front Cost InformationThe second step is to gather information about the costs of purchasing and prepar-ing to use the equipment. In this exam-ple, after doing some careful research which may include contacting a vendor, it’s found that the new, portable x-ray machine and digital reader that would work best would cost about $115,000. There would also be an additional pay-ment of $5,000 for training to make sure that the ED radiology technologist staff is fully trained on this particular model. Overall, then, $120,000 would be needed immediately to purchase the new x-ray machine and digital reader.
Step 3: Gather Annual Financial InformationThe third step is to gather information about the costs and revenues of using the equipment each year. Let’s start with the costs in the example. There are really only three recurring or annual costs for a new x-ray machine. Use the assumption that two technologists could be transferred from the existing department to ED (since they would no longer need to be on-call 24 hours in that department if all emergency x-rays could be done in the ED). How-ever, one more new technologist would be needed, and that individual would be paid a base salary of $45,000 with benefits (401k savings, health insurance, vacation, etc) of another $15,000. The second cost will be the insurance on the machine, covering maintenance and any breakage. In this, the cost will likely be $3,000 per month for a total cost of $36,000 per year. The third is the cost for each x-ray that is taken. For an x-ray, that’s not very much now that everything is digital, but assume that it will cost about $3/x-ray to steril-ize the equipment and get it ready for the next patient. If the assumption is that in a large ED about 30 x-rays a day will be taken, then the cost for the year will be $32,850 ($3 per x-ray, times 30 x-rays per day, times 365 days per year).
Now switch to the revenues or cash flows that can be expected from the new machine. This part is a little more chal-lenging because there are two parts. The first is figuring out how much the facility expects to be paid for each of the 10,950 x-rays. Now, there are a lot of different types of x-rays that can take be taken, and each one will be billed to each patient dif-ferently. In a formal analysis, all of these different types of x-rays and the billing for each one would need to be listed out, and then have to be broken down again into patient fee, insurance fee, Medicare fee, and Medicaid fee. It can get to be a lot of numbers. For now, to keep it sim-ple, assume that the base price, paid by the patient without any insurance cover-age, is $250 and about 15% of the x-rays (1,643) will be for this group. That means $410,750 will be received from this group (1,643 × $250).
The second group is those who are insured. Assume that 30% of the x-rays would go to this group. The contractual adjustment with the insurance compa-nies drops the price from $250 to $188, which gives a total revenue from the insurance group of $617,580 ($188 × 3,285). The third group is those under Medicare. With the assumption that only $113 would be received for those x-rays, and they account for 35% of the x-rays being taken, this group would provide an annual inflow of $433,129. The final group is covered under Med-icaid. Assume that reimbursement is only $45 for this group and that 12% of the x-rays would fall into that category, giving an annual inflow of $59,130. The rest of the x-rays (the 8% not accounted for) are those that probably won’t pay or that are incorrectly billed or coded so no payment will be received because of mistakes. It’s important to include an estimate for that group, since it does reduce what will actually be received in cash inflows each year.
If all of that is added up, the annual cash inflows will be over $1,520,589 with the new x-ray machine and digital reader. If that much new revenue is going to be made by only spending $120,000
upfront and about $129,000 each year after that, then this is going to be the easiest sell to management! Except for one minor detail. We won’t actually make new revenues of $1,520,589 each year with the new machine. Some of these procedures would have been done anyway in the normal radiology depart-ment, and money can’t be counted that replaces income from another depart-ment. Only the inflows that are new can be counted—those that the doctors wouldn’t have ordered from the in-house radiology department. That’s a much smaller number, both of patients and of revenues. Table 1 shows the cash flow numbers for just the new procedures. Notice that a small adjustment was also added for the cost savings from radiol-ogy. Any patient that is helped with the portable x-ray machine will not have to go to the fixed x-ray machine, saving the cost of sanitizing the fixed equipment. If the larger machine costs $6 to sani-tize, then $32 per procedure is saved ($6 from the older fixed machine; $3 from the portable machine).
Our last part of Step 3 is to get “net” cash flows or profits for each year. In this case it would cost $128,850, but $164,162 in new revenues would be brought in and $3,264 would be saved annually using the new machine instead of the old machine. The net effect is net cash inflow of $38,567 per year. That’s not nearly as impressive as $1,392,000, but it’s still a positive number year and don’t forget that there are significant qualita-tive reasons for the new machine and the initial cost isn’t that much, so there is still a chance of getting this new equipment.
Step 4: Estimating Final Costs or Revenues The fourth step is to estimate any costs or savings at the end of the equipment’s useful life. Changes in technology, nor-mal wear and tear, legal compliance, and many other reasons will keep a facility from using any new equipment indefi-nitely. So, it has to be estimated how long
r a D i o l o g y m a N a g e m e N t N o v e m b e r / D e c e m b e r 2 0 1 6 13

N o v e m b e r / D e c e m b e r 2 0 1 6 r a D i o l o g y m a N a g e m e N t14
Accounting Basics, Part 2: Justify Capital Spending
the equipment can be used before it has to be upgraded or changed to another type of machine completely. When that change is made, another analysis will be done on the new equipment that is purchased, so that isn’t a concern at this point. However, the portable x-ray machine being considered now will need to be disposed of when a replacement is purchased in several years. How much will that cost? Can it be sold to another facility that doesn’t have the resources for brand new equipment? Will any funds be received from recycling or a government program? All of those costs need to be estimated as part of getting a complete picture of the costs and inflows associ-ated with the new machine.
For the example, assume that such a small piece of equipment would be donated to a smaller facility or to a chari-table program after five years. The cost would be very small, only about $100 in shipping fees.
Step 5: Pulling it All Together The fifth step is to pull all of the assump-tions and information together in a for-mat that is easy to read. Taking time to gather and present the information in a table or graph serves three purposes. First, it ensures that nothing is forgotten.
Going back through the estimates and values lets the manager think about the process one more time. In doing so, the manager will often remember some item that was forgotten or will realize that an estimate was not as accurate as it could have been. Second, it gets the informa-tion ready for presenting to the board or executives that will be making the deci-sion to approve the proposal. Third, it highlights ideas that aren’t feasible, demonstrating that the numbers are so bad for some ideas that it isn’t worth the fight to propose it, allowing political capital to be saved for another idea that has a better chance. For all of these rea-sons, take a bit of time to create a form that is easy to read and looks nice, like in Table 2.
Step 6: Calculating Payback PeriodFor many people, the temptation at this point is to just add up the cash values in the table and come to the conclusion that this is a bad idea. After all, a loss or net cash outflow of $81,524 doesn’t sound like a good idea. A donor who would cover that negative amount might be found, but it would certainly be diffi-cult to convince management to invest in new equipment that will have a nega-tive effect on the bottom line, especially since a decent profit is probably being made on the current machine. Why spend money on a new one, even with all of the qualitative reasons for wanting the new machine (improved patient care, reduced wait time, etc)?
taBLE 1. Cash Flow
Payment category
inflow per Procedure
Estimated Number of New Procedures
total New inflows
Patient $250 177 $44,250
Insurance $188 355 $66,740
Medicaid $113 414 $46,782
Medicare $45 142 $ 6,390
Total Payments from New Customers 1,088 $164,162
Cost Savings with New Machine $3 1,088 $3,264
Total Annual Inflows and Savings $167,426
taBLE 2. Final Form
Description cash amount year
Purchase Equipment ($115,000) 2017
Training on Equipment ($5,000) 2017
Annual Revenues $164,162 2017–2021
Annual Cost Savings $3,264 2017–2021
Annual Costs ($128,850) 2017–2021
Shipping Equipment ($100) 2021

Here, again, some basic accounting concepts can actually help. First, below is a combination of one-time costs and annual cash flows. The $120,000 will be paid out in initial costs this year, but almost $38,600 will be received back in net cash savings each year:
Annual Inflows and Savings
$167,426
Annual Cost ($128,850)
Net Profit or Cash Flows
$38,576
One of the best ways to account for these differences is a simple accounting technique called the “Payback Period.” The payback period is a quick estimate of how long it will take to pay back the initial cash outflows, to repay the hos-pital or company for the investment they’ve been asked to make. To calculate the payback period, take the total initial cash outflows and divide by the annual net profit. For the example in this article, the new x-ray machine would pay for itself in a little over three years and the hospital would have the money back to invest in another project:
Total Initial Outflow
= Payback PeriodAnnual Inflows and Savings
$120,000= 3.11
$38,576
One of the best things about using payback period as a way to justify a deci-sion or recommendation is that it is sim-ple to calculate. This simplicity allows an organization to quickly evaluate multiple projects in a very short amount of time, ranking them by how quickly they would return the invested funds and allowing a quick initial cut of unrealistic projects before doing a more detailed analysis. In addition, this simple method is easy to understand and use, especially for those who are just starting to develop their accounting skills.
ConclusionIncreasing comfort with numbers and accounting methods empowers admin-istrators to more effectively support requests for funding, but it doesn’t stop there. Becoming comfortable with these terms and methods will also provide the ability to more effectively support other requests for resources and will allow a greater understanding of the many forms to fill out and evaluate each period. In addition, developing accounting skills will, hopefully, enable a better under-standing of why these forms need to be filled out and analyzed. Demystifying the accounting process and increasing flu-ency in “CFO” speak increases effective-ness and contribution to the healthcare administrative team.
Part 3 of this series will take the pro-cess a step further. Now that the basic information has been gathered and orga-nized, the discussion will center on how to use more accurate methods to evalu-ate and support decisions. As proficiency with these tools and methods increases, so will confidence in effectively support-ing the department, as well as creating better outcomes for patients and the community.
Jason Porter, PhD is an associate professor of accounting at the University of South Dakota. During the past eleven years, he has taught a variety of accounting courses and has received numerous teaching awards, including the Outstanding Accounting Faculty Award and the College of Business and Economics Teacher of the Year Award from the University of Idaho. His scholarship includes articles helping students and professionals better understand the accounting cycle and the budgeting process, ways to effectively assess student learning, methods to effectively perform budgeting and variance analysis, and examples for understanding and applying new accounting rules. Jason can be contacted at [email protected].
Carole South-Winter EdD, CNMT, RT, FAEIRS is an assistant professor of Health Services Administration in the Beacom School of Business at the University of South Dakota. She served for 13 years as program director of one of the largest nuclear medicine technology programs in the United States, as the interim Director of Education for the AHRA, Executive Director for Reclaiming Youth International, and Director of a free standing radiation therapy center
and continues to serve as annual meeting planner for AEIRS. Dr. South-Winter has been active with many societies and organizations dealing with administration, education, global health care and imaging sciences and continues to lecture and write at local, state, national, and international levels. She can be contacted at [email protected].
r a D i o l o g y m a N a g e m e N t N o v e m b e r / D e c e m b e r 2 0 1 6 15

N o v e m b e r / D e c e m b e r 2 0 1 6 r a D i o l o g y m a N a g e m e N t16
QuestionsInstructions: Choose the answer that is most correct. Note: Per a recent ARRT policy change, the number of post-test questions has been reduced from 20 to 8.
1. Qualitative factors used in business decision making include all of the following except:a. Stress and moraleb. Financial costc. Patient-centered cared. Time management
2. the annual cost of operations can be determined using which of the following equations?a. Cost of equipment X staffing salaryb. Cost of each procedure X staff costsc. Cost of each procedure X staff costs X number of
proceduresd. None of the above
3. Revenues or cash inflows are complicated in health services administration due to which of the following elements?a. Fixed equipment costsb. Radiologic and imaging technologist staffing shortagec. High radiation protection costsd. Payer mix
4. When determining cash inflows for a new equipment purchase it is important to identify which of the following information?a. How much new income will come in from using the
equipment b. Cost of staff already working for the department that
might use the equipmentc. How the equipment will be transported around the
departmentd. Whether the employees will work the day or night shift
5. When making a purchase decision: a. Positive new revenue is the deciding factorb. Positive net cash flow is the deciding factorc. Negative cash flow is the deciding factord. Positive net cash flow and compelling qualitative factors
are the deciding factors
6. Reasons preventing the use of any new equipment indefinitely include all of the following except:a. Changes in technologyb. Normal wear and tearc. Staff utilization ratiod. Legal compliance
7. Preparing a formal table or graph summarizing the results of the accounting analysis serves which purpose?a. Ensures that nothing is forgottenb. Gets the information ready for presentation to executivesc. Highlights ideas that are not feasibled. All of the above
8. using a payback period allows an organization to quickly evaluate multiple projects in a short amount of time, ranking them by how quickly they would return the invested funds and allowing a quick initial cut of unrealistic projects before doing a more detailed analysis.a. Trueb. False
Continuing Education
Accounting Basics, Part 2: Justify Capital Spending
Home-Study Test
1.0 Category A credit • Expiration date 12-31-18
Carefully read the following multiple choice questions and take the post-test at AHRA’s Online Institute (www.ahraonline.org/onlineinstitute)
The credit earned from the Quick CreditTM test accompanying this article may be applied to the
AHRA certified radiology administrator (CRA) fiscal management (FM) domain.

For those of us in the IDTF (independent diagnostic testing facility) world, we are constantly bombarded with two words: marketing and compliance. Often times we, as administrators, can find ourselves in a marketing position, as well, so it’s important to know the ins and outs, in addition to being able to impart that wisdom upon the marketers who work for us. The million dollar question here is how do we market our facility’s ser-vices in a manner that is compliant with anti-kickback and Stark laws, yet still provides us an avenue to communicate our services and differentiations when compared to a hospital based radiology provider or another IDTF? At face value, the answer is not readily apparent.
First, it is necessary to understand what an IDTF is and why they came about. The American College of Radi-ology notes they have been in existence since 1998 and defines an IDTF as a “diagnostic testing facility (entity) that is independent of a physician office or hospital; ie, it is not owned by a hospital, individual physician or group practice of physicians and its purpose is to fur-nish diagnostic tests and not to directly use test results to treat a patient.”1 Most IDTFs are privately owned, which can allow them to compete on price against a hospital system and allows patients to take advantage of cash pay discounts, which have served a growing market for nearly two decades.
How do we market this when it takes more than a smile and a handshake to get in the front door of a physician’s office, as any seasoned marketer will tell you? In fact, certain industry research has claimed that more than half of healthcare providers in the United States have now restricted representatives’ access to their clinics in some fashion, making those providers infinitely harder to connect with.2 If you read industry publications on the topic you will likely find a list of marketing activities and then a verdict as to whether or not they are compliant. This type of content is beneficial to some, but ultimately provides no real working framework for the marketer who is out in the field making real time decisions in regards to compliance day in and day out. They just tend to say ‘you will probably be ok’ or ‘be careful with this.’
There are a few constants that exist in this murkiness, however, that allow some room to maneuver and swim towards the ultimate goal of the almighty physi-cian referral. The first is the law of the “compliance land.” Typically, standalone IDTFs do not have compliance depart-ments constantly reminding them of how much they can spend on a given physi-cian per year (2016 Stark Law update dictates $392 per physician of non-monetary compensation), so it is impor-tant to keep track.3 Some will do so in a spreadsheet, CRM platform, or expense tracking software, but it is ultimately up
to the tools available to you. We also need to be cognizant of anti-kickback laws. Essentially, we cannot incentivize a patient or physician to come to us, so any quid pro quo scenario is out of the question. That’s the bad news.
The good news is that if you have a solid understanding of these two funda-mental things, the water tends to clear up a bit, and you can focus on getting creative with marketing efforts. A solid way to do this is to remember the phrase “educational component.” As long as you have an educational component to whatever it is you are doing, it ceases to be an incentive. For example, say you want to introduce a new PACS viewing application to a physician group, who is essentially “no see,” in order to boost your referrals, but they will only allow you to bring in an “afternoon snack.” At face value this water is murky because it may seem like they asked you for the snack (which would be an incentive), which in theory they did and that is a big no-no. The reality is that you are asking if you can come in and present the appli-cation and your snack just happens to be ice cream on the first 100 degree day of the summer (if you time it right, you can be a hero…). This is the exact rea-son why independent physician practices have “lunch/snack” calendars. Some of those practices only open them once a year, too! A good habit to get into when you start to encounter these is to look
How to Market an IDTF
in the industry
r a d i o l o g y m a n a g e m e n t n o v e m b e r / d e c e m b e r 2 0 1 6 17
By R. Daniel Cinotto, MBA

in the industry
n o v e m b e r / d e c e m b e r 2 0 1 6 r a d i o l o g y m a n a g e m e n t18
image quality, quality of the interpreta-tion, and things of the like because the next question is typically “compared to what?”
Marketing and sales within the healthcare space, and especially in radi-ology, is an ever changing environment. You have to walk a fine line sometimes, and it is always best to err on the side of caution, but in the IDTF world, it’s a fight for every referral received. Each one is another win worth celebrating.
References1American College of Radiology. “Indepen-
dent Diagnostic Testing Facilities.” Avai lable at : http://www.acr .org/Advocacy/Economics-Health-Policy/Billing-Coding/Coding-Source-List/2004/May-June-2004/Independent-Diagnostic-Testing-Facilities. Accessed October 17, 2016.
2ZS Associates. “Crossing the threshold: More than half of physicians restrict access to sales reps.” September 2, 2015. Available at: http://www.zsassociates.com/about/news-and-events/crossing-the-threshold-more-than-half-of-physicians-restrict-access-to-sales-reps.aspx. Accessed October 3, 2016.
3Centers for Medicare & Medicaid Services. “CPI-U Updates.” Available at: https://www.cms.gov/medicare/fraud-and-abuse/physicianselfreferral/cpi-u_updates.html. Accessed October 3, 2016.
R. Daniel Cinotto is the Director of Facility Operations for FirstScan MRI, located in Omaha, NE, and has years of experience in marketing IDTF’s and managing sales teams. FirstScan MRI is a provider of bpMRI for early detection of prostate cancer. Daniel can be contacted at [email protected].
It can also tell you where to focus mar-keting efforts. Most subsets of IDTF referring physicians seem to come from a 3-5 mile radius relative to the location. Unless you are a highly specialized pro-vider (ie, cancer screening, breast/wom-en’s imaging, etc), physicians are likely to refer patients to whomever is the closest to either the patient’s home or the phy-sician’s office. A good rule of thumb is that you will have a higher success rate the closer the physician is to the facility.
Cost is a tricky thing to talk about because every patient’s coverage is differ-ent, and therefore the out of pocket for the patient will vary with every patient that walks in the door. Conversations typically then tend to steer into the “who are you in network with” arena. Those conversations are great and necessary, but they do not really differentiate you from anyone else. There is a quick and easy way to benchmark this and estab-lish your facility as the low cost provider in the area: a discounted cash pay price. Cash pay patients are a fraction of the patient base these days, but it gives the physician and the patient a concrete number to keep top of mind. This can add credibility to your claims of being a low cost provider.
Quality is a very complicated and seemingly subjective thing to discuss with referring physicians, especially when using it as a marketing tool. When discussing quality, it is crucial to high-light two components: the quality of the equipment and the quality of the staff. If you’re marketing MRI, it is frequently said that not all MRIs are created equal and they are made up of and differ on three things: strength of the scanner, strength of the technologist, and strength of the radiologist. Strength of the scanner is objective, so fire away. All else being equal, a 3 Tesla magnet will beat out a 1.5 Tesla magnet every time. Strength of technologist and radiologist are a bit more complicated because these can be subjective claims. If you can quantify something (years of experience, a unique fellowship, etc) you should be okay. It is advisable to stay away from things like
at who else is coming in. You can time your presentations after the competition and highlight your differentiation from them. What you will undoubtedly find frustrating is the reoccurrence of phar-maceutical rep presentations, sometimes at a frequency of once per month. They tend to have the budget to pull this off, but it does beg the question of “how close are they getting to that $392 of non-monetary compensation” by doing 12 lunches a year? The answer seems to be a mystery.
Now that we have a really good idea of what you can and cannot do, let’s talk about some specific things that you can do to boost your referral volume. As an IDTF it is important to understand how you are different from hospital based radiology providers. The number one thing to remember is that IDTFs tend to be more “service” based. The top prior-ity has to be service and comfort to the patient. Your patients have chosen your facility over a variety of other options, so it is important to reaffirm their deci-sion. It is also good to remember that your patients do not necessarily want to be at your facility in the first place. They are there because they have to be. This does not go so far as to say that hospital based providers are not concerned with the patient’s experience, but given their environment, it is not possible to provide certain things that IDTFs can. That’s why IDTFs exist at all. From front door park-ing to more aesthetically pleasing waiting areas, it all matters. If your patient has a good experience, they are going to tell the physician, and also likely other family and friends. Word of mouth and reputa-tion really can impact referral volume. It can also do just as much damage.
Now that your facility is set up and conducive to the patient’s comfort, what can you talk to your referring physicians about to earn those patient referrals? There are three things that set your facil-ity apart from other IDTFs and hospital providers: location, cost, and quality.
The location of the facility can play an important role in not only who refers to you, but how much they refer to you.

Recent guidelines published by the American Association of Physicists in Medicine (AAPM), the American College of Radiology (ACR), and The Joint Commission require that changes made to CT protocols are reviewed and executed with input from a radi-ologist, a CT technologist, and a medi-cal physicist.1-4 For many, this is a new hurdle. Although not formally discussed in the literature, anecdotally we have learned from colleagues at many institu-tions that changes are often made “at the scanner” by only one or two of the three required participants. For example, dur-ing an ACR mandated protocol review, the medical physicist and radiologist may meet at the scanner and change protocols. Or protocols may be changed solely by a CT technologist to facilitate a change in workflow related to a network-ing (PACS) destination change. Usually with the arrival of a new scanner, most sites will defer to the vendor application specialist who may or may not talk with the radiologist and then adjust a preex-isting set of protocols to accommodate the new scanner’s capabilities.
The purpose of this article is to dem-onstrate why the previously mentioned practices are not optimal and indeed prone to unexpected outcomes. We will demonstrate this using several protocol
change scenarios to illustrate how com-bining the expertise of a radiologist, CT technologist, a medical physicist, sched-ulers, and IT personnel would result in a better outcome for protocol optimi-zation, management, and review.5-9 In addition to the expert focus each of these individuals brings to the table, combin-ing their individual skill sets into a CT protocol optimization team results in an organizational structure with a greater likelihood of successfully developing an acceptable protocol set.
Having a system for disseminating protocol changes to all scanners within one’s institution and educating CT technologists and radiologists on these changes is not a trivial task. This is espe-cially true for centers with multiple scan locations, and varying practice models and/or equipment. Therefore, while it may be true that a team of radiologists, CT technologists, and medical physicists can develop a protocol change, it is not a given that they would then be capable of disseminating that change in a well-documented manner to all scanners within the CT fleet of their enterprise.10-11 And then they would have to deal with the challenge of communicating that change to all imaging team members including other technologists and radi-ologists, schedulers, IT personnel, and
By Timothy P. Szczykutowicz, PhD and Myron Pozniak, MD
A Team Approach for CT Protocol Optimization
The credit earned from the Quick CreditTM test accompanying this article may be applied to the
CRA operations management (OM) domain.
19r a d i o l o g y m a n a g e m e n t n o v e m b e r / d e c e m b e r 2 0 1 6
• This article demonstrates that using sev-eral protocol change scenarios to illus-trate how combining the expertise of a radiologist, CT technologist, a medical physicist, schedulers, and IT personnel would result in a better outcome for protocol optimization, management, and review.
• While a team can develop a protocol change, it is not a given that they would then be capable of disseminating that change in a well-documented manner to all scanners within the CT fleet of their enterprise. Several scenarios are used to demonstrate these complexities and interrelationships.
• Costs associated with protocol manage-ment are discussed. While teamwork and FTEs are quantifiable, the cost of failing to carry out these tasks is harder to quantify.
ExEcutivE Summary
imaging mangers. This is essential for exam uniformity, which ultimately serves as the foundation for diagnostic confidence of their radiologists.
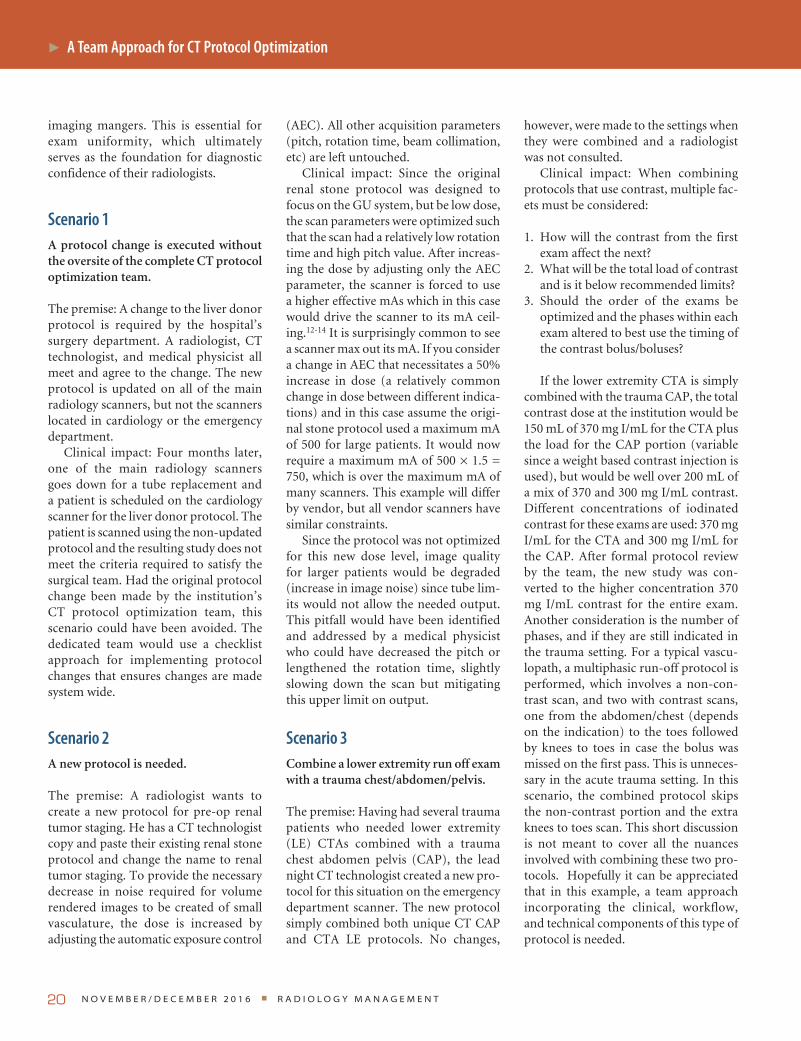
Scenario 1A protocol change is executed without the oversite of the complete CT protocol optimization team.
The premise: A change to the liver donor protocol is required by the hospital’s surgery department. A radiologist, CT technologist, and medical physicist all meet and agree to the change. The new protocol is updated on all of the main radiology scanners, but not the scanners located in cardiology or the emergency department.
Clinical impact: Four months later, one of the main radiology scanners goes down for a tube replacement and a patient is scheduled on the cardiology scanner for the liver donor protocol. The patient is scanned using the non-updated protocol and the resulting study does not meet the criteria required to satisfy the surgical team. Had the original protocol change been made by the institution’s CT protocol optimization team, this scenario could have been avoided. The dedicated team would use a checklist approach for implementing protocol changes that ensures changes are made system wide.
Scenario 2A new protocol is needed.
The premise: A radiologist wants to create a new protocol for pre-op renal tumor staging. He has a CT technologist copy and paste their existing renal stone protocol and change the name to renal tumor staging. To provide the necessary decrease in noise required for volume rendered images to be created of small vasculature, the dose is increased by adjusting the automatic exposure control
(AEC). All other acquisition parameters (pitch, rotation time, beam collimation, etc) are left untouched.
Clinical impact: Since the original renal stone protocol was designed to focus on the GU system, but be low dose, the scan parameters were optimized such that the scan had a relatively low rotation time and high pitch value. After increas-ing the dose by adjusting only the AEC parameter, the scanner is forced to use a higher effective mAs which in this case would drive the scanner to its mA ceil-ing.12-14 It is surprisingly common to see a scanner max out its mA. If you consider a change in AEC that necessitates a 50% increase in dose (a relatively common change in dose between different indica-tions) and in this case assume the origi-nal stone protocol used a maximum mA of 500 for large patients. It would now require a maximum mA of 500 × 1.5 = 750, which is over the maximum mA of many scanners. This example will differ by vendor, but all vendor scanners have similar constraints.
Since the protocol was not optimized for this new dose level, image quality for larger patients would be degraded (increase in image noise) since tube lim-its would not allow the needed output. This pitfall would have been identified and addressed by a medical physicist who could have decreased the pitch or lengthened the rotation time, slightly slowing down the scan but mitigating this upper limit on output.
Scenario 3Combine a lower extremity run off exam with a trauma chest/abdomen/pelvis.
The premise: Having had several trauma patients who needed lower extremity (LE) CTAs combined with a trauma chest abdomen pelvis (CAP), the lead night CT technologist created a new pro-tocol for this situation on the emergency department scanner. The new protocol simply combined both unique CT CAP and CTA LE protocols. No changes,
however, were made to the settings when they were combined and a radiologist was not consulted.
Clinical impact: When combining protocols that use contrast, multiple fac-ets must be considered:
1. How will the contrast from the first exam affect the next?
2. What will be the total load of contrast and is it below recommended limits?
3. Should the order of the exams be optimized and the phases within each exam altered to best use the timing of the contrast bolus/boluses?
If the lower extremity CTA is simply combined with the trauma CAP, the total contrast dose at the institution would be 150 mL of 370 mg I/mL for the CTA plus the load for the CAP portion (variable since a weight based contrast injection is used), but would be well over 200 mL of a mix of 370 and 300 mg I/mL contrast. Different concentrations of iodinated contrast for these exams are used: 370 mg I/mL for the CTA and 300 mg I/mL for the CAP. After formal protocol review by the team, the new study was con-verted to the higher concentration 370 mg I/mL contrast for the entire exam. Another consideration is the number of phases, and if they are still indicated in the trauma setting. For a typical vascu-lopath, a multiphasic run-off protocol is performed, which involves a non-con-trast scan, and two with contrast scans, one from the abdomen/chest (depends on the indication) to the toes followed by knees to toes in case the bolus was missed on the first pass. This is unneces-sary in the acute trauma setting. In this scenario, the combined protocol skips the non-contrast portion and the extra knees to toes scan. This short discussion is not meant to cover all the nuances involved with combining these two pro-tocols. Hopefully it can be appreciated that in this example, a team approach incorporating the clinical, workflow, and technical components of this type of protocol is needed.
A Team Approach for CT Protocol Optimization
n o v e m b e r / d e c e m b e r 2 0 1 6 r a d i o l o g y m a n a g e m e n t20

21r a d i o l o g y m a n a g e m e n t n o v e m b e r / d e c e m b e r 2 0 1 6
Scenario 4Change protocol location on scanner.
The premise: A well-intentioned CT technologist moves the cervical spine and lumbar spine protocols to the chest region of the protocols. This way all the spine protocols (cervical, thoracic, and lumbar) can be together to help tech-nologists find them.
Clinical impact: While a change like this seems harmless, it will affect any downstream mapping that uses protocol name. For example, ACR DIR mapping links protocols names to Radlex playbook identification numbers. This will also affect on-site dose monitoring solutions; if the change is reflected in the proper mapping tables, the dose alert for this pro-tocol may be compromised and default to a generic non protocol specific value. It is also possible that image quality will be adversely affected simply due to moving a protocol’s location on the scanner. This is because some vendors link certain image processing/artifact correction features to anatomical sites on a scanner. This is highly vendor dependent and consulta-tion with a physicist or applications spe-cialist would be needed to determine if this factor needs to be considered.
Scenario 5Decrease slice thickness.
The premise: During an ACR mandated protocol review the radiologist informs the physicist that they would like thin ~0.5 mm by ~0.25 mm axial recon-structions to be made in addition to the regular images for the upper extremity CTA (run-off) protocol. The radiolo-gist argues this would aid in identifying
small calcifications on the non-contrast phase of the exam. The physicist agrees to make the changes before leaving the site by adding another reconstruction to the protocol.
Clinical impact: The addition of thin slices to this protocol, which commonly covers a very long z-axis scan range, increased the total number of images for the study by several thousand. The first patient scanned using this protocol cre-ated too many images for the institution’s PACS system to send in one push and the study could not be properly sent to PACS. Had a CT technologist been involved with this change, this could have been avoided as the CT technologist could have alerted the technologist pool to a vendor specific work around to avoid this problem.
Scenario 6Change in beam energy to optimize image dose.
The premise: A CT physicist notices that two phases of an adrenal gland protocol are at the same beam energy. The first is a portal venous phase and the sec-ond a delayed phase. The CT physicist, knowing that lower kV can be used for angiographic imaging, lowers the beam energy for the venous phase relative to the delayed phase.14
Clinical impact: Using the same kV in this case was by design. The venous phase is not a true angiographic phase. Since clinical decisions that character-ize adrenal masses rely on CT num-ber changes between the different scan phases, an effort should be made to ensure no extraneous factors could influ-ence CT number between the phases.15 In this case, a change in beam energy will change the CT number regardless of the
contrast uptake and washout properties of any suspect lesions. In other words, the radiologist is now faced with the task of differentiating if the measured change in tumor CT number is truly due to the properties of the tumor or erroneously affected by the beam energy change. The physicist should have consulted with the radiologist and understood the true intent of these multiple phases
Costs Associated with Protocol ManagementTeamwork, operating within a set of rules defining what and how the team should practice, would have avoided all the issues discussed in this article. This cooperation, however, does come at a cost. One study reported spending 57 person hours reviewing and optimizing a single routine head protocol spending an estimated $12,488.7 It is estimated that a single cycle of protocol evaluation covering four scanners and 30 protocols per scanner would cost $165,836. Our own CT protocol optimization team employs a lead radiologist at 20% FTE, five section lead radiologists each at 5% FTE, three CT physicists totaling 150% FTE, a lead CT technologist at 40% FTE, a project manager at 15% FTE, a quality management radiologist at 20% FTE, and IT support for 7% FTE costing the institution over $200k per year.5 The cost of failing to carry out these tasks, however, is probably harder to quan-tify. One would expect an institution not documenting their protocols or pro-tocol changes to have more radiologist to scanner room phone calls asking for additional/modified reconstructions. Technologists who lack detailed scan instructions or who are asked to perform exams that were not reviewed by their lead CT technologist may take longer to per-form scans. Improper protocol changes may even lead to scan time errors requir-ing repeat scanning. Part of the cost associ-ated with implementing a robust protocol management system will also come from
Teamwork, operating within a set of rules defining what
and how the team should practice, would have avoided
all the issues discussed in this article.
n o v e m b e r / d e c e m b e r 2 0 1 6 r a d i o l o g y m a n a g e m e n t22
scanner down time needed while entering protocols. At our institution, we try to per-form this task after hours, but sometimes we do block the scanner during the day, especially when a new CT scanner arrives. Protocol entry in our system requires at least one check after entry, which adds additional time but is needed when so many parameters are entered.5,6
ConclusionThe intention of these scenarios was to demonstrate the complexities and inter-relationships in diagnostic CT scanning. The guidelines put forth by societies and accrediting bodies should not be regarded as mandating unreasonable goals. Requiring protocol review by experts in the clinical workflow, and technical aspects of imaging equipment, should not be considered as another box on a compliance form.
References1Cody DD, Fisher TS, Gress DA, et al. AAPM
medical physics practice guideline 1. a: CT protocol management and review practice guideline. Journal of Applied Clinical Medical Physics. 2013;14(5).
2Kofler JM, Cody DD, Morin RL. CT protocol review and optimization. Journal of the American College of Radiology. 2014;11.3: 267–270.
3American College of Radiology. Accreditation Standards (CT). Updated 2016. Available at: http://www.acraccreditation.org/Modalities/CT. Accessed September 22, 2016.
4Joint Commission Diagnostic Imaging Standards. Updated August 10, 2015. Available at: http://www.jointcommission.org/diagnostic_imaging_standards/. Accessed September 22, 2016.
5Szczykutowicz TP, et al. “Compliance with AAPM Practice Guideline 1. a: CT Protocol Management and Review—from the perspective of a university hospital.” Journal of Applied Clinical Medical Physics. 2015;16:2.
6Szczykutowicz TP, Siegelman J. On the same p a g e — p h y s i c i s t a n d r a d i o l o g i s t perspectives on protocol management and review. Journal of the American College of Radiology. 2015;12(8):808–814.
7Siegelman JR, Gress DA. Radiology steward-ship and quality improvement: the process and costs of implementing a CT radiation dose optimization committee in a medium-sized community hospital system. Journal of the American College of Radiology. 2013;10(6):416–422.
8Trattner S, Pearson GD, Chin C, et al. Standardization and optimization of CT protocols to achieve low dose. Journal of the American College of Radiology . 2014;11(3):271–278.
9Zhang D, Savage CA, Li X, Liu B. Data-driven CT protocol review and management—experience from a large academic hospital. Journal of the American College of Radiol-ogy. 2015;12(3):267–272.
10Szczykutowicz TP, Rubert N, Belden D, et al. A wiki-based solution to managing your institution’s imaging protocols. Journal of the American College of Radiology. 2016.
11Szczykutowicz TP, Rubert N, Belden D, et al. A wiki based CT protocol management s y s t e m . R a d i o l o g y M a n a g e m e n t . 2014;37(6):25–29.
12Szczykutowicz TP, et al. CT protocol management: simplifying the process by using a master protocol concept. Journal of Appl ied Cl inica l Medica l Phys ic s . 2015;16:4.
13McKenney SE, Seibert JA, Lamba R, Boone JM. Methods for CT automatic exposure control protocol translation between scanner platforms. Journal of the American College of Radiology. 2014;11(3):285–291.
14Yu L, Bruesewitz MR, Thomas KB, Fletcher JG, Kofler JM, McCollough CH. Optimal tube potential for radiation dose reduction in pediatric CT: principles, clinical implementations, and pitfalls. Radiographics. 2011;31(3):835–848.
15Blake MA, Cronin CG, Boland GW. Adrenal imaging. American Journal of Roentgenology. 2010;194(6):1450.
The authors are both faculty at the University of Wisconsin Madison Department of Radiology. Dr. Pozniak is internationally known for his teaching and work in ultrasound. He is also the leader of clinical CT at the University of Wisconsin Madison and has guided the development of the CT protocol optimization team for over a decade. Dr. Szczykutowicz is a medical physicist who joined the team in 2013. He is the creator of the protocol management system in use at the University of Wisconsin Madison (“CT protocol wiki” published in Radiology Management 2015). Details of the work at UW-Madison can be found at https://www.radiology.wisc.edu/protocols/CT/. Dr. Szczykutowicz can be contacted at [email protected].
Acknowledgements: The authors would like to thank the entire CT protocol optimization team at the University of Wisconsin Madison. Both authors have research and consulting agreements with GE HealthCare and supply CT protocols to GE HealthCare under a licensing agreement. TPS is the founder of protocolshare.org.
A Team Approach for CT Protocol Optimization

23
QuestionsInstructions: Choose the answer that is most correct. Note: Per a recent ARRT policy change, the number of post-test questions has been reduced from 20 to 8.
1. According to scenario 1 in the article, checklists for protocol changes can be useful to ensure:a. Protocol changes were reviewed by the manager of the
CT technologists.b. Protocol changes are made uniformly across all scanners.c. Details of the changes are annotated in a change log for
auditor review. d. That a team composed of technologists, radiologists, and
physicists reviews the change. 2. According to scenario 2 in the article, one possible issue
with copying and pasting a low dose protocol to provide angio (relatively higher) dose level image quality is:a. The contrast timing will be incorrect.b. The DoseCheck value will be too low.c. The scanner may hit its mA maximum.d. The image sharpness would be too low.
3. According to scenario 3 in the article, issues related to combining Ct exams include:a. Exceeding the total load of CT contrast agent.b. Excessively long breath-hold times.c. Exceeding the alert value on the DoseCheck feature of
the scanner.d. Sending too many images to PACS at one time.
4. According to scenario 3 in the article, what strength contrast agent was used for run offs prior to combining the exams?a. 450 mg I/ccb. 300 mg I/ccc. 370 mg I/ccd. 320 mg I/cc
5. According to scenario 4 in the article, moving a protocol’s location can alter:a. The reconstruction field of view limits of the protocol.b. The automatic exposure control strength setting which is
based on body region.c. The dose monitoring mapping and alarm settings.
d. The auto send feature on the protocol to facilitate getting trauma exams sent to PACS as fast as possible.
6. According to scenario 5 in the article, the radiologists requested a smaller slice thickness for what protocol?a. Upper extremity run off.b. Lower extremity run off.c. Angio (non-gated) Chest/Abdomen/Pelvis.d. Stone burden.
7. According to scenario 6 in the article, why is using the same beam energy important for an adrenal gland protocol? a. To ensure the same AEC settings can be duplicated
between series to provide the same level of image noise. b. To ensure the CT number changes within the pathology
are related to contrast uptake and wash out, not beam energy changes.
c. To ensure the tube will not overheat on the 2nd phase of the exam by requesting too high of an mA at a high beam energy.
d. To allow the “repeat series” button to be used.8. According to the article, the amount of effort required by
an institution to manage protocols amounts to:a. Part time (less than half a day per month) effort by a lead
technologist alone.b. A few days of full time effort during scanner installation
in conjunction with an applications specialist followed by annual physics reviews from a consulting physics company.
c. Tens of hours per protocol, resulting in an expenditure of hundreds of thousands of dollars annually.
d. A variable amount of effort, directed by “reading room to scanner phone calls” having technologists make protocol changes as requested.
e. Tens of hours per protocol, resulting in an expenditure of hundreds of thousands of dollars annually.
Continuing Education
A Team Approach for CT Protocol Optimization
Home-Study Test
1.0 Category A credit • Expiration date 12-31-18
Carefully read the following multiple choice questions and take the post-test at AHRA’s Online Institute (www.ahraonline.org/onlineinstitute)
The credit earned from the Quick CreditTM test accompanying this article may be applied to the
AHRA certified radiology administrator (CRA) operations management (OM) domain.
r a d i o l o g y m a n a g e m e n t n o v e m b e r / d e c e m b e r 2 0 1 6


workforce planning
My wife and I were home one day surfing television stations when we landed on C-Span. Our attention was immediately grasped by the words of Sheryl Sandberg, the chief operating officer of Facebook. Ms. Sandberg was being interviewed on a variety of topics involving current events. She appeared to have an excep-tional grasp of the subject matter and her answers were perfectly articulate.
We knew that she had written a book several years ago entitled Lean In, and that the work was somehow controver-sial. With a vacation coming up I thought that this would be the ideal material to read on the beach. In this case, I made exactly the right decision.
According to the author, Lean In was written as a way of encouraging women to take leadership roles in organizations. She points out that although females have made major gains over the years in American society, they are severely under-represented when it comes to holding the chief executive officer posi-tion at Fortune 500 companies. She then provides practical advice as to how she believes women can take control of the situation and begin to reverse this trend.
I, however, took the lessons contained in the book to apply to both sexes. For example, one of the first strategies she talks about is called “taking a seat at the table.” Ms. Sandberg’s notion is that in meetings women will often sit in chairs at the rear of the boardroom while men will position themselves in the center. The result is that the opinions of those in the back are often not heard or consid-ered. I contend that this concept applies equally to everyone. I have found myself
Lean InBy Mark Lerner
on numerous instances purposely choos-ing not to be found at the physical cen-ter of the meeting so that I can lean back during the session. But as Ms. Sandberg instructs eloquently, this type of strategy is not career enhancing. To superiors it can have the impact of making you appear uninterested and aloof. Heads of organizations want to promote people who are enthusiastic and engaged in their careers. One way to demonstrate these qualities, according to Ms. Sandberg, is to take a seat at the table.
Another excellent idea that Ms. Sand-berg puts forward in Lean In is the belief that “you don’t leave before you leave.” Here she is referring to women who seek to plan how they are going to balance work and family, sometimes as the author has seen, even before a female employee has a partner. Her thesis is that these women will often give up promotions or other job opportunities out of a concern that if they take on new and greater responsibili-ties they have to spend more time at work, and therefore will not be able to be good mothers. But just like sitting in the back of the room, failing to take advantage of advancements becomes a self-fulfilling prophecy. A woman will exit the work-force once a child is born because the position being held is unmotivating and not worth the cost of daycare.
In my years as a manager I have seen plenty of staff members leave before they leave. For whatever reason, an indi-vidual becomes disillusioned with a job and begins to check out by becoming non-participatory. He or she often has a frown on their face. An abundance of sick leave begins to be utilized.
This in my experience is extremely dangerous behavior. Although the employee may want a new position, a different one has not yet been acquired. Meanwhile, exhibiting the behaviors detailed above can result in the staff member’s employment coming to a pre-mature ending. Now the individual is in a terribly tough spot. If you have never been in this situation you can take it from me: It is much simpler to find a job when you already have a job.
Another bit of advice Ms. Sandberg provides in Lean In is that men and women should take on the same quantity of household chores. The author con-tends that this division of labor makes for a stronger and happier relationship between husband and wife. She also repeats the theme throughout her book that we make a better world by increas-ing the participation of as many people as possible. I especially like this idea for one important reason. If you are a man in a leadership position in healthcare chances are one hundred percent that you will be working alongside women. One way to make sure that you are treating these tal-ented professionals as equivalents is to practice this behavior at home.
Ms. Sandberg also expresses many of these observations in her TED Talk which can be found at https://www.ted.com/talks/sheryl_sandberg_why_we_have_too_few_women_leaders.
Mark Lerner is the director of diagnostic imaging at the George Washington University Hospital. He can be reached at [email protected].
25r a d i o l o g y m a n a g e m e n t n o v e m b e r / d e c e m b e r 2 0 1 6
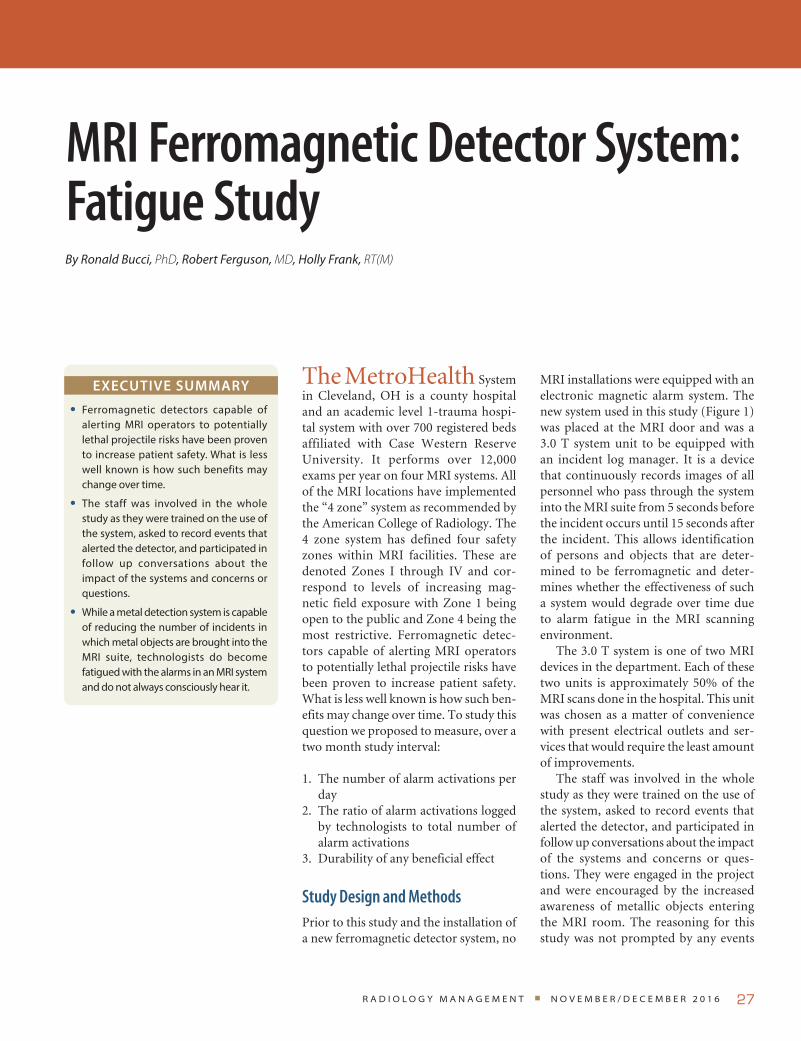
The MetroHealth System in Cleveland, OH is a county hospital and an academic level 1-trauma hospi-tal system with over 700 registered beds affiliated with Case Western Reserve University. It performs over 12,000 exams per year on four MRI systems. All of the MRI locations have implemented the “4 zone” system as recommended by the American College of Radiology. The 4 zone system has defined four safety zones within MRI facilities. These are denoted Zones I through IV and cor-respond to levels of increasing mag-netic field exposure with Zone 1 being open to the public and Zone 4 being the most restrictive. Ferromagnetic detec-tors capable of alerting MRI operators to potentially lethal projectile risks have been proven to increase patient safety. What is less well known is how such ben-efits may change over time. To study this question we proposed to measure, over a two month study interval:
1. The number of alarm activations per day
2. The ratio of alarm activations logged by technologists to total number of alarm activations
3. Durability of any beneficial effect
Study Design and MethodsPrior to this study and the installation of a new ferromagnetic detector system, no
MRI installations were equipped with an electronic magnetic alarm system. The new system used in this study (Figure 1) was placed at the MRI door and was a 3.0 T system unit to be equipped with an incident log manager. It is a device that continuously records images of all personnel who pass through the system into the MRI suite from 5 seconds before the incident occurs until 15 seconds after the incident. This allows identification of persons and objects that are deter-mined to be ferromagnetic and deter-mines whether the effectiveness of such a system would degrade over time due to alarm fatigue in the MRI scanning environment.
The 3.0 T system is one of two MRI devices in the department. Each of these two units is approximately 50% of the MRI scans done in the hospital. This unit was chosen as a matter of convenience with present electrical outlets and ser-vices that would require the least amount of improvements.
The staff was involved in the whole study as they were trained on the use of the system, asked to record events that alerted the detector, and participated in follow up conversations about the impact of the systems and concerns or ques-tions. They were engaged in the project and were encouraged by the increased awareness of metallic objects entering the MRI room. The reasoning for this study was not prompted by any events
• Ferromagnetic detectors capable of alerting MRI operators to potentially lethal projectile risks have been proven to increase patient safety. What is less well known is how such benefits may change over time.
• The staff was involved in the whole study as they were trained on the use of the system, asked to record events that alerted the detector, and participated in follow up conversations about the impact of the systems and concerns or questions.
• While a metal detection system is capable of reducing the number of incidents in which metal objects are brought into the MRI suite, technologists do become fatigued with the alarms in an MRI system and do not always consciously hear it.
ExEcutivE Summary
27r a d i o l o g y m a n a g e m e n t n o v e m b e r / d e c e m b e r 2 0 1 6
By Ronald Bucci, PhD, Robert Ferguson, MD, Holly Frank, RT(M)
MRI Ferromagnetic Detector System: Fatigue Study
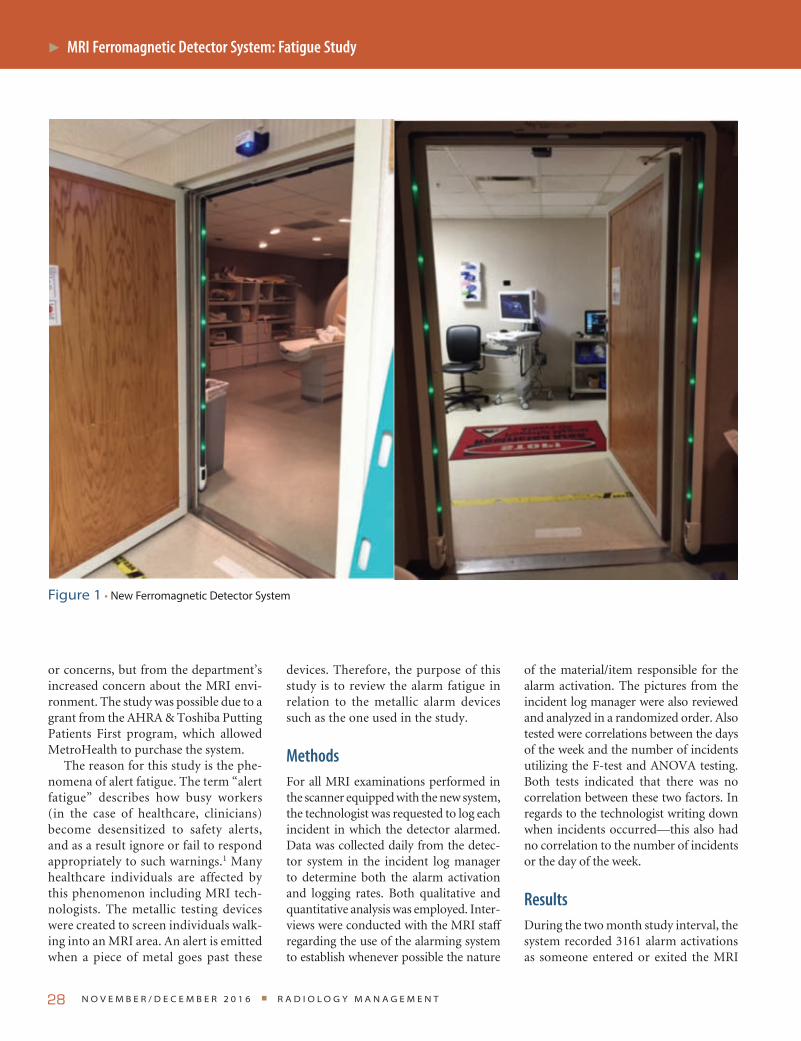
n o v e m b e r / d e c e m b e r 2 0 1 6 r a d i o l o g y m a n a g e m e n t28
MRI Ferromagnetic Detector System: Fatigue Study
or concerns, but from the department’s increased concern about the MRI envi-ronment. The study was possible due to a grant from the AHRA & Toshiba Putting Patients First program, which allowed MetroHealth to purchase the system.
The reason for this study is the phe-nomena of alert fatigue. The term “alert fatigue” describes how busy workers (in the case of healthcare, clinicians) become desensitized to safety alerts, and as a result ignore or fail to respond appropriately to such warnings.1 Many healthcare individuals are affected by this phenomenon including MRI tech-nologists. The metallic testing devices were created to screen individuals walk-ing into an MRI area. An alert is emitted when a piece of metal goes past these
devices. Therefore, the purpose of this study is to review the alarm fatigue in relation to the metallic alarm devices such as the one used in the study.
MethodsFor all MRI examinations performed in the scanner equipped with the new system, the technologist was requested to log each incident in which the detector alarmed. Data was collected daily from the detec-tor system in the incident log manager to determine both the alarm activation and logging rates. Both qualitative and quantitative analysis was employed. Inter-views were conducted with the MRI staff regarding the use of the alarming system to establish whenever possible the nature
of the material/item responsible for the alarm activation. The pictures from the incident log manager were also reviewed and analyzed in a randomized order. Also tested were correlations between the days of the week and the number of incidents utilizing the F-test and ANOVA testing. Both tests indicated that there was no correlation between these two factors. In regards to the technologist writing down when incidents occurred—this also had no correlation to the number of incidents or the day of the week.
ResultsDuring the two month study interval, the system recorded 3161 alarm activations as someone entered or exited the MRI
Figure 1 • New Ferromagnetic Detector System
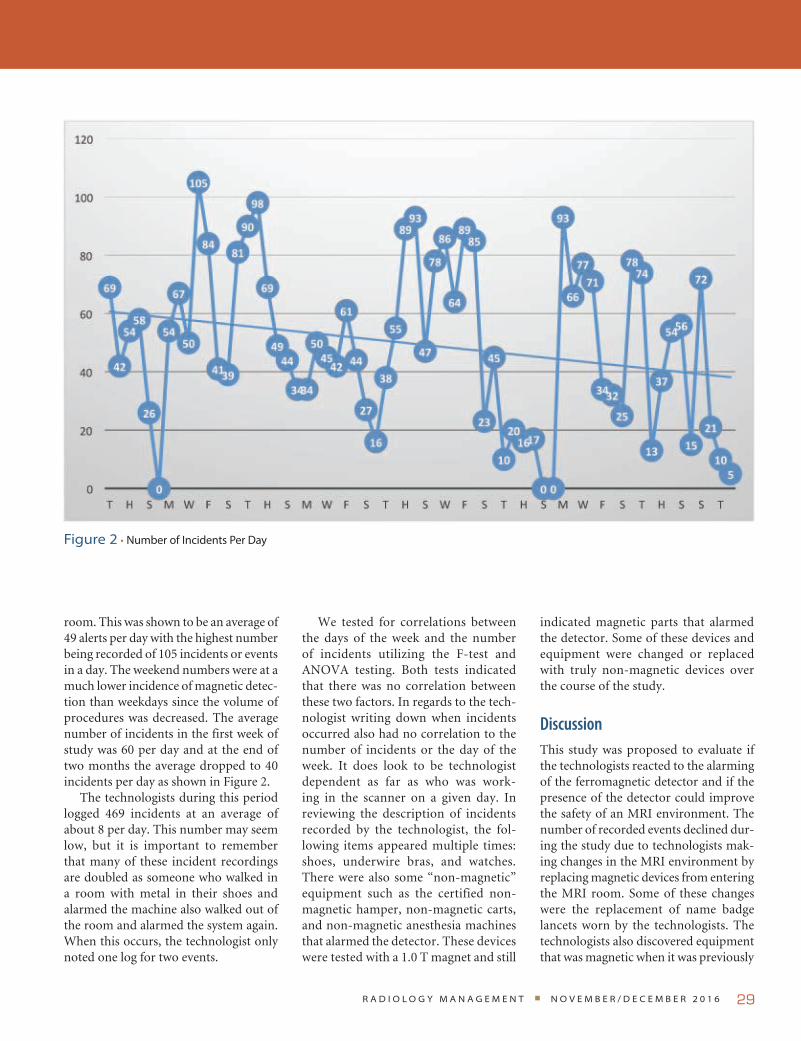
29
room. This was shown to be an average of 49 alerts per day with the highest number being recorded of 105 incidents or events in a day. The weekend numbers were at a much lower incidence of magnetic detec-tion than weekdays since the volume of procedures was decreased. The average number of incidents in the first week of study was 60 per day and at the end of two months the average dropped to 40 incidents per day as shown in Figure 2.
The technologists during this period logged 469 incidents at an average of about 8 per day. This number may seem low, but it is important to remember that many of these incident recordings are doubled as someone who walked in a room with metal in their shoes and alarmed the machine also walked out of the room and alarmed the system again. When this occurs, the technologist only noted one log for two events.
We tested for correlations between the days of the week and the number of incidents utilizing the F-test and ANOVA testing. Both tests indicated that there was no correlation between these two factors. In regards to the tech-nologist writing down when incidents occurred also had no correlation to the number of incidents or the day of the week. It does look to be technologist dependent as far as who was work-ing in the scanner on a given day. In reviewing the description of incidents recorded by the technologist, the fol-lowing items appeared multiple times: shoes, underwire bras, and watches. There were also some “non-magnetic” equipment such as the certified non-magnetic hamper, non-magnetic carts, and non-magnetic anesthesia machines that alarmed the detector. These devices were tested with a 1.0 T magnet and still
indicated magnetic parts that alarmed the detector. Some of these devices and equipment were changed or replaced with truly non-magnetic devices over the course of the study.
DiscussionThis study was proposed to evaluate if the technologists reacted to the alarming of the ferromagnetic detector and if the presence of the detector could improve the safety of an MRI environment. The number of recorded events declined dur-ing the study due to technologists mak-ing changes in the MRI environment by replacing magnetic devices from entering the MRI room. Some of these changes were the replacement of name badge lancets worn by the technologists. The technologists also discovered equipment that was magnetic when it was previously
Figure 2 • Number of Incidents Per Day
r a d i o l o g y m a n a g e m e n t n o v e m b e r / d e c e m b e r 2 0 1 6

considered non-magnetic, and the awareness of who enters the MRI room.
The data indicated that the eight tech-nologists only logged 15% of the alarm incidents. The rate of logging remained the same over the trial period. This statis-tic could represent that the technologists either did not comply with management’s direction to log all events, or could rep-resent that technologists indeed became “fatigued” at the alarm and did not notice that the alarm went off many times. After interviews with the technologists, they admitted that the alarm went off so many times in a day in reference to the same items (such as shoes or bras alarm-ing the system) that they forgot or did not think to mark all of the alerts in the log. Ignoring the alarm can cause a safety concern for the patient and the technolo-gist. If an alarm occurs, then the patient must be investigated for the presence of a ferromagnetic object and it should be removed (if possible). Once this has been done, the patient should be re-screened using the ferromagnetic detector system. If a ferrous object cannot be found, the screening should be repeated in case the original result was a false alarm.2,3
While there was a reduction of inci-dents, there is still room for improvement for a safer environment. Some suggestions for improvement include:
• Creating a policy stating that any shoes entering the MRI room be free of metal
• Creating a policy stating that any bras entering the MRI room be free of metal
• Check all designated “non-magnetic” device and equipment be free of alarm detecting parts
• Have the quality team for the MRI department review a percentage of the data from the alerts and the pictures in the incident log manager every month to determine what causes the alarms in the MRI room.
ConclusionMRI systems are powerful diagnostic tools that can provide information critical to the diagnosis of many disease processes.
They can, however, also be a danger to patients and employees due to the inher-ent magnetic field. This study has shown that a metal detection system is capable of reducing the number of incidents in which metal objects are brought into the MRI suite. A system to detect metal entering the room increases MRI staff awareness as to the devices, clothing, and equipment that have magnetic properties and are detected when entering the room. This study also has shown that technolo-gists do become fatigued with the alarms in an MRI system and do not always con-sciously hear it. All departments should be extremely cautious of what and who enters the MRI room. All people and equipment entering an MRI room should be tested and determined to be magnetic or non-magnetic and safe to enter.
References1U.S. Department of Health and Human
Services. “Alert Fatigue.” Agency for Healthcare Research and Quality. Last updated: July 2016. Available at: https://psnet.ahrq.gov/primers/primer/28/alert-fatigue. Accessed October 12, 2016.
2Shellock F, Karacozoff A. Detection of implants and other objects using a ferro-magnetic detection system: implications for patient screening before MRI. American Journal of Roentgenology. 2013;201(4).
3Shellock FG. “Using Ferromagnetic Detection Systems in the MRI Environment.” Mrisafety.com. Available at: http://www.mrisafety.com/SafetyInfov.asp?Safety InfoID=320. Accessed November 30, 2015.
Ronald Bucci, PhD is the past director of the radiology department at MetroHealth System in Cleveland, OH. He can be contacted at [email protected].
Robert Ferguson, MD is the chairman of radiology at MetroHealth.
Holly Frank, RT(M) is the supervisor of MRI at MetroMealth.
n o v e m b e r / d e c e m b e r 2 0 1 6 r a d i o l o g y m a n a g e m e n t30
MRI Ferromagnetic Detector System: Fatigue Study

r a d i o l o g y m a n a g e m e n t n o v e m b e r / d e c e m b e r 2 0 1 6 31
Oh No, New Codes!
It would be easy to think that there is no way that there could be more coding changes, but alas, that is not the case. A new year is upon us and so are new coding changes. This year there are more changes for interventional services than regular diagnostic services but the new changes will impact every radiology organization.
As of the writing of this article all of the supporting guidance that we look to for additional information is not yet available so more guidance will be needed to ensure proper code assignment. The following information will allow you to start on the update journey within your organization.
Diagnostic RadiologyUltrasound for AAA ScreeningThe existing HCPCS code G0389 has been deleted and replaced with a new cat-egory I code.
76706 Ultrasound, abdominal aorta, real time with image docu-mentation, screening study for abdominal aortic aneurysm (AAA)
This new code is only to be used for AAA screening. Code assignment for ultrasound or duplex ultrasound of the abdominal aorta for any other reason other than for screening should continue to be assigned 76770, 76775, 93978, or 93979 as appropriate.
Breast ImagingThe CAD (77051-77052) and mammog-raphy (77055-77057) codes have been deleted and replaced with three new com-bination codes. Additionally, it has been reported that the G codes (G0202, G0204 and G0206) are also being deleted, but this cannot be confirmed until the HCPCS codes are released.
77065 Diagnostic mammography, including computer-aided detection (CAD) when per-formed; unilateral
77066 Diagnostic mammography, including computer-aided detection (CAD) when per-formed; bilateral
77067 Screening mammography, bilateral (2-view study of each breast), including computer-aided detection (CAD) when performed
The existing tomosynthesis codes will not change and should be assigned in addition to these new breast imaging codes, when performed, in the same manner they were in 2016.
Noninvasive Physiologic Studies of Extremity Veins (NIPS)The existing complete bilateral code has been deleted for 2017.
93965 Noninvasive physiologic studies of extremity veins, complete bilateral study (eg, Doppler waveform analysis with responses to compression and other maneuvers, phle-borheography, impedance plethysmography)
Interventional RadiologyFluoroscopic GuidanceProcedure codes 77002 and 77003 have been revised to make it clear that both of these codes are add-on codes.
+77002 Fluoroscopic guidance for needle placement (eg, biopsy, aspiration, injection, localiza-tion device) (List separately in addition to code for primary procedure)
+77003 Fluoroscopic guidance and localization of needle or cathe-ter tip for spine or paraspinous diagnostic or therapeutic injec-tion procedures (epidural or subarachnoid) (List separately in addition to code for primary procedure)
By Melody W. Mulaik, MSHS, CRA, FAHRA, RCC, CPC, CPC-H
coding
*CPT® is a registered trademark of the American Medical Association. CPT® five digit codes, nomenclature, and other data are copyright 2016 American Medical Associa-tion. All Rights Reserved. No fee schedules, basic units, rela-tive values, or related listings are included in the CPT® book. AMA does not directly or indirectly practice medi-cine or dispense medical services. AMA assumes no liability for the data contained herein or not contained herein.

N o v e m b e r / D e c e m b e r 2 0 1 6 r a D i o l o g y m a N a g e m e N t32
New notes have been added under each code to indicate which codes may be assigned with them so it is crystal clear.
CPT code 77002 may only be assigned with:
• Aspirations—fine needle (10022), ganglion cyst (20612), bone marrow (38220), renal cyst (50390), bladder (51100-51102), spinal cord cyst/syrinx (62268)
• Puncture aspiration of abscess, hematoma, bulla or cyst—10160
• Biopsies—muscle (20206), bone (20220/20225), neck (21550), pleura (32400), lung (32405), bone marrow (38221), lymph node (38505), salivary gland (42400/42405), liver (47000/47001), pancreas (48102), abdominal (49180), kidney (50200), prostate (55700), thyroid (60100), spinal cord (62269)
• Foreign body removal—muscle/tendon sheath (20520/20525)
• Therapeutic carpal tunnel injection—20526
• Tendon sheath & trigger point injections—20550-20553
• Interstitial radioelement application—muscle/soft tissue (20555), head/neck (41019)
• Fiducial marker placement—intra-thoracic (32553), abdominal/intrapelvic/retroperitoneal (49411), prostate (55876)
• Arthrocentesis—20600/20605/20610 • Arthrogram injections—TMJ (21116),
shoulder (23350), elbow (24220), wrist (25246), hip (27093/ 27095), knee (27370), ankle (27648)
• Injection procedure for extremity pseudoaneurysm—36002
• Cannulation of the thoracic duct—38794
• Anesthetic agent injection—sphenopalatine ganglion (64505), carotid sinus (64508)
• Somatic nerve destruction by neurolytic agent—64600/64605
CPT code 77003 may only be assigned with:
• Injection procedures—61050/61055 • Percutaneous aspiration—62267 • Spinal puncture—62270/62272 • Epidural blood patch—62273 • Neurolytic injection/
infusion—62280-62282 • Myelography injection—62284 • Anesthetic agent injection—stellate
ganglion (64510), superior hypogastric plexus (64517), paravertebral sympa-thetic (64520)
• Trigeminal neurolysis at foramen ovale—64610
There is a note that 77003 may not be reported in conjunction with the new spi-nal injection codes 62320-62327.
Mechanochemical Venous AblationTwo new codes have been added to address ablation therapy performed uti-lizing a mechanochemical technique.
36473 Endovenous ablation therapy of incompetent vein, extrem-ity, inclusive of all imaging guidance and monitoring, per-cutaneous, mechanochemical; first vein treated
+36474 … subsequent vein(s) treated in a single extremity, each through separate access sites (List separately in addition to code for primary procedure)
These new codes may not be reported with any of the following procedures if performed in the same surgical field:
• Application of multi-layer compres-sion system (29581—29582)
• Catheterization (36000, 36002, 36005, 36410 & 36425)
• Radiofrequency endovenous ablation therapy (36475-36476)
• Laser endovenous ablation therapy (36478—36479)
• Embolization (37241, 75894) • Fluoroscopy (76000, 76001) • Ultrasound guidance (76937, 76942,
76998) • MR guidance (77022) • Diagnostic duplex studies (93970-
93971)
Dialysis Access Maintenance The biggest change for 2017 is in the dial-ysis access maintenance codes. All of the percutaneous dialysis access maintenance codes have been deleted for 2017 and replaced with new codes. Additionally, there have been definition updates that govern how the codes will be assigned. The biggest definition change is that the term “peri-anastomotic region” has been retired. The CPT Manual states that the peri-anastomotic region is “A historic term referring to the region of a dialysis circuit near the arterial anastomosis encompassing a short segment of the par-ent artery, the anastomosis, and a short segment of the dialysis circuit immedi-ately adjacent to the anastomosis. The peri-anastomotic region is included within the peripheral segment of the dial-ysis circuit.”
Some of the codes describe services performed in the entire dialysis circuit while others only describe services per-formed in either the peripheral or central segments. It is very important to pay close attention to the code definitions to see exactly what is included and what area(s) are covered. The new codes are listed in Table 1.
Procedure codes 36901-36906 are built on progressive hierarchies—report only one code from this series for services pro-vided in a dialysis circuit. All catheteriza-tions required to perform additional ser-vices are included in codes 36902-36909 and are not separately reported. All angiog-raphy, fluoroscopic image guidance, road-mapping, and RS&I required to perform each service are included in each code. US guidance for puncture of the dialysis circuit access is not typically performed and is not included in 36901-36906; however, in the case of a new (immature) or failing AVF, US may be necessary—report with 76937 if all the appropriate elements are performed and documented.
This is a high level overview of the codes, but it is very important to spend additional time reviewing all of the rele-vant information to ensure correct code assignment.
coding

r a d i o l o g y m a n a g e m e n t n o v e m b e r / d e c e m b e r 2 0 1 6 33
TABLE 1. Dialysis Access Maintenance Codes
Code Description
Catheterization and imaging only
36901 Introduction of needle(s) and/or catheter(s), dialysis circuit, with diagnostic angiogra-phy of the dialysis circuit, including all direct puncture(s) and catheter placement(s), injection(s) of contrast, all necessary imaging from the arterial anastomosis and adja-cent artery through entire venous outflow including the inferior or superior vena cava, fluoroscopic guidance, radiological supervision and interpretation and image documen-tation and report;
Code Description
Catheterization, imaging, and PTA
36902 ….. with transluminal balloon angioplasty, peripheral dialysis segment, including all imaging and radiological supervision and interpretation necessary to perform the angioplasty
Code Description
Catheterization, imaging, and stent (including PTA)
36903 …. with transcatheter placement of intravascular stent(s), peripheral dialysis segment, including all imaging and radiological supervision and interpretation necessary to per-form the stenting, and all angioplasty within the peripheral dialysis segment
Code Description
Mechanical thrombectomy (only)
36904 Percutaneous transluminal mechanical thrombectomy and/or infusion for thromboly-sis, dialysis circuit, any method, including all imaging and radiological supervision and interpretation, diagnostic angiography, fluoroscopic guidance, catheter placement(s), and intraprocedural pharmacological thrombolytic injection(s);
Code Description
Mechanical thrombectomy w/PTA
36905 …. with transluminal balloon angioplasty, peripheral dialysis segment, including all imaging and radiological supervision and interpretation necessary to perform the angioplasty
Code Description
Mechanical thrombectomy w/stent (including PTA)
36906 …. with transcatheter placement of intravascular stent(s), peripheral dialysis segment, including all imaging and radiological supervision and interpretation necessary to per-form the stenting, and all angioplasty within the peripheral dialysis circuit
Code Description
PTA (add-on code) +36907 Transluminal balloon angioplasty, central dialysis segment, performed through dialysis circuit, including all imaging and radiological supervision and interpretation required to perform the angioplasty (List separately in addition to code for primary procedure)
Code Description
Stent and PTA (add-on code)
+36908 Transcatheter placement of intravascular stent(s), central dialysis segment, performed through dialysis circuit, including all imaging radiological supervision and interpreta-tion required to perform the stenting, and all angioplasty in the central dialysis segment (List separately in addition to code for primary procedure)
Code Description
Embolization (add-on code)
+36909 Dialysis circuit permanent vascular embolization or occlusion (including main circuit or any accessory veins), endovascular, including all imaging and radiological supervision and interpretation necessary to complete the intervention (List separately in addition to code for primary procedure)

N o v e m b e r / D e c e m b e r 2 0 1 6 r a D i o l o g y m a N a g e m e N t34
Transluminal AngioplastyAll of the open (35450, 35452, 35458, and 35460) and percutaneous (35471, 35472, 35475, 35476, 75962, 75964, 75966, 75968, and75978) transluminal angioplasty code sets have been deleted for 2017 and replaced with four new codes (Table 2).
The new codes include all RS&I directly related to the intervention per-formed and imaging performed to docu-ment completion of the intervention. Catheterization, IVUS, mechanical thrombectomy, and thrombolytic ther-apy may be separately reported, when performed. Multiple angioplasties per-formed in a single vessel, including treat-ment of separate and distinct lesions within a single vessel, are reported with a single code. If a lesion extends across the margins of one vessel into another, but can be treated with a single therapy, the intervention should be reported only once. When additional, separate, and dis-tinct ipsilateral or contralateral vessels are treated in the same session, 37247 and/or 37249 may be reported as appropriate.
New GuidelinesThere are new guidelines added to many other codes and sections for services per-formed in the interventional suite so it is important that whoever is responsible for
ensuring correct code assignment review all of the codes and notes to ensure important information is not missed.
Spinal ProceduresInjection, Drainage, or Aspiration The epidural and subarachnoid injection (62310-62311) and catheter placement (62318-62319) codes have been deleted and replaced with eight new codes that differentiate between procedures per-formed with and without imaging guid-ance. The “with imaging guidance” codes (62321, 62323, 62325, and 62327) may not be reported in conjunction with 77003, 77012, or 76942. See Table 3.
Fluoroscopy or CT and any injection of contrast are inclusive of components of 62321, 62323, 62325, 62327. The placement and use of a catheter to administer one or more epidural or suba-rachnoid injections on a single calendar day should be reported in the same man-ner as if a needle had been used—ie, as a single injection using either 62320, 62321, 62322, or 62323. Such injections should not be reported with 62324, 62325, 62326, or 62327. Threading a catheter into the epidural space, injecting substances at one or more levels and then
removing the catheter should be treated as a single injection (62320-62323). If the catheter is left in place to deliver substances(s) over a prolonged period (ie, more than a single calendar day) either continuously or via intermittent bolus, use 62324-62327 as appropriate. When reporting 62320-62327, code choice is based on the region at which the needle or catheter entered the body (eg, lumbar). Codes 62320-62327 should be reported only once, when the substance injected spreads or catheter tip insertion moves into another spinal region (eg, 62322 is reported only once for injection or cathe-ter insertion at L3-4 with spread of the substance or placement of the catheter tip to the thoracic region).
Moderate (Conscious) SedationThe existing codes (99143-99150) have been deleted and replaced with six new codes (99151-99157) that utilize 15 minute incre-ments instead of 30 minutes. The codes that were previously included in the former Appendix G have been revised with the removal of the moderate (conscious) seda-tion symbol. This is why there is a long list of “revised” procedure codes this year that really only had their conscious sedation des-ignation modified by the removal of the “bullseye” symbol in the CPT Manual.
TABLE 2. Transluminal Angioplasty Codes
Code Description
37246 Transluminal balloon angioplasty (except lower extremity artery(ies) for occlusive disease, intracranial, coronary, pulmonary, or dialysis circuit), open or percutaneous, including all imaging and radiological supervision and interpretation necessary to perform the angioplasty within the same artery; initial artery
+37247 Transluminal balloon angioplasty (except lower extremity artery(ies) for occlusive disease, intracranial, coronary, pulmonary, or dialysis circuit), open or percutaneous, including all imaging and radiological supervision and interpretation necessary to perform the angioplasty within the same artery; each addi-tional artery (List separately in addition to code for primary procedure)
37248 Transluminal balloon angioplasty (except dialysis circuit), open or percutaneous, including all imaging and radiological supervision and interpretation necessary to perform the angioplasty within the same vein; initial vein
+37249 Transluminal balloon angioplasty (except dialysis circuit), open or percutaneous, including all imaging and radiological supervision and interpretation necessary to perform the angioplasty within the same vein; each additional vein (List separately in addition to code for primary procedure)
coding
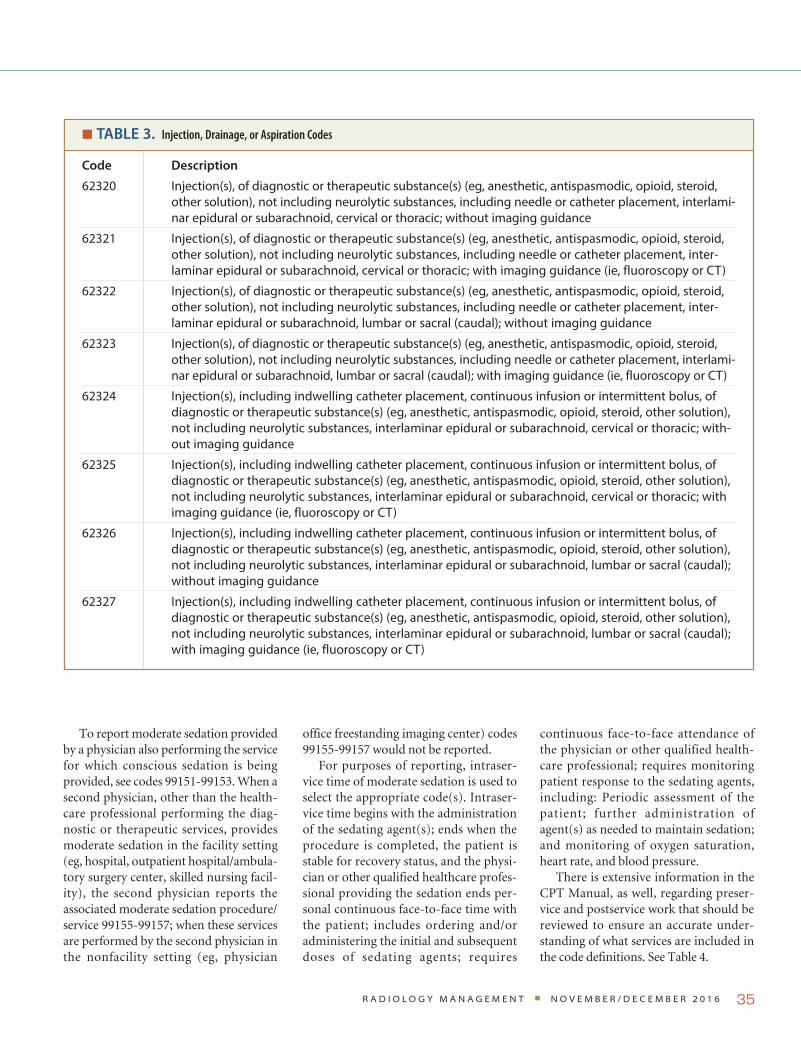
r a d i o l o g y m a n a g e m e n t n o v e m b e r / d e c e m b e r 2 0 1 6 35
To report moderate sedation provided by a physician also performing the service for which conscious sedation is being provided, see codes 99151-99153. When a second physician, other than the health-care professional performing the diag-nostic or therapeutic services, provides moderate sedation in the facility setting (eg, hospital, outpatient hospital/ambula-tory surgery center, skilled nursing facil-ity), the second physician reports the associated moderate sedation procedure/service 99155-99157; when these services are performed by the second physician in the nonfacility setting (eg, physician
office freestanding imaging center) codes 99155-99157 would not be reported.
For purposes of reporting, intraser-vice time of moderate sedation is used to select the appropriate code(s). Intraser-vice time begins with the administration of the sedating agent(s); ends when the procedure is completed, the patient is stable for recovery status, and the physi-cian or other qualified healthcare profes-sional providing the sedation ends per-sonal continuous face-to-face time with the patient; includes ordering and/or administering the initial and subsequent doses of sedating agents; requires
continuous face-to-face attendance of the physician or other qualified health-care professional; requires monitoring patient response to the sedating agents, including: Periodic assessment of the patient; further administration of agent(s) as needed to maintain sedation; and monitoring of oxygen saturation, heart rate, and blood pressure.
There is extensive information in the CPT Manual, as well, regarding preser-vice and postservice work that should be reviewed to ensure an accurate under-standing of what services are included in the code definitions. See Table 4.
TABLE 3. Injection, Drainage, or Aspiration Codes
Code Description
62320 Injection(s), of diagnostic or therapeutic substance(s) (eg, anesthetic, antispasmodic, opioid, steroid, other solution), not including neurolytic substances, including needle or catheter placement, interlami-nar epidural or subarachnoid, cervical or thoracic; without imaging guidance
62321 Injection(s), of diagnostic or therapeutic substance(s) (eg, anesthetic, antispasmodic, opioid, steroid, other solution), not including neurolytic substances, including needle or catheter placement, inter-laminar epidural or subarachnoid, cervical or thoracic; with imaging guidance (ie, fluoroscopy or CT)
62322 Injection(s), of diagnostic or therapeutic substance(s) (eg, anesthetic, antispasmodic, opioid, steroid, other solution), not including neurolytic substances, including needle or catheter placement, inter-laminar epidural or subarachnoid, lumbar or sacral (caudal); without imaging guidance
62323 Injection(s), of diagnostic or therapeutic substance(s) (eg, anesthetic, antispasmodic, opioid, steroid, other solution), not including neurolytic substances, including needle or catheter placement, interlami-nar epidural or subarachnoid, lumbar or sacral (caudal); with imaging guidance (ie, fluoroscopy or CT)
62324 Injection(s), including indwelling catheter placement, continuous infusion or intermittent bolus, of diagnostic or therapeutic substance(s) (eg, anesthetic, antispasmodic, opioid, steroid, other solution), not including neurolytic substances, interlaminar epidural or subarachnoid, cervical or thoracic; with-out imaging guidance
62325 Injection(s), including indwelling catheter placement, continuous infusion or intermittent bolus, of diagnostic or therapeutic substance(s) (eg, anesthetic, antispasmodic, opioid, steroid, other solution), not including neurolytic substances, interlaminar epidural or subarachnoid, cervical or thoracic; with imaging guidance (ie, fluoroscopy or CT)
62326 Injection(s), including indwelling catheter placement, continuous infusion or intermittent bolus, of diagnostic or therapeutic substance(s) (eg, anesthetic, antispasmodic, opioid, steroid, other solution), not including neurolytic substances, interlaminar epidural or subarachnoid, lumbar or sacral (caudal); without imaging guidance
62327 Injection(s), including indwelling catheter placement, continuous infusion or intermittent bolus, of diagnostic or therapeutic substance(s) (eg, anesthetic, antispasmodic, opioid, steroid, other solution), not including neurolytic substances, interlaminar epidural or subarachnoid, lumbar or sacral (caudal); with imaging guidance (ie, fluoroscopy or CT)

N o v e m b e r / D e c e m b e r 2 0 1 6 r a D i o l o g y m a N a g e m e N t36
SummaryAs you can see, there are a lot of changes coming in 2017. As always, it is impor-tant to review these changes in detail to ensure accurate and complete procedure code assignment. Stay tuned for more updates!
Melody W. Mulaik is president and co-founder of Coding Strategies, Inc. She is a nationally recognized speaker and has delivered numerous presentations at AHRA annual meetings and conferences. Melody is a member of AHRA, has published extensively, and may be contacted at [email protected].
TABLE 4. Moderate (Conscious) Sedation Codes
Code Description
99151 Moderate sedation services provided by the same physician or other qualified health care profes-sional performing the diagnostic or therapeutic service that the sedation supports, requiring the presence of an independent trained observer to assist in the monitoring of the patient’s level of consciousness and physiological status; initial 15 minutes of intraservice time, patient younger than 5 years of age
99152 Moderate sedation services provided by the same physician or other qualified health care profes-sional performing the diagnostic or therapeutic service that the sedation supports, requiring the presence of an independent trained observer to assist in the monitoring of the patient’s level of consciousness and physiological status; initial 15 minutes of intraservice time, patient age 5 years or older
+99153 Moderate sedation services provided by the same physician or other qualified health care profes-sional performing the diagnostic or therapeutic service that the sedation supports, requiring the presence of an independent trained observer to assist in the monitoring of the patient’s level of consciousness and physiological status; each additional 15 minutes intraservice time (List sepa-rately in addition to code for primary service)
99155 Moderate sedation services provided by a physician or other qualified health care professional other than the physician or other qualified health care professional performing the diagnostic or therapeutic service that the sedation supports; initial 15 minutes of intraservice time, patient younger than 5 years of age
99156 Moderate sedation services provided by a physician or other qualified health care professional other than the physician or other qualified health care professional performing the diagnostic or therapeutic service that the sedation supports; initial 15 minutes of intraservice time, patient age 5 years or older
+99157 Moderate sedation services provided by a physician or other qualified health care professional other than the physician or other qualified health care professional performing the diagnostic or therapeutic service that the sedation supports; each additional 15 minutes intraservice time (List separately in addition to code for primary service)
coding
r a d i o l o g y m a n a g e m e n t n o v e m b e r / d e c e m b e r 2 0 1 6 37
PB
ICD-10: COPD
Category J44 (Other chronic obstructive pulmonary disease) includes a variety of obstructive airway conditions. For exam-ple, chronic asthmatic bronchitis is reported with codes from this category, as is the combination of chronic bronchitis with emphysema.
Category J44 contains three codes:
J44.0 Chronic obstructive pulmo-nary disease with acute lower respiratory infection
J44.1 Chronic obstructive pulmo-nary disease with (acute) exacerbation
J44.9 Chronic obstructive pulmo-nary disease, unspecified
Code J44.0 represents COPD with an acute lower respiratory infection. The Third Quarter 2016 issue of AHA Coding Clinic® for ICD-10-CM and ICD-10-PCS states that acute bronchitis and pneumo-nia are both considered acute lower respi-ratory infections for coding purposes, but influenza is not since it includes infection of both the upper and the lower respira-tory tracts. A note under code J44.0 in the Tabular List states: “Use additional code to identify the infection.” For example, a patient with COPD and acute bronchitis will require two codes: code J44.0 for the COPD and a code from category J20 (Acute bronchitis) for the infection.
Whenever a “Use additional code” note appears in ICD-10-CM, it indicates that the additional code is to be reported as a secondary diagnosis. This means that in the case of COPD with acute bronchi-tis, the COPD must be coded first, fol-lowed by the acute bronchitis code. The same rule applies for COPD with pneu-monia. This seems counterintuitive, but
correct coding requires that providers follow this rule.
Code J44.1 represents an acute exacer-bation of COPD. The ICD-10-CM guide-lines define this term as “a worsening or decompensation of a chronic condition.” The guidelines also state that acute exac-erbation is “not equivalent to an infection superimposed on a chronic condition, though an exacerbation may be triggered by an infection.” Inclusion terms in the Tabular List indicate that code J44.1 should also be assigned when the COPD is described as “decompensated.”
Code J44.1 includes both the COPD and the acute exacerbation. However, if the patient has both an acute exacerba-tion and an acute lower respiratory infec-tion, both conditions should be coded. There is an Excludes2 note under J44.1 for code J44.0. This means that J44.1 (acute exacerbation) does not include J44.0 (acute lower respiratory infection), but both codes can be assigned if both conditions are documented. For example, a diagnosis of pneumonia with COPD with acute exacerbation will require three codes: J44.0 and J44.1 for the COPD, and an additional code for the pneumonia. Either of the COPD codes may be sequenced first. (See Coding Clinic®, Third Quarter 2016.)
If a patient has both COPD and asthma, the COPD is reported with a code from category J44 and the asthma is reported with a code from category J45 (Asthma). Either the COPD or the asthma may be sequenced first, depending on the circumstances of the encounter.
Finally, notes in the Tabular List under category J44 state to use an addi-tional code to identify any tobacco dependence (F17.-), tobacco use
(Z72.0), history of tobacco dependence (Z87.891), or exposure to environmental tobacco smoke (Z77.22 or Z57.31, depending on whether the exposure is work-related). If this information is available, these conditions should be reported as secondary diagnoses, following the COPD code(s).
Melody W. Mulaik is president and co-founder of Coding Strategies, Inc. She is a nationally recognized speaker and has delivered numerous presentations at AHRA annual meetings and conferences. Melody is a member of AHRA, has published extensively, and may be contacted at [email protected].
By Melody W. Mulaik, MSHS, CRA, FAHRA, RCC, CPC, CPC-H
coding
This article is part one of a three part series on the diagnostic imagi-nation in radiology. Such an imagination suggests a way of thinking that has not been passive speculation, but has often come from those who were outlier sci-entists, business leaders, radiologists, and technologists who imagined and built machines that excelled in discover-ing, visualizing, identifying, and classify-ing disease that improved patients’ lives. This article focuses on these people, their inventions, and the subfields of artificial intelligence (AI) that today project the diagnostic imagination into new possi-bilities for radiology’s future.
The article is divided into three sections: outlier scientific curiosity that has been one of the most positive characteristics of the field of diagnostic radiology since its founding; examples of scientific and clinical innovation that have marked radiology’s impulse to move from theory to practice; machine and deep learning that aligned with radiolo-gy’s earlier capacities to embrace change brought on by machine intelligence.
The OutliersDiagnostic imagination in radiology is built out of people’s willingness to col-laborate across and into medical physics, material science, clinical medicine, infor-matics, organizational redesign, advanced visualization, and more recently a branch of AI—machine learning and deep
learning (computers that learn without being explicitly programmed and deep neural networks that draw from highly variable data to achieve complex out-puts). Such willingness to collaborate and puzzle through machine intelligence has come from those who have not accepted the status quo. A certain form of scien-tific curiosity has been a guiding prin-ciple in their work—curiosity which in Latin describes a form of care “cūra care” linked to an inquisitive sense “ōsus-ous.”1 It is to be filled with the love, respective for, and the pursuit of mechanisms that can help to identify the forms and pro-gression of disease.
It might sound strange to say that radiology is a field founded on a certain kind of love for mechanistic and analytic process, but the term “love” is not far off. The neuroradiologist and poet Amit Majmudar captures this deep curiosity as a pursuit of “a secret” in ordinary forms and patterns. It is a form of love of seek-ing and holding emergent orders found in all types of phenomena and people:2
What is it about order that we love?
This sense,
Maybe, that a secret informs the pattern?
Perhaps another way to think about capturing this form of curiosity is to consider radiology always being prompted by the Janus god of restless technological change (not in the typical
• Machines that dream, the restless impulse for technical change that has marked radiology from its beginning and forays into deep neural networks, will no doubt unsettle long-held institu-tional practices in radiology.
• A willingness to collaborate and puzzle through machine intelligence has come from those who have not accepted the status quo. A certain form of scientific curiosity has been a guiding principle in their work.
• In radiology, machine intelligence has been extremely useful and built into just about every major technical innovation. But it has only been the last several years that a subfield of AI, machine learning, has begun to show remarkably fast development due to faster comput-er processing capabilities and advanced modeling and results emerging from the application of deep learning.
ExEcutivE Summary
39r a d i o l o g y m a n a g e m e n t n o v e m b e r / d e c e m b e r 2 0 1 6
By Rodney Sappington, PhD
The Diagnostic Imagination in Radiology: Part 1

n o v e m b e r / d e c e m b e r 2 0 1 6 r a d i o l o g y m a n a g e m e n t40
The Diagnostic Imagination in Radiology: Part 1
sense as Janus-faced or two-faced, but in its ancient meaning as the Roman god of transitions). Representing this Janus-like aspect, the field of radiology has often announced clinical-technical transitions that suggest new ways of recognizing patterns in images, bodies, and disease morphology, function, and progression. As such a god would have it and at cross-roads of scientific thought these patterns have emerged out of investigations into anatomic and metabolic illumination, into uses of pattern recognition, genom-ics and AI and, more recently, into radiomics and molecular imaging. As is often the case, outlier scientific and artistic ideas are often the first to be char-acterized as mad, wrong, or institution-ally unsupportable or in today’s context characterized as the purveyors of hype, misrepresentation, or sold as diagnostic panaceas illustrated through the over ordering of imaging studies in a broken cost-dysfunctional healthcare system.
Wilhelm Conrad Roentgen, a physicist by training and widely credited with the discovery of X-ray and its medical appli-cability, admitted to his wife that when his vacuum tube experiments were to be revealed, people would say, “Roentgen has surely gone crazy.” In the late 19th century Henry Becquerel (1896) and Marie Curie (1897) established the ori-gins of radioactivity—their experiments that captured radioactivity from uranium salts were also considered strange and otherworldly. In 1905 and for years fol-lowing, Einstein’s light quantum theory was not at first taken to heart by the phys-icist community, but later was widely celebrated due to studies that confirmed that X-ray radiation behaved as both par-ticle and wave. Later and on another level, known as the Pauli-Jung Conjecture (by physicist Wolfgang Pauli and psycho-analyst Carl Jung) the duality of material and mental forms was thrown into doubt, mind and matter were beyond dualistic and bounded interaction.
Roentgen’s concerns of being per-ceived as crazy by the scientific com-munity may also have stemmed from his awareness that modern medical science
was rapidly moving from bench to bed-side. Innovations raced from concepts in physics, material sciences, and chemistry to medical application in short periods of time. Out of this new speed of innova-tion and cross-disciplinary spirit, typical research and clinical boundaries were becoming obsolete. Newly minted radi-ologists, as part of a new medical field, innovated in real-time, not in cozy labs. For instance, in the 1950s, pushing the boundaries of material science and radiol-ogy, Charles Dotter (labeled “crazy Char-lie” and widely recognized as the father of interventional radiology) campaigned for the use of catheters he made by hand that led to flow-directed balloon catheriza-tion, the double lumen balloon catheter, the safety guidewire and pioneered the loop-snare catheter for extracting intra-vascular foreign bodies. He focused his efforts on bringing in materials outside of typical radiology practice to diagnose vascular abnormality such as Teflon, various plastics, elastics, and metals. This “practical genius” guided by X-rays stated that “if a plumber can do it to pipes, we can do it to blood vessels.”3 Due to his early efforts vascularity is now navigable for therapeutic process.
From a modality and cross-disciplin-ary perspective, Paul C. Lauterbur, who shared the Nobel Prize with Peter Man-sfield for his research into principles of magnetic resonance imaging (MRI), sought to find a general method for locating signals in non-uniform mag-netic fields that existed in such regions as human bodies (or what he originally termed “zeugmatography,” which comes from the Greek “I excite”). He strove to find laws for how molecular structure behaved. His experiments proceeded with no appropriate mathematical mod-els available at the time and no available
technologies to demonstrate his hypoth-eses. He built tools and models from scratch. Lauterbur held a strong belief that scientific invention was based on scientific openness that went all the way back to Aristotle’s notion of a Lyceum in which ideas flowed between disciplines and the public. For Lauterbur, science comprised of open knowledge “not nat-ural categories with rigid boundaries to be defended against intrusions.”4 He was constantly speaking with both scientists from other fields and non-scientists to test his theories. Lauterbur’s curiosity opened disciplinary barriers that allowed for and contributed to his breakthrough diagnostic imaging research in radiology. Later in his career, he arrived at a full, integrated, and testable theory of how the physical structure of our planet may have given rise to basic forms of life. His insights have been described as “almost wild.”5 On levels of mind, matter, parti-cle, wave, ray, and material such scientific and clinical curiosity has always charac-terized a better and more open scientific and clinical field of radiology.
As radiology in the 20th century has taken cues from representatives of scien-tific curiosity and scientific openness it has also taken cues from imagination of artists. The types of questions radiologists and artists have asked have shared some common features: if the phenomenal world was largely unseen by human sight what kinds of realities moved among us undetected? Since human sight has failed to see, what kinds of patterns may we see with machines? What has gone uncap-tured in human and machine vision that may contribute to our understanding of mind, perception, and early disease? In many respects these larger guiding ideas from artists have been ahead of scien-tists in envisioning the potentials for
Roentgen’s concerns of being perceived as crazy
by the scientific community may also have stemmed
from his awareness that modern medical science
was rapidly moving from bench to bedside.

41r a d i o l o g y m a n a g e m e n t n o v e m b e r / d e c e m b e r 2 0 1 6
capturing phenomena across machine and human intelligence and perception. From Paris, New York, Milan, and Mos-cow artists saw the potential for machine enhanced vision producing “results analogous to those of X-rays” as artist Umberto Boccioni announced in 1910.6 In the early 20th century the writings of James Joyce, Marcel Proust, and Vir-ginia Woolf along with Sigmund Freud’s theory of the psyche took up Roentgen’s discovery as a potential breakthrough into deeper understandings of tempo-ral forms between physical phenomena, psyche, and anatomy. Time was no lon-ger linear. These were not idle questions but calls to action for those working in scientific research and clinical applica-tion to work together and find answers to diagnostic vision or blindness. After the speculations of Roentgen, Einstein, and Freud, psychic time and matter did not operate as assumed. The mind’s pasts did not stay passed. Matter disobeyed linear-ity. The body was no longer anatomically opaque. The figure of the patient (psy-choanalytically and medically) would never be the same.
Such larger guiding ideas could not be considered a mere theoretical object. In the context of radiology powerful ideas had a way of mobilizing clinical resources while changing what was considered possible to visualize and compute. They could be guiding and infect and spread like “memes” as they have been termed. Outside of generating radiology reports such ideas could shape the things we did with patients, how organizations were run, and how technologies were planned and built. They could frame our expecta-tion of which futures the field of radiol-ogy will or would inhabit.
Contemporary artists have been fas-cinated with machines that diagnose the visual world. The artist Man Ray became renowned for his work using photo-gram techniques or cameraless photo-graphs revealing mechanisms that turn solid objects transparent. Or the films of Roger Corman, who in the 1960s pro-duced the sci-fi horror “The Man with X-ray Eyes” that explored the opposite
effect: the madness that comes from a world in which everything is transparent and nothing appears solid and opaque. For over a century artists have been focused on radiology themes and con-cepts. Recent advances in deep learn-ing have shown that artists were again exploring machine intelligence applied to the visual world. For example, with Google’s Deep Dream neural networks are applied to photographs that extract an animal, bird, or human face from fea-tureless backgrounds.7
Machine Intelligence in RadiologyThe use of machine intelligence in radi-ology is not new. Nearly all the advances of diagnostic visualization (CT, MRI, PET, CAD, ultrasound) have been made possible with computational algorithms and computer systems that have driven the processes that crunch complex detec-tor data and efficiently convert it to pixel or imaging data for radiologist view-ing. Compression algorithms have long been central to image transmission and delivery.
However, since the early 1980s, deployments of computer and network technologies have been changing the way radiology has been organized as a service and discipline. Networked communica-tions have allowed for fast transfer of imaging data (DICOM) from hospi-tal, PACS-RIS systems, vendor neutral archive (VNA), EHR, imaging center, and home office, thus shifting traditional radiologist-hospital relationships (eg, teleradiology, telemedicine consultancy, remote monitoring). Beyond broadband software and network switches, deeper shifts have been underway in the form of human-machine intelligences. Former radiology chairman at Massachusetts General Hospital, James Thrall, suggested such shifts be considered “compelling bursts” that have typically been the mark of radiology innovation and have trans-formed imaging methods and radiology service.8 What this means is that techni-cal innovation may have unpredictably burst onto the scene while at the same
time being poorly understood and poorly executed at clinical implementation.
Dr. Larry Norton, Medical Director of Evelyn H Lauder Breast Cancer Cen-ter, Memorial Sloan Kettering Cancer Center, believes machine intelligence will evolve through natural language processing (NLP) powered by increas-ing computational capacity and algo-rithms such as IBM’s Watson and will be key in early detection of cancers. He sees AI as a kind of friend, a “wise coun-selor” at the radiologist’s side drawing from vast clinical data.9 Such a vision personalizes barren AI so that it reasons with individuals, learns and responds to particular habits of speech and thinking, and continues learning along medi-cal decision heuristics. NLP suggests that individual human and machine reasoning may share greater kinship in the next decade. The wise machine counselor alongside the wise radiologist may co-mentor the next wave of radi-ology residents. However, how “wise” are algorithms? From another direc-tion, how wise are radiologists? When you enter machine learning, the human can no longer be taken for granted as holding the clinical standard or holding the knowledge management standard in balancing billions of clinical data points for optimal diagnostic judgment.
AI has always conjured ideas of dys-topia and utopia, a world ruled by machines and a world that frees human beings from the bondage and bloodless drudgery imposed by machines. In radi-ology, our burden has often been finding disease early, asymptotic in difficult cases. Machine intelligence has been anything but a constraint. It has been extremely useful and built into just about every major technical innovation, from con-verting raw scanner data to pixel data for the application of multi-slice CT to recently applying deep learning to flow patterns and volumes in examining vas-cular changes in and around the heart. AI has been built into networks, modalities, and cloud-based image sharing platforms. But it has only been the last several years that a subfield of AI, machine learning,
n o v e m b e r / d e c e m b e r 2 0 1 6 r a d i o l o g y m a n a g e m e n t42
has begun to show remarkably fast devel-opment due to faster computer process-ing capabilities and advanced modeling and results emerging from the applica-tion of deep learning.
Machine Learning in Radiology Machine learning is composed of con-cepts and methods that deploy algo-rithms that can learn from data without explicit programming. One area of machine learning that has received an enormous amount of attention is deep learning, which involves utilizing hidden layers in a deep neural network. Deep learning is focused on modeling data of high variability and structural com-plexity for the purpose of gaining high quality results. One of its promises is to build deep neural networks that can learn and extract features from images and unstructured text without labeling each feature in advance. This is often termed supervised learning. Across industries, recent advances in deep learning applied to medical imaging have occurred in supervised learning. From a radiology perspective, Samsung has announced the use of deep learning which they term “S-Detect.” Deep learning provides intelligence to clinicians on breast lesion characteristics and “a recommendation on whether the selected lesion is benign or malignant.”10 Using machine learning, the company Arterys in partnership with GE is building a diagnostic platform for analyzing medical images with a focus on cardiology.11 Enlitic was voted in 2015 and 2016 as one of the 50 smartest com-panies in the world by MIT Tech Review and has been building machine learning and deep learning approaches to medi-cal images to gain efficiencies and levels of accuracy within radiology practices.12 IBM, with a sophisticated marketing approach to machine learning, has been rapidly acquiring companies and data to build its cognitive computing capabilities across radiology data.13 One of the prom-ises of deep learning has not only been in supervised learning as these previous examples demonstrate, but in building
models that learn in unsupervised fashion for identifying hidden trends, patterns, and anatomical anomalies (eg, it has been speculated that the National Security Agency [NSA] conducted unsupervised learning with Verizon across millions of phone records in search of expected “pat-terns of behavior”).14 The application of supervised learning and unsupervised learning are probably the most impor-tant potential advancements in radiol-ogy and healthcare generally today. The race is on to build smarter algorithms to find anomalies in handwritten notes, operation reports, pathology reports, molecular imaging, radiology reports, and medical images.
It is a profound shift in perspective to not rely strictly on human domain expertise or on handcrafted labels for each new feature we are searching for across billions of medical images. Infer-ences and associations can be found in labeled and unlabeled data. Relation-ships may not be known beforehand but discoverable. With unsupervised learn-ing one does not predict from known human correlations and therefore the data may reveal longitudinal relation-ships in a patient’s chest CTs and assist in predicting future outcomes. On the diagnostic level, unsupervised learn-ing is still a frontier to be explored. In supervised learning, machine learn-ing is still reliant on labeled data. It requires training data with ground truth, pathology reports, image anno-tations, and radiology reports. In such learning, machine learning would focus on results we already have criteria for—we know in advance we are looking for malignancies, thresholds of disease, pol-yps, nodules, and lesions. The promise of unsupervised learning in machine learning is to search through data for the unseen, undetected, and yet uncat-egorized—eg, rare diseases, incidence
rates, genomic, and proteomic targets not known in advance. Supervised learning targets are known; unsuper-vised learning targets are unknown. Both can be used together to detect and discover relationships in data.
For radiology, deep learning suggests that human crafted features (radiologists painstakingly classifying lesions, abnor-mality, annotating location, and report-ing on probabilities of malignancy) may now be largely automated. In other words, machine embedded neural net-works not only have the potentiality to learn from radiologists’ anatomical knowledge, but such networks derive associations that were never originally identified by radiologists. Machine intelligence has the capability to “think” through disease associations without direct human guidance along each step in the process. As Andrew Ng, who founded Google’s Brain project, has stated, “Machine learning is the most exciting field of all of computer science, sometimes . . . [I think] of all human endeavors.”15,16
ConclusionWhat does machine learning mean for the centrality of the radiologist and radi-ology as a service? Paul J. Chang, MD, FSIIM, a radiologist and professor who holds the vice chairmanship of radiol-ogy informatics at the University of Chicago Medical Center seems to think radiologists are well suited to the com-ing of machine learning and stated that radiologists are “more sophisticated in our IT.” He considers the radiologist’s training to be an advantage as radiolo-gists do not think in “narrow silos,” but instead are in a position to be responsi-ble for “all of the disease processes” sim-ilar to “the role . . . [radiologists] used to have in the old days before PACS.”17
The Diagnostic Imagination in Radiology: Part 1
Machine intelligence has the capability to “think” through
disease associations without direct human guidance
along each step in the process.

43r a d i o l o g y m a n a g e m e n t n o v e m b e r / d e c e m b e r 2 0 1 6
Is Chang suggesting that radiologists, scientists, and business leaders may bring back an out-of-the-box outlier spirit to radiology? This hardly could be the case. If Chang is suggesting the reemergence of the authority of the radiologist in the continuum of care, he seems to be miss-ing the erosive effects of massive produc-tivity and commoditization pressures working against this superhero figure of the radiologist breaking through silos of disease process, when billions of data points displace her as the go-to physi-cian in wider diagnosis consultancy and sidelines her as the key innovator in clin-ical IT. The old days are gone and can’t be brought back. The days ahead are a combination of technologists, industry leaders, data scientists, radiologists, and business leaders who together envision the silo-breaking role for radiology and radiologists. A new era of collaboration and shared authority is underway akin to what Roentgen’s and Lauterbur’s work have suggested. Radiology service personnel and radiologists compose a wider team puzzling through the sci-ence of data driven medicine or, as Dr. Majmudar poetically stated, a group of people committed to discovering the “secret” that informs patterns in data.
A leader in machine learning and deep learning, Yoshua Bengio is a professor with the department of computer science and operations research at the University of Montreal. Bengio is an outlier scien-tist in his relationship to radiology, yet he is central to the theory and practice of machine learning. Bengio’s and his colleagues’ work have important impli-cations for how unsupervised learning may generate images with an eye on the cinematic quality and clarity of images in human dreams. Image generation and analysis are at the heart of the diagnostic enterprise in radiology so we should pay particular attention here.
“Our machines already dream, but in a blurry way. They’re not yet crisp and content-rich like human dreams and imagination, a facility we use in daily life to imagine those things which we haven’t
actually lived. I am able to imagine the consequence of taking the wrong turn into oncoming traffic. I thankfully don’t need to actually live through that experience to rec-ognize its danger. If we, as humans, could solely learn through supervised methods, we would need to explicitly experience that scenario and endless permutations thereof. Our goal with research into unsupervised learning is to help the machine, given its current knowledge of the world reason and predict what will probably happen in its future. This represents a critical skill for AI . . . . It’s also what motivates science as we know it . . . . In other words, we’re aim-ing for machines that function like little scientists.”18
Radiology, woven in a web of techni-cal, clinical, and larger cultural relations, is a very rich domain of exploration. That is, if we don’t take this richness for granted and get isolated in silos of hyped-up thought, authority, data, or practice. Where does this leave the radi-ologist? Bengio focuses our attention on forms of computer vision and machine learning already bringing a “blurry” machine dream into focus and generat-ing images across intelligent machines of increasing complexity and efficacy from a computer vision perspective. Machines that dream, the restless impulse for tech-nical change that has marked radiology from its beginning and forays into deep neural networks, will no doubt unsettle long-held institutional practices in radi-ology. Radiology focuses our attention on the possibility of new types of col-laborative relationships across industry, organization, and technology in the cur-rent enfolding of diagnostic and machine intelligence. Outlier scientists and busi-ness leaders among us will be needed to drive forward a different kind of radiol-ogy service hand-in-hand with radiolo-gists who together can apply a different kind of useful clinical imagination once only dreamed of.
Part two of this series will focus on the technical and business case for AI-driven radiology and part three will address organizational change suggested by AI-driven diagnostic care.
References1Stack Exchange, Inc. English Language &
Usage. “Why is it spelled ‘curiosity’ instead of ‘curiousity’?” Available at: http://english.stackexchange.com/questions/197173/why-is-it-spelled-curiosity-instead-of-curiousity. Accessed September 9, 2016.
2Majmudar A. “Pattern and Snarl.” The Smithsonian Magazine. September 2012. Available at: http://www.smithsonianmag.com/arts-culture/pattern-and-snarl-a-n e w - p o e m - b y - a m i t - m a j m u d a r -25874543/?no-ist. Accessed September 9, 2016.
3Payne MM. Charles Theodore Dotter. The father of intervention. Texas Heart Insti-tute Journal. 2001;28(1):28-38. Available at: https://www.ncbi.nlm.nih.gov/pubmed/11330737. Accessed September 9, 2016.
4Lauterbur PC. All science is interdisciplinary-from magnetic moments to molecules to men. Bioscience Reports. June 2004; 24(3):165-179.
5Dawson J. “Biographical Memoirs. Paul Lauterbur 1929-2007.” National Academy of Sciences. 2012. Available a t : h t t p : / / w w w . n a s o n l i n e . o r g /publications/biographical-memoirs/memoir-pdfs/lauterbur-paul.pdf. Accessed September 9, 2016.
6Chessa L. Luigi Russolo, Futurist: Noise, Visual Arts, and the Occult. University of California Press: Berkeley, California. 2012.
7Rayner A. “Can Google’s Deep Dream become an art machine?” March 28, 2016. The Guardian. Available at: http://www.theguardian.com/artanddesign/2016/mar/28/google-deep-dream-art. Accessed September 9, 2016.
8Thrall, James H M.D. Epilogue: The Future of Imag in ing h t tp : / /www.arr s .org/publications/HRS/diagnosis/RCI_D_c28 .pdf
9h t tp : / /www-935 . ibm. c om/ser v i c e s /m u l t i m e d i a / M S K _ C a s e _ S t u d y _IMC14794.pdf
10“Samsung Applies Deep Learning Technol-ogy to Diagnostic Ultrasound Imaging.” April 21, 2016. Available at: https://news.samsung.com/global/samsung-applies-deep-learning-technology-to-diagnostic-ultrasound-imaging. Accessed April 23, 2016.
11Arterys Inc. “Arterys Partners with GE Healthcare to Launch Transformative

n o v e m b e r / d e c e m b e r 2 0 1 6 r a d i o l o g y m a n a g e m e n t44
Cardiac Medical Imaging Platform.” December 7, 2015. Available at: http://www.prnewswire.com/news-releases/arterys-partners-with-ge-healthcare-to-launch-transformative-cardiac-medical-imaging-platform-300188657.html. Accessed September 9, 2016.
12MIT Technology Review. “50 Smartest Companies 2015.” Available at: https://www.technologyreview.com/lists/companies/2015/. Accessed September 9, 2016.
13Orcutt M. “Why IBM Just Bought Billions of Medical Images for Watson to Look At.” MIT Technology Review. August 11, 2015. Available at: https://www.technologyre view.com/s/540141/why-ibm-just-bought-billions-of-medical-images-for-watson-to-look-at/. Accessed September 9, 2016.
The Diagnostic Imagination in Radiology: Part 1
14Derene G. “Why the NSA Wants All That Verizon Metadata.” Popular Mechanics. June 6, 2013. Available at: http://www.popularmechanics.com/military/a9025/why-the-nsa-wants-all-that-verizon-meta-data-15562288. Accessed May 25, 2015.
15Ng Andrew. “Lecture 1, Machine Learning.” Stanford University. Uploaded July 22, 2008. Available at: https://www.youtube.com/watch?v=UzxYlbK2c7E. Accessed September 9, 2016.
16Dormehl L. “Why Google Is Investing in Deep Learning.” Fast Company. February 12, 2014. http://www.fastcolabs.com/3026423/why-google-is-investing-in-deep-learning. Accessed September 9, 2016.
17Yeager D. “Ready for the Future? Health Care Reform Will Demand Some New Skills From Radiologists.” Radiology Today. 2013;14(10):12.
18Beyer D. “Yoshua Bengio: Machines that Dream.” The Future of Machine Intelli-gence Perspectives from Leading Practitio-ners. O’Reilly Media Inc: CA. 2016.
Rodney W. Sappington, PhD is a senior clinical data scientist, informatician, author and healthcare strategist who applies machine learning to medical problems. He can be contacted at [email protected].

AHRA www.ahraonline.org cover, 1
Bayer www.radimetrics.com 5
The Burwin Institute www.burwin.com 47
FUJIFILM Medical Systems www.fujimed.com cover, 26
Hitachi www.hitachimed.com cover
Landauer landauermp.com/cdos 11
Mednovus-SAFESCAN® www.mednovus.com 44
MIC www.micinfo.com 2, 38
Radcomm www.radcomm.net 47
Samsung www.SamsungNeuroLogica.com 45
Shimadzu www.shimadzu.com 24
Skyline Medical www.skylinemedical.com 8
Advertiser Web Site Page Number
AdvertisersIndex to
46 N o v e m b e r / D e c e m b e r 2 0 1 6 r a D i o l o g y m a N a g e m e N t

■ Special advertiSing Section
the mArketplAce
No Additional Charge for 1/8 Page Horizontal Ad Layout!Just send us a company logo, contact information and a descrip-tion of your services. Or send us an image of your product with a 70 word (maximum) description; we’ll put it into a standard 3 1/2” x 2 1/8” format and place your ad in this highly visible section.
Ad Rates and Discounts 1X 3X 6XBlack & White Only $275 $249 $225
M a r k e t p l a c e A d v e r t i s i n g
For more information on how these advertising opportunities and more can work for you contact:
Kelly MillerM.J. Mrvica Associates, Inc.
(856) 768-9360E-mail: [email protected]
www.ahraonline.org/rmsearch
One of the most popular pages on AHRA’s website, this archive contains journal articles since 1995. Access is open to members and subscribers only.
Opportunities for banner ad placements.
Radiology Management Article Database
AHRA’s Annual Meeting & Exposition is the premier event for imaging administrators. Reach meeting attendees each morning with the AHRA Convention Daily, the only publication that provides the most recent news, information, and schedules. Convention Daily advertisements are a great way to direct traffic to your booth.
Advertising RatesSize 2x* 4x**
Full page $1915 $10751/2 page $975 $5901/4 page $520 $365
*2x advertisers must advertise in the second and fourth issues.**4x advertisers must advertise in each of the four issues.
COLOR• 4-Color Process: add $550
C o n v e n t i o n D a i l y
47r a D i o l o g y m a N a g e m e N t N o v e m b e r / D e c e m b e r 2 0 1 6
Offered to subscribers as an alternative format, all print ads are included in the digital edition of Radiology Management at no additional cost. A major advantage of digital edition advertising is the ability to promote and track usage of click-throughs (all ads containing an e-mail address and/or a URL are clickable). Nearly 80% of readers prefer receiving information about a product or service by visiting a company’s website.* Advertisers follow normal print advertising production specifica-tions and deadlines.
*Source: Radiology Management Reader Survey, March 2010.
Radiology Management Dig i ta l Ed i t ion

The Joint Commotion
i just completed my twelfth and final Joint commission survey before i retire. it always seems that how we are reviewed depends on the temperament and per-sonality of the surveyors. But i also know that their philosophy has changed over the past few decades.
thirty years ago, the Joint com-mission was much more negative in their culture and had a more punitive approach. about 15–20 years ago, some organizations were fed up with them and felt they had become too arrogant. the Joint commission got the message, and over the years, has created a more part-nership-based approach, where there is more education and consultation.
along with this evolution has come our own method of improvement. For the last three surveys, we have strongly encouraged and built a mentality of constant readiness. in earlier years, we were pretty lax. it was like cramming for a final exam every three years, where we would clean things up, pay better atten-tion to expired goods, and get our files in order for our three-year review. it was a clamoring of signing policies, getting physician signatures, and making sure that at least for that week, staff didn’t have any food or drinks out in their work areas, and door stops were put away in drawers. Much of that has gone away and measurements require we are constantly vigilant.
at least once prior to every survey, there are situations that create some kind of panic. this year i had “déjà vu all over again” when, at 8:30 the night before our records review, we were
frantically searching for a specific proto-col and policy. i had that familiar feeling of exhaustion of a 14 hour day, assuring we had gathered 23 binders of licenses, physics logs, lead apron records, critical values evidence, and all the rest. 25,000 pieces of information, and you KnoW she is going to ask you for the two you don’t have.
When i was a supervisor over our ct and special procedures area 30 years ago, our manager experienced a nightmare with our nuclear medicine survey. He had a lead tech who assured him that all the records for radioactive materials delivery and injections were in good order. i guess the lead thought the surveyor might just glance through the records, but he instead found large holes. i will never forget the look of despair on my manager’s face as they considered closing the department. it was a great lesson that all aspects of our departments ultimately fall on our shoulders.
one of my worst memories came when we had a retired military man as a surveyor who accused me of manufactur-ing false records. We were with survey-ors reviewing our quality data reports. For years we had radiology critical values listed with many other monitored mea-surements. after two years of meeting our 100% goal, the committee decided we would no longer have to report to them, but should continue to keep our records. So, when he saw the lab critical values, he asked, “Where is the radiology report?” i explained the situation, and assured him that we still kept and monitored our records. He wanted to see them.
When he looked at the binder, he asked, “did you just throw this together?” i explained that i got our report every week to confirm compliance, and i showed him. He would not believe me. For the next day and a half, i met with him three times to convince him i was telling the truth. Finally, he said, “okay, i’ll accept it.” then as he got up i heard him say, “now i have to find something else.” Unbelievable.
Fortunately, we hire a consulting team who specializes in the Joint com-mission “hot buttons” to come in every year to help us. We were more prepared for this survey than ever. it didn’t hurt that we had the nicest surveyor ever—she was thorough and professional and went through our department and our documents in a consultative way.
after our department survey she revealed that her father had been a radiologist, and she almost felt like she was with family. i couldn’t have asked for a better ending to a lifetime of Joint commission surveys. i think it was evidence that they and we as an institu-tion have evolved into more customer focused, responsive, and outcomes based organizations.
all that being said, i won’t miss the commotion.
Gordon Ah Tye, FAHRA is director of imaging and radiation oncology services for Kaweah Delta Health Care District in Visalia, CA. He holds a bachelor’s degree in biological sciences from California State University in Fresno. Gordon is a past president of AHRA, received the AHRA Gold Award in 2001, and received the 2006 Minnie for Most Effective Radiology Administrator of the year. He may be contacted at [email protected].
By Gordon Ah Tye, FAHRA
on that note
48 N o v e m b e r / D e c e m b e r 2 0 1 6 r a D i o l o g y m a N a g e m e N t