Embed Size (px)
Citation preview
© The Center for North American Herpetology 22
ISSN 2333-0694
Volume 2015(1): 22-33 1 May 2015 jnah.cnah.org
The Journal of North American HerpetologyJNAH
WETLAND OCCUPANCY OF POND-BREEDING AMPHIBIANS IN YOSEMITE NATIONAL PARK, USA
ABSTRACT: We estimated wetland occupancy and population trends for three species of pond-breeding anurans in Yosemite National Park from 2007 – 2011. We used a double survey technique in which two observers independently surveyed each site on the same day. Double surveys allowed us to calculate detectability for the three most common anurans within the park: Rana sierrae, Anaxyrus canorus, and Pseudacris regilla. Annual estimates of detectability were generally high; mean detectability ranged from 73.7% + 0.6 (SE) for any life history stage of A. canorus to 86.7% + 0.7 for sites with P. regilla reproduction (eggs or larvae present). Detectability was most variable for Anaxy-rus canorus, which ranged from 45.9% to 99.7%. The probability of occupancy for R. sierrae was highest in larger, low-elevation wetlands that lacked fi sh. Anaxyrus canorus were more common in shallow high-elevation ponds; their occurrence was minimally impacted by the presence of fi sh. Finally, occurrence of P. regilla was largely unrelated to wetland size and elevation, but like R. sierrae, they were less likely to occupy sites with fi sh. Occupancy showed no trend over the fi ve years of our study for R. sierrae or A. canorus when considering either sites with any life stage or only sites with reproduction. However, P. regilla showed a modest downward trend for sites with any life stage and sites with reproduction. Our results for R. sierrae run counter to expectations given recent concern about the decline of this species, while our fi ndings for P. regilla raise concerns for this widespread and generally common species.
1U.S. Geological Survey, Western Ecological Research Center, Point Reyes National Seashore, Point Reyes, CA 94956, USA. Email: [email protected]
2U.S. Geological Survey, Patuxent Wildlife Research Center, 12100 Beech Forest Dr., Laurel, MD 20708, USA
3Pennsylvania State University, Department of Ecosystem Science and Management, 411 For-est Resources Building, University Park, PA 16802, USA
GARY M. FELLERS1, PATRICK M. KLEEMAN1, AND DAVID A. W. MILLER2,3
INTRODUCTIONMonitoring amphibians across large landscapes is chal-
lenging due to the logistical diffi culties of sampling re-mote, rugged, and roadless areas. There are also techni-cal diffi culties in detecting target species that are only seasonally active and diffi cult to fi nd in their natural environment. Yet distribution and population trends are the types of information most needed by land manag-ers to assure that management practices are appropriate and effective. All these challenges are accentuated when working with rare species, which are often the species of greatest interest. Amphibians are of particular concern because of the
dramatic declines and extinctions that have been re-ported from many areas around the world (Stuart et al. 2004; McCallum 2007; Wake and Vredenburg 2008; Ad-ams et al. 2013). One third of the world’s amphibians are threatened with extinction, and 43% have declining populations (Stuart et al. 2004). The 2010 IUCN (In-ternational Union for Conservation of Nature) lists 486 species of amphibians as Critically Endangered, and as many as 159 amphibian species are likely to have gone extinct in recent years (IUCN 2010). Adams et al. (2013) monitored 48 species of amphibians for nine years at 34
study sites on Department of the Interior lands in the United States; they found that their study species were declining at a rate of 3.7% annually. They found that threatened species (i.e., IUCN red-listed species) were declining at 11.6% per year, and the rate of decline was highest on National Park Service lands, areas that are generally believed to be the best protected landscapes in the country. Amphibian survey protocols that do not account for
sites where amphibians were present but not detected result in occupancy estimates that are too low. This is of concern everywhere, but especially in the Sierra Nevada and Cascade Mountains of California where some of the most extensive amphibian declines have occurred (Fell-ers and Drost 1993; Drost and Fellers 1996; Knapp and Mathews 2000; Knapp 2005; Vredenburg et al. 2007). Knapp et al. (2003) addressed this by noting that during the summer, adults and larvae occur almost exclusive-ly in shallow water near shore and are easily detected even in the deepest lakes. However, Beebee and Griffi ths (2005) express concern about extrapolating from single counts such as these because the probability of detection can vary between observers, between habitats, and with different time periods. The pitfalls of ignoring detect-
Journal of North American Herpetology 2015(1) 23
ability have been addressed and methods for evaluating detectability are now readily available (MacKenzie et al. 2002; MacKenzie et al. 2003, MacKenzie et al. 2006). These techniques generally involve surveying each site twice (=double survey) during each site visit. We used double surveys to evaluate the status of am-
phibians in Yosemite National Park, a large montane park in California. Based on resurveys of historic sites visited 75 years earlier by naturalists from the Museum of Ver-tebrate Zoology and the California Academy of Sciences, Drost and Fellers (1996) documented anuran declines in the Yosemite area. In response to this fi nding, and as part of the U.S. Geological Survey Amphibian Research and Monitoring Initiative (ARMI), we developed an am-phibian monitoring program to assess amphibian status and trends within Yosemite N.P. We report here on fi ve years of annual surveys of 172
wetland sites in 14 randomly selected watershed units across Yosemite N.P. Double surveys were conducted at each site in each year, allowing us to estimate detection probabilities for each species and to examine factors re-lated to detection. Controlling for detection, we report occupancy trends and predictors of occurrence for the three most common anurans within the park. We evalu-ated patterns of occurrence for sites with any life stage (i.e., adults, subadults, larvae, or eggs present) and for sites with reproduction (i.e., eggs or larvae present). We also evaluated the infl uence of elevation, fi sh, water-shed, and wetland structure on occurrence probabilities.
MATERIALS AND METHODSStudy Area – We conducted our study at Yosemite N.P.,
a 3,028 km2 park with an elevational range of 648 – 3,997 m, located in the central Sierra Nevada mountains of California. There are two major river drainages within the park. The Tuolumne River in the north drains 1,731 km2, while the Merced River drains 1,300 km2 in the south, including Yosemite Valley. The predominant veg-etation is lodgepole pine (Pinus contorta), and both red and white fi rs (Abies concolor and A. magnifi ca). At lower elevations there are other species of pines and riparian vegetation including willow (Salix jepsonii), corn lily (Ve-ratrum californicum), small camas (Camassia quamash), and broad-leaf lupine (Lupinus latifolius). Yosemite re-ceives the majority of its precipitation during the winter and early spring as snowfall (Serreze et al. 1999). Yo-semite has been a National Park since 1890; visitation is high with over 4 million visitors per year. However, 94% of the park is designated as wilderness, with access via 1,300 km of trails. Most visitors only frequent areas im-mediately adjacent to roads, and overnight backcountry use within the park is regulated by a permit system. Pond-breeding Anurans – Amphibian diversity in Yo-
semite is modest with only six pond-breeding anurans recorded within the park. Pacifi c treefrogs (Pseudacris regilla) are widespread, breeding in both permanent and ephemeral bodies of water throughout the park where they range up to 3,320 m elevation. Sierra Nevada yel-low-legged frogs (Rana sierrae; formerly part of R. mus-cosa) are fairly widespread within Yosemite where they breed in permanent bodies of water at elevations rang-ing from 1,793 – 3,527 m. Yosemite toads [Anaxyrus (=Bufo) canorus] breed in both permanent and ephem-eral water bodies, but generally avoid the larger lakes. Anaxyrus canorus are found in the park from 2,135 – 3,339 m elevation. All three of these species breed in the late spring or early summer as the snow melts, and are active until early fall. Each species employs a dif-ferent reproductive strategy: A. canorus are explosive breeders with rapidly maturing larvae, P. regilla have a longer breeding season (approximately 6 weeks) with larvae that metamorphose into subadults by the end of the summer, and R. sierrae breed as the snow melts, but their larvae take at least three years to metamorphose into subadults at these elevations. Three other anuran species were not suffi ciently com-
mon or widespread to include in our study. California red-legged frogs (Rana draytonii) have been extirpated from the few sites where they once occurred, though historic populations within the park may have been introduced (Barry and Fellers 2013). Western toads (Anaxyrus boreas) occur in Yosemite Valley (1,200 m), but we have located only one individual during the 38 surveys con-ducted in Yosemite Valley over the last 19 years (pers. obs.). The non-native American bullfrog (Lithobates catesbeianus) occurs in Yosemite Valley as well as at a few low elevation (< 1,500 m) sites west of Hetch Hetchy Reservoir (pers. obs.). Watershed Units – Using 7.5’ U.S. Geological Survey
topographic maps, we divided the park into 220 water-shed units. Each watershed unit encompassed 10 – 25 potential anuran breeding sites, e.g. ponds, lakes, mead-ows with pools. The number of sites per watershed varied depending on the size of the sites, but total survey effort was similar between all watershed units. The boundaries between watershed units followed natural features and drainages whenever possible. A few large valleys had to be subdivided because of the large number of potential breeding sites. In those areas, we used natural groupings of nearby water bodies as a guide to drawing boundaries.
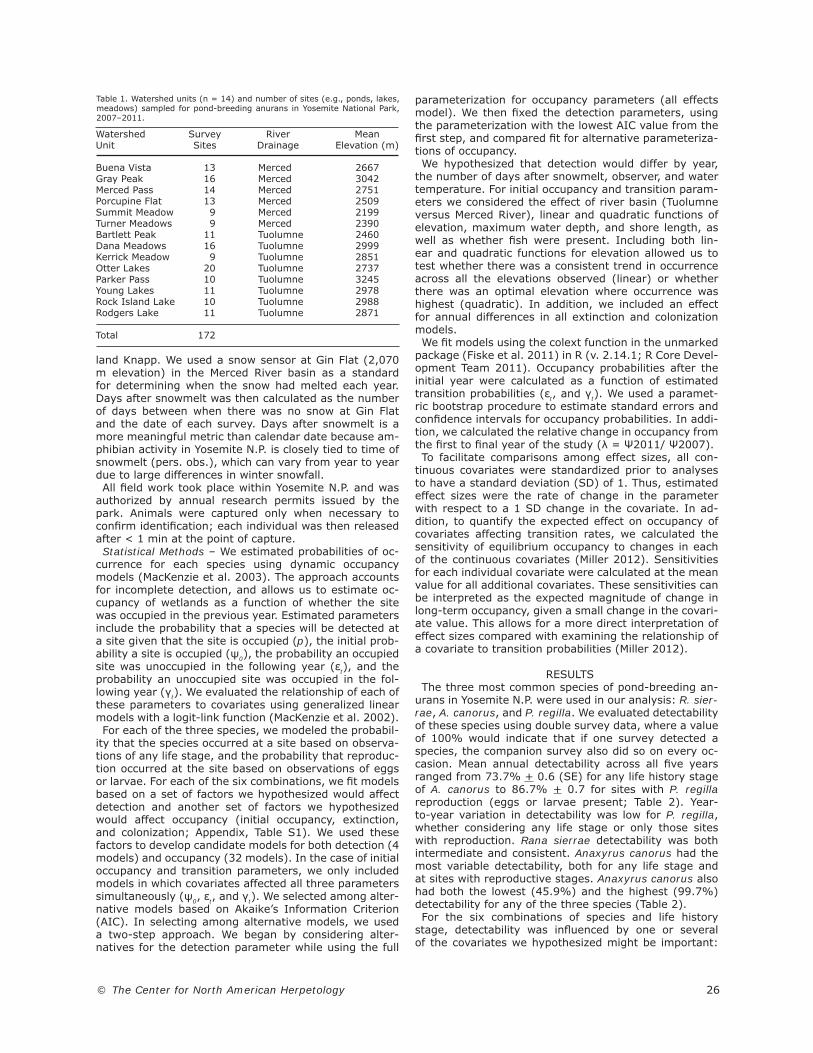
Figure 1. Location of 14 watershed units sampled for pond-breeding anurans in Yosemite National Park, 2007 – 2011. The Tuolumne watershed is north of the black line that runs through the center of the park, and the Merced watershed is to the south.
© The Center for North American Herpetology 24
We divided the sampling units between the two river ba-sins based on area, and randomly selected six watershed units from the Merced River basin, and eight from the larger Tuolumne River basin (Table 1, Figure 1) that were within the historic range of R. sierrae, A. canorus, and P. regilla. From 2007 – 2011, we surveyed all 172 wetland sites within the 14 watershed units each year.
Survey Methods – We used Visual Encounter Surveys (Crump and Scott 1994) to search for amphibians at each potential breeding site. Equipped with a dip net and bin-oculars, a biologist slowly walked around the perimeter of the site looking for eggs, larvae, subadult, and adult anurans. Separate tallies were maintained for each life history stage of each of the three pond-breeding species. Each site was surveyed by two biologists, providing two
independent assessments of species presence. Surveys were conducted using the following protocol designed to maximize the independence of our double samples,
while minimizing environmental variation between sur-veys. There was a 15 – 60 min delay between the fi rst and second survey to allow time for anurans to recover from disturbance caused by the initial pass. Delays lon-ger than 60 min might result in weather changes that could affect amphibian activity and detection. The biolo-gists were not allowed to observe each other so that no clues were obtained about whether amphibians were be-ing detected. The biologists did not discuss the results of the surveys until both surveys had been completed. Finally, the biologists alternated who did the fi rst survey.At the time of each survey, we recorded observer name, fi rst or second survey, water temperature, maximum wa-ter depth (truncated at 3 m), and site dimensions. Ad-ditional covariates were subsequently recorded for each site: river basin (Tuolumne versus Merced), elevation, presence of fi sh (non-native trout), and days after snow-melt was complete. Yosemite N.P. provided records of fi sh presence based on gill net surveys conducted by Ro-
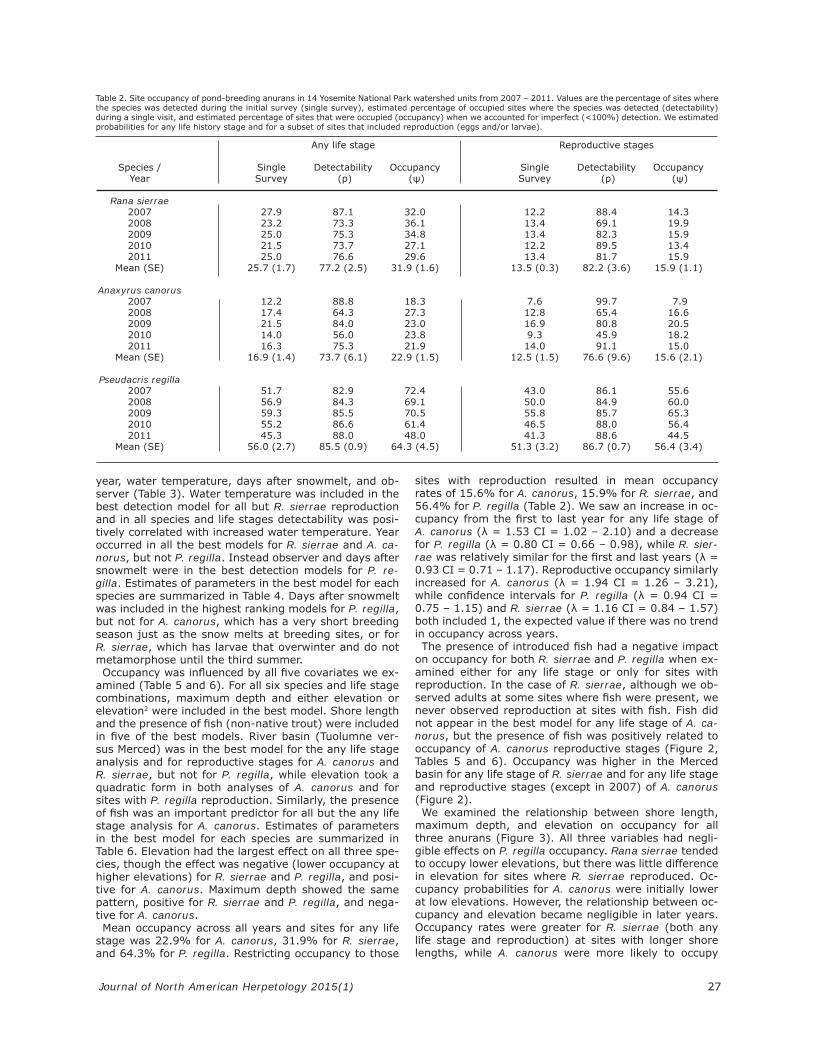
Figure 2. Comparison of occupancy and 95% confidence intervals for sites with (unfilled squares) and without (filled circles) introduced trout for Rana sier-rae, Anaxyrus canorus, and Pseudacris regilla for each year of the study, and occupancy by basin: Tuolumne (unfilled triangles) and Merced (filled circles). A. Any life history stage, B. Sites with reproductive stages.
A
B
Journal of North American Herpetology 2015(1) 25
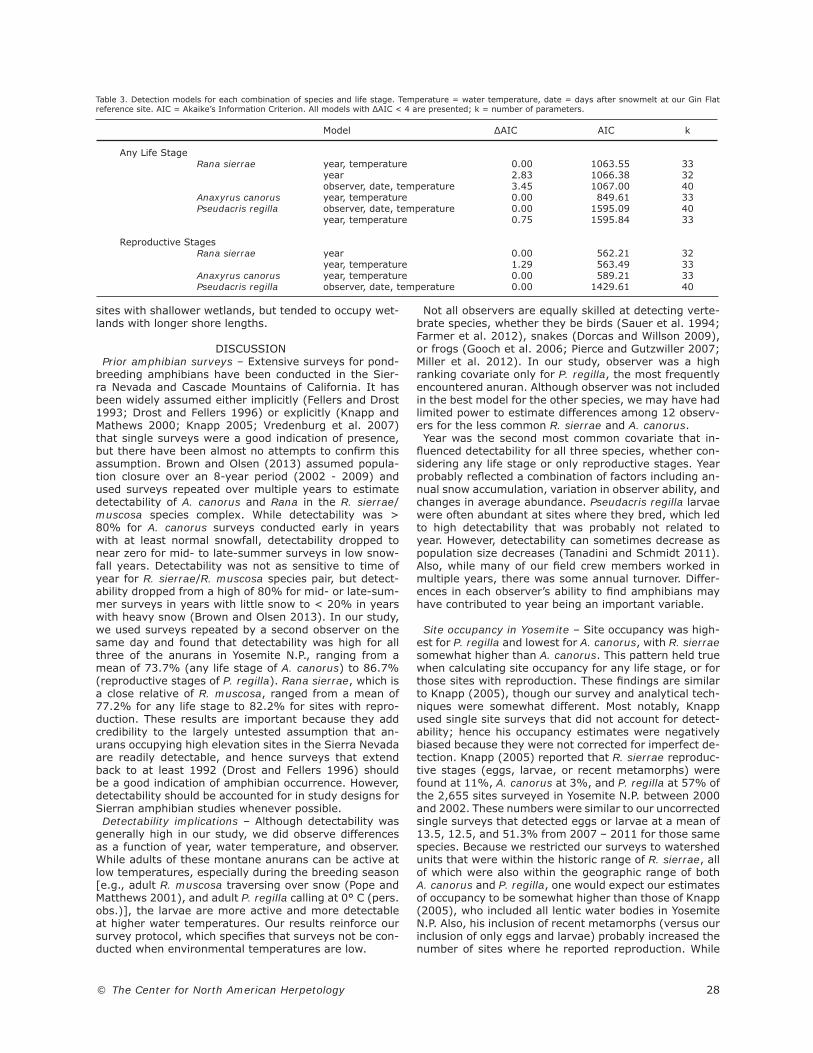
Figure 3. Comparison of occupancy probabilities and 95% confidence intervals of Rana sierrae, Anaxyrus canorus, and Pseudacris regilla in sites where fish were not present. For each covariate (elevation, maximum depth, or shore length) we plot occupancy probabilities for sites at the mean covariate value (black square) and for sites where the covariate value was one standard deviation above (gray triangle) or below (unfilled circle) the mean covariate value. A. Any life-history stage, B. Sites with reproductive stages.
A
B
© The Center for North American Herpetology 26
land Knapp. We used a snow sensor at Gin Flat (2,070 m elevation) in the Merced River basin as a standard for determining when the snow had melted each year. Days after snowmelt was then calculated as the number of days between when there was no snow at Gin Flat and the date of each survey. Days after snowmelt is a more meaningful metric than calendar date because am-phibian activity in Yosemite N.P. is closely tied to time of snowmelt (pers. obs.), which can vary from year to year due to large differences in winter snowfall. All fi eld work took place within Yosemite N.P. and was
authorized by annual research permits issued by the park. Animals were captured only when necessary to confi rm identifi cation; each individual was then released after < 1 min at the point of capture. Statistical Methods – We estimated probabilities of oc-
currence for each species using dynamic occupancy models (MacKenzie et al. 2003). The approach accounts for incomplete detection, and allows us to estimate oc-cupancy of wetlands as a function of whether the site was occupied in the previous year. Estimated parameters include the probability that a species will be detected at a site given that the site is occupied (p), the initial prob-ability a site is occupied (ψ0), the probability an occupied site was unoccupied in the following year (εt), and the probability an unoccupied site was occupied in the fol-lowing year (γt). We evaluated the relationship of each of these parameters to covariates using generalized linear models with a logit-link function (MacKenzie et al. 2002). For each of the three species, we modeled the probabil-
ity that the species occurred at a site based on observa-tions of any life stage, and the probability that reproduc-tion occurred at the site based on observations of eggs or larvae. For each of the six combinations, we fi t models based on a set of factors we hypothesized would affect detection and another set of factors we hypothesized would affect occupancy (initial occupancy, extinction, and colonization; Appendix, Table S1). We used these factors to develop candidate models for both detection (4 models) and occupancy (32 models). In the case of initial occupancy and transition parameters, we only included models in which covariates affected all three parameters simultaneously (ψ0, εt, and γt). We selected among alter-native models based on Akaike’s Information Criterion (AIC). In selecting among alternative models, we used a two-step approach. We began by considering alter-natives for the detection parameter while using the full
parameterization for occupancy parameters (all effects model). We then fi xed the detection parameters, using the parameterization with the lowest AIC value from the fi rst step, and compared fi t for alternative parameteriza-tions of occupancy.We hypothesized that detection would differ by year,
the number of days after snowmelt, observer, and water temperature. For initial occupancy and transition param-eters we considered the effect of river basin (Tuolumne versus Merced River), linear and quadratic functions of elevation, maximum water depth, and shore length, as well as whether fi sh were present. Including both lin-ear and quadratic functions for elevation allowed us to test whether there was a consistent trend in occurrence across all the elevations observed (linear) or whether there was an optimal elevation where occurrence was highest (quadratic). In addition, we included an effect for annual differences in all extinction and colonization models.We fi t models using the colext function in the unmarked
package (Fiske et al. 2011) in R (v. 2.14.1; R Core Devel-opment Team 2011). Occupancy probabilities after the initial year were calculated as a function of estimated transition probabilities (εt, and γt). We used a paramet-ric bootstrap procedure to estimate standard errors and confi dence intervals for occupancy probabilities. In addi-tion, we calculated the relative change in occupancy from the fi rst to fi nal year of the study (λ = Ψ2011/ Ψ2007). To facilitate comparisons among effect sizes, all con-
tinuous covariates were standardized prior to analyses to have a standard deviation (SD) of 1. Thus, estimated effect sizes were the rate of change in the parameter with respect to a 1 SD change in the covariate. In ad-dition, to quantify the expected effect on occupancy of covariates affecting transition rates, we calculated the sensitivity of equilibrium occupancy to changes in each of the continuous covariates (Miller 2012). Sensitivities for each individual covariate were calculated at the mean value for all additional covariates. These sensitivities can be interpreted as the expected magnitude of change in long-term occupancy, given a small change in the covari-ate value. This allows for a more direct interpretation of effect sizes compared with examining the relationship of a covariate to transition probabilities (Miller 2012).
RESULTSThe three most common species of pond-breeding an-
urans in Yosemite N.P. were used in our analysis: R. sier-rae, A. canorus, and P. regilla. We evaluated detectability of these species using double survey data, where a value of 100% would indicate that if one survey detected a species, the companion survey also did so on every oc-casion. Mean annual detectability across all fi ve years ranged from 73.7% + 0.6 (SE) for any life history stage of A. canorus to 86.7% + 0.7 for sites with P. regilla reproduction (eggs or larvae present; Table 2). Year-to-year variation in detectability was low for P. regilla, whether considering any life stage or only those sites with reproduction. Rana sierrae detectability was both intermediate and consistent. Anaxyrus canorus had the most variable detectability, both for any life stage and at sites with reproductive stages. Anaxyrus canorus also had both the lowest (45.9%) and the highest (99.7%) detectability for any of the three species (Table 2). For the six combinations of species and life history
stage, detectability was infl uenced by one or several of the covariates we hypothesized might be important:
Watershed Survey River Mean Unit Sites Drainage Elevation (m)
Buena Vista 13 Merced 2667Gray Peak 16 Merced 3042Merced Pass 14 Merced 2751Porcupine Flat 13 Merced 2509Summit Meadow 9 Merced 2199Turner Meadows 9 Merced 2390Bartlett Peak 11 Tuolumne 2460Dana Meadows 16 Tuolumne 2999Kerrick Meadow 9 Tuolumne 2851Otter Lakes 20 Tuolumne 2737Parker Pass 10 Tuolumne 3245Young Lakes 11 Tuolumne 2978Rock Island Lake 10 Tuolumne 2988Rodgers Lake 11 Tuolumne 2871
Total 172
Table 1. Watershed units (n = 14) and number of sites (e.g., ponds, lakes, meadows) sampled for pond-breeding anurans in Yosemite National Park, 2007–2011.
Journal of North American Herpetology 2015(1) 27
year, water temperature, days after snowmelt, and ob-server (Table 3). Water temperature was included in the best detection model for all but R. sierrae reproduction and in all species and life stages detectability was posi-tively correlated with increased water temperature. Year occurred in all the best models for R. sierrae and A. ca-norus, but not P. regilla. Instead observer and days after snowmelt were in the best detection models for P. re-gilla. Estimates of parameters in the best model for each species are summarized in Table 4. Days after snowmelt was included in the highest ranking models for P. regilla, but not for A. canorus, which has a very short breeding season just as the snow melts at breeding sites, or for R. sierrae, which has larvae that overwinter and do not metamorphose until the third summer.Occupancy was infl uenced by all fi ve covariates we ex-
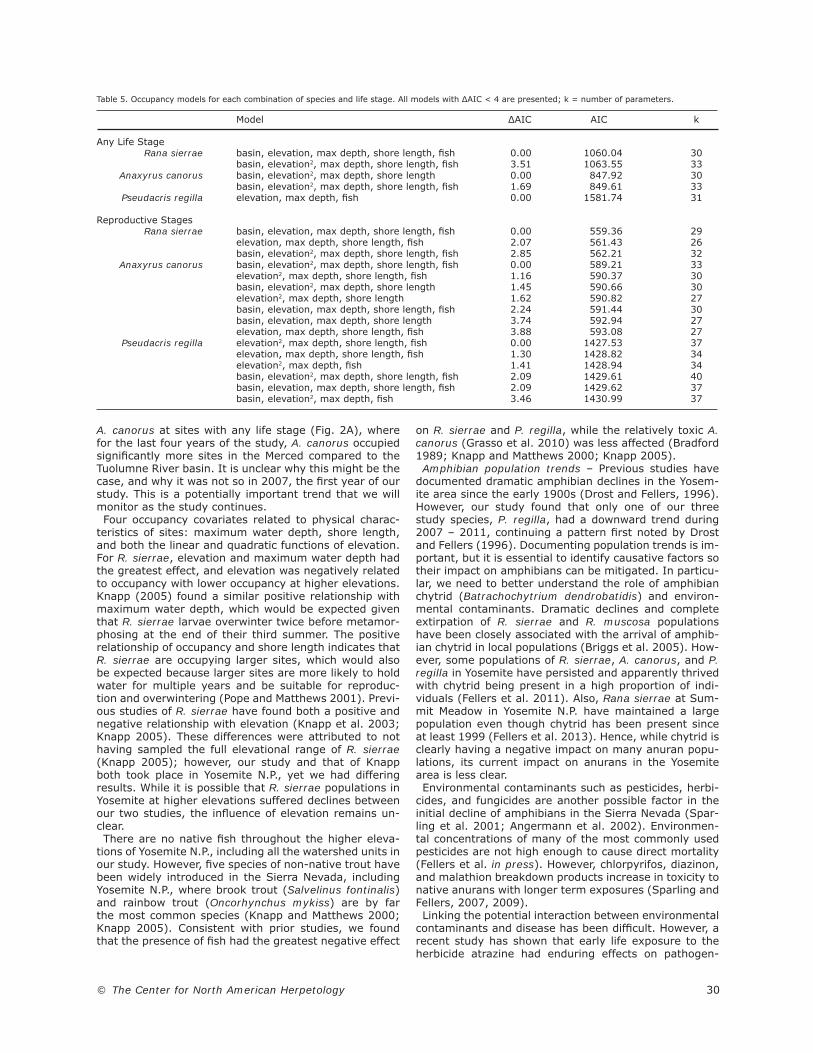
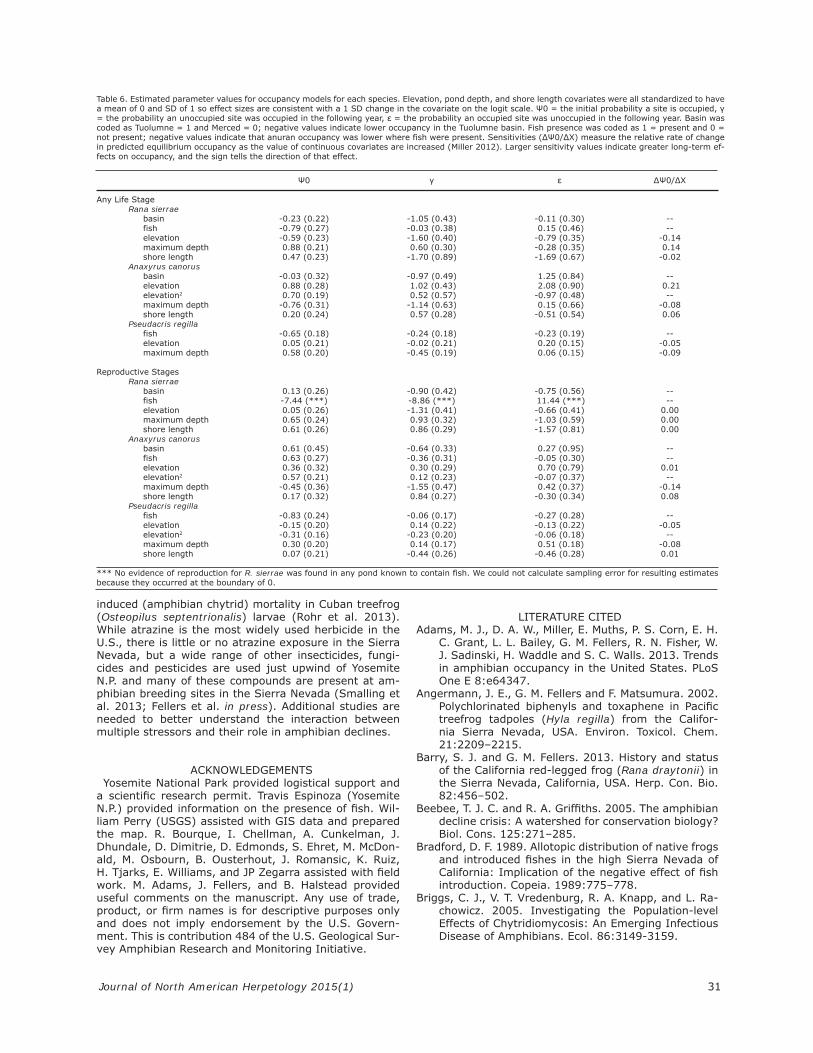
amined (Table 5 and 6). For all six species and life stage combinations, maximum depth and either elevation or elevation2 were included in the best model. Shore length and the presence of fi sh (non-native trout) were included in fi ve of the best models. River basin (Tuolumne ver-sus Merced) was in the best model for the any life stage analysis and for reproductive stages for A. canorus and R. sierrae, but not for P. regilla, while elevation took a quadratic form in both analyses of A. canorus and for sites with P. regilla reproduction. Similarly, the presence of fi sh was an important predictor for all but the any life stage analysis for A. canorus. Estimates of parameters in the best model for each species are summarized in Table 6. Elevation had the largest effect on all three spe-cies, though the effect was negative (lower occupancy at higher elevations) for R. sierrae and P. regilla, and posi-tive for A. canorus. Maximum depth showed the same pattern, positive for R. sierrae and P. regilla, and nega-tive for A. canorus.Mean occupancy across all years and sites for any life
stage was 22.9% for A. canorus, 31.9% for R. sierrae, and 64.3% for P. regilla. Restricting occupancy to those
sites with reproduction resulted in mean occupancy rates of 15.6% for A. canorus, 15.9% for R. sierrae, and 56.4% for P. regilla (Table 2). We saw an increase in oc-cupancy from the fi rst to last year for any life stage of A. canorus (λ = 1.53 CI = 1.02 – 2.10) and a decrease for P. regilla (λ = 0.80 CI = 0.66 – 0.98), while R. sier-rae was relatively similar for the fi rst and last years (λ = 0.93 CI = 0.71 – 1.17). Reproductive occupancy similarly increased for A. canorus (λ = 1.94 CI = 1.26 – 3.21), while confi dence intervals for P. regilla (λ = 0.94 CI = 0.75 – 1.15) and R. sierrae (λ = 1.16 CI = 0.84 – 1.57) both included 1, the expected value if there was no trend in occupancy across years. The presence of introduced fi sh had a negative impact
on occupancy for both R. sierrae and P. regilla when ex-amined either for any life stage or only for sites with reproduction. In the case of R. sierrae, although we ob-served adults at some sites where fi sh were present, we never observed reproduction at sites with fi sh. Fish did not appear in the best model for any life stage of A. ca-norus, but the presence of fi sh was positively related to occupancy of A. canorus reproductive stages (Figure 2, Tables 5 and 6). Occupancy was higher in the Merced basin for any life stage of R. sierrae and for any life stage and reproductive stages (except in 2007) of A. canorus (Figure 2). We examined the relationship between shore length,
maximum depth, and elevation on occupancy for all three anurans (Figure 3). All three variables had negli-gible effects on P. regilla occupancy. Rana sierrae tended to occupy lower elevations, but there was little difference in elevation for sites where R. sierrae reproduced. Oc-cupancy probabilities for A. canorus were initially lower at low elevations. However, the relationship between oc-cupancy and elevation became negligible in later years. Occupancy rates were greater for R. sierrae (both any life stage and reproduction) at sites with longer shore lengths, while A. canorus were more likely to occupy
Any life stage Reproductive stages
Species / Single Detectability Occupancy Single Detectability Occupancy Year Survey (p) (ψ) Survey (p) (ψ)
Rana sierrae 2007 27.9 87.1 32.0 12.2 88.4 14.3 2008 23.2 73.3 36.1 13.4 69.1 19.9 2009 25.0 75.3 34.8 13.4 82.3 15.9 2010 21.5 73.7 27.1 12.2 89.5 13.4 2011 25.0 76.6 29.6 13.4 81.7 15.9 Mean (SE) 25.7 (1.7) 77.2 (2.5) 31.9 (1.6) 13.5 (0.3) 82.2 (3.6) 15.9 (1.1)
Anaxyrus canorus 2007 12.2 88.8 18.3 7.6 99.7 7.9 2008 17.4 64.3 27.3 12.8 65.4 16.6 2009 21.5 84.0 23.0 16.9 80.8 20.5 2010 14.0 56.0 23.8 9.3 45.9 18.2 2011 16.3 75.3 21.9 14.0 91.1 15.0 Mean (SE) 16.9 (1.4) 73.7 (6.1) 22.9 (1.5) 12.5 (1.5) 76.6 (9.6) 15.6 (2.1)
Pseudacris regilla 2007 51.7 82.9 72.4 43.0 86.1 55.6 2008 56.9 84.3 69.1 50.0 84.9 60.0 2009 59.3 85.5 70.5 55.8 85.7 65.3 2010 55.2 86.6 61.4 46.5 88.0 56.4 2011 45.3 88.0 48.0 41.3 88.6 44.5 Mean (SE) 56.0 (2.7) 85.5 (0.9) 64.3 (4.5) 51.3 (3.2) 86.7 (0.7) 56.4 (3.4)
Table 2. Site occupancy of pond-breeding anurans in 14 Yosemite National Park watershed units from 2007 – 2011. Values are the percentage of sites where the species was detected during the initial survey (single survey), estimated percentage of occupied sites where the species was detected (detectability) during a single visit, and estimated percentage of sites that were occupied (occupancy) when we accounted for imperfect (<100%) detection. We estimated probabilities for any life history stage and for a subset of sites that included reproduction (eggs and/or larvae).
© The Center for North American Herpetology 28
sites with shallower wetlands, but tended to occupy wet-lands with longer shore lengths.
DISCUSSIONPrior amphibian surveys – Extensive surveys for pond-
breeding amphibians have been conducted in the Sier-ra Nevada and Cascade Mountains of California. It has been widely assumed either implicitly (Fellers and Drost 1993; Drost and Fellers 1996) or explicitly (Knapp and Mathews 2000; Knapp 2005; Vredenburg et al. 2007) that single surveys were a good indication of presence, but there have been almost no attempts to confi rm this assumption. Brown and Olsen (2013) assumed popula-tion closure over an 8-year period (2002 - 2009) and used surveys repeated over multiple years to estimate detectability of A. canorus and Rana in the R. sierrae/muscosa species complex. While detectability was > 80% for A. canorus surveys conducted early in years with at least normal snowfall, detectability dropped to near zero for mid- to late-summer surveys in low snow-fall years. Detectability was not as sensitive to time of year for R. sierrae/R. muscosa species pair, but detect-ability dropped from a high of 80% for mid- or late-sum-mer surveys in years with little snow to < 20% in years with heavy snow (Brown and Olsen 2013). In our study, we used surveys repeated by a second observer on the same day and found that detectability was high for all three of the anurans in Yosemite N.P., ranging from a mean of 73.7% (any life stage of A. canorus) to 86.7% (reproductive stages of P. regilla). Rana sierrae, which is a close relative of R. muscosa, ranged from a mean of 77.2% for any life stage to 82.2% for sites with repro-duction. These results are important because they add credibility to the largely untested assumption that an-urans occupying high elevation sites in the Sierra Nevada are readily detectable, and hence surveys that extend back to at least 1992 (Drost and Fellers 1996) should be a good indication of amphibian occurrence. However, detectability should be accounted for in study designs for Sierran amphibian studies whenever possible. Detectability implications – Although detectability was
generally high in our study, we did observe differences as a function of year, water temperature, and observer. While adults of these montane anurans can be active at low temperatures, especially during the breeding season [e.g., adult R. muscosa traversing over snow (Pope and Matthews 2001), and adult P. regilla calling at 0° C (pers. obs.)], the larvae are more active and more detectable at higher water temperatures. Our results reinforce our survey protocol, which specifi es that surveys not be con-ducted when environmental temperatures are low.
Not all observers are equally skilled at detecting verte-brate species, whether they be birds (Sauer et al. 1994; Farmer et al. 2012), snakes (Dorcas and Willson 2009), or frogs (Gooch et al. 2006; Pierce and Gutzwiller 2007; Miller et al. 2012). In our study, observer was a high ranking covariate only for P. regilla, the most frequently encountered anuran. Although observer was not included in the best model for the other species, we may have had limited power to estimate differences among 12 observ-ers for the less common R. sierrae and A. canorus.Year was the second most common covariate that in-fl uenced detectability for all three species, whether con-sidering any life stage or only reproductive stages. Year probably refl ected a combination of factors including an-nual snow accumulation, variation in observer ability, and changes in average abundance. Pseudacris regilla larvae were often abundant at sites where they bred, which led to high detectability that was probably not related to year. However, detectability can sometimes decrease as population size decreases (Tanadini and Schmidt 2011). Also, while many of our fi eld crew members worked in multiple years, there was some annual turnover. Differ-ences in each observer’s ability to fi nd amphibians may have contributed to year being an important variable.
Site occupancy in Yosemite – Site occupancy was high-est for P. regilla and lowest for A. canorus, with R. sierrae somewhat higher than A. canorus. This pattern held true when calculating site occupancy for any life stage, or for those sites with reproduction. These fi ndings are similar to Knapp (2005), though our survey and analytical tech-niques were somewhat different. Most notably, Knapp used single site surveys that did not account for detect-ability; hence his occupancy estimates were negatively biased because they were not corrected for imperfect de-tection. Knapp (2005) reported that R. sierrae reproduc-tive stages (eggs, larvae, or recent metamorphs) were found at 11%, A. canorus at 3%, and P. regilla at 57% of the 2,655 sites surveyed in Yosemite N.P. between 2000 and 2002. These numbers were similar to our uncorrected single surveys that detected eggs or larvae at a mean of 13.5, 12.5, and 51.3% from 2007 – 2011 for those same species. Because we restricted our surveys to watershed units that were within the historic range of R. sierrae, all of which were also within the geographic range of both A. canorus and P. regilla, one would expect our estimates of occupancy to be somewhat higher than those of Knapp (2005), who included all lentic water bodies in Yosemite N.P. Also, his inclusion of recent metamorphs (versus our inclusion of only eggs and larvae) probably increased the number of sites where he reported reproduction. While
Model ΔAIC AIC k
Any Life Stage Rana sierrae year, temperature 0.00 1063.55 33 year 2.83 1066.38 32 observer, date, temperature 3.45 1067.00 40 Anaxyrus canorus year, temperature 0.00 849.61 33 Pseudacris regilla observer, date, temperature 0.00 1595.09 40 year, temperature 0.75 1595.84 33
Reproductive Stages Rana sierrae year 0.00 562.21 32 year, temperature 1.29 563.49 33 Anaxyrus canorus year, temperature 0.00 589.21 33 Pseudacris regilla observer, date, temperature 0.00 1429.61 40
Table 3. Detection models for each combination of species and life stage. Temperature = water temperature, date = days after snowmelt at our Gin Flat reference site. AIC = Akaike’s Information Criterion. All models with ΔAIC < 4 are presented; k = number of parameters.
Journal of North American Herpetology 2015(1) 29
the magnitude of this is diffi cult to evaluate, it is likely fairly small. The effect would be the least for R. sierrae because they overwinter as larvae and metamorphose at the end of the third summer; hence, reproductive stages are present at breeding sites all year long (Vredenburg et al. 2005). By contrast, A. canorus spend the short-est amount of time at breeding sites (Karlstrom 1962; Kagarise Sherman 1980). Knapp (2005) reported A. ca-norus reproduction at only 3% of sites compared with our uncorrected 12.5%. When correcting for detectabil-ity, we had a fi ve-year mean of 15.6% of sites occupied by A. canorus reproductive stages, and 22.9% of sites occupied by any life stage. Anaxyrus canorus detectabil-ity was quite variable in our study, ranging from 45.9 – 99.7% (Table 2), but it is unlikely that detectability was consistently low throughout the three years of Knapp’s study. While we did not see an increase or decrease in occupancy (Ψ) during the fi ve years of our study (2007 – 2011), it is possible that A. canorus occupancy increased during the fi ve-year interval between our surveys and those of Knapp (2005). Single survey occupancy estimates for R. sierrae var-
ied little between Knapp’s 2000 – 2002 surveys and our 2007 – 2011 surveys. Furthermore, we found no signifi -cant change in occupancy of either sites with reproduc-tion or any life stage for R. sierrae. This would not be the expected pattern given recent concerns about the decline of R. sierrae and the closely related R. muscosa in the southern Sierra Nevada (Vredenburg et al. 2010). However, it is quite possible that signifi cant R. sierrae declines occurred in Yosemite prior to recent amphibian studies by Drost and Fellers (1996), Knapp (2005), and our present study. This hypothesis would be supported by an eight-year study of a R. sierrae population in a large meadow system (Summit Meadow) in Yosemite N.P. (Fellers et al. 2013) where there were annual fl uctu-ations in population size, but no overall decline. Ongoing monitoring of all the watershed units in our study, and ongoing mark-recapture of R. sierrae at Summit Meadow will hopefully shed light on population trends in Yosemite. Brown and Olsen (2013) studied A. canorus and R. si-
errae/muscosa in the Sierra Nevada, but it is diffi cult to make comparisons with their fi ndings. Their work spanned 625 km of the Sierra Nevada (including areas surrounding Yosemite N.P.) and the Cascade Mountains. Also, their data were analyzed assuming closed popu-lations over the eight years of the study. Though they accounted for detectability when estimating occupancy, detectability was calculated with surveys repeated in subsequent years, not on the same day. Their occupan-cy estimates for any life stage for drainage basins (not sites) ranged from 66 – 86% for basins within the range of A. canorus, and 29 – 47% of basins with R. sierrae/muscosa. Similar to our study, however, Brown and Ol-
Any Life Stage Reproductive Stages Parameter Rana Anaxyrus Pseudacris Rana Anaxyrus Pseudacris
2008 -0.96 (0.42) -1.64 (0.82) **** -1.22 (0.57) -34.55 (1.54) *** 2009 -0.77 (0.43) -0.35 (0.71) **** -0.49 (0.62) -33.56 (1.52) **** 2010 -0.77 (0.46) -1.72 (0.58) **** 0.11 (0.69) -35.13 (1.48) **** 2011 -0.61 (0.46) -0.77 (0.63) **** -0.5 (0.62) -32.48 (1.63) **** temperature 0.29 (0.13) 0.51 (0.20) 0.60 (0.11) **** 0.49 (0.17) 0.54 (0.13) date **** **** 0.41 (0.11) **** **** 0.53 (0.14)
**** = covariates that did not appear in the best model.
Table 4. Estimated effects (SE) for detection covariates. Temperature = water temperature, date = days after snowmelt at our Gin Flat reference site. Annual effects are relative to 2007. Estimates are only given for effects in the best model. Observer effects are not included.
sen (2013) did not fi nd declines in Rana occupancy. Pseudacris regilla was the only species where occupancy
declined during our study. While there was no signifi cant trend for sites with reproduction, there was a signifi cant decline for sites with any life stage. That pattern was not caused by drought. In years with less than average snowfall, some P. regilla breeding sites dry up before larvae can metamorphose. During the fi ve years of our study, there was more snow each winter, which would al-low small ponds to persist longer, thus providing better P. regilla habitat each year. However, fi ve years may not be a long enough period to observe subtle population trends for any of our study species. We will continue to track population trends throughout Yosemite N.P.The pattern we observed for P. regilla cannot be com-
pared with that of Knapp (2005) because he only reported on sites where P. regilla had reproduced. However, when comparing 1915 surveys by Grinnell and Storer (1924) and subsequent surveys at the same study sites in 1992, Drost and Fellers (1996) reported a decline in abundance for P. regilla at high elevation (> 1500m) sites. While a decrease in abundance is different from a decrease in sites occupied, it is the only other study to suggest that there might be concern for P. regilla, one of the more common species of amphibian in the Sierra Nevada and elsewhere in California.Outside of Yosemite N.P., there have been only limited
studies of amphibian occupancy in the Sierra Nevada. Knapp et al. (2003) reported that during 1995 – 1997, only 238 (14%) of 1,718 water bodies were occupied by R. sierrae/muscosa throughout their study area which included the John Muir Wilderness (Sierra National For-est) and Kings Canyon National Park, an area that ex-tends from near the southeast corner of Yosemite N.P. to about 160 km south. This occupancy rate is only slightly higher than the 11% found by Knapp (2005) in Yosemite in 2000 – 2002. The difference is not likely to be signifi -cant, and might be explained by the inclusion of any life stage in the earlier study compared with only reproduc-tive stages in Yosemite surveys. However, 14% is mark-edly lower than the 21.9 – 32.2% occupancy (mean = 25.7%) for the R. sierrae that we found for sites with any life stage during our initial (fi rst of two) surveys at each site. Correcting for detectability, our estimates of occu-pancy ranged from 27.1 – 36.1% (mean = 31.9%) for any life stage. While there could be changes in occupancy in the decade between the Knapp et al. (2003) study and ours, it is also possible that occupancy is higher in Yosemite N.P. compared with areas farther south. This could be due to greater exposure to pesticides (Sparling et al. 2001) or differences in exposure to the amphibian chytrid fungus, Batrachochytrium dendrobatidis. Factors affecting occupancy – Drainage basin (Tuolumne
versus Merced) was an important covariate for both R. si-errae and A. canorus. This is seen most conspicuously for
© The Center for North American Herpetology 30
A. canorus at sites with any life stage (Fig. 2A), where for the last four years of the study, A. canorus occupied signifi cantly more sites in the Merced compared to the Tuolumne River basin. It is unclear why this might be the case, and why it was not so in 2007, the fi rst year of our study. This is a potentially important trend that we will monitor as the study continues. Four occupancy covariates related to physical charac-
teristics of sites: maximum water depth, shore length, and both the linear and quadratic functions of elevation. For R. sierrae, elevation and maximum water depth had the greatest effect, and elevation was negatively related to occupancy with lower occupancy at higher elevations. Knapp (2005) found a similar positive relationship with maximum water depth, which would be expected given that R. sierrae larvae overwinter twice before metamor-phosing at the end of their third summer. The positive relationship of occupancy and shore length indicates that R. sierrae are occupying larger sites, which would also be expected because larger sites are more likely to hold water for multiple years and be suitable for reproduc-tion and overwintering (Pope and Matthews 2001). Previ-ous studies of R. sierrae have found both a positive and negative relationship with elevation (Knapp et al. 2003; Knapp 2005). These differences were attributed to not having sampled the full elevational range of R. sierrae (Knapp 2005); however, our study and that of Knapp both took place in Yosemite N.P., yet we had differing results. While it is possible that R. sierrae populations in Yosemite at higher elevations suffered declines between our two studies, the infl uence of elevation remains un-clear. There are no native fi sh throughout the higher eleva-
tions of Yosemite N.P., including all the watershed units in our study. However, fi ve species of non-native trout have been widely introduced in the Sierra Nevada, including Yosemite N.P., where brook trout (Salvelinus fontinalis) and rainbow trout (Oncorhynchus mykiss) are by far the most common species (Knapp and Matthews 2000; Knapp 2005). Consistent with prior studies, we found that the presence of fi sh had the greatest negative effect
on R. sierrae and P. regilla, while the relatively toxic A. canorus (Grasso et al. 2010) was less affected (Bradford 1989; Knapp and Matthews 2000; Knapp 2005).Amphibian population trends – Previous studies have
documented dramatic amphibian declines in the Yosem-ite area since the early 1900s (Drost and Fellers, 1996). However, our study found that only one of our three study species, P. regilla, had a downward trend during 2007 – 2011, continuing a pattern fi rst noted by Drost and Fellers (1996). Documenting population trends is im-portant, but it is essential to identify causative factors so their impact on amphibians can be mitigated. In particu-lar, we need to better understand the role of amphibian chytrid (Batrachochytrium dendrobatidis) and environ-mental contaminants. Dramatic declines and complete extirpation of R. sierrae and R. muscosa populations have been closely associated with the arrival of amphib-ian chytrid in local populations (Briggs et al. 2005). How-ever, some populations of R. sierrae, A. canorus, and P. regilla in Yosemite have persisted and apparently thrived with chytrid being present in a high proportion of indi-viduals (Fellers et al. 2011). Also, Rana sierrae at Sum-mit Meadow in Yosemite N.P. have maintained a large population even though chytrid has been present since at least 1999 (Fellers et al. 2013). Hence, while chytrid is clearly having a negative impact on many anuran popu-lations, its current impact on anurans in the Yosemite area is less clear.Environmental contaminants such as pesticides, herbi-
cides, and fungicides are another possible factor in the initial decline of amphibians in the Sierra Nevada (Spar-ling et al. 2001; Angermann et al. 2002). Environmen-tal concentrations of many of the most commonly used pesticides are not high enough to cause direct mortality (Fellers et al. in press). However, chlorpyrifos, diazinon, and malathion breakdown products increase in toxicity to native anurans with longer term exposures (Sparling and Fellers, 2007, 2009). Linking the potential interaction between environmental
contaminants and disease has been diffi cult. However, a recent study has shown that early life exposure to the herbicide atrazine had enduring effects on pathogen-
Model ΔAIC AIC k
Any Life Stage Rana sierrae basin, elevation, max depth, shore length, fi sh 0.00 1060.04 30 basin, elevation2, max depth, shore length, fi sh 3.51 1063.55 33 Anaxyrus canorus basin, elevation2, max depth, shore length 0.00 847.92 30 basin, elevation2, max depth, shore length, fi sh 1.69 849.61 33 Pseudacris regilla elevation, max depth, fi sh 0.00 1581.74 31
Reproductive Stages Rana sierrae basin, elevation, max depth, shore length, fi sh 0.00 559.36 29 elevation, max depth, shore length, fi sh 2.07 561.43 26 basin, elevation2, max depth, shore length, fi sh 2.85 562.21 32 Anaxyrus canorus basin, elevation2, max depth, shore length, fi sh 0.00 589.21 33 elevation2, max depth, shore length, fi sh 1.16 590.37 30 basin, elevation2, max depth, shore length 1.45 590.66 30 elevation2, max depth, shore length 1.62 590.82 27 basin, elevation, max depth, shore length, fi sh 2.24 591.44 30 basin, elevation, max depth, shore length 3.74 592.94 27 elevation, max depth, shore length, fi sh 3.88 593.08 27 Pseudacris regilla elevation2, max depth, shore length, fi sh 0.00 1427.53 37 elevation, max depth, shore length, fi sh 1.30 1428.82 34 elevation2, max depth, fi sh 1.41 1428.94 34 basin, elevation2, max depth, shore length, fi sh 2.09 1429.61 40 basin, elevation, max depth, shore length, fi sh 2.09 1429.62 37 basin, elevation2, max depth, fi sh 3.46 1430.99 37
Table 5. Occupancy models for each combination of species and life stage. All models with ΔAIC < 4 are presented; k = number of parameters.
Journal of North American Herpetology 2015(1) 31
induced (amphibian chytrid) mortality in Cuban treefrog (Osteopilus septentrionalis) larvae (Rohr et al. 2013). While atrazine is the most widely used herbicide in the U.S., there is little or no atrazine exposure in the Sierra Nevada, but a wide range of other insecticides, fungi-cides and pesticides are used just upwind of Yosemite N.P. and many of these compounds are present at am-phibian breeding sites in the Sierra Nevada (Smalling et al. 2013; Fellers et al. in press). Additional studies are needed to better understand the interaction between multiple stressors and their role in amphibian declines.
ACKNOWLEDGEMENTSYosemite National Park provided logistical support and
a scientifi c research permit. Travis Espinoza (Yosemite N.P.) provided information on the presence of fi sh. Wil-liam Perry (USGS) assisted with GIS data and prepared the map. R. Bourque, I. Chellman, A. Cunkelman, J. Dhundale, D. Dimitrie, D. Edmonds, S. Ehret, M. McDon-ald, M. Osbourn, B. Ousterhout, J. Romansic, K. Ruiz, H. Tjarks, E. Williams, and JP Zegarra assisted with fi eld work. M. Adams, J. Fellers, and B. Halstead provided useful comments on the manuscript. Any use of trade, product, or fi rm names is for descriptive purposes only and does not imply endorsement by the U.S. Govern-ment. This is contribution 484 of the U.S. Geological Sur-vey Amphibian Research and Monitoring Initiative.
LITERATURE CITEDAdams, M. J., D. A. W., Miller, E. M uths, P. S. Corn, E. H.
C. Grant, L. L. Bailey, G. M. Fellers, R. N. Fisher, W. J. Sadinski, H. Waddle and S. C. Walls. 2013. Trends in amphibian occupancy in the United States. PLoS One E 8:e64347.
Angermann, J. E., G. M. Fellers and F. Matsumura. 2002. Polychlorinated biphenyls and toxaphene in Pacifi c treefrog tadpoles (Hyla regilla) from the Califor-nia Sierra Nevada, USA. Environ. Toxicol. Chem. 21:2209–2215.
Barry, S. J. and G. M. Fellers. 2013. History and status of the California red-legged frog (Rana draytonii) in the Sierra Nevada, California, USA. Herp. Con. Bio. 82:456–502.
Beebee, T. J. C. and R. A. Griffi ths. 2005. The amphibian decline crisis: A watershed for conservation biology? Biol. Cons. 125:271–285.
Bradford, D. F. 1989. Allotopic distribution of native frogs and introduced fi shes in the high Sierra Nevada of California: Implication of the negative effect of fi sh introduction. Copeia. 1989:775–778.
Briggs, C. J., V. T. Vredenburg, R. A. Knapp, and L. Ra-chowicz. 2005. Investigating the Population-level Effects of Chytridiomycosis: An Emerging Infectious Disease of Amphibians. Ecol. 86:3149-3159.
Ψ0 γ ε ΔΨ0/ΔX
Any Life Stage Rana sierrae basin -0.23 (0.22) -1.05 (0.43) -0.11 (0.30) -- fish -0.79 (0.27) -0.03 (0.38) 0.15 (0.46) -- elevation -0.59 (0.23) -1.60 (0.40) -0.79 (0.35) -0.14 maximum depth 0.88 (0.21) 0.60 (0.30) -0.28 (0.35) 0.14 shore length 0.47 (0.23) -1.70 (0.89) -1.69 (0.67) -0.02 Anaxyrus canorus basin -0.03 (0.32) -0.97 (0.49) 1.25 (0.84) -- elevation 0.88 (0.28) 1.02 (0.43) 2.08 (0.90) 0.21 elevation2 0.70 (0.19) 0.52 (0.57) -0.97 (0.48) -- maximum depth -0.76 (0.31) -1.14 (0.63) 0.15 (0.66) -0.08 shore length 0.20 (0.24) 0.57 (0.28) -0.51 (0.54) 0.06 Pseudacris regilla fish -0.65 (0.18) -0.24 (0.18) -0.23 (0.19) -- elevation 0.05 (0.21) -0.02 (0.21) 0.20 (0.15) -0.05 maximum depth 0.58 (0.20) -0.45 (0.19) 0.06 (0.15) -0.09
Reproductive Stages Rana sierrae basin 0.13 (0.26) -0.90 (0.42) -0.75 (0.56) -- fish -7.44 (***) -8.86 (***) 11.44 (***) -- elevation 0.05 (0.26) -1.31 (0.41) -0.66 (0.41) 0.00 maximum depth 0.65 (0.24) 0.93 (0.32) -1.03 (0.59) 0.00 shore length 0.61 (0.26) 0.86 (0.29) -1.57 (0.81) 0.00 Anaxyrus canorus basin 0.61 (0.45) -0.64 (0.33) 0.27 (0.95) -- fish 0.63 (0.27) -0.36 (0.31) -0.05 (0.30) -- elevation 0.36 (0.32) 0.30 (0.29) 0.70 (0.79) 0.01 elevation2 0.57 (0.21) 0.12 (0.23) -0.07 (0.37) -- maximum depth -0.45 (0.36) -1.55 (0.47) 0.42 (0.37) -0.14 shore length 0.17 (0.32) 0.84 (0.27) -0.30 (0.34) 0.08 Pseudacris regilla fish -0.83 (0.24) -0.06 (0.17) -0.27 (0.28) -- elevation -0.15 (0.20) 0.14 (0.22) -0.13 (0.22) -0.05 elevation2 -0.31 (0.16) -0.23 (0.20) -0.06 (0.18) -- maximum depth 0.30 (0.20) 0.14 (0.17) 0.51 (0.18) -0.08 shore length 0.07 (0.21) -0.44 (0.26) -0.46 (0.28) 0.01
*** No evidence of reproduction for R. sierrae was found in any pond known to contain fish. We could not calculate sampling error for resulting estimates because they occurred at the boundary of 0.
Table 6. Estimated parameter values for occupancy models for each species. Elevation, pond depth, and shore length covariates were all standardized to have a mean of 0 and SD of 1 so effect sizes are consistent with a 1 SD change in the covariate on the logit scale. Ψ0 = the initial probability a site is occupied, γ = the probability an unoccupied site was occupied in the following year, ε = the probability an occupied site was unoccupied in the following year. Basin was coded as Tuolumne = 1 and Merced = 0; negative values indicate lower occupancy in the Tuolumne basin. Fish presence was coded as 1 = present and 0 = not present; negative values indicate that anuran occupancy was lower where fish were present. Sensitivities (ΔΨ0/ΔX) measure the relative rate of change in predicted equilibrium occupancy as the value of continuous covariates are increased (Miller 2012). Larger sensitivity values indicate greater long-term ef-fects on occupancy, and the sign tells the direction of that effect.
© The Center for North American Herpetology 32
Brown C. and A. R. Olsen. 2013. Bioregional monitor-ing design and occupancy estimation for two Sierra Nevadan amphibian taxa. Freshw. Sci. 32:675–691.
Crump M. L. and N. J. Scott, Jr. 1994. Visual encoun-ter surveys. In: Heyer W. R., M. A. Donnelly, R. W. McDiarmid, L. C. Hayek and M. S. Foster (editors). Measuring and monitoring biological diversity: Stan-dard methods for amphibians. Smithsonian Institu-tion Press, Washington DC. pp 84–92.
Dorcas, M. E. and J. D. Willson. 2009. Innovative meth-ods for studies of snake ecology and conservation. In: Mullin, S. J. and R. A. Seigel (editors). Snakes, ecology and conservation. Cornell University Press, Ithaca. pp 5–37.
Drost, C. A. and G. M. Fellers. 1996. Collapse of a re-gional frog fauna in the Yosemite area of the Sierra Nevada. Cons. Bio. 10:414–425.
Farmer, R. G., M. L. Leonard and A. G. Horn. 2012. Ob-server effects and avian-call-count survey qual-ity: Rare-species biases and overconfi dence. Auk. 129:76–86.
Fellers, G. M. and C. A. Drost. 1993. Disappearance of the Cascades frog, Rana cascadae, at the southern end of its range. Biol. Cons. 65:177–181.
Fellers, G. M., P. M. Kleeman, D. A. W. Miller, B. J. Hal-stead and W. A. Link. 2013. Population size, sur-vival, growth, and movements of the Sierra Nevada yellow-legged frog, Rana sierrae. Herpetologica. 69:147–162.
Fellers, G. M., L. L. McConnell, D. W. Sparling and P. M. Kleeman. In press. Pesticides in amphibian habitats of central California. In: McConnell, L. L. (ed.). Oc-currence, fate and impact of atmospheric pollut-ants on environmental and human health. American Chemical Society Books. Washington, D.C.
Fiske, I. J. and R. B. Chandler. 2011. Unmarked: An R package for fi tting hierarchical models of wildlife oc-currence and abundance. J. Stat. Softw. 43:1–23.
Gooch, M. M., A. M. Heupel, S. J. Price and M. E. Dorcas. 2006. The effects of survey protocol on detection probabilities and site occupancy estimates of sum-mer breeding anurans. Appl. Herp. 3:129–142.
Grasso, R. L., R. M. Coleman and C. Davidson. 2010. Palatability and antipredator response of Yosemite toads (Anaxyrus canorus) to nonnative brook trout (Salvelinus fontinalis) in the Sierra Nevada moun-tains of California. Copeia. 3:457–462.
Grinnell, J. and T. I. Storer. 1924. Animal life in the Yo-semite. University of California Press, Berkeley, CA. xviii + 752 pp.
IUCN (International Union for Conservation of Nature). 2010. IUCN red list of threatened species. Version 2013. http://www.iucnredlist.org. Accessed 17 Jan-uary 2014
Karlstrom, E. L. 1962. The toad genus Bufo in the Sierra Nevada of California: Ecological and systematic rela-tionships. Univ. Calif. Publ. Zool. 62:1–104.
Kagarise Sherman, C. 1980. A comparison of the natural history and mating system of two anurans: Yosemite toads (Bufo canorus) and black toads (Bufo exsul). Ph.D. Dissertation. Univ. Michigan, Ann Arbor.
Knapp, R. A. 2005. Effects of nonnative fi sh and habitat characteristics on lentic herpetofauna in Yosemite National Park, USA. Biol. Cons. 121:265–279.
Knapp, R. A. and K. R. Matthews. 2000. Nonnative fi sh introductions and the decline of the mountain yel-low-legged frog from within protected areas. Cons.
Biol. 14:428–438.Knapp, R. A, K. R. Matthews, H. K. Preisler and R. Jel-
lison. 2003. Developing probabilistic models to pre-dict amphibian site occupancy in a patchy landscape. Ecol. Appl. 13:1069–1082.
MacKenzie, D. I. 2006. Occupancy estimation and mod-eling: Inferring patterns and dynamics of species oc-currence. Academic Press. 344 p.
MacKenzie, D. I., J. D. Nichols, J. E. Hines, M. G. Knutson and A. B. Franklin. 2003. Estimating site occupancy, colonization, and local extinction when a species is detected imperfectly. Ecol. 84:2200–2207.
MacKenzie, D. I., J. D. Nichols, G. B. Lachman, S. Droge and C. A. Langtimm. 2002. Estimating site occupan-cy rates when detection probabilities are less than one. Ecol. 2002:2248–2255.
McCallum, M. L. 2007. Amphibian decline or extinction? Current declines dwarf background extinction rate. J. Herp. 41:483–491.
Miller, D. A. W. 2012. General methods for sensitivity analysis of equilibrium dynamics in patch occupancy models. Ecol. 93:1204–1213.
Miller, D. A. W., L. A. Weir, B. T. McClintock, E. H. C. Grant, L. L. Bailey and T. R. Simons. 2012. Experimental investigation of false positive errors in auditory spe-cies occurrence surveys. Ecol. Appl. 22:1665–1674.
Pierce, B. A. and K. J. Gutzwiller. 2007. Interobserver variation in frog call surveys. J. Herp. 41:424–429.
Pope, K. L. and K. R. Matthews. 2001. Movement ecol-ogy and seasonal distribution of mountain yellow-legged frogs, Rana muscosa, in a high-elevation Si-erra Nevada basin. Copeia. 3:787–793.
R Development Core Team. 2011. R version 2.14. 1.Rohr, J. R., T. R. Raffel, N. T. Halstead, T. A. McMahon, S.
A. Johnson, R. K. Boughton and L. B. Martin. 2013. Early-life exposure to a herbicide has enduring ef-fects on pathogen-induced mortality. Proc. R. Soc. B. 280:20131502.
Sauer, J. R., B. G. Peterjohn and W. A. Link. 1994. Ob-server differences in the north american breeding bird survey. Auk. 111:50–62.
Serreze, M. C., M. P. Clark, R. L. Armstrong, D. A. McGin-nis and R. S. Pulwarty. 1999. Characteristics of the western United States snowpack from snowpack te-lemetry (SNOTEL) data. Water Resour. Res. 35:2145 – 2160.
Smalling, K. L., G. M. Fellers, P. M. Kleeman and K. M. Kuivila. 2013. Accumulation of pesticides in pacifi c chorus frogs (Pseudacris regilla) from California’s Sierra Nevada mountains, USA. Environ. Toxicol. Chem. 32:2026–2034.
Sparling, D. W. and G. M. Fellers. 2007. Comparative toxicity of chlorpyrifos, diazinon, malathion and their oxon derivatives to Rana boylii. Environ. Pollut. 147:535–539.
Sparling, D. W. and G. M. Fellers. 2009. Toxicity of two insecticides to California, USA, anurans and its rel-evance to declining amphibian populations. Environ. Toxicol. Chem. 28:1696–1703.
Sparling, D. W., G. M. Fellers and L. L. McConnell. 2001. Pesticides and amphibian declines in California, USA. Environ. Toxicol. Chem. 20:1591–1595.
Stuart, S. N., J. S. Chanson, N. A. Cox, B. E. Young, A. S. L. Rodrigues, D. L. Fischman and R. W. Waller. 2004. Status and trends of amphibian declines and extinc-tions worldwide. Sci. 306:1783–1786.
Tanadini, L. G. and B. R. Schmidt. 2011. Population size
Journal of North American Herpetology 2015(1) 33
infl uences amphibian detection probability: Impli-cations for biodiversity monitoring programs. PLoS ONE 6:e28244.
Vredenburg, V. T., R. Bingham, R. A. Knapp, J. A. T. Mor-gan, C. Moritz and D. B. Wake. 2007. Concordant molecular and phenotypic data delineate new tax-onomy and conservation priorities for the endan-gered mountain yellow-legged frog. 2007. J. Zool. 271:361–374.
Vredenburg, V. T., G. M. Fellers and C. Davidson. 2005. Rana muscosa Camp 1917 mountain yellow-legged frog. In: Lannoo, M. J. (ed.). Amphibian declines:
The conservation status of United States spe-cies. University of California Press, Berkeley. pp 563 – 566.
Vredenburg, V. T., R. A. Knapp, T. S. Tunstall and C. J. Briggs. 2010. Dynamics of an emerging disease drive large-scale amphibian popula-tion extinctions. Proc. Natl. Acad. Sci., USA. 107:9695–9700.
Wake, D. B. and V. T. Vredenburg. 2008. Are we in the midst of the sixth mass extinction? A view from the world of amphibians. Proc. Natl. Acad. Sci., USA. 105:11466-11473.
Detection Models1 - year2 - observer and date3 - year, and temp4 - observer, date, and temp
Occupancy Models (ψ0, εt, and γt).1 - basin, elevation2, maximum depth, shore length, fi sh2 - basin, elevation2, maximum depth, fi sh3 - basin, elevation2, shore length, fi sh 4 - basin, elevation2, fi sh 5 - basin, elevation, maximum depth, shore length, fi sh 6 - basin, elevation, maximum depth, fi sh 7 - basin, elevation, shore length, fi sh 8 - basin, elevation, fi sh 9 - elevation2, maximum depth, shore length, fi sh 10 - elevation2, maximum depth, fi sh 11 - elevation2, shore length, fi sh 12 - eelevation2, fi sh
APPENDIXTable S1. We considered the following set of alternative models for each combination of species and life stage (any life stage versus reproductive stages) to evaluate their influence on detectability and occupancy. We included a categorical effect of year on extinction and colonization in all oc-cupancy parameter models.
13 - elevation, maximum depth, shore length, fi sh 14 - elevation, maximum depth, fi sh 15 - elevation, shore length, fi sh 16 - elevation, fi sh 17 - basin, elevation2, maximum depth, shore18 - basin, elevation2, maximum depth19 - basin, elevation2, shore20 - basin, elevation2
21 - basin, elevation, maximum depth, shore22 - basin, elevation, maximum depth23 - basin, elevation, shore24 - basin, elevation25 - elevation2, maximum depth, shore26 - elevation2, maximum depth27 - elevation2, shore28 - elevation2
29 - elevation, maximum depth, shore30 - elevation, maximum depth31 - elevation, shore32 - elevation