Embed Size (px)
Citation preview
ANGRAU/AI & CC/2018 Regd. No. 25487/73
Printed at Ritunestham Press, Guntur and Published by Dr. D. Balaguravaiah, Dean of P.G. Studies and Editor-in- Chief,The Journal of Research ANGRAU, Acharya N.G. Ranga Agricultural University, Lam, Guntur - 522 034
E-mail : [email protected], URL: www.angrau.ac.in/publications
ACHARYA N.G. RANGA AGRICULTURAL UNIVERSITYLam, Guntur - 522 034
ISSN No. 0970-0226
ANGRAU
THE JOURNAL OFRESEARCHANGRAU
The J. Res. A
NG
RA
U, Vol. XLV I N
o. (3), pp. 1-95, July-September, 2018
Indexed by CAB International (CABI)www.cabi.org and www.angrau.ac.in
The J. Res. ANGRAU, Vol. XLVI No. (3), pp. 1-95, July-September, 2018
SUBSCRIPTION TARIFF
Individual (Annual) : Rs 400/- Institute (Annual) : Rs. 2000/-Individual (Life) : Rs. 2000/- Printing Charges : Rs. 125/- per page
D.D drawn in favour of COMPTROLLER, ANGRAU, GUNTUR may be sent to the Managing Editor,Agricultural Information & Communication Centre, Srinivasa Citadel, Lam, Guntur - 522 034, A.P.
EDITOR : Dr. A. Lalitha, AI & CC, Lam, Guntur - 522 034
EDITOR - IN - CHIEFDr. D. Balaguravaiah
Dean of P.G. Studies, ANGRAU, GunturAdministrative Office, Lam, Guntur-522 034
MANAGING EDITORDr. P. Punna Rao
Principal Agricultural Information Officer,AI & CC, Lam, Guntur - 522 034
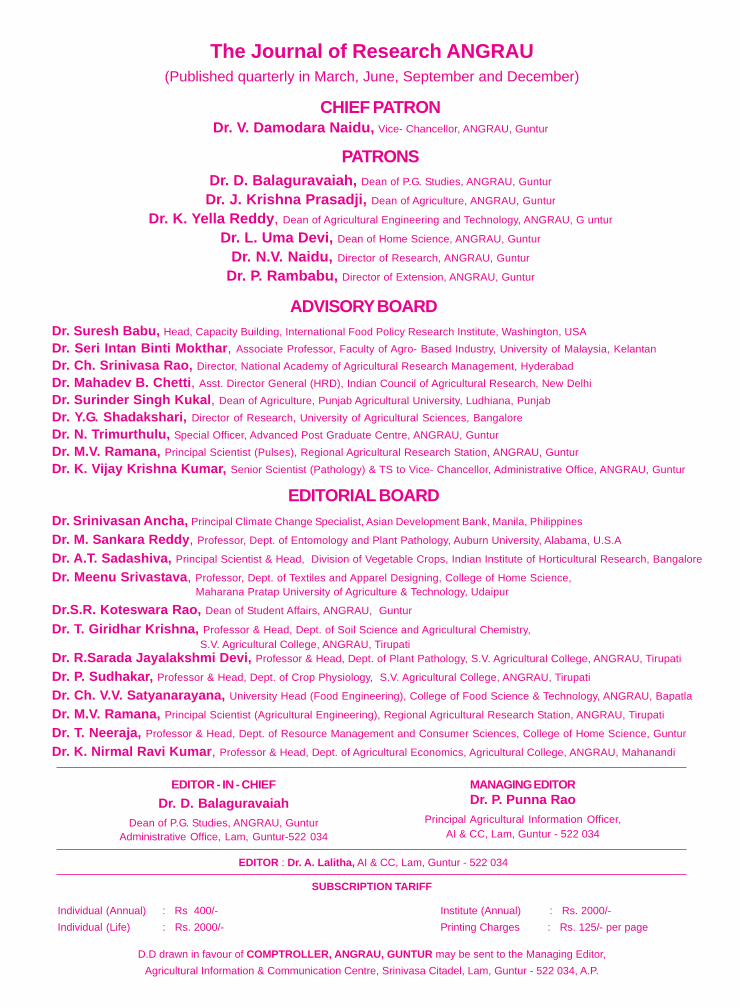
The Journal of Research ANGRAU(Published quarterly in March, June, September and December)
PATRONS
EDITORIAL BOARDDr. Srinivasan Ancha, Principal Climate Change Specialist, Asian Development Bank, Manila, Philippines
Dr. M. Sankara Reddy, Professor, Dept. of Entomology and Plant Pathology, Auburn University, Alabama, U.S.A
Dr. A.T. Sadashiva, Principal Scientist & Head, Division of Vegetable Crops, Indian Institute of Horticultural Research, Bangalore
Dr. Meenu Srivastava, Professor, Dept. of Textiles and Apparel Designing, College of Home Science, Maharana Pratap University of Agriculture & Technology, Udaipur
Dr.S.R. Koteswara Rao, Dean of Student Affairs, ANGRAU, Guntur
Dr. T. Giridhar Krishna, Professor & Head, Dept. of Soil Science and Agricultural Chemistry, S.V. Agricultural College, ANGRAU, Tirupati
Dr. R.Sarada Jayalakshmi Devi, Professor & Head, Dept. of Plant Pathology, S.V. Agricultural College, ANGRAU, Tirupati
Dr. P. Sudhakar, Professor & Head, Dept. of Crop Physiology, S.V. Agricultural College, ANGRAU, Tirupati
Dr. Ch. V.V. Satyanarayana, University Head (Food Engineering), College of Food Science & Technology, ANGRAU, Bapatla
Dr. M.V. Ramana, Principal Scientist (Agricultural Engineering), Regional Agricultural Research Station, ANGRAU, Tirupati
Dr. T. Neeraja, Professor & Head, Dept. of Resource Management and Consumer Sciences, College of Home Science, Guntur
Dr. K. Nirmal Ravi Kumar, Professor & Head, Dept. of Agricultural Economics, Agricultural College, ANGRAU, Mahanandi
ADVISORY BOARDDr. Suresh Babu, Head, Capacity Building, International Food Policy Research Institute, Washington, USADr. Seri Intan Binti Mokthar, Associate Professor, Faculty of Agro- Based Industry, University of Malaysia, KelantanDr. Ch. Srinivasa Rao, Director, National Academy of Agricultural Research Management, HyderabadDr. Mahadev B. Chetti, Asst. Director General (HRD), Indian Council of Agricultural Research, New DelhiDr. Surinder Singh Kukal, Dean of Agriculture, Punjab Agricultural University, Ludhiana, PunjabDr. Y.G. Shadakshari, Director of Research, University of Agricultural Sciences, BangaloreDr. N. Trimurthulu, Special Officer, Advanced Post Graduate Centre, ANGRAU, GunturDr. M.V. Ramana, Principal Scientist (Pulses), Regional Agricultural Research Station, ANGRAU, GunturDr. K. Vijay Krishna Kumar, Senior Scientist (Pathology) & TS to Vice- Chancellor, Administrative Office, ANGRAU, Guntur
CHIEF PATRONDr. V. Damodara Naidu, Vice- Chancellor, ANGRAU, Guntur
Dr. D. Balaguravaiah, Dean of P.G. Studies, ANGRAU, Guntur
Dr. J. Krishna Prasadji, Dean of Agriculture, ANGRAU, Guntur
Dr. K. Yella Reddy, Dean of Agricultural Engineering and Technology, ANGRAU, G untur
Dr. L. Uma Devi, Dean of Home Science, ANGRAU, Guntur
Dr. N.V. Naidu, Director of Research, ANGRAU, Guntur
Dr. P. Rambabu, Director of Extension, ANGRAU, Guntur
CONTENTS
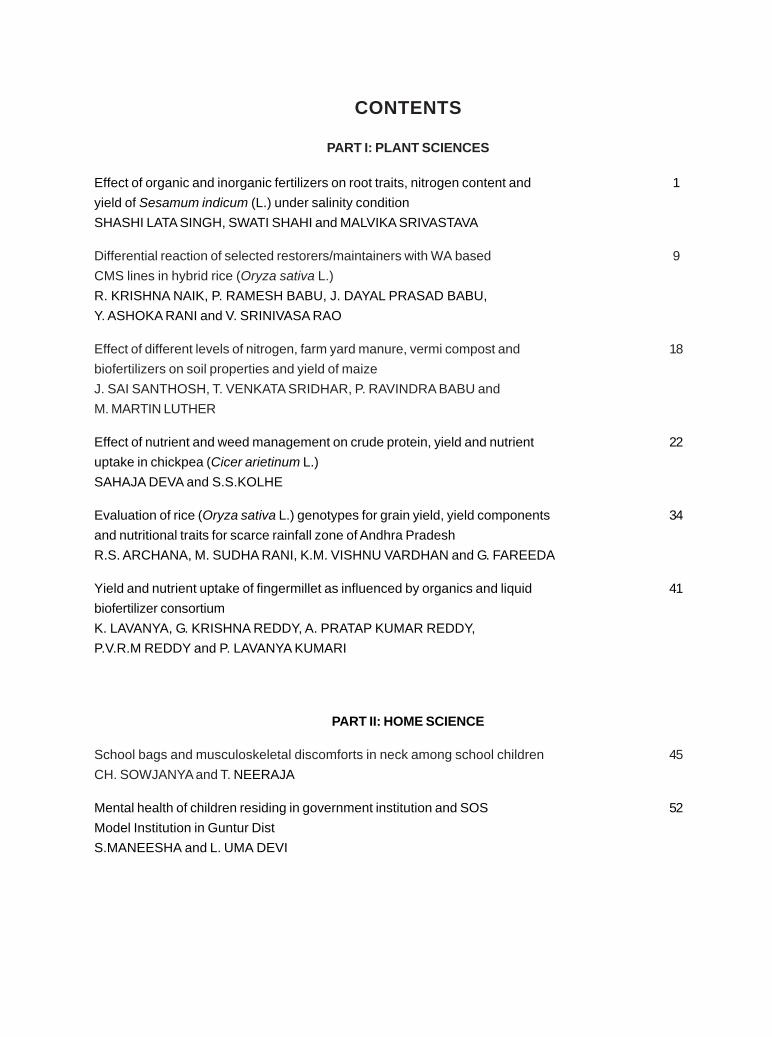
PART I: PLANT SCIENCES
Effect of organic and inorganic fertilizers on root traits, nitrogen content and 1yield of Sesamum indicum (L.) under salinity conditionSHASHI LATA SINGH, SWATI SHAHI and MALVIKA SRIVASTAVA
Differential reaction of selected restorers/maintainers with WA based 9CMS lines in hybrid rice (Oryza sativa L.)R. KRISHNA NAIK, P. RAMESH BABU, J. DAYAL PRASAD BABU,Y. ASHOKA RANI and V. SRINIVASA RAO
Effect of different levels of nitrogen, farm yard manure, vermi compost and 18biofertilizers on soil properties and yield of maizeJ. SAI SANTHOSH, T. VENKATA SRIDHAR, P. RAVINDRA BABU andM. MARTIN LUTHER
Effect of nutrient and weed management on crude protein, yield and nutrient 22uptake in chickpea (Cicer arietinum L.)SAHAJA DEVA and S.S.KOLHE
Evaluation of rice (Oryza sativa L.) genotypes for grain yield, yield components 34and nutritional traits for scarce rainfall zone of Andhra PradeshR.S. ARCHANA, M. SUDHA RANI, K.M. VISHNU VARDHAN and G. FAREEDA
Yield and nutrient uptake of fingermillet as influenced by organics and liquid 41biofertilizer consortiumK. LAVANYA, G. KRISHNA REDDY, A. PRATAP KUMAR REDDY,P.V.R.M REDDY and P. LAVANYA KUMARI
PART II: HOME SCIENCE
School bags and musculoskeletal discomforts in neck among school children 45CH. SOWJANYA and T. NEERAJA
Mental health of children residing in government institution and SOS 52Model Institution in Guntur DistS.MANEESHA and L. UMA DEVI
1
INTRODUCTION
Sesame [Sesamum indicum (L.)] is anannual herb which is economically important oil cropand usually raised as Kharif crop. It prefers a well-drained sandy loam soil with adequate moisture.Sesame is widely used in food, nutraceutical andpharmaceutical industry because of its high oil,protein and antioxidant content. Dietary sesamelignans have effects such as reducing liver damageand serum cholesterol level, increasing vitamin Eactivity and á-tocopherol availability (Ikeda et al.,2003).
Saline soils occupy 7 % of the earth’s landsurface (Ruiz-Lozano et al., 2001). At present, outof 1.5 billion ha of cultivated land around the world,about 77 mha is affected by excess salt (Sheng etal., 2008). Increased salinization of arable land isexpected to have devastating global effects, resultingin 30% land loss within the next 25 years and upto50 % by the year 2050 (Wang et al., 2003).
Salinity is one of the most important stressfactor which limits the growth and development ofplants by altering their morpho-physiological and
EFFECT OF ORGANIC AND INORGANIC FERTILIZERS ON ROOT TRAITS,NITROGEN CONTENT AND YIELD OF Sesamum indicum (L.) UNDER SALINITY
CONDITION
SHASHI LATA SINGH, *SWATI SHAHI and MALVIKA SRIVASTAVAPlant Physiology and Biochemistry Laboratory, Department of Botany,
D. D. U. Gorakhpur University, Gorakhpur-273 009
Date of Receipt: 05.05.2018 Date of Acceptance:08.06.2018
ABSTRACT Pot culture experiment was conducted during 2015-2016 to evaluate the effects of application of various plants
nutrients viz., organic manure (farmyard manure and vermicompost) and inorganic fertilizer (NPK fertilizer) on root length, rootbiomass, Nitrate reductase activity (NRA), total nitrogen content and yield of sesame. Plants were subjected to different salinityregimes of NaCl [100mM (9.85 dSm”1), 150 mM (15.78) and 200mM (21.8 dSm”1)]. Untreated plants served as control. Plants wereanalyzed for root traits, nitrate reductase activity and nitrogen content from 30 days to70 days at every ten days interval. Yieldwas recorded at 80 days of plant growth. Salinity caused decrease in the root length, root biomass, nitrate reductase activity,total nitrogen content and yield of the plants. However, application of the nutrients increased these parameters effectively in 100mM NaCl treated plants and the increment was more pronounced when the plants were treated with vermicompost.
*Corresponding author E-mail: [email protected]
J.Res. ANGRAU 46(3) 1-8, 2018
biochemical attributes (Mudgal et al., 2010). Theinjurious effect of salinity on plant growth areassociated with low osmotic potential of soil solution,nutritional imbalance, specific ion effect or acombination of these factors (Zhu, 2003). Solublesalts at higher concentration in growth medium causeimbalance of nutrients in most plants that harmfullydecline plant growth (Turan et al., 2010).
Salinity affects both water absorption andbiochemical processes (Parida and Das, 2005)resulting in reduction of plant growth (Shahi andSrivastava, 2016). High salt (NaCl) uptake competeswith the uptake of other nutrient ions, such as K+,Ca2+, N and P resulting in nutritional disorders andeventually, reduced yield and quality (Grattan andGrieve, 1999).
Organic manures are plant and animalwastes that are used as sources of plant nutrients.They release nutrients after their decomposition.Manures are the organic materials derived fromanimal, human and plant residues which contain plantnutrients in complex organic forms. Moreover, organicmaterials improve the soil physico-chemical
2
properties that accelerate exchange of cations onsoil solids and leaching of salts from the root zone(Clark et al., 2007), hence, preventing root from saltinjuries. Vermicompost is effective organic fertilizerand biocontrol agent (Simsek - Ersahin, 2011) andis also capable of extending threshold values of saltin rooting medium (Ahmad and Jabeen, 2009).
The investigation was carried out to elucidatethe effect of salinity on root, NRA, nitrogen contentand productivity of sesame plants and mitigation ofsalt stress by various types of plant nutrients.
MATERIAL AND METHODS
Experiment laid out in complete randomizedblock design was conducted during year 2015-2016in the Department of Botany, D.D.U. GorakhpurUniversity. Surface sterilized seeds of Sesamumindicum L. (Cv. T-13) were soaked overnight in waterand were germinated in growth chamber undercontrolled conditions (temp. 25 ± 20C). Five days oldplantlets were transplanted to earthenware potscontaining five kg sterilized sand. Level of sandsalinity was 0 Mm. Hoagland’s nutrient solution wassupplied to the plants at seven day interval. Plantswere treated with different concentration (100 mM,150 mM and 200 mM) of NaCl alone and also incombination with different types (12:24:12 NPK 3.0g, farmyard manure (FYM) 6.0 g, vermicompost 6.0g) of fertilizers which were applied to salt treatedplants at 25 days, 55 days and 85 days after sowing.Untreated plants were kept as Control.
The collection of samples was completedat every ten days interval and various parameterssuch as root length, root biomass, nitrate reductaseenzyme activity (NRA), total nitrogen content wasanalyzed from Day 30 upto Day 70 at ten daysinterval. NRA was estimated by the method ofStreeter and Bosler (1972) and total nitrogen contentwas measured by method given by Doneen (1932).Yield was studied in terms of number of capsule perplant and number of seeds per capsule at 80 days ofplant growth.
Two-way ANOVA was computed and LSD(Least Significant Difference) was calculated whereF test was found significant. SD values have beencalculated in case of yield parameters.
RESULTS AND DISCUSSION
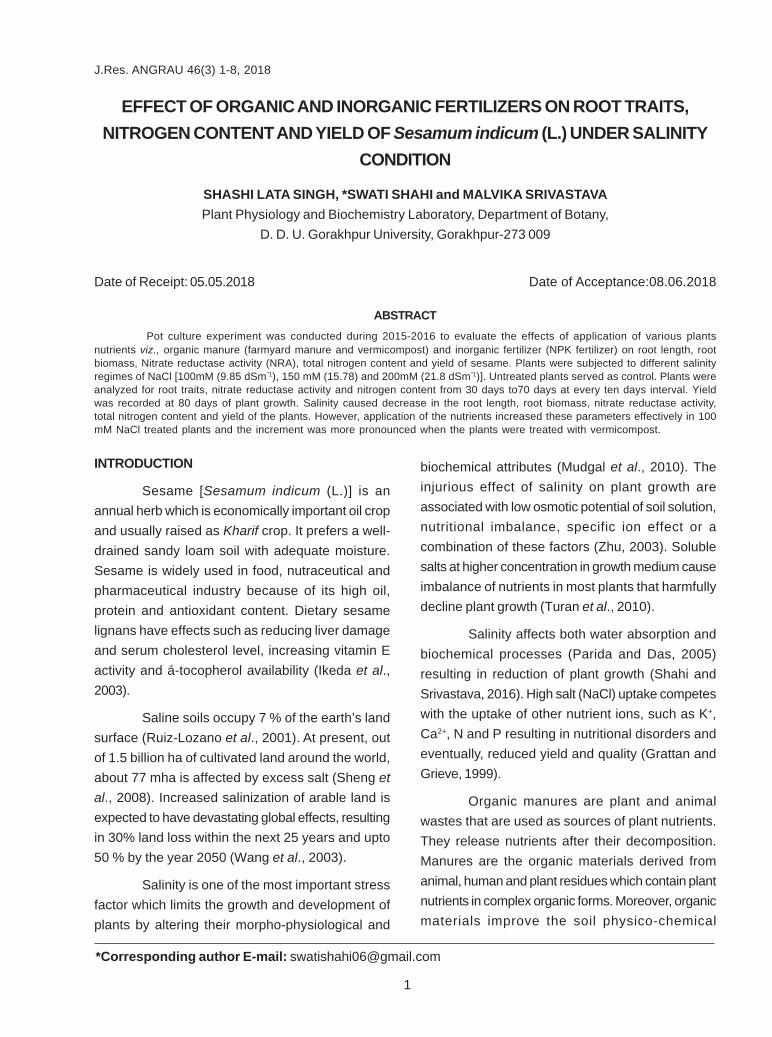
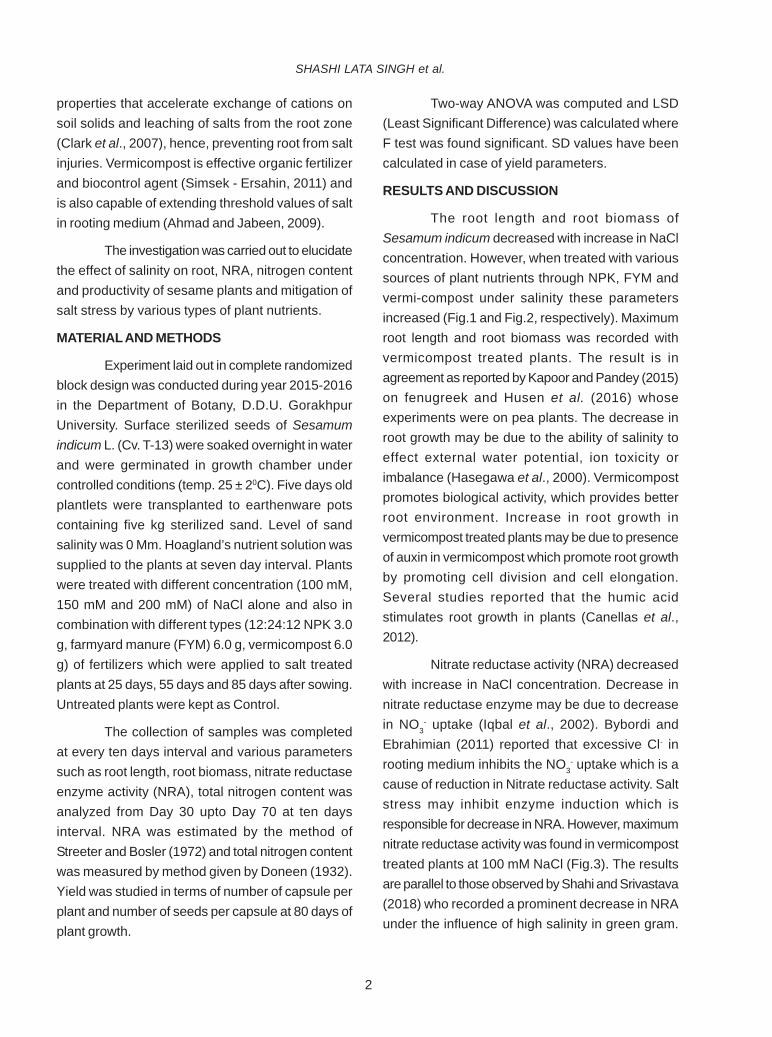
The root length and root biomass ofSesamum indicum decreased with increase in NaClconcentration. However, when treated with varioussources of plant nutrients through NPK, FYM andvermi-compost under salinity these parametersincreased (Fig.1 and Fig.2, respectively). Maximumroot length and root biomass was recorded withvermicompost treated plants. The result is inagreement as reported by Kapoor and Pandey (2015)on fenugreek and Husen et al. (2016) whoseexperiments were on pea plants. The decrease inroot growth may be due to the ability of salinity toeffect external water potential, ion toxicity orimbalance (Hasegawa et al., 2000). Vermicompostpromotes biological activity, which provides betterroot environment. Increase in root growth invermicompost treated plants may be due to presenceof auxin in vermicompost which promote root growthby promoting cell division and cell elongation.Several studies reported that the humic acidstimulates root growth in plants (Canellas et al.,2012).
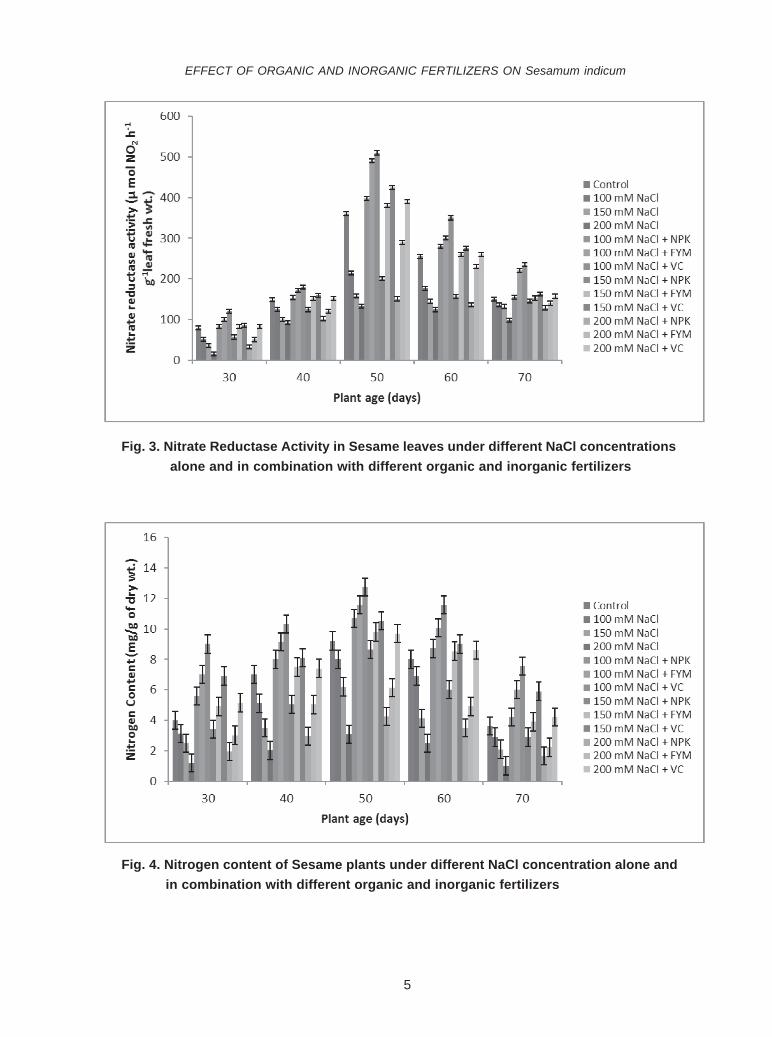
Nitrate reductase activity (NRA) decreasedwith increase in NaCl concentration. Decrease innitrate reductase enzyme may be due to decreasein NO3
- uptake (Iqbal et al., 2002). Bybordi andEbrahimian (2011) reported that excessive Cl- inrooting medium inhibits the NO3
- uptake which is acause of reduction in Nitrate reductase activity. Saltstress may inhibit enzyme induction which isresponsible for decrease in NRA. However, maximumnitrate reductase activity was found in vermicomposttreated plants at 100 mM NaCl (Fig.3). The resultsare parallel to those observed by Shahi and Srivastava(2018) who recorded a prominent decrease in NRAunder the influence of high salinity in green gram.
SHASHI LATA SINGH et al.
3
Jabeen and Ahmad (2016) also supported the resultsand found that vermicompost improved NRA insunflower under saline and non-saline condition.Compost application results in higher activities ofnitrate reductase in Solanum lycopersicum (Tartouraet al., 2014). The induction of nitrate reductase inplants treated with organic manure may be due topresence of humic substances. Zandonadi et al.(2013) found that humic substances enhance theuptake of nitrate and is stimulus for nitrate reductaseactivity.
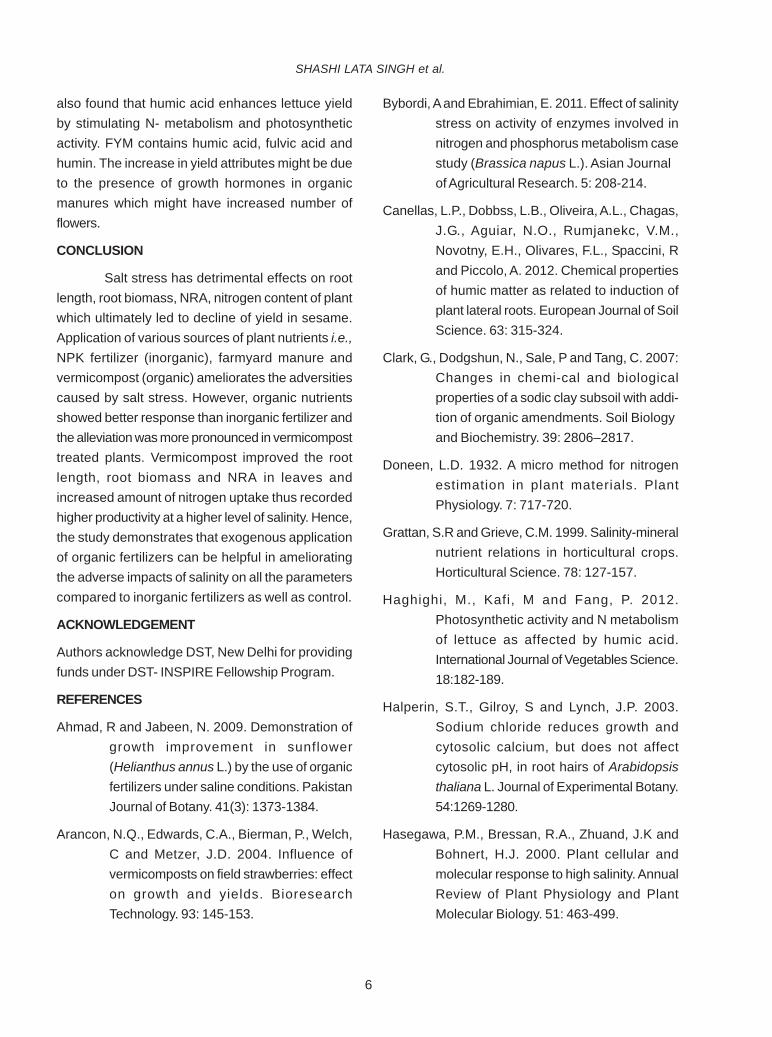
Nitrogen content decreased with increasein NaCl concentration (Fig.4). This may be due toCl- which inhibits NO3- uptake (Halperin et al., 2003).Srivastava and Shahi (2017) reported that NaClsalinity reduces nitrogen content in wheat leaves.Kumar et al. (2018) also reported a significantdecrease in nitrogen content upon salt treatment inchickpea cultivars. Nitrogen content increased in
plants when treated with different organic andinorganic nutrients. This may be due to presence ofN, P, K and organic manure containing humic acid.Similarly, Jasim et al. (2015) observed humic acidincreases nitrogen content under saline condition.
Yield attributes decreased in terms ofnumber of capsules/plant, number of seeds/capsulewith increase in salinity (Table 1). The result is similarto the finding of Srivastava and Shahi (2018) whoreported that salinity significantly reduced yield inwheat cultivars. However, application of NPK fertilizer,FYM and vermicompost increased the yield ofSesamum indicum (L.) under salinity. Maximumnumber of capsules per plant and number of seedsper capsule were observed in vermicompost treatedplants at 100 mM NaCl concentration. The result isin accordance with the finding of Aracnon et al. (2004)who reported a positive effect of vermicompost onstrawberries yield. Similarly, Haghighi et al. (2012)
Table 1. Yield attributes of Sesame under different NaCl concentrations alone and in combination with organic and inorganic fertilizers
Treatments Number of capsule/plant Number of seeds/capsule
Control 26 ± 3.60* 64 ± 7.21*
100 mM NaCl 24 ± 5.00 59 ± 6.55
150 mM NaCl 18 ± 6.08 52 ± 6.00
200 mM NaCl 12 ± 3.00 48 ± 2.64
100 mM NaCl + NPK 32 ± 2.00 70 ± 5.56
100 mM NaCl + FYM 41 ± 4.34 75 ± 5.00
100 mM NaCl + VC 50 ± 5.29 82 ± 4.00
150 mM NaCl + NPK 22 ± 5.19 67 ± 4.35
150 mM NaCl + FYM 30 ± 3.60 70 ± 3.10
150 mM NaCl + VC 35 ± 2.64 74 ± 3.00
200 mM NaCl + NPK 17 ± 4.58 57 ± 5.00
200 mM NaCl + FYM 20 ± 4.00 60 ± 4.58
200 mM NaCl + VC 29 ± 3.61 66 ± 7.93
*Mean ± Standard deviation(n=3) ; VC- Vermi Compost; FYM- Farm Yard Manure
EFFECT OF ORGANIC AND INORGANIC FERTILIZERS ON Sesamum indicum
4
Fig. 1. Root length of Sesame plants under different NaCl concentrations alone and in combination with different organic and inorganic fertilizers
Fig. 2. Root biomass of Sesame under different NaCl concentrations alone and in combination with different organic and inorganic fertilizers
SHASHI LATA SINGH et al.
5
Fig. 3. Nitrate Reductase Activity in Sesame leaves under different NaCl concentrations alone and in combination with different organic and inorganic fertilizers
Fig. 4. Nitrogen content of Sesame plants under different NaCl concentration alone and in combination with different organic and inorganic fertilizers
EFFECT OF ORGANIC AND INORGANIC FERTILIZERS ON Sesamum indicum
6
also found that humic acid enhances lettuce yieldby stimulating N- metabolism and photosyntheticactivity. FYM contains humic acid, fulvic acid andhumin. The increase in yield attributes might be dueto the presence of growth hormones in organicmanures which might have increased number offlowers.
CONCLUSION
Salt stress has detrimental effects on rootlength, root biomass, NRA, nitrogen content of plantwhich ultimately led to decline of yield in sesame.Application of various sources of plant nutrients i.e.,NPK fertilizer (inorganic), farmyard manure andvermicompost (organic) ameliorates the adversitiescaused by salt stress. However, organic nutrientsshowed better response than inorganic fertilizer andthe alleviation was more pronounced in vermicomposttreated plants. Vermicompost improved the rootlength, root biomass and NRA in leaves andincreased amount of nitrogen uptake thus recordedhigher productivity at a higher level of salinity. Hence,the study demonstrates that exogenous applicationof organic fertilizers can be helpful in amelioratingthe adverse impacts of salinity on all the parameterscompared to inorganic fertilizers as well as control.
ACKNOWLEDGEMENT
Authors acknowledge DST, New Delhi for providingfunds under DST- INSPIRE Fellowship Program.
REFERENCES
Ahmad, R and Jabeen, N. 2009. Demonstration ofgrowth improvement in sunflower(Helianthus annus L.) by the use of organicfertilizers under saline conditions. PakistanJournal of Botany. 41(3): 1373-1384.
Arancon, N.Q., Edwards, C.A., Bierman, P., Welch,C and Metzer, J.D. 2004. Influence ofvermicomposts on field strawberries: effecton growth and yields. BioresearchTechnology. 93: 145-153.
Bybordi, A and Ebrahimian, E. 2011. Effect of salinitystress on activity of enzymes involved innitrogen and phosphorus metabolism casestudy (Brassica napus L.). Asian Journalof Agricultural Research. 5: 208-214.
Canellas, L.P., Dobbss, L.B., Oliveira, A.L., Chagas,J.G., Aguiar, N.O., Rumjanekc, V.M.,Novotny, E.H., Olivares, F.L., Spaccini, Rand Piccolo, A. 2012. Chemical propertiesof humic matter as related to induction ofplant lateral roots. European Journal of SoilScience. 63: 315-324.
Clark, G., Dodgshun, N., Sale, P and Tang, C. 2007:Changes in chemi-cal and biologicalproperties of a sodic clay subsoil with addi-tion of organic amendments. Soil Biologyand Biochemistry. 39: 2806–2817.
Doneen, L.D. 1932. A micro method for nitrogenestimation in plant materials. PlantPhysiology. 7: 717-720.
Grattan, S.R and Grieve, C.M. 1999. Salinity-mineralnutrient relations in horticultural crops.Horticultural Science. 78: 127-157.
Haghighi, M., Kafi, M and Fang, P. 2012.Photosynthetic activity and N metabolismof lettuce as affected by humic acid.International Journal of Vegetables Science.18:182-189.
Halperin, S.T., Gilroy, S and Lynch, J.P. 2003.Sodium chloride reduces growth andcytosolic calcium, but does not affectcytosolic pH, in root hairs of Arabidopsisthaliana L. Journal of Experimental Botany.54:1269-1280.
Hasegawa, P.M., Bressan, R.A., Zhuand, J.K andBohnert, H.J. 2000. Plant cellular andmolecular response to high salinity. AnnualReview of Plant Physiology and PlantMolecular Biology. 51: 463-499.
SHASHI LATA SINGH et al.
7
Husen, A., Iqbal, M and Aref, I.M. 2016. IAA-inducedalteration in growth and photosynthesis ofpea (Pisum sativum L.) plants grown undersalt stress. Journal of Env i ronmenta lBiology.37: 421-429.
Ikeda, S., Kagaya, M., Kobayashi, K., Tohyama, T.,Kiso, Y., Higuchi N and Yamashita, K.2003. Dietary sesame lignans decreaselipid peroxidation in rats feddocosahexaenoic acid. Journal ofNutritional Science and Vitaminology. 49(4):270-276.
Iqbal, S.M., Rauf, C.A., Ayub, N and Gafoor, A. 2002.Morphological characters of chickpeacultivars related to resistance againstblight. International Journal of AgricultureBiology.4: 496-499.
Jabeen, N and Ahmad, R. 2016. Growth responseand nitrogen metabolism of sunflower(Helianthus annus L.) to vermicompost andbiogas slurry under salinity stress. Journalof Plant Nutrition. 40(1):104-114.
Jasim, A.H., Alryahii, I., Abed, H. M and Badry, A.N.2015. Effect of some treatments onalleviating of environmental stress on growthand yield of squash (Cucurbitta pepo L.).Mesopotamia Environmental Journal. 4:67-74.
Kapoor, N and Pande, V. 2015. Effect of salt stresson growth parameters, moisture content,relative water content and photosyntheticpigments of fenugreek variety RMt-1.Journalof Plant Sciences. 10: 210-221.
Kumar, R., Shahi, S and Srivastava, M. 2018.Biochemical performance and protein profileof two varieties of chickpea (BG-256 andCSG-8962) under salinity. LegumeResearch. DOI: 10.18805/LR-4045.
Mudgal, V., Madaan, N and Mudgal, A. 2010.Biochemical mechanisms of salt tolerancein plants: A review. International Journal ofBotany. 6:136-143.
Parida, A.K and Das, A.B. 2005. Salt tolerance andsalinity effects on plant: A Review.Ecotoxicology and EnvironmentalSafety.60: 324-349.
Ruiz-Lozano, J.M., Collados, C., Barea, J.M andAzco´n, R. 2001. Arbuscular mycorrhizalsymbiosis can alleviate drought inducednodule senescence in soybean plants.Plant Physiology. 82: 346–350.
Shahi, S and Srivastava, M. 2016. Foliar applicationof Manganese for increasing salinitytolerance in Mungbean. InternationalJournal of Applied Biology andPharmaceutical Technology. 7: 148-153.
Shahi, S and Srivastava, M. 2018. Influence of foliarapplication of Manganese on growth,pigment content and nitrate reductaseactivity of Vigna radiata (L.) R. Wilczekunder salinity. Journal of Plant Nutrition.41(11): 1397-1404. DOI: 10.1080/01904167.2018.1454470.
Sheng, M., Tang, M., Chan, H., Yang, B., Zhang, Fand Huang, Y. 2008. Influence of arbuscularmycorrhizae on photosynthesis and waterstatus of maize plants under salt stress.Mycorrhiza. 18: 287–296.
Simsek-Ersahin, Y. 2011. The use of vermicompostproducts to control plant disease and pests.In: Biology of Earthworms, Soil Biology,Karaca, A. (Editor). Springer-Verlag,Berlin, Heidelberg.
Srivastava, M and Shahi, S. 2017. Biochemicalresponse of salt-tolerant and salt-sensitivewheat cultivars to salinity. Research onCrops. 18(4): 605-611.
EFFECT OF ORGANIC AND INORGANIC FERTILIZERS ON Sesamum indicum
8
Srivastava, M and Shahi, S. 2018. Effect of salinityon morpho-physiological aspects,antioxidant enzymatic studies and yieldattributes in wheat genotypes. IndianJournal of Plant Physiology. 23(2): 385–392.
Streeter, J.G and Bosler, M.E. 1972. Comparision ofin-vivo and in-vitro assays for nitratereductase in soybean leaves. PlantPhysiology. (Lancaster) 49: 448-450.
Tartoura, K.A.H., Youssef, S.A and Tartoura, E.A.A.2014. Compost alleviates the negativeeffects of salinity via up-regulation ofantioxidants in Solanum lycopersicum L.Plants. Plant Growth Regulation.74 (3):299-310.
Turan, M.A., Hassan, A., Elkarim, A., Taban, N andTaban, S. 2010. Effect of salt stress ongrowth and ion distribution andaccumulation in shoot and root of maizeplant. African Journal of AgriculturalResearch. 5(7):584-588.
Wang, W., Vinocur, B and Altman, A. 2003. Plantresponses to drought, salinity and extremetemperatures: Toward genetic engineeringfor stress tolerance. Planta: 218: 1–14.
Zandonadi, D.B., Santos M.P., Busato J.G., Peres,L.E.P and Facanha, A.R. 2013. Plantphysiology as affected by humified organicmatter. Theoretical and Experimental Plant Physiology. 25 (1): 1-15.
Zhu, J.K. 2003. Regulation of ion homeostasis undersalt stress. Current Opinion Plant Biology. 6:441–445.
SHASHI LATA SINGH et al.
9
INTRODUCTION
‘ Rice occupies a premier place in Indianagriculture and plays a major role in Indian economy,being the staple food of two-third of the population.More than 90% of the world’s rice is grown andconsumed in Asia, wherein, 60% of the globalpopulations live (Khush, 2005). The population in riceconsuming countries continues to grow steadily andit is estimated that 40% more have to be producedby 2030. To meet the increasing demand for rice,several measures have to be envisaged. Therefore,rapid increase in production and productivity of riceis the need of hour as per the growing population.Hence, different strategies are to be worked out inorder to bridge the gap between demand and supply.One such strategy would be the improvement of highyielding genotypes through hybridization. Hybrid riceis the best practically feasible and readily acceptableoptions available to increase the production. For thedevelopment of rice hybrids through cytoplasmicmale sterility and fertility restoration system,identification of stable maintainers and restorers fromthe local elite lines is utmost important. The objectiveof the study was to identify better male and femaleparents for the development of good rice hybrids.
DIFFERENTIAL REACTION OF SELECTED RESTORERS/MAINTAINERS WITHWA BASED CMS LINES IN HYBRID RICE (Oryza sativa L.)
R. KRISHNA NAIK*, P. RAMESH BABU, J. DAYAL PRASAD BABU, Y. ASHOKA RANI andV. SRINIVASA RAO
Department of Genetics and Plant Breeding, Agricultural College,Acharya N.G. Ranga Agricultural University, Bapatla - 522 101
Date of Receipt: 01.08.2018 Date of Acceptance:31.08.2018
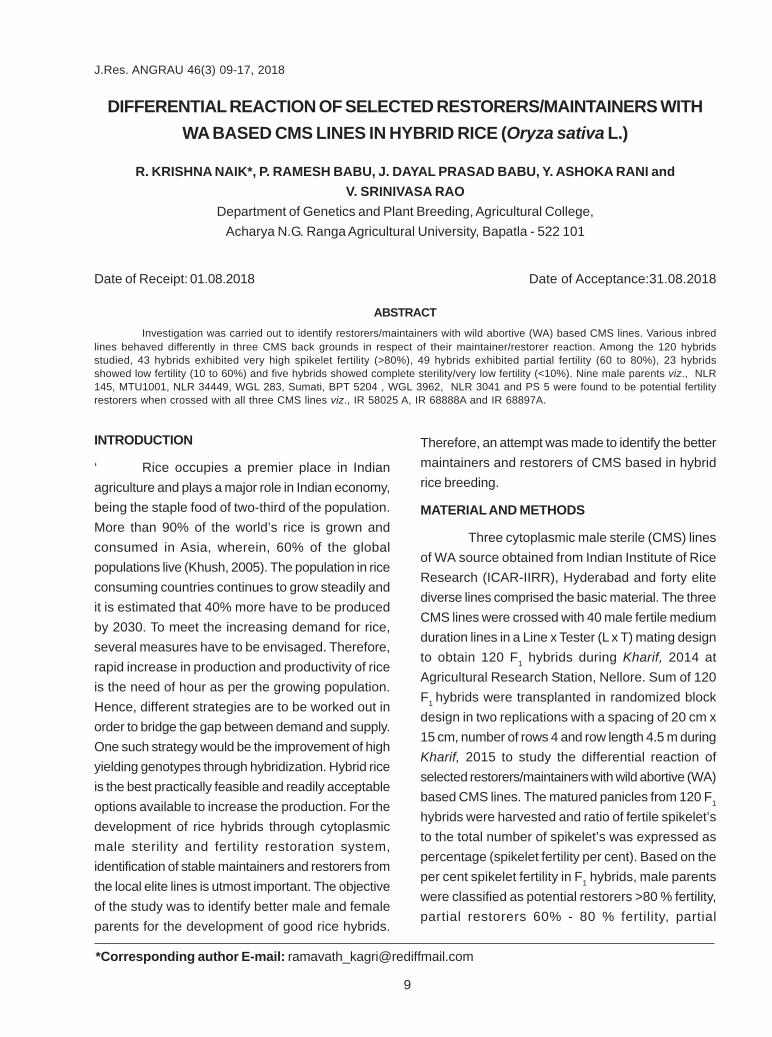
ABSTRACTInvestigation was carried out to identify restorers/maintainers with wild abortive (WA) based CMS lines. Various inbred
lines behaved differently in three CMS back grounds in respect of their maintainer/restorer reaction. Among the 120 hybridsstudied, 43 hybrids exhibited very high spikelet fertility (>80%), 49 hybrids exhibited partial fertility (60 to 80%), 23 hybridsshowed low fertility (10 to 60%) and five hybrids showed complete sterility/very low fertility (<10%). Nine male parents viz., NLR145, MTU1001, NLR 34449, WGL 283, Sumati, BPT 5204 , WGL 3962, NLR 3041 and PS 5 were found to be potential fertilityrestorers when crossed with all three CMS lines viz., IR 58025 A, IR 68888A and IR 68897A.
J.Res. ANGRAU 46(3) 09-17, 2018
*Corresponding author E-mail: [email protected]
Therefore, an attempt was made to identify the bettermaintainers and restorers of CMS based in hybridrice breeding.
MATERIAL AND METHODS
Three cytoplasmic male sterile (CMS) linesof WA source obtained from Indian Institute of RiceResearch (ICAR-IIRR), Hyderabad and forty elitediverse lines comprised the basic material. The threeCMS lines were crossed with 40 male fertile mediumduration lines in a Line x Tester (L x T) mating designto obtain 120 F1 hybrids during Kharif, 2014 atAgricultural Research Station, Nellore. Sum of 120F1 hybrids were transplanted in randomized blockdesign in two replications with a spacing of 20 cm x15 cm, number of rows 4 and row length 4.5 m duringKharif, 2015 to study the differential reaction ofselected restorers/maintainers with wild abortive (WA)based CMS lines. The matured panicles from 120 F1
hybrids were harvested and ratio of fertile spikelet’sto the total number of spikelet’s was expressed aspercentage (spikelet fertility per cent). Based on theper cent spikelet fertility in F1 hybrids, male parentswere classified as potential restorers >80 % fertility,partial restorers 60% - 80 % fertility, partial
10
maintainers 10% - 60% fertility and maintainers <10% fertility (Virmani et al., 1997).
RESULTS AND DISCUSSION
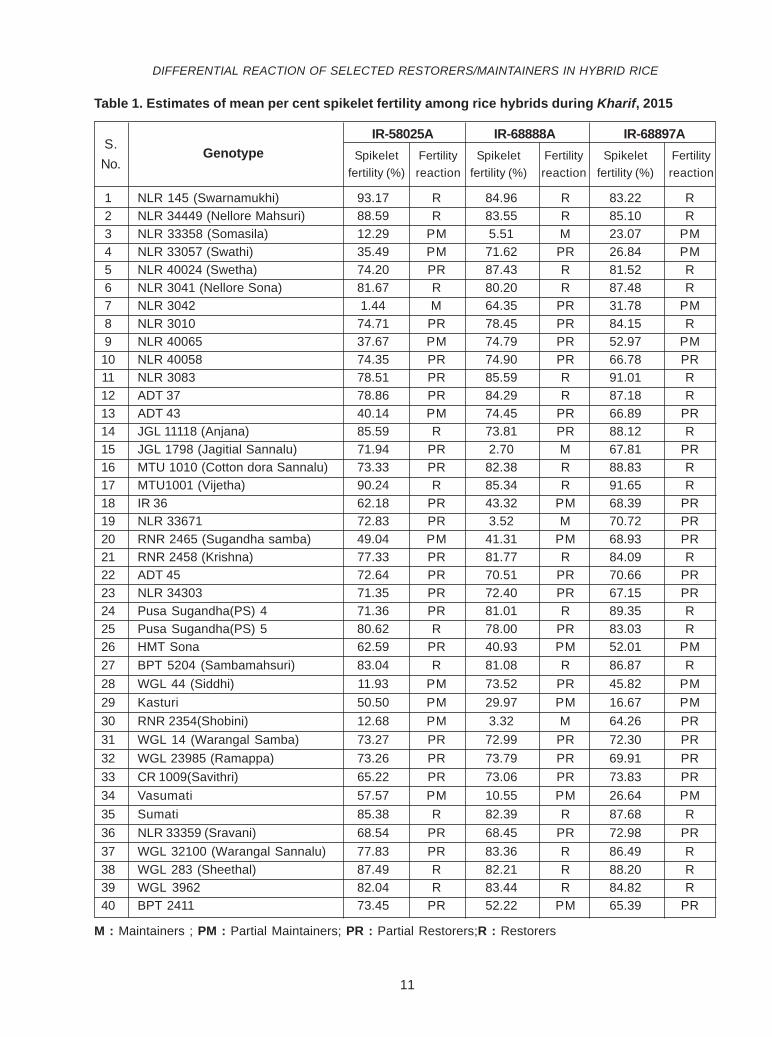
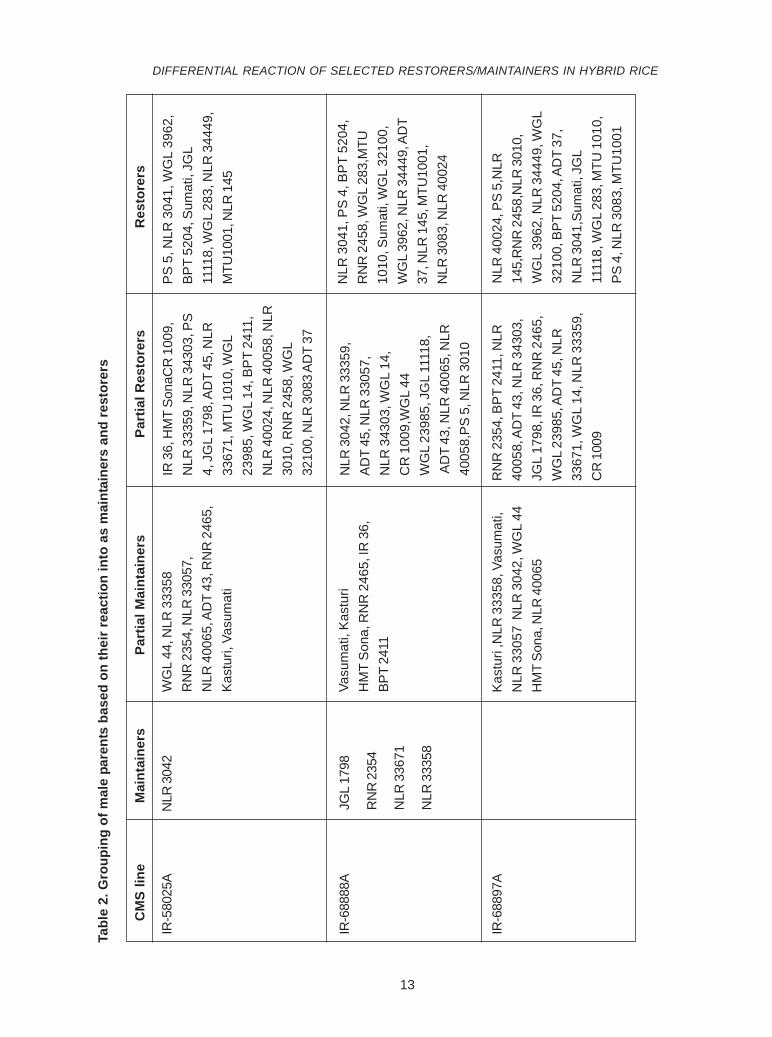
A total of 120 crosses, involving three CMSlines and 40 male parents were evaluated for spikeletfertility during Kharif, 2015. The performance of thetest cross hybrids and the grouping of testers basedon spikelet fertility reaction were presented in Table1 and Table 2. The differential ability to restore fertilityin CMS lines that have WA cytosterile system couldresult from different nuclear background of the CMSlines. The varied performance of restorers with CMSline, season of testing was also reported by Salgotraet al. (2002) and Malarvizhi et al. (2003). Differentialresponse of the genotypes to the CMS lines of thesame WA cytosterility source may also be due tothe interaction between the nuclear / remnant genesof the maintainer lines with the genes of male parents.
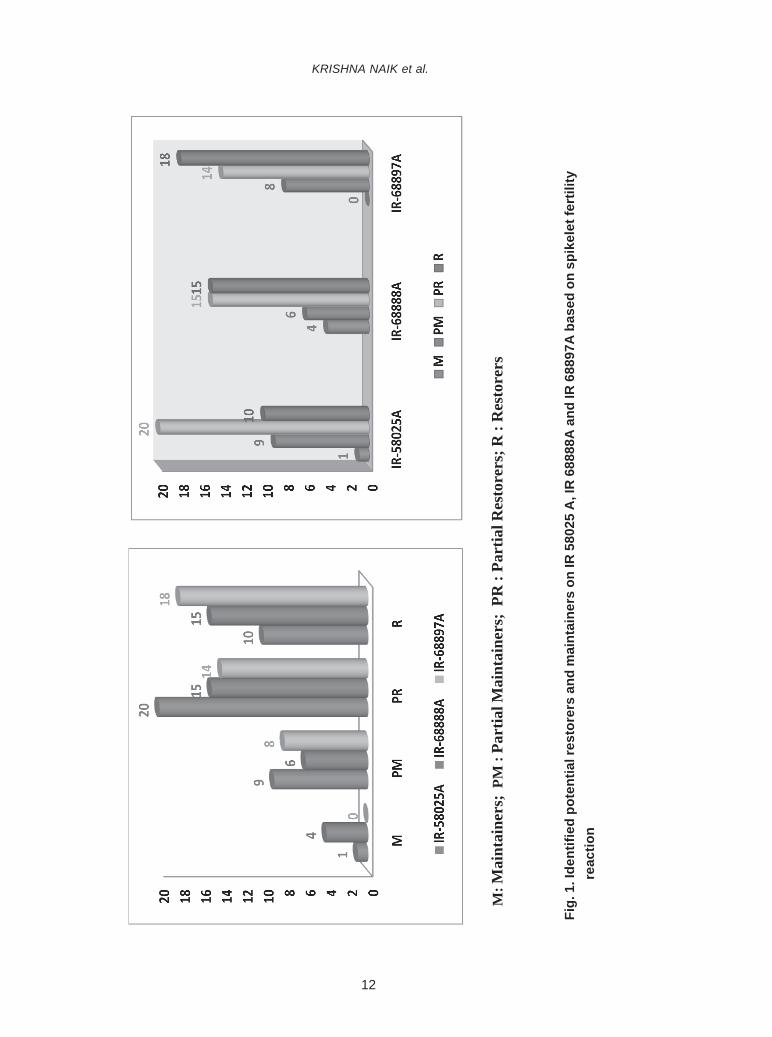
Spikelet fertility among the hybrids in Kharif,2015 ranged from 1.44 (IR-58025A x NLR 3042) to93.17 per cent (IR-58025A x NLR5 145). Among 120hybrids studied in Kharif, 2015, forty-three crossesexhibited very high spikelet fertility (>80%), 49crosses exhibited partial fertility (60 to 80%), 23crosses showed low fertility (10% to 60%) and fivecrosses showed complete sterility/very low fertility(<10%) (Fig.1). Similar results were also reportedby Upadhyay and Jaiswal (2012), Bhadru et al.(2015),Rajendra Prasad et al.(2017), Shama et al.(2018) intheir studies while using different elite lines.
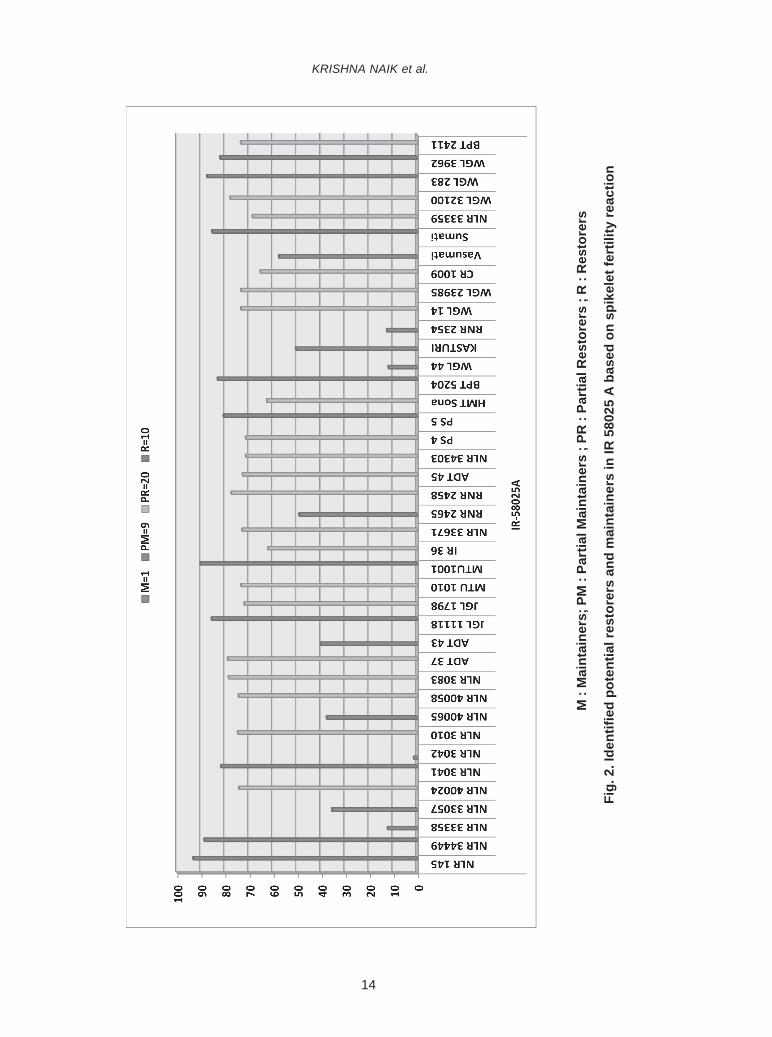
For the CMS line IR 58025 A, pollen parentsviz., NLR 145, MTU1001, NLR 34449, WGL 283,JGL 11118, Sumati, BPT 5204, WGL 3962, NLR 3041and Pusa Sugandha (PS) 5 were identified aspotential fertility restorers as they recorded morethan 80 per cent spikelet fertility. Pollen parents viz.,ADT 37, NLR 3083, WGL 32100, RNR 2458, NLR3010, NLR 40058, NLR 40024, BPT 2411, WGL 14,WGL 23985, MTU 1010, NLR 33671, ADT 45, JGL1798, Pusa Sugandha (PS) 4, NLR 34303, NLR33359, CR 1009, HMT Sona and IR 36 were identified
as partial restorers by recording fertility restorationbetween 60% to 80%. Male parents viz., Vasumati,Kasturi, RNR 2465, ADT 43, NLR 40065, NLR 33057,RNR 2354, NLR 33358 and WGL 44 were identifiedas potential maintainers as they showed less than60 per cent spikelet fertility (Fig. 2). Similar resultswere also reported by Rosamma and Vijayakumar(2005), Parmita and Ashish (2017) and Shama et al.(2018) in their studies using IR 58025 A line.
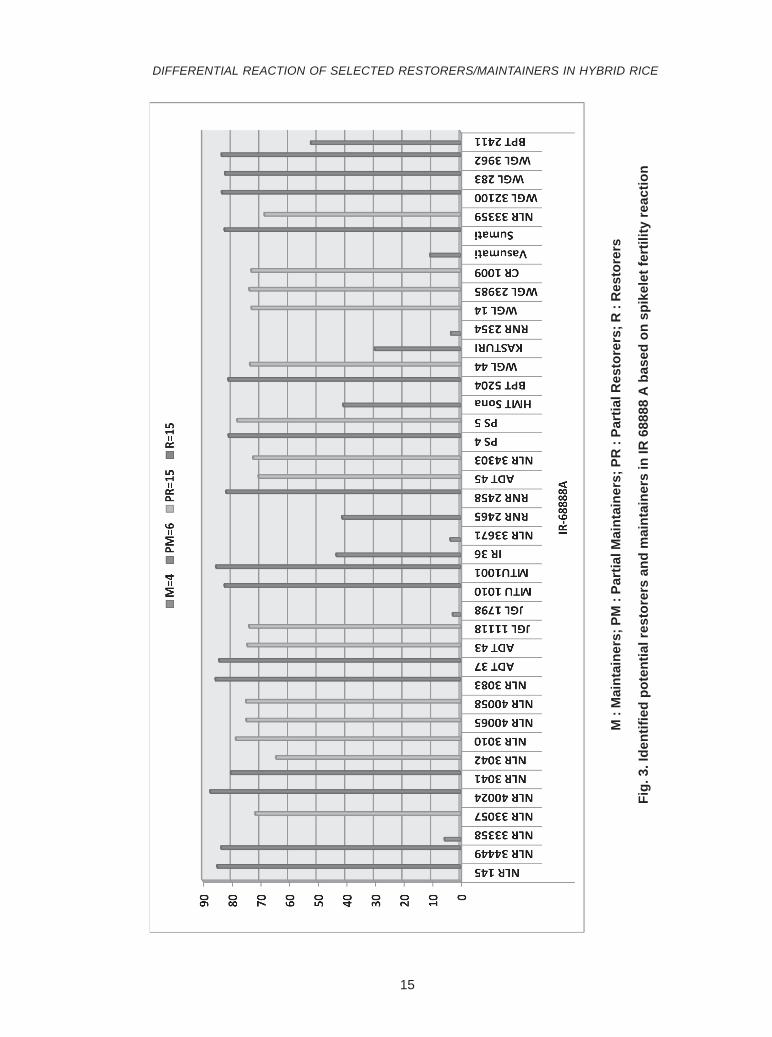
Pollen parents viz., NLR 40024, NLR 3083,MTU1001, NLR 145, ADT 37, NLR 34449, WGL 3962,WGL 32100, Sumati, MTU 1010, WGL 283, RNR2458, BPT 5204, PS 4 and NLR 3041 were found tobe potential restorers for IR-68888A, while, NLR3010, PS 5, NLR 40058, NLR 40065, ADT 43, JGL11118, WGL 23985, WGL 44, CR 1009, WGL 14,NLR 34303, NLR 33057, ADT 45, NLR 33359 andNLR 3042 were the partial restorers. Male parentsviz., BPT 2411, IR 36, RNR 2465, HMT Sona, Kasturiand Vasumati were identified as partial maintainersas they showed less than 60 per cent spikelet fertility(Fig. 3).
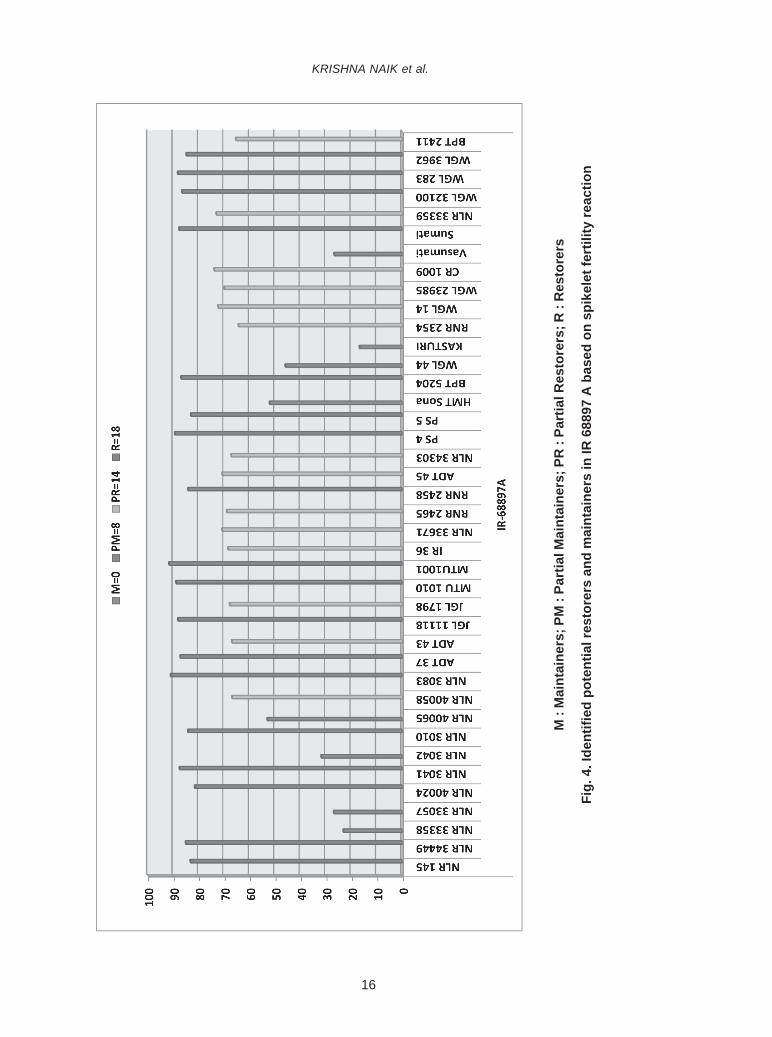
Out of 40 male parents crossed with IR68897A, eighteen male parents viz., MTU 1001,NLR 3083, PS 4, MTU 1010, WGL 283, JGL 11118,Sumati, NLR 3041, ADT 37, BPT 5204, WGL 32100,NLR 34449, WGL 3962, NLR 3010, RNR 2458, NLR145, PS 5 and NLR 40024 were proved potentialfertility restorers. While, CR 1009, NLR 33359, WGL14, NLR 33671, ADT 45, WGL 23985, RNR 2465, IR36, JGL 1798, NLR 34303, ADT 43, NLR 40058, BPT2411 and RNR 2354 were shown to be partialrestorers. Male parents viz., NLR 40065, HMT Sona,WGL 44, NLR 3042, NLR 33057, Vasumati, NLR33358 and Kasturi were identified as partialmaintainers (Fig. 4).
CONCLUSION
Among the 40 male lines studied, nine maleparents viz., NLR 145, MTU1001, NLR 34449, WGL283, Sumati, BPT 5204 , WGL 3962, NLR 3041 andPS 5 were found to be potential fertility restorers
KRISHNA NAIK et al.
11
1 NLR 145 (Swarnamukhi) 93.17 R 84.96 R 83.22 R2 NLR 34449 (Nellore Mahsuri) 88.59 R 83.55 R 85.10 R3 NLR 33358 (Somasila) 12.29 PM 5.51 M 23.07 PM4 NLR 33057 (Swathi) 35.49 PM 71.62 PR 26.84 PM5 NLR 40024 (Swetha) 74.20 PR 87.43 R 81.52 R6 NLR 3041 (Nellore Sona) 81.67 R 80.20 R 87.48 R7 NLR 3042 1.44 M 64.35 PR 31.78 PM8 NLR 3010 74.71 PR 78.45 PR 84.15 R9 NLR 40065 37.67 PM 74.79 PR 52.97 PM10 NLR 40058 74.35 PR 74.90 PR 66.78 PR11 NLR 3083 78.51 PR 85.59 R 91.01 R12 ADT 37 78.86 PR 84.29 R 87.18 R13 ADT 43 40.14 PM 74.45 PR 66.89 PR14 JGL 11118 (Anjana) 85.59 R 73.81 PR 88.12 R15 JGL 1798 (Jagitial Sannalu) 71.94 PR 2.70 M 67.81 PR16 MTU 1010 (Cotton dora Sannalu) 73.33 PR 82.38 R 88.83 R17 MTU1001 (Vijetha) 90.24 R 85.34 R 91.65 R18 IR 36 62.18 PR 43.32 PM 68.39 PR19 NLR 33671 72.83 PR 3.52 M 70.72 PR20 RNR 2465 (Sugandha samba) 49.04 PM 41.31 PM 68.93 PR21 RNR 2458 (Krishna) 77.33 PR 81.77 R 84.09 R22 ADT 45 72.64 PR 70.51 PR 70.66 PR23 NLR 34303 71.35 PR 72.40 PR 67.15 PR24 Pusa Sugandha(PS) 4 71.36 PR 81.01 R 89.35 R25 Pusa Sugandha(PS) 5 80.62 R 78.00 PR 83.03 R26 HMT Sona 62.59 PR 40.93 PM 52.01 PM27 BPT 5204 (Sambamahsuri) 83.04 R 81.08 R 86.87 R28 WGL 44 (Siddhi) 11.93 PM 73.52 PR 45.82 PM29 Kasturi 50.50 PM 29.97 PM 16.67 PM30 RNR 2354(Shobini) 12.68 PM 3.32 M 64.26 PR31 WGL 14 (Warangal Samba) 73.27 PR 72.99 PR 72.30 PR32 WGL 23985 (Ramappa) 73.26 PR 73.79 PR 69.91 PR33 CR 1009(Savithri) 65.22 PR 73.06 PR 73.83 PR34 Vasumati 57.57 PM 10.55 PM 26.64 PM35 Sumati 85.38 R 82.39 R 87.68 R36 NLR 33359 (Sravani) 68.54 PR 68.45 PR 72.98 PR37 WGL 32100 (Warangal Sannalu) 77.83 PR 83.36 R 86.49 R38 WGL 283 (Sheethal) 87.49 R 82.21 R 88.20 R39 WGL 3962 82.04 R 83.44 R 84.82 R40 BPT 2411 73.45 PR 52.22 PM 65.39 PR
M : Maintainers ; PM : Partial Maintainers; PR : Partial Restorers;R : Restorers
Table 1. Estimates of mean per cent spikelet fertility among rice hybrids during Kharif, 2015
S.No.
GenotypeIR-58025A IR-68888A IR-68897A
Spikeletfertility (%)
Fertilityreaction
Spikeletfertility (%)
Fertilityreaction
Spikeletfertility (%)
Fertilityreaction
DIFFERENTIAL REACTION OF SELECTED RESTORERS/MAINTAINERS IN HYBRID RICE
12
Fig.
1. I
dent
ified
pot
entia
l res
tore
rs a
nd m
aint
aine
rs o
n IR
580
25 A
, IR
688
88A
and
IR 6
8897
A b
ased
on
spik
elet
fert
ility
r
eact
ion
M
: Mai
ntai
ners
; PM
: Pa
rtia
l Mai
ntai
ners
; PR
: Pa
rtia
l Res
tore
rs; R
: R
esto
rers
KRISHNA NAIK et al.
13
Tabl
e 2.
Gro
upin
g of
mal
e pa
rent
s ba
sed
on th
eir r
eact
ion
into
as
mai
ntai
ners
and
rest
orer
s
C
MS
line
Mai
ntai
ners
Par
tial M
aint
aine
rs
Par
tial R
esto
rers
R
esto
rers
IR 3
6, H
MT
Sona
CR
100
9,N
LR 3
3359
, NLR
343
03, P
S4,
JG
L 17
98, A
DT
45, N
LR33
671,
MTU
101
0, W
GL
2398
5, W
GL
14, B
PT
2411
,N
LR 4
0024
, NLR
400
58, N
LR30
10, R
NR
245
8, W
GL
3210
0, N
LR 3
083
ADT
37
WG
L 44
, NLR
333
58R
NR
235
4, N
LR 3
3057
,N
LR 4
0065
, AD
T 43
, RN
R 2
465,
Kas
turi,
Vas
umat
i
IR-5
8025
AN
LR 3
042
PS
5, N
LR 3
041,
WG
L 39
62,
BP
T 52
04, S
umat
i, JG
L11
118,
WG
L 28
3, N
LR 3
4449
,M
TU10
01, N
LR 1
45
IR-6
8888
AJG
L 17
98
RN
R 2
354
NLR
336
71
NLR
333
58
Vasu
mat
i, K
astu
riH
MT
Son
a, R
NR
246
5, IR
36,
BPT
2411
NLR
304
2, N
LR 3
3359
,AD
T 45
, NLR
330
57,
NLR
343
03, W
GL
14,
CR
100
9,W
GL
44W
GL
2398
5, J
GL
1111
8, A
DT
43, N
LR 4
0065
, NLR
4005
8,P
S 5
, NLR
301
0
NLR
304
1, P
S 4
, BP
T 52
04,
RN
R 2
458,
WG
L 28
3,M
TU10
10, S
umat
i, W
GL
3210
0,W
GL
3962
, NLR
344
49, A
DT
37, N
LR 1
45, M
TU10
01,
NLR
308
3, N
LR 4
0024
IR-6
8897
AK
astu
ri ,N
LR 3
3358
, Vas
umat
i,N
LR 3
3057
NLR
304
2, W
GL
44H
MT
Sona
, NLR
400
65
RN
R 2
354,
BPT
241
1, N
LR40
058,
AD
T 43
, NLR
343
03,
JGL
1798
, IR
36,
RN
R 2
465,
WG
L 23
985,
AD
T 45
, NLR
3367
1, W
GL
14, N
LR 3
3359
,C
R 1
009
NLR
400
24, P
S 5,
NLR
145,
RN
R 2
458,
NLR
301
0,W
GL
3962
, NLR
344
49, W
GL
3210
0, B
PT
5204
, AD
T 37
,N
LR 3
041,
Sum
ati,
JGL
1111
8, W
GL
283,
MTU
101
0,PS
4, N
LR 3
083,
MTU
1001
DIFFERENTIAL REACTION OF SELECTED RESTORERS/MAINTAINERS IN HYBRID RICE
14
M :
Mai
ntai
ners
; PM
: Pa
rtia
l Mai
ntai
ners
; PR
: Pa
rtia
l Res
tore
rs ;
R :
Res
tore
rs
Fig.
2. I
dent
ified
pot
entia
l res
tore
rs a
nd m
aint
aine
rs in
IR 5
8025
A b
ased
on
spik
elet
fert
ility
reac
tion
KRISHNA NAIK et al.
15
M :
Mai
ntai
ners
; PM
: Pa
rtia
l Mai
ntai
ners
; PR
: Pa
rtia
l Res
tore
rs; R
: R
esto
rers
Fig.
3. I
dent
ified
pot
entia
l res
tore
rs a
nd m
aint
aine
rs in
IR 6
8888
A b
ased
on
spik
elet
fert
ility
reac
tion
DIFFERENTIAL REACTION OF SELECTED RESTORERS/MAINTAINERS IN HYBRID RICE
16
M :
Mai
ntai
ners
; PM
: Pa
rtia
l Mai
ntai
ners
; PR
: Pa
rtia
l Res
tore
rs; R
: R
esto
rers
Fig.
4. I
dent
ified
pot
entia
l res
tore
rs a
nd m
aint
aine
rs in
IR 6
8897
A b
ased
on
spik
elet
fert
ility
reac
tion
KRISHNA NAIK et al.
17
when crossed with all three CMS lines viz., IR58025A, IR 68888A and IR 68897A. Six maleparents NLR 40024, NLR 3083, ADT 37, WGL 32100,MTU 1010 and RNR 2458 were found to be potentialfertility restorers when crossed with two CMS linesviz., IR 68888A and IR 68897A and two male parentsviz., PS 4 and NLR 3010 were found to be potentialfertility restorers when crossed with one CMS lineIR 68897A. One male parent JGL 11118 was foundto be potential fertility restorer when crossed withtwo CMS lines viz., IR 58025 A and IR 68897A. Theidentified restorer lines can be used as pollen parentin developing new commercial hybrids. New restorermay also be developed through crossing programmewhich can expand the genetic base of restorer bypyramiding complementary traits from diversesources according to breeding objectives.
REFERENCES
Bhadru, D., Lokanadha, R and Ramehsa, M.S. 2015.Differential reaction of selected restorers/maintainers with WA based CMS lines andgenetics of fertility restoration in hybrid rice(Oryza sativa L.). Agricultural ScienceDigest. 35 (2): 116-120.
Khush, S.G.2005. What it will take to feed 5.0 billionrice consumers in 2030? Plant MolecularBiology.59 (1): 1-6.
Malarvizhi, D., Thiyagrajan, K., Manonmani, S andDeepa Sankar, P. 2003. Fertility restorationbehaviour of promising CMS lines in rice(Oryza sativa L.). Indian Journal ofAgricultural Science. 37(4): 259-263.
Parmita,P and Ashish,G. 2017. Identification ofrestorers and maintainers for WA basedIndica CMS lines of rice. InternationalJournal of Plant Sciences.12 (2): 125-130
Rajendra Prasad, K., Radha Krishna, K.V., SudheerKumar, S and Subba Rao, L.V. 2017.Identification of elite restorers andmaintainers in rice (Oryza sativa L.) basedon pollen fertility and spikelet fertilitystudies. International Journal of CurrentMicrobiology and Applied Science. 6(8):2647-2651.
Rosamma, C.A and Vijayakumar, N.K. 2005.Maintainers and restorers for CMS lines ofrice. Journal of Tropical Agriculture. 43 (1-2): 75-77.
Salgotra, R.K., Katoch, P.C and Kaushik R.P. 2002.Identification of restorers and maintainersfor cytoplasmic genic male sterile lines ofrice. Oryza. 39: 55-57.
Shama, P., Himanshu, T and Madhuri, A. 2018.Identification of restorers and maintainersfor WA-CMS lines in rice (Oryza sativaL.).Journal of Pharmacognosy andPhytochemistry. SP2: 111-113.
Virmani, S.S., Viraktamath, B.C., Casal, C.L.,Toledo, R.S., Lopez, M.T and Manalo, J.O.1997. Hybrid Rice Breeding Manual.International Rice Research Institute,Phillipines. ISBN: 9789712201035:151.
Upadhyay, M.N and Jaiswal, H.K. 2012. Restorersand maintainers of WA cytoplasmic malesterile lines in rice. International RiceResearch Notes. Gen Res IRRN. 37.
DIFFERENTIAL REACTION OF SELECTED RESTORERS/MAINTAINERS IN HYBRID RICE
18
*Corresponding Author E-mail: [email protected]
INTRODUCTION
Maize (Zea mays L) is one of the mostversatile re-emerging crops having wider adaptabilityunder varied agro-climatic conditions and successfulcultivation in diverse seasons and ecologies forvarious purposes. It has become an important rawmaterial in food processing, poultry, dairy, meat andethanol industry, besides, its traditional uses makesit one of the fastest growing cash crops in the world.Maize has a greater nutritional value (Has et al.,2009) and harvests the nutrients heavily from the soil.Hence, yield of maize is alarmingly affected by thedeficiency of nutrients (especially N). Maize needsample quantity of N for its better production. It is,therefore, imperative to use an optimum amount ofN through a suitable and efficient nitrogen sourcesbecause it plays a very significant role in cropdevelopment (Ahmad, 2000).
The soils being low in Nitrogen (N) requireapplication of this nutrient in appropriate and balancedamount. In spite of substantial fertilizer use, the cropyields are not increasing correspondingly, whichreflect low Fertilizer Use Efficiency (FUE). Further,continuous use of fertilizers creates potentialpolluting effect on the environment (Oad et al., 2004).Under the present trend of exploitative agriculture in
EFFECT OF INTEGRATED USE OF CHEMICAL FERTILIZERS, ORGANICMANURES AND BIOFERTILIZERS ON SOIL PROPERTIES AND YIELD OF MAIZE
J. SAI SANTHOSH, T. VENKATA SRIDHAR*, P. RAVINDRA BABU and M. MARTIN LUTHERDepartment of Soil Science and Agricultural Chemistry, Agricultural College,
Acharya N.G Ranga Agricultural University, Bapatla-522 101
Date of Receipt: 05.07.2018 Date of Acceptance: 31.08.2018
ABSTRACTThe experiment aimed to study the effect of integrated use of chemical fertilizers, organic manures and biofertilizers on
soil properties and yield of maize was carried out during kharif, 2017 was laid out in a randomized block design with eighttreatments and replicated thrice. Highest grain yield (5827 kg ha-1), straw yield (6026 kg ha-1) and harvest index (0.49) wereobserved in the treatment applied with 100 % recommended dose of nitrogen. Highest post-harvest soil, available nitrogen (170kg ha-1) was recorded with 100% recommended dose of nitrogen, whereas highest available phosphorous and potassium wererecorded in treatment applied with 50% RDN + 50% N through FYM. Similarly, highest urease and dehydrogenase activity, wasrecorded in the soil at knee high, tasseling and harvest stages with in the treatment of 50% RDN + 50% N supplied through FYM.
J.Res. ANGRAU 46(3) 18-21, 2018
India, inherent soil fertility can no longer bemaintained on sustainable basis. It is evidently saidthat nutrient supplying capacity of soil declinessteadily under continuous and intensive cropping.
The integration of organic sources withsynthetic sources of nutrients not only supplyessential nutrients, but also have some positiveinteraction with chemical fertilizers to increase theirefficiency and thereby, reduce environmental hazards.Keeping these in view, the experiment wasconducted to study the effect of different levels ofnitrogen, vermicompost, FYM and biofertilizers onsoil properties and yield of maize and to find out thepossible combinations of inorganic and organicsources for supply of the nutrients.
MATERIAL AND METHODS
The field experiment was carried out in sandyloam soils at Agricultural College Farm, Bapatla,Andhra Pradesh during Kharif, 2017. Theexperimental soil was slightly acidic in reaction (pH:6.7) and non-saline (EC: 0.27 dS m-1) in nature withlow Organic Carbon (0.25%). The soil availablenutrient status (N, P and K) at the beginning of theexperiment was 150 kg ha-1, 54.3 kg ha-1 and 268 kg
19
ha-1, respectively. The experiment was designed witheight (8) treatments replicated thrice in randomizedblock design. The treatments consisted of T1:Absolute control (No fertilizer); T2: RecommendedDose of Nitrogen; T3: RDN 50% through urea + 50%N through vermicompost T4: RDN 50% through urea+ 50% N through FYM T5: 50% RDN through urea +Azospirillum @ 5 kg ha-1 T6: 75% RDN through urea+ 25% N through vermicompost T7: 75% RDN throughurea + 25% N through FYM T8: 75% RDN throughurea + Azospirillum @ 2.5 kg ha-1. Maize crop (varietyPioneer 3396) was used as a test crop. Among theorganic sources, FYM was applied one week priorto sowing, whereas, vermicompost was applied twodays before sowing and was applied one day beforesowing. Recommended dose of N, P2O5 and K2O kgha-1 were applied in the form of urea (in three equalsplits), single super phosphate (basal) and muriateof potash (basal), respectively. The seeds weredibbled at a spacing of 60 cm x 20cm. The soilsamples were collected at harvest and estimated foravailable macronutrients (NPK) and micronutrients(Fe, Cu, Mn and Zn) by employing suitable methods.Data interpretation was completed by employingsuitable statistical method.
RESULTS AND DISCUSSION
Grain Yield
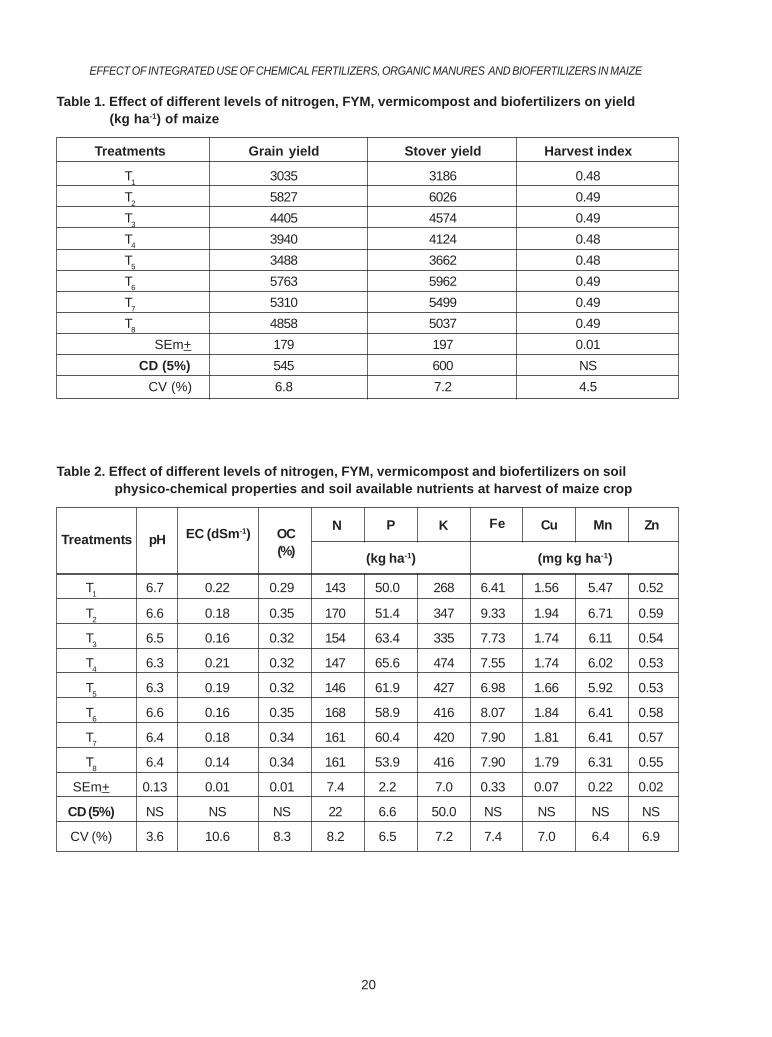
The grain yield increased significantly withincrease in the levels of nitrogen, organic sourcesand biofertilizers (Table 1). Highest grain yield (5827kg ha-1) was recorded in T2 (RDN 100% through urea),which was on par with treatments of 75% RDN +25% N through vermicompost (T6) and 75% RDN +25% N through FYM (T7). Treatments supplied withrecommended doses of nitrogen through inorganicfertilizer (T2) were significantly superior to those whichreceived the nitrogen through organic or biofertilizersapplied in combination with inorganics.
Soil Physico-Chemical Properties
The soil pH, Electrical Conductivity (EC) andOrganic Carbon (OC) at harvest stage of maize cropwere not significantly influenced by the applicationof different treatments (Table 2).
Major and Micro Nutrients
The highest soil available nitrogen wasrecorded with application of 100% recommended doseof nitrogen at harvest stage (170 kg ha-1) (Table 3).Higher accumulation of available N in all thetreatments when compared to control might be dueto increase in net N mineralization rates by theapplication of inorganic as well as organic fertilizers(Sharma et al., 2017). Soil, available phosphorouswas highest in T4 at harvest stage (65.6 kg ha-1) whichwas on par with T3, T5 and T7 (Table 2). Highest soilavailable P at harvest in treatment T3 through T8 bedue to amending soil with organic manures and,biofertilizers that helps in enhancing the Pconcentration in solution through mineralization oforganic P and solubilization of native soil Pcompounds by producing organic acids. (Roy et al.,2017). Soil available potassium at harvest stage (474kg ha-1) was also recorded highest in T4 which wassignificantly superior over other treatments (Table 2).Highest available potassium in integrated treated plotmight be due to the addition of organic matter thatreduced potassium fixation and released potassiumdue to interaction of organic matter with clay, besidesthe direct addition of potassium to the pool of soil(Urkurkar et al., 2010). However availability ofmicronutrients (Fe, Cu, Mn and Zn) in post-harvestsoil was not significantly influenced by differenttreatments (Table 2).
Enzyme Activity
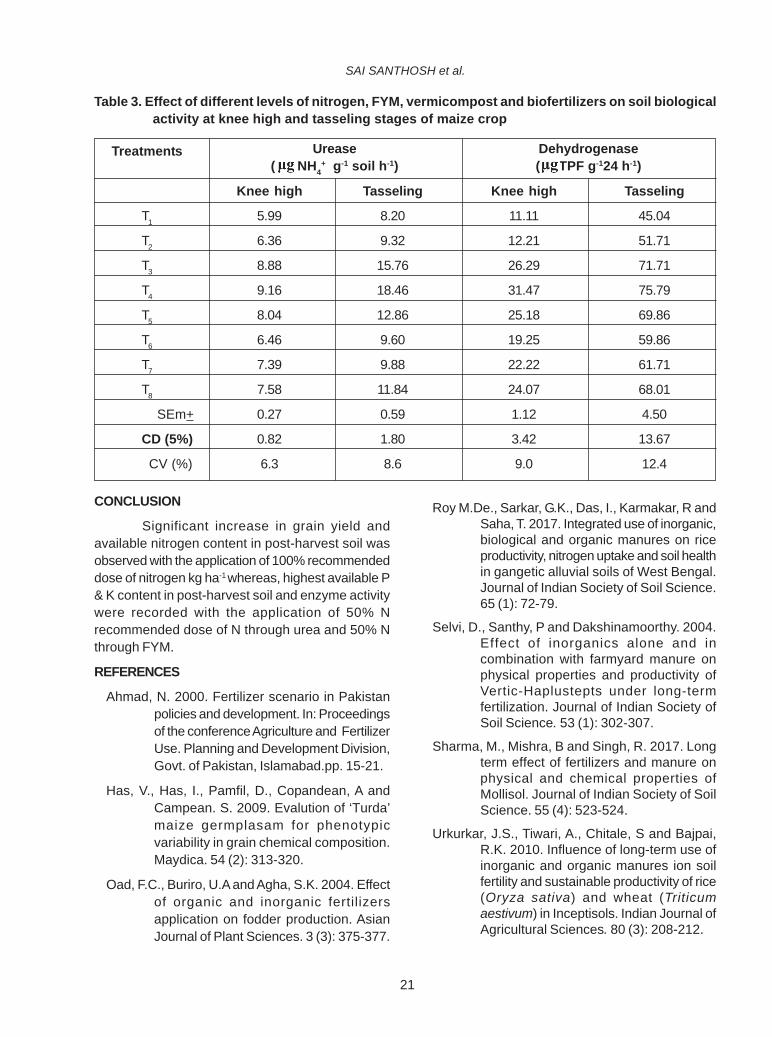
Highest urease and dehydrogenase activitywas observed at tasseling stage over knee highstage. Highest urease and dehydrogenase activitywas recorded as 9.16 NH4
+ - g-1 soil h-1 and 31.47 TPF g-1 24 h-1 respectively at knee high stage
and 18.46 NH4+ - g-1 soil h-1 and 75.79 TPF
g-1 24 h-1, respectively at tasseling stage in T4 (Table3). Enhancement of urease and dehydrogenaseactivity with increased rate of nitrogen applicationalong with FYM to soil might be due to added organicmanures which acted as sole source of carbon andenergy for microbes by which their populationincreased resulting in increased enzymatic activity(Selvi et al., 2004).
SAI SANTHOSH et al.
20
Table 2. Effect of different levels of nitrogen, FYM, vermicompost and biofertilizers on soil physico-chemical properties and soil available nutrients at harvest of maize crop
T1 6.7 0.22 0.29 143 50.0 268 6.41 1.56 5.47 0.52
T2 6.6 0.18 0.35 170 51.4 347 9.33 1.94 6.71 0.59
T3 6.5 0.16 0.32 154 63.4 335 7.73 1.74 6.11 0.54
T4 6.3 0.21 0.32 147 65.6 474 7.55 1.74 6.02 0.53
T5 6.3 0.19 0.32 146 61.9 427 6.98 1.66 5.92 0.53
T6 6.6 0.16 0.35 168 58.9 416 8.07 1.84 6.41 0.58
T7 6.4 0.18 0.34 161 60.4 420 7.90 1.81 6.41 0.57
T8 6.4 0.14 0.34 161 53.9 416 7.90 1.79 6.31 0.55
SEm+ 0.13 0.01 0.01 7.4 2.2 7.0 0.33 0.07 0.22 0.02
CD (5%) NS NS NS 22 6.6 50.0 NS NS NS NS
CV (%) 3.6 10.6 8.3 8.2 6.5 7.2 7.4 7.0 6.4 6.9
Table 1. Effect of different levels of nitrogen, FYM, vermicompost and biofertilizers on yield (kg ha-1) of maize
Treatments Grain yield Stover yield Harvest index
T1 3035 3186 0.48T2 5827 6026 0.49T3 4405 4574 0.49T4 3940 4124 0.48T5 3488 3662 0.48T6 5763 5962 0.49T7 5310 5499 0.49T8 4858 5037 0.49
SEm+ 179 197 0.01 CD (5%) 545 600 NS CV (%) 6.8 7.2 4.5
Treatments pH EC (dSm-1) OC(%) (kg ha-1) (mg kg ha-1)
N P K Fe Cu Mn Zn
EFFECT OF INTEGRATED USE OF CHEMICAL FERTILIZERS, ORGANIC MANURES AND BIOFERTILIZERS IN MAIZE
21
CONCLUSION
Significant increase in grain yield andavailable nitrogen content in post-harvest soil wasobserved with the application of 100% recommendeddose of nitrogen kg ha-1 whereas, highest available P& K content in post-harvest soil and enzyme activitywere recorded with the application of 50% Nrecommended dose of N through urea and 50% Nthrough FYM.
REFERENCES
Ahmad, N. 2000. Fertilizer scenario in Pakistanpolicies and development. In: Proceedingsof the conference Agriculture and FertilizerUse. Planning and Development Division,Govt. of Pakistan, Islamabad.pp. 15-21.
Has, V., Has, I., Pamfil, D., Copandean, A andCampean. S. 2009. Evalution of ‘Turda’maize germplasam for phenotypicvariability in grain chemical composition.Maydica. 54 (2): 313-320.
Oad, F.C., Buriro, U.A and Agha, S.K. 2004. Effectof organic and inorganic fertilizersapplication on fodder production. AsianJournal of Plant Sciences. 3 (3): 375-377.
Roy M.De., Sarkar, G.K., Das, I., Karmakar, R andSaha, T. 2017. Integrated use of inorganic,biological and organic manures on riceproductivity, nitrogen uptake and soil healthin gangetic alluvial soils of West Bengal.Journal of Indian Society of Soil Science.65 (1): 72-79.
Selvi, D., Santhy, P and Dakshinamoorthy. 2004.Effect of inorganics alone and incombination with farmyard manure onphysical properties and productivity ofVertic-Haplustepts under long-termfertilization. Journal of Indian Society ofSoil Science. 53 (1): 302-307.
Sharma, M., Mishra, B and Singh, R. 2017. Longterm effect of fertilizers and manure onphysical and chemical properties ofMollisol. Journal of Indian Society of SoilScience. 55 (4): 523-524.
Urkurkar, J.S., Tiwari, A., Chitale, S and Bajpai,R.K. 2010. Influence of long-term use ofinorganic and organic manures ion soilfertility and sustainable productivity of rice(Oryza sativa) and wheat (Triticumaestivum) in Inceptisols. Indian Journal ofAgricultural Sciences. 80 (3): 208-212.
Table 3. Effect of different levels of nitrogen, FYM, vermicompost and biofertilizers on soil biologicalactivity at knee high and tasseling stages of maize crop
Treatments
Knee high Tasseling Knee high Tasseling
T1 5.99 8.20 11.11 45.04
T2 6.36 9.32 12.21 51.71
T3 8.88 15.76 26.29 71.71
T4 9.16 18.46 31.47 75.79
T5 8.04 12.86 25.18 69.86
T6 6.46 9.60 19.25 59.86
T7 7.39 9.88 22.22 61.71
T8 7.58 11.84 24.07 68.01
SEm+ 0.27 0.59 1.12 4.50
CD (5%) 0.82 1.80 3.42 13.67
CV (%) 6.3 8.6 9.0 12.4
Dehydrogenase( TPF g-124 h-1)
Urease( NH4
+ g-1 soil h-1)
SAI SANTHOSH et al.
22
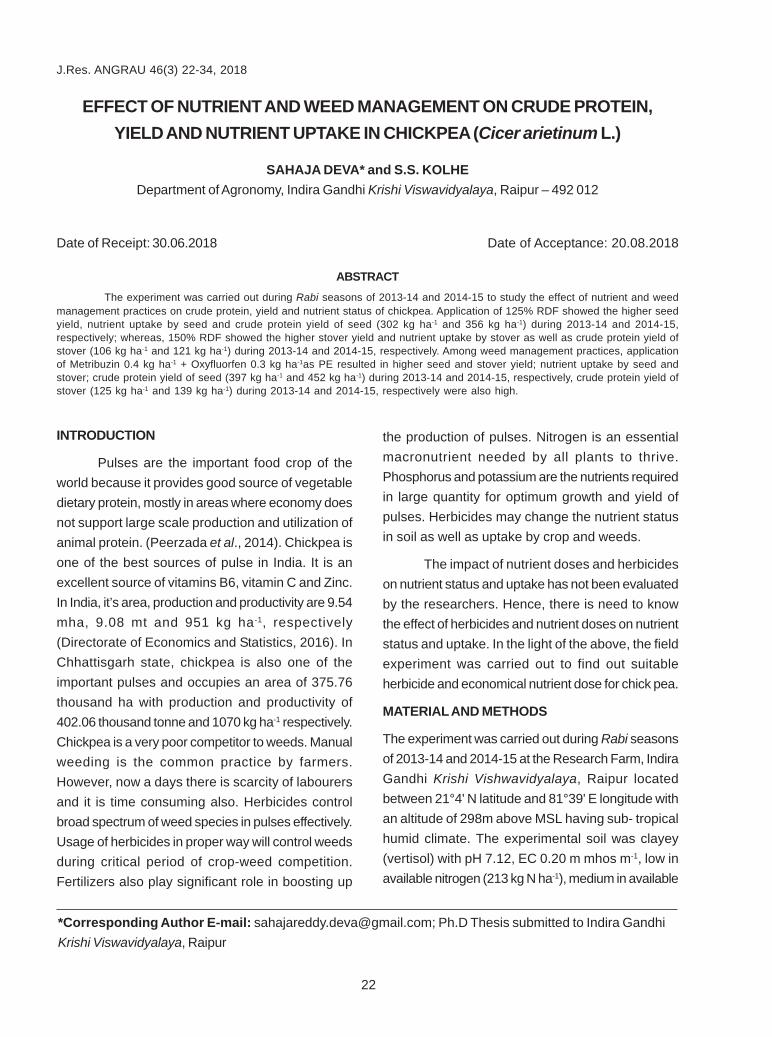
INTRODUCTION
Pulses are the important food crop of theworld because it provides good source of vegetabledietary protein, mostly in areas where economy doesnot support large scale production and utilization ofanimal protein. (Peerzada et al., 2014). Chickpea isone of the best sources of pulse in India. It is anexcellent source of vitamins B6, vitamin C and Zinc.In India, it’s area, production and productivity are 9.54mha, 9.08 mt and 951 kg ha-1, respectively(Directorate of Economics and Statistics, 2016). InChhattisgarh state, chickpea is also one of theimportant pulses and occupies an area of 375.76thousand ha with production and productivity of402.06 thousand tonne and 1070 kg ha-1 respectively.Chickpea is a very poor competitor to weeds. Manualweeding is the common practice by farmers.However, now a days there is scarcity of labourersand it is time consuming also. Herbicides controlbroad spectrum of weed species in pulses effectively.Usage of herbicides in proper way will control weedsduring critical period of crop-weed competition.Fertilizers also play significant role in boosting up
EFFECT OF NUTRIENT AND WEED MANAGEMENT ON CRUDE PROTEIN,YIELD AND NUTRIENT UPTAKE IN CHICKPEA (Cicer arietinum L.)
SAHAJA DEVA* and S.S. KOLHEDepartment of Agronomy, Indira Gandhi Krishi Viswavidyalaya, Raipur – 492 012
Date of Receipt: 30.06.2018 Date of Acceptance: 20.08.2018
ABSTRACTThe experiment was carried out during Rabi seasons of 2013-14 and 2014-15 to study the effect of nutrient and weed
management practices on crude protein, yield and nutrient status of chickpea. Application of 125% RDF showed the higher seedyield, nutrient uptake by seed and crude protein yield of seed (302 kg ha-1 and 356 kg ha-1) during 2013-14 and 2014-15,respectively; whereas, 150% RDF showed the higher stover yield and nutrient uptake by stover as well as crude protein yield ofstover (106 kg ha-1 and 121 kg ha-1) during 2013-14 and 2014-15, respectively. Among weed management practices, applicationof Metribuzin 0.4 kg ha-1 + Oxyfluorfen 0.3 kg ha-1as PE resulted in higher seed and stover yield; nutrient uptake by seed andstover; crude protein yield of seed (397 kg ha-1 and 452 kg ha-1) during 2013-14 and 2014-15, respectively, crude protein yield ofstover (125 kg ha-1 and 139 kg ha-1) during 2013-14 and 2014-15, respectively were also high.
J.Res. ANGRAU 46(3) 22-34, 2018
*Corresponding Author E-mail: [email protected]; Ph.D Thesis submitted to Indira GandhiKrishi Viswavidyalaya, Raipur
the production of pulses. Nitrogen is an essentialmacronutrient needed by all plants to thrive.Phosphorus and potassium are the nutrients requiredin large quantity for optimum growth and yield ofpulses. Herbicides may change the nutrient statusin soil as well as uptake by crop and weeds.
The impact of nutrient doses and herbicideson nutrient status and uptake has not been evaluatedby the researchers. Hence, there is need to knowthe effect of herbicides and nutrient doses on nutrientstatus and uptake. In the light of the above, the fieldexperiment was carried out to find out suitableherbicide and economical nutrient dose for chick pea.
MATERIAL AND METHODS
The experiment was carried out during Rabi seasonsof 2013-14 and 2014-15 at the Research Farm, IndiraGandhi Krishi Vishwavidyalaya, Raipur locatedbetween 21°4' N latitude and 81°39' E longitude withan altitude of 298m above MSL having sub- tropicalhumid climate. The experimental soil was clayey(vertisol) with pH 7.12, EC 0.20 m mhos m-1, low inavailable nitrogen (213 kg N ha-1), medium in available
23
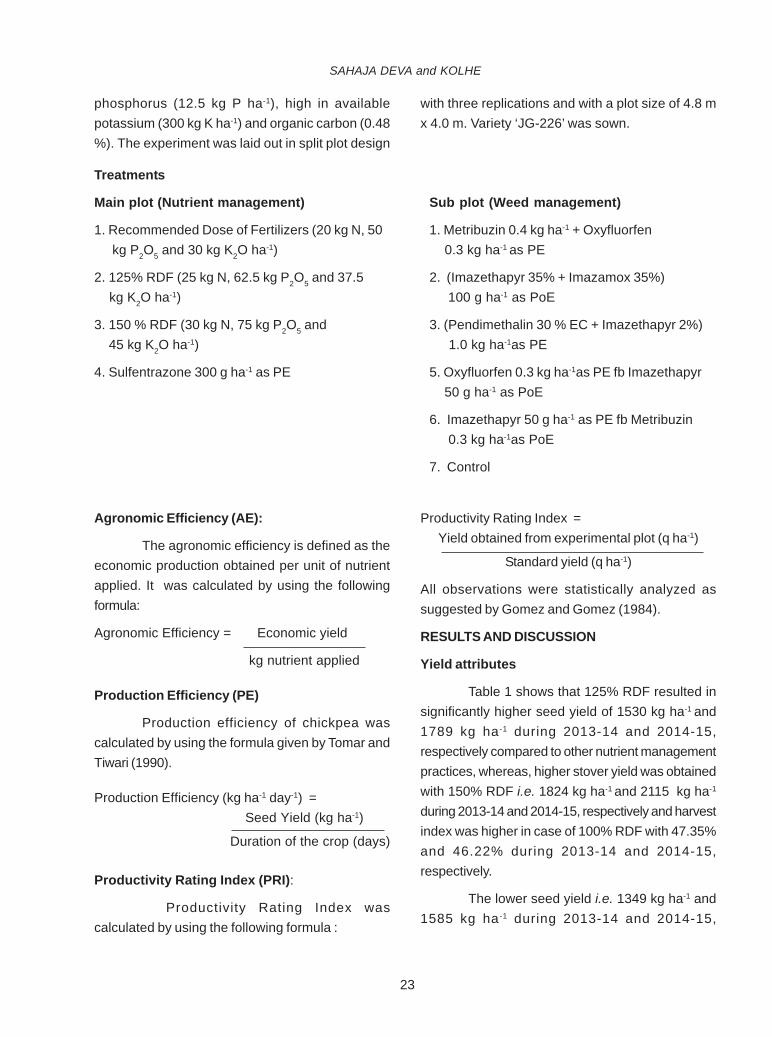
phosphorus (12.5 kg P ha-1), high in availablepotassium (300 kg K ha-1) and organic carbon (0.48%). The experiment was laid out in split plot design
Treatments
Main plot (Nutrient management) Sub plot (Weed management)
1. Recommended Dose of Fertilizers (20 kg N, 50 1. Metribuzin 0.4 kg ha-1 + Oxyfluorfen kg P2O5 and 30 kg K2O ha-1) 0.3 kg ha-1 as PE
2. 125% RDF (25 kg N, 62.5 kg P2O5 and 37.5 2. (Imazethapyr 35% + Imazamox 35%) kg K2O ha-1) 100 g ha-1 as PoE
3. 150 % RDF (30 kg N, 75 kg P2O5 and 3. (Pendimethalin 30 % EC + Imazethapyr 2%) 45 kg K2O ha-1) 1.0 kg ha-1as PE
4. Sulfentrazone 300 g ha-1 as PE 5. Oxyfluorfen 0.3 kg ha-1as PE fb Imazethapyr 50 g ha-1 as PoE
6. Imazethapyr 50 g ha-1 as PE fb Metribuzin 0.3 kg ha-1as PoE
7. Control
with three replications and with a plot size of 4.8 mx 4.0 m. Variety ‘JG-226’ was sown.
Agronomic Efficiency (AE):
The agronomic efficiency is defined as theeconomic production obtained per unit of nutrientapplied. It was calculated by using the followingformula:
Agronomic Efficiency = Economic yield
kg nutrient applied
Production Efficiency (PE)
Production efficiency of chickpea wascalculated by using the formula given by Tomar andTiwari (1990).
Production Efficiency (kg ha-1 day-1) = Seed Yield (kg ha-1)
Duration of the crop (days)
Productivity Rating Index (PRI):
Productivity Rating Index wascalculated by using the following formula :
Productivity Rating Index =Yield obtained from experimental plot (q ha-1)
Standard yield (q ha-1)
All observations were statistically analyzed assuggested by Gomez and Gomez (1984).
RESULTS AND DISCUSSION
Yield attributes
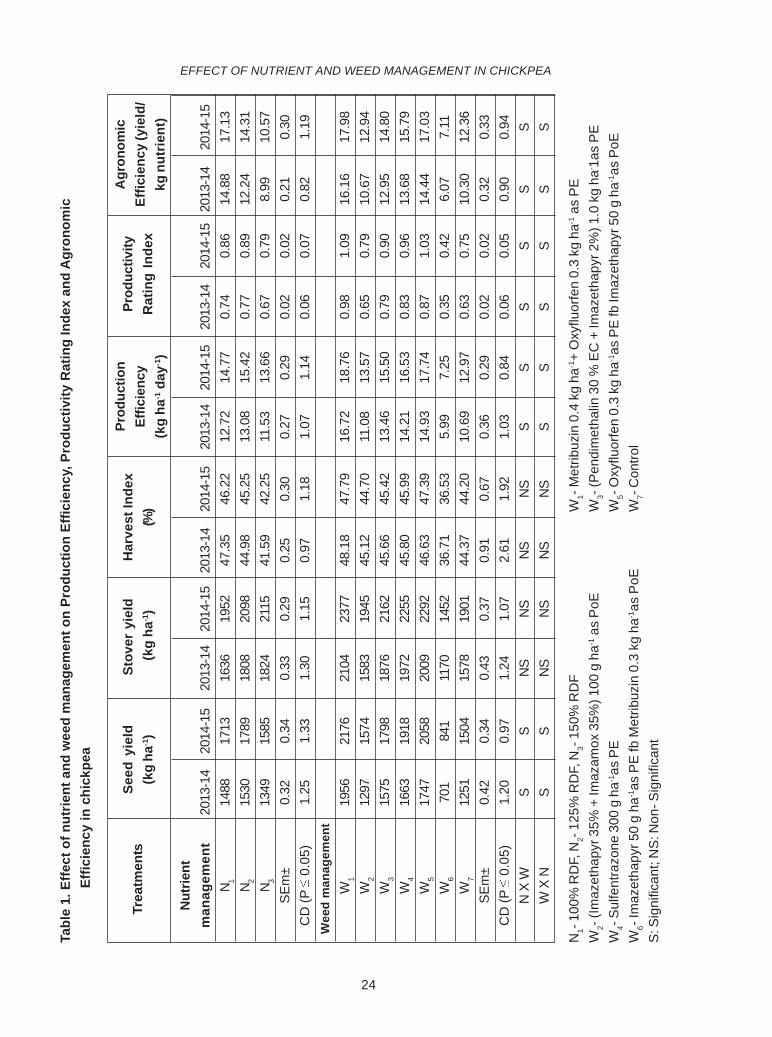
Table 1 shows that 125% RDF resulted insignificantly higher seed yield of 1530 kg ha-1 and1789 kg ha-1 during 2013-14 and 2014-15,respectively compared to other nutrient managementpractices, whereas, higher stover yield was obtainedwith 150% RDF i.e. 1824 kg ha-1 and 2115 kg ha-1
during 2013-14 and 2014-15, respectively and harvestindex was higher in case of 100% RDF with 47.35%and 46.22% during 2013-14 and 2014-15,respectively.
The lower seed yield i.e. 1349 kg ha-1 and1585 kg ha-1 during 2013-14 and 2014-15,
SAHAJA DEVA and KOLHE
24
EFFECT OF NUTRIENT AND WEED MANAGEMENT IN CHICKPEATa
ble
1. E
ffect
of n
utrie
nt a
nd w
eed
man
agem
ent o
n Pr
oduc
tion
Effic
ienc
y, P
rodu
ctiv
ity R
atin
g In
dex
and
Agr
onom
ic
E
ffici
ency
in c
hick
pea
N1-
100
% R
DF,
N2-
125
% R
DF,
N3-
150
% R
DF
W1-
Met
ribuz
in 0
.4 k
g ha
-1+
Oxy
fluor
fen
0.3
kg h
a-1 a
s P
EW
2- (I
maz
etha
pyr 3
5% +
Imaz
amox
35%
) 100
g h
a-1 a
s P
oEW
3- (P
endi
met
halin
30
% E
C +
Imaz
etha
pyr 2
%) 1
.0 k
g ha
- 1as
PE
W4-
Sul
fent
razo
ne 3
00 g
ha-1
as P
EW
5- O
xyflu
orfe
n 0.
3 kg
ha-1
as P
E fb
Imaz
etha
pyr 5
0 g
ha-1as
PoE
W6-
Imaz
etha
pyr 5
0 g
ha-1as
PE
fb M
etrib
uzin
0.3
kg
ha-1as
PoE
W7-
Con
trol
S: S
igni
fican
t; N
S: N
on- S
igni
fican
t
Nut
rient
man
agem
ent
2013
-14
2014
-15
2013
-14
2014
-15
2013
-14
2014
-15
2013
-14
2014
-15
2013
-14
2014
-15
2013
-14
2014
-15
N 114
8817
1316
3619
5247
.35
46.2
212
.72
14.7
70.
740.
8614
.88
17.1
3N 2
1530
1789
1808
2098
44.9
845
.25
13.0
815
.42
0.77
0.89
12.2
414
.31
N 313
4915
8518
2421
1541
.59
42.2
511
.53
13.6
60.
670.
798.
9910
.57
SEm
±0.
320.
340.
330.
290.
250.
300.
270.
290.
020.
020.
210.
30C
D (P
0
.05)
1.25
1.33
1.30
1.15
0.97
1.18
1.07
1.14
0.06
0.07
0.82
1.19
Wee
d m
anag
emen
tW
119
5621
7621
0423
7748
.18
47.7
916
.72
18.7
60.
981.
0916
.16
17.9
8W
212
9715
7415
8319
4545
.12
44.7
011
.08
13.5
70.
650.
7910
.67
12.9
4W
315
7517
9818
7621
6245
.66
45.4
213
.46
15.5
00.
790.
9012
.95
14.8
0W
416
6319
1819
7222
5545
.80
45.9
914
.21
16.5
30.
830.
9613
.68
15.7
9W
517
4720
5820
0922
9246
.63
47.3
914
.93
17.7
40.
871.
0314
.44
17.0
3W
670
184
111
7014
5236
.71
36.5
35.
997.
250.
350.
426.
077.
11W
712
5115
0415
7819
0144
.37
44.2
010
.69
12.9
70.
630.
7510
.30
12.3
6SE
m±
0.42
0.34
0.43
0.37
0.91
0.67
0.36
0.29
0.02
0.02
0.32
0.33
CD
(P
0.0
5)1.
200.
971.
241.
072.
611.
921.
030.
840.
060.
050.
900.
94N
X W
SS
NS
NS
NS
NS
SS
SS
SS
W X
NS
SN
SN
SN
SN
SS
SS
SS
S
Trea
tmen
tsSe
ed y
ield
(kg
ha-1)
Stov
er y
ield
(kg
ha-1)
Har
vest
Inde
x(%
)
Prod
uctio
nEf
ficie
ncy
(kg
ha-1 d
ay-1)
Prod
uctiv
ityR
atin
g In
dex
Agr
onom
icEf
ficie
ncy
(yie
ld/
kg n
utrie
nt)
25
respectively and harvest index of 41.59% and 42.25%during 2013-14 and 2014-15, respectively wasrecorded in 150% RDF, whereas, the lower stoveryield of 1636 kg ha-1and 1952 kg ha-1 during 2013-14and 2014-15, respectively was observed in 100%RDF.
Weed management practices exertedsignificant impact on seed and stover yield andharvest index of chickpea. The higher seed yield of1956 kg ha-1and 2176 kg ha-1 during 2013-14 and2014-15, respectively and stover yield of 2104 kgha-1 and 2377 kg ha-1 during 2013-14 and 2014-15,respectively and harvest index of 48.18 % and47.79 % during 2013-14 and 2014-15, respectivelywas recorded with Metribuzin 0.4 kg ha-1+ Oxyfluorfen0.3 kg ha-1as PE. The lower seed yield of 701 kg ha-
1 and 841 kg ha-1 during 2013-14 and 2014-15,respectively and stover yield of 1170 kg ha-1and 1452kg ha-1 during 2013-14 and 2014-15, respectively andharvest index of 36.71% and 36.53 % during 2013-14 and 2014-15, respectively was recorded withImazethapyr 50 g ha-1as PE fb Metribuzin 0.3 kgha-1as PoE.
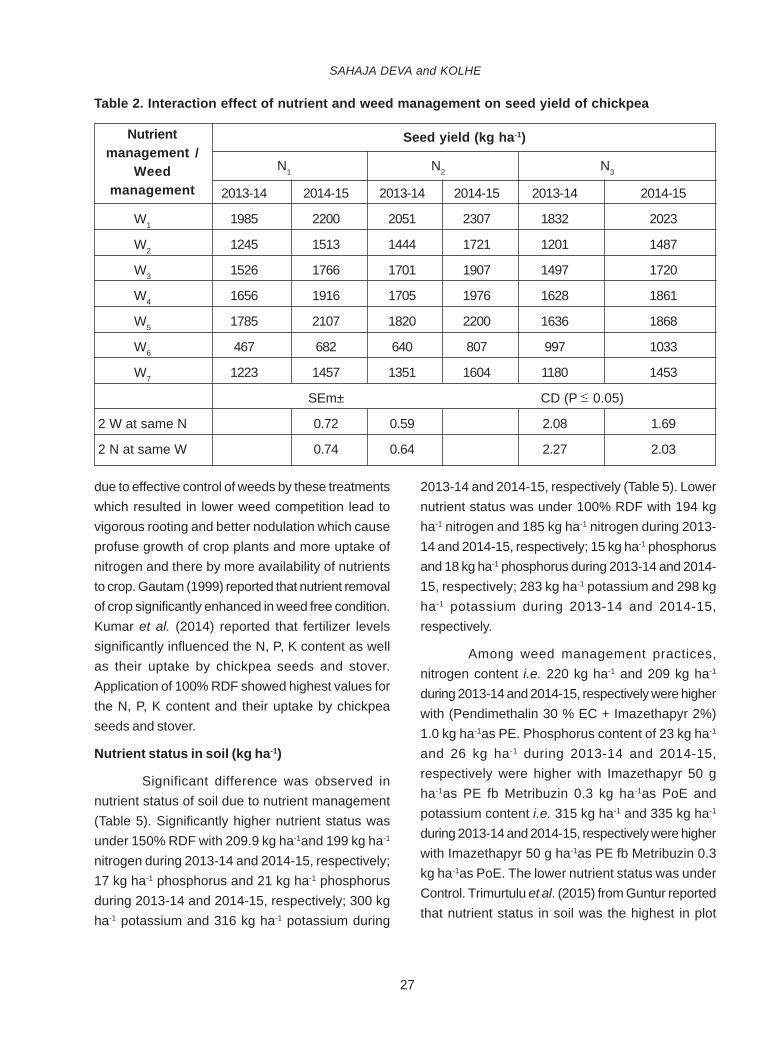
The interaction effect of nutrientmanagement and weed management practices wassignificant on seed yield but non-significant withstover yield and harvest index.
The higher seed yield was under interactionof 125% RDF and pre-emergence application ofmetribuzin 0.4 kg ha-1 + oxyfluorfen 0.3 kg ha-1 with2051 kg ha-1 and 2307 kg ha-1 during 2013-14 and2014-15, respectively. The lower seed yield wasunder interaction of 100% RDF and imazethapyr 50g ha-1 as PE fb metribuzin 0.3 kg ha-1 as PoE with467 kg ha-1 and 682 kg ha-1 during 2013-14 and 2014-15, respectively (Table 2).
Higher yield in nutrient management wasdue to higher dry matter accumulation of plant. Higherseed and stover yield under above treatments wasdue to the weed managed at critical period and earlycrop growth, higher dry matter production, high
growth and ultimately high yield. Lower weedpopulation and higher weed control efficiency alsoresulted in higher seed and stover yield. The lowerharvest index in nutrient management was due tothe fact that more amount of nutrients significantlyreduced grain yield as a result of excessive vegetativegrowth at the expense of pod formation. Kadam etal. (2014) reported that among different fertilitymanagement treatments, application of 125% RDFproduced higher grain (2553 kg ha-1) and stover yield(4881 kg ha-1) which was at par with 100% RDF+biofertilizer.
Agronomic Efficiency (%), Production Efficiency(kg ha-1 day-1) and Productivity Rating Index
Agronomic efficiency of chickpea wassignificantly influenced by nutrient management.100% RDF resulted in significantly higher agronomicefficiency of 14.88 and 17.13% during 2013-14 and2014-15, respectively (Table 1) compared to othernutrient management practices. Whereas, higherproduction efficiency of 13.08 kg ha-1 day-1and 15.42kg ha-1 day-1 during 2013-14 and 2014-15,respectively and productivity rating index of 0.77 and0.89 during 2013-14 and 2014-15, respectively wasunder 125% RDF. The lower agronomic efficiencyi.e. 8.99% and 10.57% during 2013-14 and 2014-15,respectively, production efficiency of 11.53 kg ha-1
day-1 and 13.66 kg ha-1 day-1 during 2013-14 and2014-15, respectively and productivity rating indexof 0.67 and 0.79 during 2013-14 and 2014-15,respectively was under 150% RDF.
Weed management practices exertedsignificant impact on agronomic efficiency, productionefficiency and productivity rating index of chickpea.The higher agronomic efficiency of 16.16% and17.98% during 2013-14 and 2014-15, respectively,production efficiency with 16.72 kg ha-1 day-1and18.76 kg ha-1 day-1 during 2013-14 and 2014-15,respectively and productivity rating index with 0.98and 1.09 during 2013-14 and 2014-15, respectivelywas under metribuzin 0.4 kg ha-1+ oxyfluorfen 0.3
SAHAJA DEVA and KOLHE
26
EFFECT OF NUTRIENT AND WEED MANAGEMENT IN CHICKPEA
kg ha-1as PE. The lower agronomic efficiency i.e.6.07% and 7.11% during 2013-14 and 2014-15,respectively, production efficiency with 5.99 kg ha-1
day-1 and 7.25 kg ha-1 day-1 during 2013-14 and 2014-15, respectively and productivity rating index with0.35 and 0.42 during 2013-14 and 2014-15,respectively was under imazethapyr 50 g ha-1as PEfb metribuzin 0.3 kg ha-1as PoE.
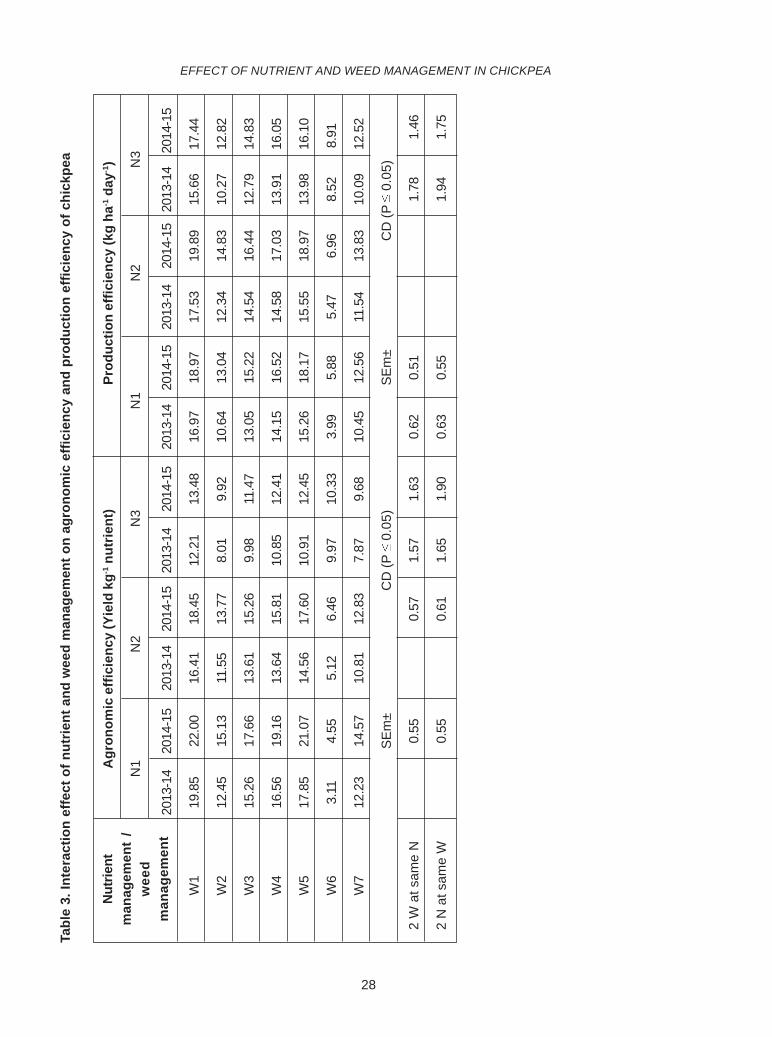
The interaction effect of nutrientmanagement and weed management practices wassignificant on agronomic efficiency and productionefficiency.
The maximum agronomic efficiency (Table3) was under interaction of 100% RDF with pre-emergence application of metribuzin 0.4 kg ha-1 +oxyfluorfen 0.3 kg ha-1 (19.85% and 22.00% during2013-14 and 2014-15, respectively). The loweragronomic efficiency was under interaction of 100%RDF with imazethapyr 50 g ha-1 as PE fb metribuzin0.3 kg ha-1 as PoE (3.11% and 4.55% during 2013-14 and 2014-15, respectively).It was observed thatat the same level of weed management, theproduction efficiency was increased significantly withincrease in the level of nutrient management from100% to 125% but decreased at 150% RDF. Theproduction efficiency was higher under interaction of125% RDF and pre-emergence application ofmetribuzin 0.4 kg ha-1 + oxyfluorfen 0.3 kg ha-1 with17.53% and 19.89% during 2013-14 and 2014-15,respectively.
The higher agronomic efficiency, productionefficiency and productivity rating index in abovetreatments might be due to higher yield per kg ofnutrients applied.
Nutrient status
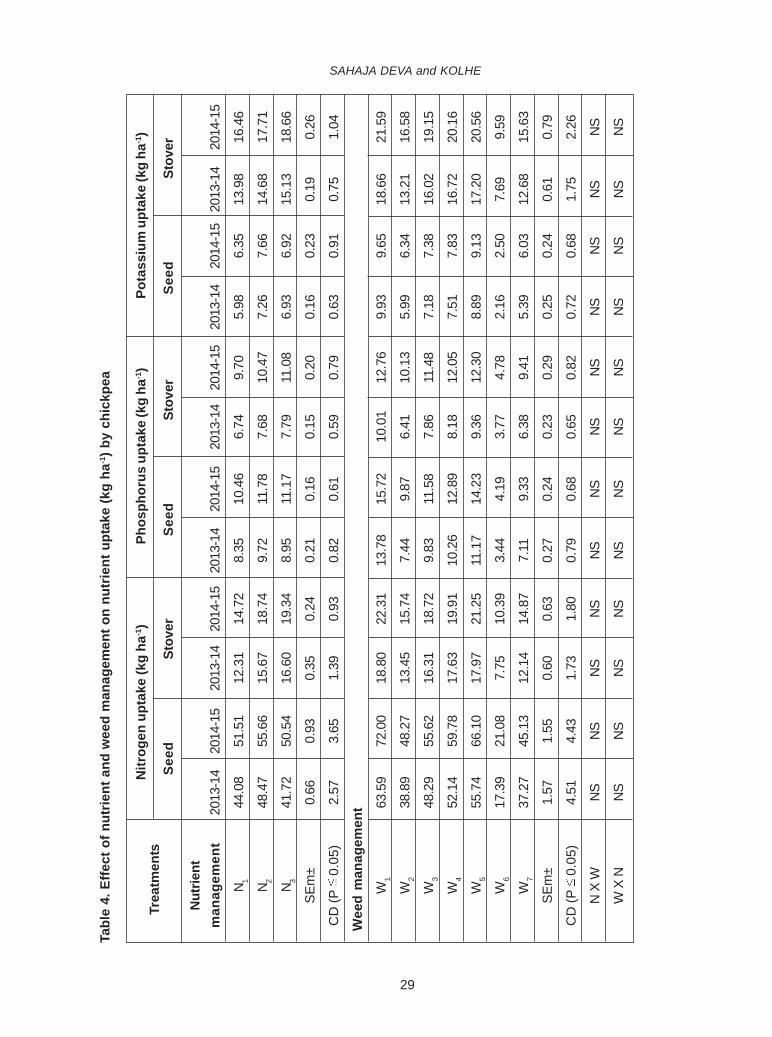
Nutrient uptake by seed and stover
Significant effect of nutrient uptake bychickpea seed and stover was observed due tonutrient management. Higher nutrient uptake by seedwas observed under 125% RDF with nitrogen 48.47
kg ha-1 and 55.66 kg ha-1 during 2013-14 and 2014-15, respectively, phosphorus uptake with 9.72 kgha-1 and 11.78 kg ha-1 during 2013-14 and 2014-15,respectively, potassium uptake with7.26 kg ha-1 and7.66 kg ha-1 during 2013-14 and 2014-15, respectivelyand higher nitrogen uptake by stover i.e. 16.60 kgha-1 and 19.34 kg ha-1 during 2013-14 and 2014-15,respectively, phosphorus uptake with 7.79 kg ha-1
and 11.08 kg ha-1 during 2013-14 and 2014-15,respectively, potassium uptake with 15.13 kg ha-1
and 18.66 kg ha-1 during 2013-14 and 2014-15,respectively was observed under 150% RDF (Table4). The lower nutrient uptake by seed and stover wasunder 150% RDF.
Among weed management practices, allthe herbicide treatments proved significantly superiorto control except Imazethapyr 50 g ha-1as PE fbMetribuzin 0.3 kg ha-1as PoE w.r.t nutrient uptakeby chickpea. Among herbicide treatments,significantly higher nitrogen uptake by seed i.e. 63.59kg ha-1 and 72.00 kg ha-1 during 2013-14 and 2014-15, respectively phosphorus uptake with 13.78 kgha-1 and 15.72 kg ha-1 during 2013-14 and 2014-15,respectively, potassium uptake with 9.93 kg ha-1 and9.65 kg ha-1 during 2013-14 and 2014-15,respectively, nitrogen uptake by stover with 18.8 kgha-1 and 22.31 kg ha-1 during 2013-14 and 2014-15,respectively, phosphorus uptake by stover with 10.01kg ha-1 and 12.76 kg ha-1 during 2013-14 and 2014-15, respectively, potassium uptake by stover with18.66 kg ha-1 and 21.59 kg ha-1 during 2013-14 and2014-15, respectively were found with Metribuzin 0.4kg ha-1+ Oxyfluorfen 0.3 kg ha-1as PE. Minimumuptake of nutrients by seed and stover was observedunder Imazethapyr 50 g ha-1as PE fb Metribuzin 0.3kg ha-1ha as PoE.
Interaction effect of nutrientmanagement and weed management practices onnutrient uptake by chickpea was non-significant.
The higher N, P, K uptake by chickpeaunder various treatments of weed management was
27
SAHAJA DEVA and KOLHE
due to effective control of weeds by these treatmentswhich resulted in lower weed competition lead tovigorous rooting and better nodulation which causeprofuse growth of crop plants and more uptake ofnitrogen and there by more availability of nutrientsto crop. Gautam (1999) reported that nutrient removalof crop significantly enhanced in weed free condition.Kumar et al. (2014) reported that fertilizer levelssignificantly influenced the N, P, K content as wellas their uptake by chickpea seeds and stover.Application of 100% RDF showed highest values forthe N, P, K content and their uptake by chickpeaseeds and stover.
Nutrient status in soil (kg ha-1)
Significant difference was observed innutrient status of soil due to nutrient management(Table 5). Significantly higher nutrient status wasunder 150% RDF with 209.9 kg ha-1and 199 kg ha-1
nitrogen during 2013-14 and 2014-15, respectively;17 kg ha-1 phosphorus and 21 kg ha-1 phosphorusduring 2013-14 and 2014-15, respectively; 300 kgha-1 potassium and 316 kg ha-1 potassium during
2013-14 and 2014-15, respectively (Table 5). Lowernutrient status was under 100% RDF with 194 kgha-1 nitrogen and 185 kg ha-1 nitrogen during 2013-14 and 2014-15, respectively; 15 kg ha-1 phosphorusand 18 kg ha-1 phosphorus during 2013-14 and 2014-15, respectively; 283 kg ha-1 potassium and 298 kgha-1 potassium during 2013-14 and 2014-15,respectively.
Among weed management practices,nitrogen content i.e. 220 kg ha-1 and 209 kg ha-1
during 2013-14 and 2014-15, respectively were higherwith (Pendimethalin 30 % EC + Imazethapyr 2%)1.0 kg ha-1as PE. Phosphorus content of 23 kg ha-1
and 26 kg ha-1 during 2013-14 and 2014-15,respectively were higher with Imazethapyr 50 gha-1as PE fb Metribuzin 0.3 kg ha-1as PoE andpotassium content i.e. 315 kg ha-1 and 335 kg ha-1
during 2013-14 and 2014-15, respectively were higherwith Imazethapyr 50 g ha-1as PE fb Metribuzin 0.3kg ha-1as PoE. The lower nutrient status was underControl. Trimurtulu et al. (2015) from Guntur reportedthat nutrient status in soil was the highest in plot
Table 2. Interaction effect of nutrient and weed management on seed yield of chickpea
N1 N2 N3
2013-14 2014-15 2013-14 2014-15 2013-14 2014-15
W1 1985 2200 2051 2307 1832 2023
W2 1245 1513 1444 1721 1201 1487
W3 1526 1766 1701 1907 1497 1720
W4 1656 1916 1705 1976 1628 1861
W5 1785 2107 1820 2200 1636 1868
W6 467 682 640 807 997 1033
W7 1223 1457 1351 1604 1180 1453
SEm± CD (P 0.05)
2 W at same N 0.72 0.59 2.08 1.69
2 N at same W 0.74 0.64 2.27 2.03
Nutrientmanagement /
Weedmanagement
Seed yield (kg ha-1)
28
Tabl
e 3.
Inte
ract
ion
effe
ct o
f nut
rient
and
wee
d m
anag
emen
t on
agro
nom
ic e
ffici
ency
and
pro
duct
ion
effic
ienc
y of
chi
ckpe
aEFFECT OF NUTRIENT AND WEED MANAGEMENT IN CHICKPEA
N1
N2
N
3
N
1
N2
N
3
2013
-14
2014
-15
2013
-14
2014
-15
2013
-14
2014
-15
2013
-14
2014
-15
2013
-14
2014
-15
2013
-14
2014
-15
W1
19.8
522
.00
16.4
118
.45
12.2
113
.48
16.9
718
.97
17.5
319
.89
15.6
617
.44
W2
12.4
515
.13
11.5
513
.77
8.01
9.92
10.6
413
.04
12.3
414
.83
10.2
712
.82
W3
15.2
617
.66
13.6
115
.26
9.98
11.4
713
.05
15.2
214
.54
16.4
412
.79
14.8
3
W4
16.5
619
.16
13.6
415
.81
10.8
512
.41
14.1
516
.52
14.5
817
.03
13.9
116
.05
W5
17.8
521
.07
14.5
617
.60
10.9
112
.45
15.2
618
.17
15.5
518
.97
13.9
816
.10
W6
3.11
4.55
5.12
6.46
9.97
10.3
33.
995.
885.
476.
968.
528.
91
W7
12.2
314
.57
10.8
112
.83
7.87
9.68
10.4
512
.56
11.5
413
.83
10.0
912
.52
SEm
±C
D (P
0
.05)
SEm
±C
D (P
0
.05)
2 W
at s
ame
N0.
550.
571.
571.
630.
620.
511.
781.
46
2 N
at s
ame
W0.
550.
611.
651.
900.
630.
551.
941.
75
Nut
rient
man
agem
ent
/w
eed
man
agem
ent
Agr
onom
ic e
ffici
ency
(Yie
ld k
g-1 n
utrie
nt)
Prod
uctio
n ef
ficie
ncy
(kg
ha-1 d
ay-1)
29
SAHAJA DEVA and KOLHE
Tabl
e 4.
Effe
ct o
f nut
rient
and
wee
d m
anag
emen
t on
nutr
ient
upt
ake
(kg
ha-1) b
y ch
ickp
ea
Nut
rient
man
agem
ent
2013
-14
2014
-15
2013
-14
2014
-15
2013
-14
2014
-15
2013
-14
2014
-15
2013
-14
2014
-15
2013
-14
2014
-15
N 144
.08
51.5
112
.31
14.7
28.
3510
.46
6.74
9.70
5.98
6.35
13.9
816
.46
N 248
.47
55.6
615
.67
18.7
49.
7211
.78
7.68
10.4
77.
267.
6614
.68
17.7
1
N 341
.72
50.5
416
.60
19.3
48.
9511
.17
7.79
11.0
86.
936.
9215
.13
18.6
6
SEm
±0.
660.
930.
350.
240.
210.
160.
150.
200.
160.
230.
190.
26
CD
(P
0.0
5)2.
573.
651.
390.
930.
820.
610.
590.
790.
630.
910.
751.
04
W
eed
man
agem
ent
W1
63.5
972
.00
18.8
022
.31
13.7
815
.72
10.0
112
.76
9.93
9.65
18.6
621
.59
W2
38.8
948
.27
13.4
515
.74
7.44
9.87
6.41
10.1
35.
996.
3413
.21
16.5
8
W3
48.2
955
.62
16.3
118
.72
9.83
11.5
87.
8611
.48
7.18
7.38
16.0
219
.15
W4
52.1
459
.78
17.6
319
.91
10.2
612
.89
8.18
12.0
57.
517.
8316
.72
20.1
6
W5
55.7
466
.10
17.9
721
.25
11.1
714
.23
9.36
12.3
08.
899.
1317
.20
20.5
6
W6
17.3
921
.08
7.75
10.3
93.
444.
193.
774.
782.
162.
507.
699.
59
W7
37.2
745
.13
12.1
414
.87
7.11
9.33
6.38
9.41
5.39
6.03
12.6
815
.63
SEm
±1.
571.
550.
600.
630.
270.
240.
230.
290.
250.
240.
610.
79
CD
(P
0.0
5)4.
514.
431.
731.
800.
790.
680.
650.
820.
720.
681.
752.
26
N X
WN
SN
SN
SN
SN
SN
SN
SN
SN
SN
SN
SN
S
W X
NN
SN
SN
SN
SN
SN
SN
SN
SN
SN
SN
SN
S
Trea
tmen
tsN
itrog
en u
ptak
e (k
g ha
-1)
Phos
phor
us u
ptak
e (k
g ha
-1)
Pota
ssiu
m u
ptak
e (k
g ha
-1)
Seed
Stov
erSe
edSt
over
Seed
Stov
er
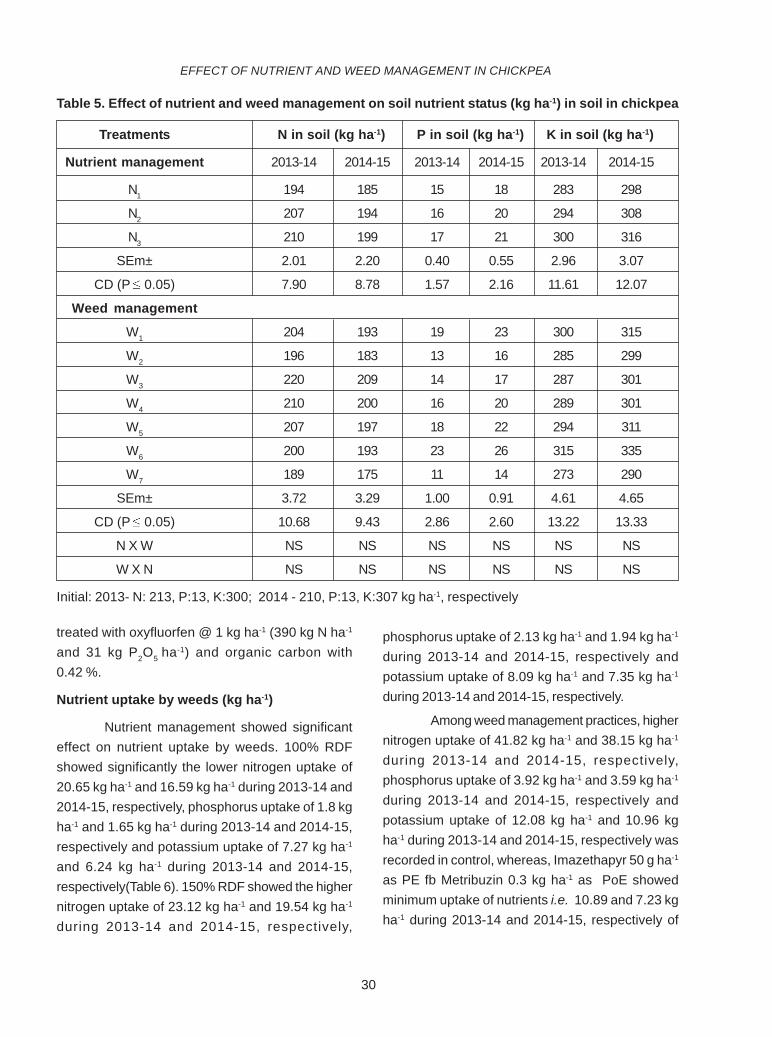
30
Table 5. Effect of nutrient and weed management on soil nutrient status (kg ha-1) in soil in chickpea
Treatments N in soil (kg ha-1) P in soil (kg ha-1) K in soil (kg ha-1)
Nutrient management 2013-14 2014-15 2013-14 2014-15 2013-14 2014-15
N1 194 185 15 18 283 298
N2 207 194 16 20 294 308
N3 210 199 17 21 300 316
SEm± 2.01 2.20 0.40 0.55 2.96 3.07
CD (P 0.05) 7.90 8.78 1.57 2.16 11.61 12.07
Weed management
W1 204 193 19 23 300 315
W2 196 183 13 16 285 299
W3 220 209 14 17 287 301
W4 210 200 16 20 289 301
W5 207 197 18 22 294 311
W6 200 193 23 26 315 335
W7 189 175 11 14 273 290
SEm± 3.72 3.29 1.00 0.91 4.61 4.65
CD (P 0.05) 10.68 9.43 2.86 2.60 13.22 13.33
N X W NS NS NS NS NS NS
W X N NS NS NS NS NS NS
Initial: 2013- N: 213, P:13, K:300; 2014 - 210, P:13, K:307 kg ha-1, respectively
EFFECT OF NUTRIENT AND WEED MANAGEMENT IN CHICKPEA
treated with oxyfluorfen @ 1 kg ha-1 (390 kg N ha-1
and 31 kg P2O5 ha-1) and organic carbon with0.42 %.
Nutrient uptake by weeds (kg ha-1)
Nutrient management showed significanteffect on nutrient uptake by weeds. 100% RDFshowed significantly the lower nitrogen uptake of20.65 kg ha-1 and 16.59 kg ha-1 during 2013-14 and2014-15, respectively, phosphorus uptake of 1.8 kgha-1 and 1.65 kg ha-1 during 2013-14 and 2014-15,respectively and potassium uptake of 7.27 kg ha-1
and 6.24 kg ha-1 during 2013-14 and 2014-15,respectively(Table 6). 150% RDF showed the highernitrogen uptake of 23.12 kg ha-1 and 19.54 kg ha-1
during 2013-14 and 2014-15, respectively,
phosphorus uptake of 2.13 kg ha-1 and 1.94 kg ha-1
during 2013-14 and 2014-15, respectively andpotassium uptake of 8.09 kg ha-1 and 7.35 kg ha-1
during 2013-14 and 2014-15, respectively.
Among weed management practices, highernitrogen uptake of 41.82 kg ha-1 and 38.15 kg ha-1
during 2013-14 and 2014-15, respectively,phosphorus uptake of 3.92 kg ha-1 and 3.59 kg ha-1
during 2013-14 and 2014-15, respectively andpotassium uptake of 12.08 kg ha-1 and 10.96 kgha-1 during 2013-14 and 2014-15, respectively wasrecorded in control, whereas, Imazethapyr 50 g ha-1
as PE fb Metribuzin 0.3 kg ha-1 as PoE showedminimum uptake of nutrients i.e. 10.89 and 7.23 kgha-1 during 2013-14 and 2014-15, respectively of
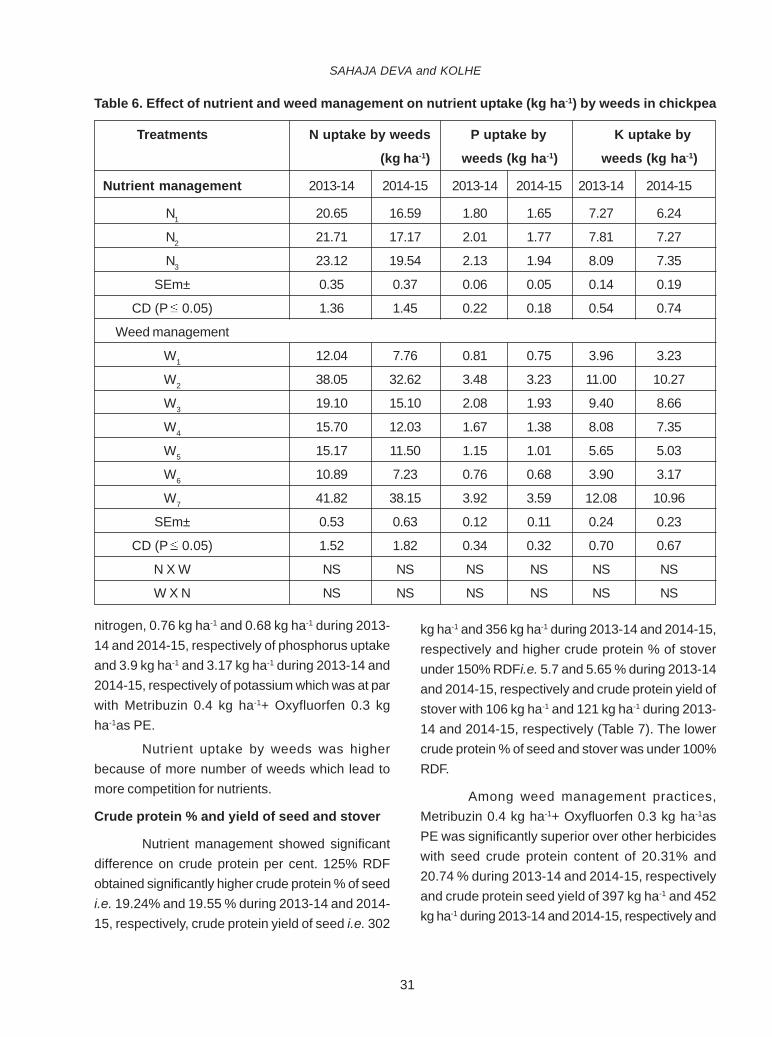
31
SAHAJA DEVA and KOLHE
Table 6. Effect of nutrient and weed management on nutrient uptake (kg ha-1) by weeds in chickpea
Treatments N uptake by weeds P uptake by K uptake by
(kg ha-1) weeds (kg ha-1) weeds (kg ha-1)
Nutrient management 2013-14 2014-15 2013-14 2014-15 2013-14 2014-15
N1 20.65 16.59 1.80 1.65 7.27 6.24
N2 21.71 17.17 2.01 1.77 7.81 7.27
N3 23.12 19.54 2.13 1.94 8.09 7.35
SEm± 0.35 0.37 0.06 0.05 0.14 0.19
CD (P 0.05) 1.36 1.45 0.22 0.18 0.54 0.74
Weed management
W1 12.04 7.76 0.81 0.75 3.96 3.23
W2 38.05 32.62 3.48 3.23 11.00 10.27
W3 19.10 15.10 2.08 1.93 9.40 8.66
W4 15.70 12.03 1.67 1.38 8.08 7.35
W5 15.17 11.50 1.15 1.01 5.65 5.03
W6 10.89 7.23 0.76 0.68 3.90 3.17
W7 41.82 38.15 3.92 3.59 12.08 10.96
SEm± 0.53 0.63 0.12 0.11 0.24 0.23
CD (P 0.05) 1.52 1.82 0.34 0.32 0.70 0.67
N X W NS NS NS NS NS NS
W X N NS NS NS NS NS NS
nitrogen, 0.76 kg ha-1 and 0.68 kg ha-1 during 2013-14 and 2014-15, respectively of phosphorus uptakeand 3.9 kg ha-1 and 3.17 kg ha-1 during 2013-14 and2014-15, respectively of potassium which was at parwith Metribuzin 0.4 kg ha-1+ Oxyfluorfen 0.3 kgha-1as PE.
Nutrient uptake by weeds was higherbecause of more number of weeds which lead tomore competition for nutrients.
Crude protein % and yield of seed and stover
Nutrient management showed significantdifference on crude protein per cent. 125% RDFobtained significantly higher crude protein % of seedi.e. 19.24% and 19.55 % during 2013-14 and 2014-15, respectively, crude protein yield of seed i.e. 302
kg ha-1 and 356 kg ha-1 during 2013-14 and 2014-15,respectively and higher crude protein % of stoverunder 150% RDFi.e. 5.7 and 5.65 % during 2013-14and 2014-15, respectively and crude protein yield ofstover with 106 kg ha-1 and 121 kg ha-1 during 2013-14 and 2014-15, respectively (Table 7). The lowercrude protein % of seed and stover was under 100%RDF.
Among weed management practices,Metribuzin 0.4 kg ha-1+ Oxyfluorfen 0.3 kg ha-1asPE was significantly superior over other herbicideswith seed crude protein content of 20.31% and20.74 % during 2013-14 and 2014-15, respectivelyand crude protein seed yield of 397 kg ha-1 and 452kg ha-1 during 2013-14 and 2014-15, respectively and
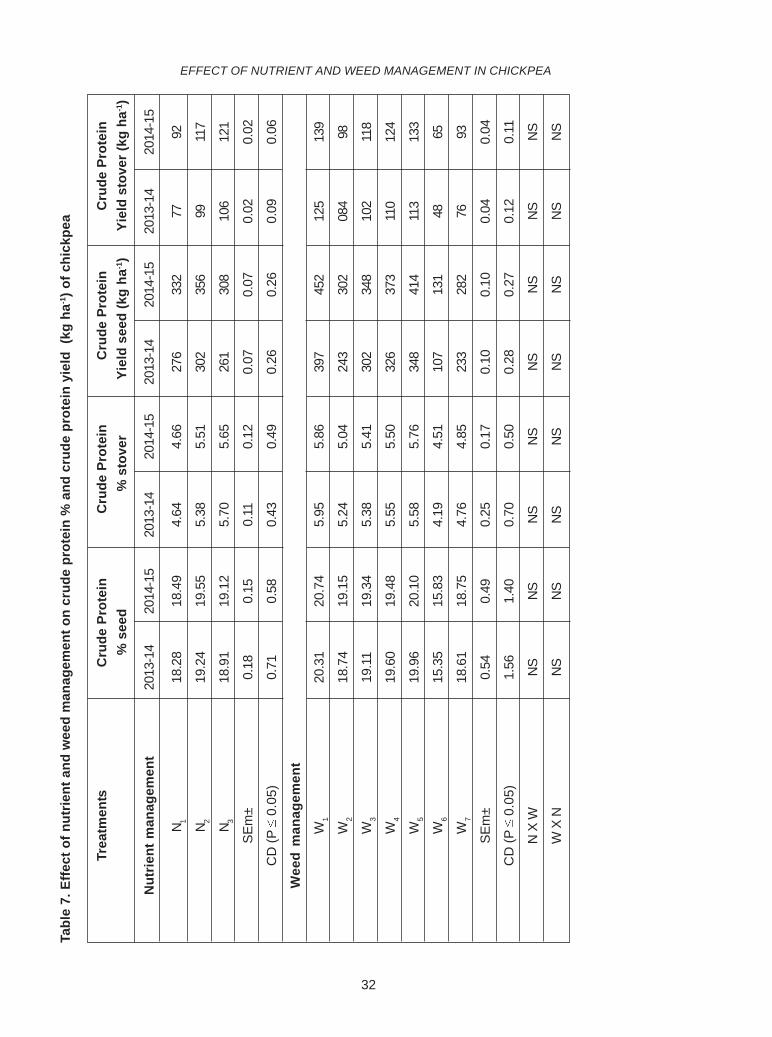
32
Tabl
e 7.
Effe
ct o
f nut
rient
and
wee
d m
anag
emen
t on
crud
e pr
otei
n %
and
cru
de p
rote
in y
ield
(kg
ha-1
) of c
hick
pea
Trea
tmen
ts
Cru
de P
rote
in
Cru
de P
rote
in
Cru
de P
rote
in
Cru
de P
rote
in
%
see
d
% s
tove
r
Yi
eld
seed
(kg
ha-1)
Y
ield
sto
ver (
kg h
a-1)
Nut
rient
man
agem
ent
2013
-14
2014
-15
2013
-14
2014
-15
2013
-14
2014
-15
2013
-14
2014
-15
N 118
.28
18.4
94.
644.
6627
633
277
92
N 219
.24
19.5
55.
385.
5130
235
699
117
N 318
.91
19.1
25.
705.
6526
130
810
612
1
SEm
±0.
180.
150.
110.
120.
070.
070.
020.
02
CD
(P
0.0
5)0.
710.
580.
430.
490.
260.
260.
090.
06
Wee
d m
anag
emen
t
W1
20.3
120
.74
5.95
5.86
397
452
125
139
W2
18.7
419
.15
5.24
5.04
243
302
084
98
W3
19.1
119
.34
5.38
5.41
302
348
102
118
W4
19.6
019
.48
5.55
5.50
326
373
110
124
W5
19.9
620
.10
5.58
5.76
348
414
113
133
W6
15.3
515
.83
4.19
4.51
107
131
4865
W7
18.6
118
.75
4.76
4.85
233
282
7693
SEm
±0.
540.
490.
250.
170.
100.
100.
040.
04
CD
(P
0.0
5)1.
561.
400.
700.
500.
280.
270.
120.
11
N X
WN
SN
SN
SN
SN
SN
SN
SN
S
W X
NN
SN
SN
SN
SN
SN
SN
SN
S
EFFECT OF NUTRIENT AND WEED MANAGEMENT IN CHICKPEA
33
SAHAJA DEVA and KOLHE
crude protein % of stover i.e. 5.95% and 5.86 %during 2013-14 and 2014-15, respectively and crudeprotein yield of stover i.e. 125 kg ha-1 and 139 kgha-1 during 2013-14 and 2014-15, respectively. Thelower crude protein % of seed and stover was underImazethapyr 50 g ha-1as PE fb Metribuzin 0.3 kgha-1 as PoE.
Increased crude protein per cent might bedue to the higher uptake of nitrogen. Crude proteinyield is directly related to crude protein percent andyield. Increased crude protein yield might be due tothe higher uptake of nitrogen and higher yield.
CONCLUSION
It was recorded that 125% RDF was the bestin enhancing seed yield, nutrient uptake by seed,crude protein yield and production efficiency.Whereas, 150% RDF was the best w.r.t stover yieldand nutrient uptake by stover. It was observed that100% RDF was the best in agronomic efficiency.Among weed management practices, metribuzin 0.4kg ha-1+ oxyfluorfen 0.3 kg ha-1as PE was observedas best treatment in enhancing yield, nutrient uptakeby seed and stover, crude protein yield and efficiency.Further, 125% RDF with metribuzin 0.4 kg ha-1 +oxyfluorfen 0.3 kg ha-1as PE is the best practicerecommended.
ACKNOWLEDEMENT
Financial support by DST-INSPIRE is dulyacknowledged.
REFERENCES
Directorate of Economics and Statistics. 2016.Agricultural statistics at a glance.Directorate of Economics and Statistics,Ministry of Agriculture, Government of India,New Delhi.
Gautam, 1999. Influence of cultivars, sowing datesand weed management practices on weedgrowth and chickpea yield. The EighthBiennial Conference of the Indian Societyof Weed Science. Banaras HinduUniversity, Varanasi held from Feb 5th-7th,1999. pp. 58.
Gomez, K.A and Gomez, A.A. 1984. Statisticalprocedures for agricultural research. AWilley International Science Publication.John Willey & Sons, New York.
Kadam, C.S., Thanki, J.D and Gudadhe, N.N. 2014.Response of chickpea to irrigation methods,fertilizers and biofertilizer under SouthGujarat condition. Indian Journal ofFertilizers. 10(4): 20-24.
34
INTRODUCTION
Rice (Oryza sativa L.) has shaped thecultures, diets and economics of billions of peopleliving in Asia. Global demand for food is rising becauseof population growth, increasing affluence andchanging dietary habits (Chowdhury et al., 2016). Tomeet this demand, the global food production needsincrease by over 40 per cent by 2030 and 70 percent by 2050.
The poorest families in developing countriesspend about 50%- 80% of their income on food,depend heavily on low cost, high energy, starchystaples such as rice which contains insufficientamounts of nutrients such as iron, zinc and proteinto provide recommended daily intake for humanbeings (Dharwal et al., 2017). However, as with manyother staple food crops, rice contains low levels ofproteins and important micronutrients. Hence,producing enough food energy to maintain the world’spopulation is not enough. Along with the high yieldingrice varieties, preference to fine grain and highnutritional quality genotypes reduces malnutrition.Considering the above factors, the research was
EVALUATION OF RICE (Oryza sativa L.) GENOTYPES FORGRAIN YIELD, YIELD COMPONENTS AND NUTRITIONAL TRAITS FOR SCARCE
RAINFALL ZONE OF ANDHRA PRADESH
R.S. ARCHANA*, M. SUDHA RANI, K.M. VISHNU VARDHAN and G. FAREEDADepartment of Genetics and Plant Breeding, Agricultural College,Acharya N.G. Ranga Agricultural University, Mahanandi – 518 503
Date of Receipt: 08.06.2018 Date of Acceptance: 30.07.2018
ABSTRACTThirty-eight selected rice genotypes were grown during Kharif, 2017 in order to evaluate the performance of elite
accessions of rice for 17 characters. The experiment was laid out in randomized complete block design with three replications.Analysis of variance for all quantitative and qualitative traits showed that mean sum of squares due to genotypes was highlysignificant for all characters studied. Among the tested genotypes, MTU 1064 was found to be the best as it excelled for grainyield, panicle length, 1000 grain weight, harvest index and protein content followed by MTU 1081, PD 10 and NLR 4002 which arethe slender grain types and found to have superior grain quality features and nutritional traits, apart from having high yieldpotential. High iron content was found in MTU 1031. Whereas, PLA 1100 had maximum zinc content which has proven its suitabilityfor utilization in breeding programmes to develop Zn fortified rice.
J.Res. ANGRAU 46(3) 34-40, 2018
*Corresponding Author E-mail: [email protected]
undertaken to study the per se performance ofagronomic, quality and nutritional traits in thirty - eightrice genotypes.
MATERIAL AND METHODS
The experiment was conducted at the CollegeFarm of Agricultural College, Mahanandi duringKharif, 2017. The genotypes were sown in rowsspaced at 20 cm apart with intra row spacing of 15cm with three replications each. The recommendeddoses of fertilizer i.e. 240 kg ha-1 N in the form ofUrea; 80 kg ha-1 P2O5 in the form of single superphosphate (SSP) and 80 kg ha-1 K2O in the form ofmuriate of potash (MOP) was applied. All necessarymeasures were taken to control pest and diseaseinfestation. Analysis of variance and meanperformance of genotypes was carried out formorphological and nutritional traits viz., days to 50per cent flowering, days to maturity, plant height (cm),number of productive tillers plant-1, panicle length(cms), panicle weight (g), number of filled spikeletspanicle-1, kernel length (mm), kernel breadth (mm),kernel L/B ratio (L/B), 1000 grain weight (g), harvest
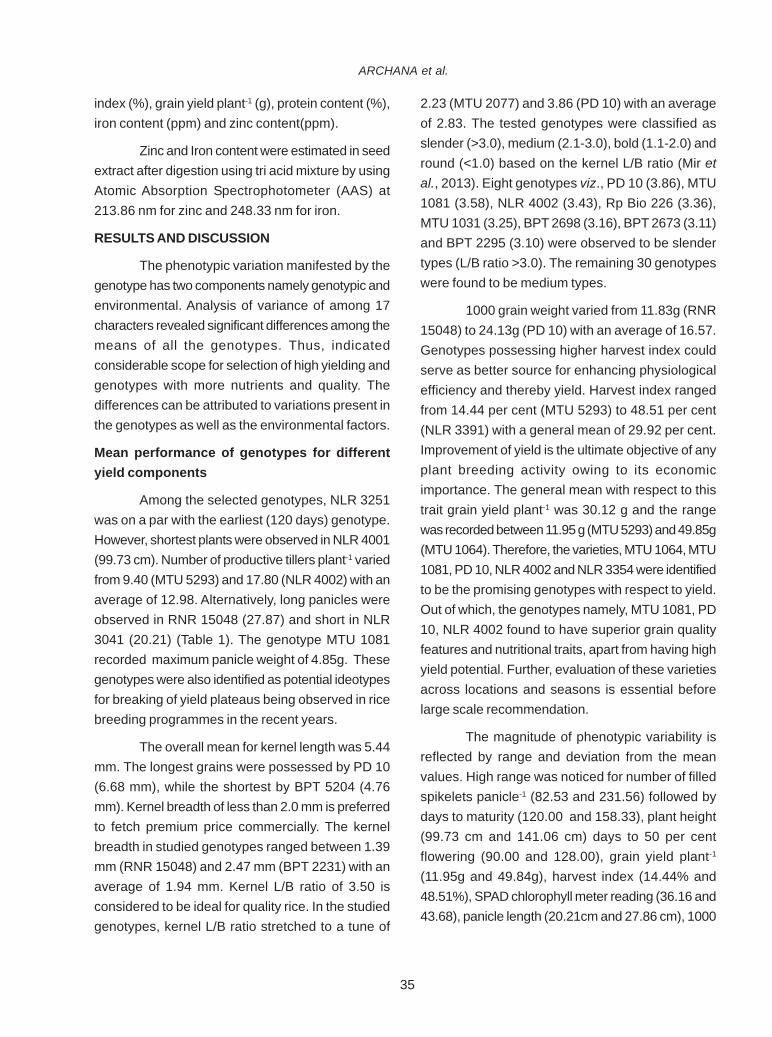
35
index (%), grain yield plant-1 (g), protein content (%),iron content (ppm) and zinc content(ppm).
Zinc and Iron content were estimated in seedextract after digestion using tri acid mixture by usingAtomic Absorption Spectrophotometer (AAS) at213.86 nm for zinc and 248.33 nm for iron.
RESULTS AND DISCUSSION
The phenotypic variation manifested by thegenotype has two components namely genotypic andenvironmental. Analysis of variance of among 17characters revealed significant differences among themeans of all the genotypes. Thus, indicatedconsiderable scope for selection of high yielding andgenotypes with more nutrients and quality. Thedifferences can be attributed to variations present inthe genotypes as well as the environmental factors.
Mean performance of genotypes for differentyield components
Among the selected genotypes, NLR 3251was on a par with the earliest (120 days) genotype.However, shortest plants were observed in NLR 4001(99.73 cm). Number of productive tillers plant-1 variedfrom 9.40 (MTU 5293) and 17.80 (NLR 4002) with anaverage of 12.98. Alternatively, long panicles wereobserved in RNR 15048 (27.87) and short in NLR3041 (20.21) (Table 1). The genotype MTU 1081recorded maximum panicle weight of 4.85g. Thesegenotypes were also identified as potential ideotypesfor breaking of yield plateaus being observed in ricebreeding programmes in the recent years.
The overall mean for kernel length was 5.44mm. The longest grains were possessed by PD 10(6.68 mm), while the shortest by BPT 5204 (4.76mm). Kernel breadth of less than 2.0 mm is preferredto fetch premium price commercially. The kernelbreadth in studied genotypes ranged between 1.39mm (RNR 15048) and 2.47 mm (BPT 2231) with anaverage of 1.94 mm. Kernel L/B ratio of 3.50 isconsidered to be ideal for quality rice. In the studiedgenotypes, kernel L/B ratio stretched to a tune of
2.23 (MTU 2077) and 3.86 (PD 10) with an averageof 2.83. The tested genotypes were classified asslender (>3.0), medium (2.1-3.0), bold (1.1-2.0) andround (<1.0) based on the kernel L/B ratio (Mir etal., 2013). Eight genotypes viz., PD 10 (3.86), MTU1081 (3.58), NLR 4002 (3.43), Rp Bio 226 (3.36),MTU 1031 (3.25), BPT 2698 (3.16), BPT 2673 (3.11)and BPT 2295 (3.10) were observed to be slendertypes (L/B ratio >3.0). The remaining 30 genotypeswere found to be medium types.
1000 grain weight varied from 11.83g (RNR15048) to 24.13g (PD 10) with an average of 16.57.Genotypes possessing higher harvest index couldserve as better source for enhancing physiologicalefficiency and thereby yield. Harvest index rangedfrom 14.44 per cent (MTU 5293) to 48.51 per cent(NLR 3391) with a general mean of 29.92 per cent.Improvement of yield is the ultimate objective of anyplant breeding activity owing to its economicimportance. The general mean with respect to thistrait grain yield plant-1 was 30.12 g and the rangewas recorded between 11.95 g (MTU 5293) and 49.85g(MTU 1064). Therefore, the varieties, MTU 1064, MTU1081, PD 10, NLR 4002 and NLR 3354 were identifiedto be the promising genotypes with respect to yield.Out of which, the genotypes namely, MTU 1081, PD10, NLR 4002 found to have superior grain qualityfeatures and nutritional traits, apart from having highyield potential. Further, evaluation of these varietiesacross locations and seasons is essential beforelarge scale recommendation.
The magnitude of phenotypic variability isreflected by range and deviation from the meanvalues. High range was noticed for number of filledspikelets panicle-1 (82.53 and 231.56) followed bydays to maturity (120.00 and 158.33), plant height(99.73 cm and 141.06 cm) days to 50 per centflowering (90.00 and 128.00), grain yield plant-1
(11.95g and 49.84g), harvest index (14.44% and48.51%), SPAD chlorophyll meter reading (36.16 and43.68), panicle length (20.21cm and 27.86 cm), 1000
ARCHANA et al.
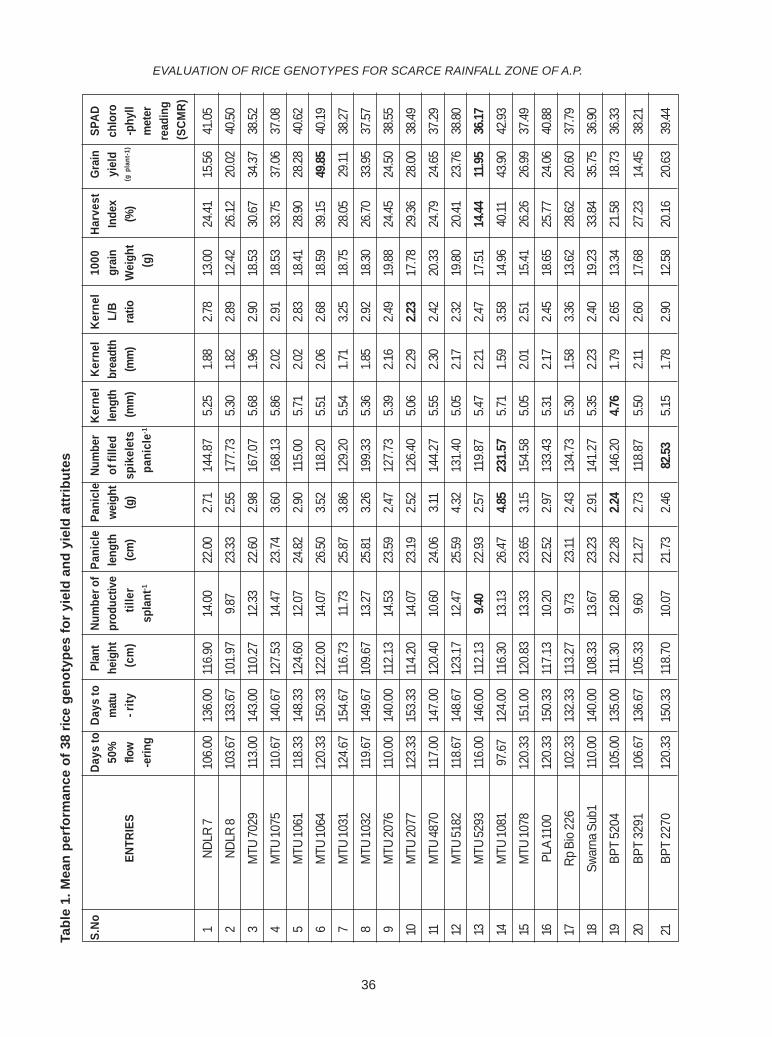
36
Tabl
e 1.
Mea
n pe
rfor
man
ce o
f 38
rice
geno
type
s fo
r yie
ld a
nd y
ield
attr
ibut
es
S.N
oDa
ys to
Days
toPl
ant
Num
ber o
fPa
nicl
ePa
nicl
eNu
mbe
rKe
rnel
Kern
elKe
rnel
1000
Harv
est
Grai
nSP
AD50
%m
atu
heig
htpr
oduc
tive
leng
thwe
ight
of fi
lled
leng
thbr
eadt
hL/
Bgr
ain
Inde
xyi
eld
chlo
roEN
TRIE
Sflo
w- r
ity (
cm)
till
er(c
m)
(g)
spik
elet
s (m
m)
(mm
)ra
tioW
eigh
t(%
)(g
pla
nt-1
)-p
hyll
-erin
gsp
lant
-1
pani
cle-1
(g)
met
erre
adin
g (S
CMR)
1ND
LR 7
106.
0013
6.00
116.
9014
.0022
.002.7
114
4.87
5.25
1.88
2.78
13.00
24.41
15.56
41.05
2ND
LR 8
103.
6713
3.67
101.
979.8
723
.332.5
517
7.73
5.30
1.82
2.89
12.42
26.12
20.02
40.50
3M
TU 70
2911
3.00
143.
0011
0.27
12.33
22.60
2.98
167.
075.6
81.9
62.9
018
.5330
.6734
.3738
.52
4M
TU 10
7511
0.67
140.
6712
7.53
14.47
23.74
3.60
168.
135.8
62.0
22.9
118
.5333
.7537
.0637
.08
5M
TU 10
6111
8.33
148.
3312
4.60
12.07
24.82
2.90
115.0
05.7
12.0
22.8
318
.4128
.9028
.2840
.62
6M
TU 10
6412
0.33
150.
3312
2.00
14.07
26.50
3.52
118.2
05.5
12.0
62.6
818
.5939
.1549
.8540
.19
7M
TU 10
3112
4.67
154.
6711
6.73
11.73
25.87
3.86
129.
205.5
41.7
13.2
518
.7528
.0529
.1138
.27
8M
TU 10
3211
9.67
149.
6710
9.67
13.27
25.81
3.26
199.
335.3
61.8
52.9
218
.3026
.7033
.9537
.57
9M
TU 20
7611
0.00
140.
0011
2.13
14.53
23.59
2.47
127.
735.3
92.1
62.4
919
.8824
.4524
.5038
.55
10M
TU 20
7712
3.33
153.
3311
4.20
14.07
23.19
2.52
126.
405.0
62.2
92.2
317
.7829
.3628
.0038
.49
11M
TU 48
7011
7.00
147.
0012
0.40
10.60
24.06
3.11
144.
275.5
52.3
02.4
220
.3324
.7924
.6537
.29
12M
TU 51
8211
8.67
148.
6712
3.17
12.47
25.59
4.32
131.
405.0
52.1
72.3
219
.8020
.4123
.7638
.80
13M
TU 52
9311
6.00
146.
0011
2.13
9.40
22.93
2.57
119.8
75.4
72.2
12.4
717
.5114
.4411
.9536
.1714
MTU
1081
97.67
124.
0011
6.30
13.13
26.47
4.85
231.5
75.7
11.5
93.5
814
.9640
.1143
.9042
.93
15M
TU 10
7812
0.33
151.
0012
0.83
13.33
23.65
3.15
154.
585.0
52.0
12.5
115
.4126
.2626
.9937
.49
16PL
A 11
0012
0.33
150.
3311
7.13
10.20
22.52
2.97
133.
435.3
12.1
72.4
518
.6525
.7724
.0640
.88
17Rp
Bio
226
102.
3313
2.33
113.
279.7
323
.112.4
313
4.73
5.30
1.58
3.36
13.62
28.62
20.60
37.79
18Sw
arna
Sub
111
0.00
140.
0010
8.33
13.67
23.23
2.91
141.
275.3
52.2
32.4
019
.2333
.8435
.7536
.90
19BP
T 52
0410
5.00
135.
0011
1.30
12.80
22.28
2.24
146.
204.7
61.7
92.6
513
.3421
.5818
.7336
.33
20BP
T 32
9110
6.67
136.
6710
5.33
9.60
21.27
2.73
118.8
75.5
02.1
12.6
017
.6827
.2314
.4538
.21
21BP
T 22
7012
0.33
150.
3311
8.70
10.07
21.73
2.46
82.53
5.15
1.78
2.90
12.58
20.16
20.63
39.44
EVALUATION OF RICE GENOTYPES FOR SCARCE RAINFALL ZONE OF A.P.
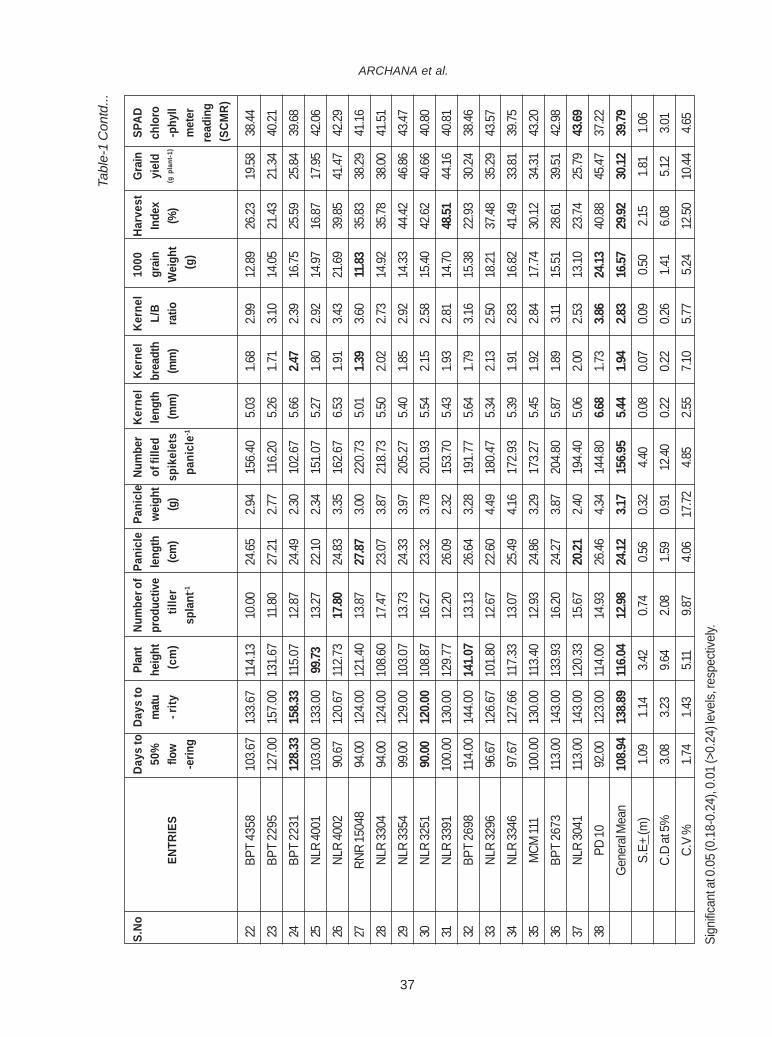
37
S.N
oDa
ys to
Days
toPl
ant
Num
ber o
fPa
nicl
ePa
nicl
eNu
mbe
rKe
rnel
Kern
elKe
rnel
1000
Harv
est
Grai
nSP
AD50
%m
atu
heig
htpr
oduc
tive
leng
thwe
ight
of fi
lled
leng
thbr
eadt
hL/
Bgr
ain
Inde
xyi
eld
chlo
roEN
TRIE
Sflo
w- r
ity (
cm)
till
er(c
m)
(g)
spik
elet
s (m
m)
(mm
)ra
tioW
eigh
t(%
)(g
pla
nt-1
)-p
hyll
-erin
gsp
lant
-1
pani
cle-1
(g)
met
erre
adin
g (S
CMR)
22BP
T 43
5810
3.67
133.
6711
4.13
10.00
24.65
2.94
156.
405.0
31.6
82.9
912
.8926
.2319
.5838
.4423
BPT
2295
127.
0015
7.00
131.
6711
.8027
.212.7
711
6.20
5.26
1.71
3.10
14.05
21.43
21.34
40.21
24BP
T 22
3112
8.33
158.3
311
5.07
12.87
24.49
2.30
102.
675.6
62.4
72.3
916
.7525
.5925
.8439
.6825
NLR
4001
103.
0013
3.00
99.73
13.27
22.10
2.34
151.
075.2
71.8
02.9
214
.9716
.8717
.9542
.0626
NLR
4002
90.67
120.
6711
2.73
17.80
24.83
3.35
162.
676.5
31.9
13.4
321
.6939
.8541
.4742
.2927
RNR
1504
894
.0012
4.00
121.
4013
.8727
.873.0
022
0.73
5.01
1.39
3.60
11.83
35.83
38.29
41.16
28NL
R 33
0494
.0012
4.00
108.
6017
.4723
.073.8
721
8.73
5.50
2.02
2.73
14.92
35.78
38.00
41.51
29NL
R 33
5499
.0012
9.00
103.
0713
.7324
.333.9
720
5.27
5.40
1.85
2.92
14.33
44.42
46.86
43.47
30NL
R 32
5190
.0012
0.00
108.
8716
.2723
.323.7
820
1.93
5.54
2.15
2.58
15.40
42.62
40.66
40.80
31NL
R 33
9110
0.00
130.
0012
9.77
12.20
26.09
2.32
153.
705.4
31.9
32.8
114
.7048
.5144
.1640
.8132
BPT
2698
114.
0014
4.00
141.0
713
.1326
.643.2
819
1.77
5.64
1.79
3.16
15.38
22.93
30.24
38.46
33NL
R 32
9696
.6712
6.67
101.
8012
.6722
.604.4
918
0.47
5.34
2.13
2.50
18.21
37.48
35.29
43.57
34NL
R 33
4697
.6712
7.66
117.
3313
.0725
.494.1
617
2.93
5.39
1.91
2.83
16.82
41.49
33.81
39.75
35M
CM 11
110
0.00
130.
0011
3.40
12.93
24.86
3.29
173.
275.4
51.9
22.8
417
.7430
.1234
.3143
.2036
BPT
2673
113.
0014
3.00
133.
9316
.2024
.273.8
720
4.80
5.87
1.89
3.11
15.51
28.61
39.51
42.98
37NL
R 30
4111
3.00
143.
0012
0.33
15.67
20.21
2.40
194.
405.0
62.0
02.5
313
.1023
.7425
.7943
.6938
PD 10
92.00
123.
0011
4.00
14.93
26.46
4.34
144.
806.6
81.7
33.8
624
.1340
.8845
.4737
.22G
ener
al M
ean
108.9
413
8.89
116.0
412
.9824
.123.1
715
6.95
5.44
1.94
2.83
16.57
29.92
30.12
39.79
S.E+
(m)
1.09
1.14
3.42
0.74
0.56
0.32
4.40
0.08
0.07
0.09
0.50
2.15
1.81
1.06
C.D
at 5%
3.08
3.23
9.64
2.08
1.59
0.91
12.40
0.22
0.22
0.26
1.41
6.08
5.12
3.01
C.V
%1.7
41.4
35.1
19.8
74.0
617
.724.8
52.5
57.1
05.7
75.2
412
.5010
.444.6
5
Sign
ifican
t at 0
.05
(0.1
8-0.
24),
0.01
(>0.
24) le
vels,
resp
ectiv
ely.
ARCHANA et al.
Tabl
e-1
Con
td...
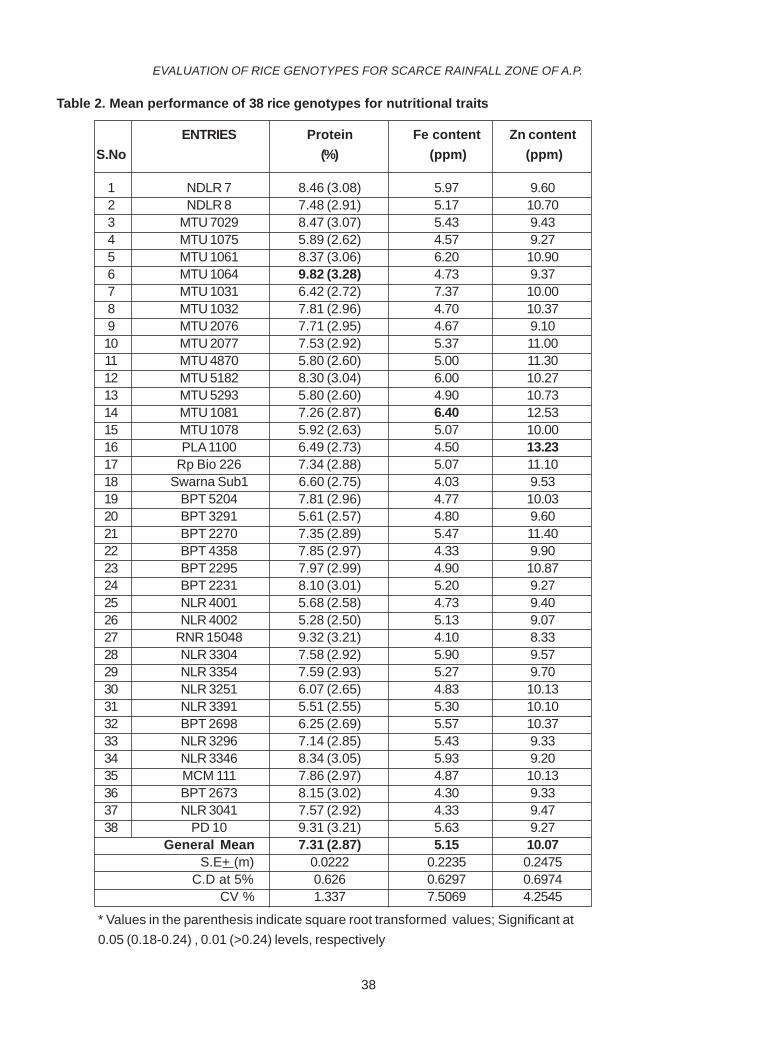
38
Table 2. Mean performance of 38 rice genotypes for nutritional traits
ENTRIES Protein Fe content Zn contentS.No (%) (ppm) (ppm)
1 NDLR 7 8.46 (3.08) 5.97 9.602 NDLR 8 7.48 (2.91) 5.17 10.703 MTU 7029 8.47 (3.07) 5.43 9.434 MTU 1075 5.89 (2.62) 4.57 9.275 MTU 1061 8.37 (3.06) 6.20 10.906 MTU 1064 9.82 (3.28) 4.73 9.377 MTU 1031 6.42 (2.72) 7.37 10.008 MTU 1032 7.81 (2.96) 4.70 10.379 MTU 2076 7.71 (2.95) 4.67 9.1010 MTU 2077 7.53 (2.92) 5.37 11.0011 MTU 4870 5.80 (2.60) 5.00 11.3012 MTU 5182 8.30 (3.04) 6.00 10.2713 MTU 5293 5.80 (2.60) 4.90 10.7314 MTU 1081 7.26 (2.87) 6.40 12.5315 MTU 1078 5.92 (2.63) 5.07 10.0016 PLA 1100 6.49 (2.73) 4.50 13.2317 Rp Bio 226 7.34 (2.88) 5.07 11.1018 Swarna Sub1 6.60 (2.75) 4.03 9.5319 BPT 5204 7.81 (2.96) 4.77 10.0320 BPT 3291 5.61 (2.57) 4.80 9.6021 BPT 2270 7.35 (2.89) 5.47 11.4022 BPT 4358 7.85 (2.97) 4.33 9.9023 BPT 2295 7.97 (2.99) 4.90 10.8724 BPT 2231 8.10 (3.01) 5.20 9.2725 NLR 4001 5.68 (2.58) 4.73 9.4026 NLR 4002 5.28 (2.50) 5.13 9.0727 RNR 15048 9.32 (3.21) 4.10 8.3328 NLR 3304 7.58 (2.92) 5.90 9.5729 NLR 3354 7.59 (2.93) 5.27 9.7030 NLR 3251 6.07 (2.65) 4.83 10.1331 NLR 3391 5.51 (2.55) 5.30 10.1032 BPT 2698 6.25 (2.69) 5.57 10.3733 NLR 3296 7.14 (2.85) 5.43 9.3334 NLR 3346 8.34 (3.05) 5.93 9.2035 MCM 111 7.86 (2.97) 4.87 10.1336 BPT 2673 8.15 (3.02) 4.30 9.3337 NLR 3041 7.57 (2.92) 4.33 9.4738 PD 10 9.31 (3.21) 5.63 9.27
General Mean 7.31 (2.87) 5.15 10.07 S.E+ (m) 0.0222 0.2235 0.2475 C.D at 5% 0.626 0.6297 0.6974 CV % 1.337 7.5069 4.2545
* Values in the parenthesis indicate square root transformed values; Significant at0.05 (0.18-0.24) , 0.01 (>0.24) levels, respectively
EVALUATION OF RICE GENOTYPES FOR SCARCE RAINFALL ZONE OF A.P.
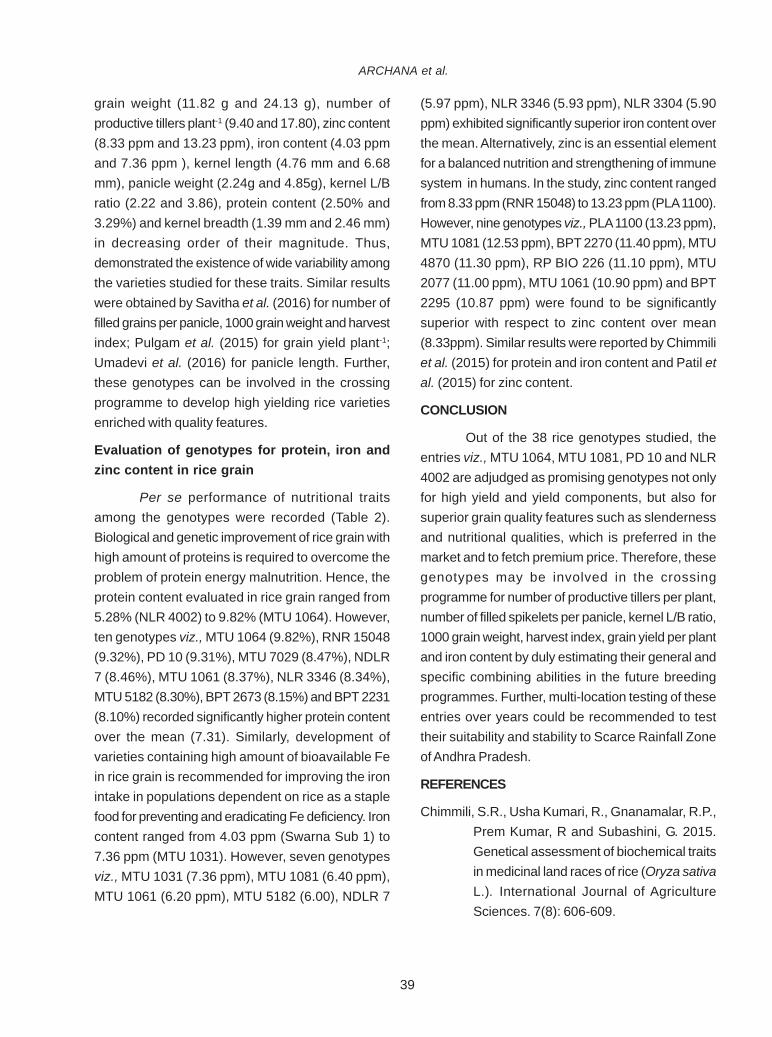
39
grain weight (11.82 g and 24.13 g), number ofproductive tillers plant-1 (9.40 and 17.80), zinc content(8.33 ppm and 13.23 ppm), iron content (4.03 ppmand 7.36 ppm ), kernel length (4.76 mm and 6.68mm), panicle weight (2.24g and 4.85g), kernel L/Bratio (2.22 and 3.86), protein content (2.50% and3.29%) and kernel breadth (1.39 mm and 2.46 mm)in decreasing order of their magnitude. Thus,demonstrated the existence of wide variability amongthe varieties studied for these traits. Similar resultswere obtained by Savitha et al. (2016) for number offilled grains per panicle, 1000 grain weight and harvestindex; Pulgam et al. (2015) for grain yield plant-1;Umadevi et al. (2016) for panicle length. Further,these genotypes can be involved in the crossingprogramme to develop high yielding rice varietiesenriched with quality features.
Evaluation of genotypes for protein, iron andzinc content in rice grain
Per se performance of nutritional traitsamong the genotypes were recorded (Table 2).Biological and genetic improvement of rice grain withhigh amount of proteins is required to overcome theproblem of protein energy malnutrition. Hence, theprotein content evaluated in rice grain ranged from5.28% (NLR 4002) to 9.82% (MTU 1064). However,ten genotypes viz., MTU 1064 (9.82%), RNR 15048(9.32%), PD 10 (9.31%), MTU 7029 (8.47%), NDLR7 (8.46%), MTU 1061 (8.37%), NLR 3346 (8.34%),MTU 5182 (8.30%), BPT 2673 (8.15%) and BPT 2231(8.10%) recorded significantly higher protein contentover the mean (7.31). Similarly, development ofvarieties containing high amount of bioavailable Fein rice grain is recommended for improving the ironintake in populations dependent on rice as a staplefood for preventing and eradicating Fe deficiency. Ironcontent ranged from 4.03 ppm (Swarna Sub 1) to7.36 ppm (MTU 1031). However, seven genotypesviz., MTU 1031 (7.36 ppm), MTU 1081 (6.40 ppm),MTU 1061 (6.20 ppm), MTU 5182 (6.00), NDLR 7
(5.97 ppm), NLR 3346 (5.93 ppm), NLR 3304 (5.90ppm) exhibited significantly superior iron content overthe mean. Alternatively, zinc is an essential elementfor a balanced nutrition and strengthening of immunesystem in humans. In the study, zinc content rangedfrom 8.33 ppm (RNR 15048) to 13.23 ppm (PLA 1100).However, nine genotypes viz., PLA 1100 (13.23 ppm),MTU 1081 (12.53 ppm), BPT 2270 (11.40 ppm), MTU4870 (11.30 ppm), RP BIO 226 (11.10 ppm), MTU2077 (11.00 ppm), MTU 1061 (10.90 ppm) and BPT2295 (10.87 ppm) were found to be significantlysuperior with respect to zinc content over mean(8.33ppm). Similar results were reported by Chimmiliet al. (2015) for protein and iron content and Patil etal. (2015) for zinc content.
CONCLUSION
Out of the 38 rice genotypes studied, theentries viz., MTU 1064, MTU 1081, PD 10 and NLR4002 are adjudged as promising genotypes not onlyfor high yield and yield components, but also forsuperior grain quality features such as slendernessand nutritional qualities, which is preferred in themarket and to fetch premium price. Therefore, thesegenotypes may be involved in the crossingprogramme for number of productive tillers per plant,number of filled spikelets per panicle, kernel L/B ratio,1000 grain weight, harvest index, grain yield per plantand iron content by duly estimating their general andspecific combining abilities in the future breedingprogrammes. Further, multi-location testing of theseentries over years could be recommended to testtheir suitability and stability to Scarce Rainfall Zoneof Andhra Pradesh.
REFERENCES
Chimmili, S.R., Usha Kumari, R., Gnanamalar, R.P.,Prem Kumar, R and Subashini, G. 2015.Genetical assessment of biochemical traitsin medicinal land races of rice (Oryza sativaL.). International Journal of AgricultureSciences. 7(8): 606-609.
ARCHANA et al.
40
Chowdhury, B.D., Nath, A and Dasgupta, T. 2016.Evaluation of some popular rice genotypeswith special emphasis on zinc, iron andprotein content. International Journal ofScientific and Research Publications. 6(7):2250-3153.
Dharwal, G., Khatri, R.S and Jain, R.K. 2017.Variability and correlation between yield andits component traits in mineral rich (Fe &Zn) indica rice genotypes. InternationalJournal of Pure and Applied Bioscience.5(2): 150-157.
Mir, S. A., Bosco, S. J. D and Sunooj, K. V. 2013.Evaluation of physical properties of ricecultivars grown in the temperate region ofIndia. International Food Research Journal.20 (4): 1521-1527.
Patil, A.C., Shivakumar, N., Rajanna, M.P.,Vijayakumara Swamy, H.V., Ashok, T.Hand Shashidhar, H.E. 2015. Micronutrient(Zinc and Fe) productivity in rice (Oryza
sativa L.). Ecology, Environment andConservation. 21: 5337-5346.
Umadevi, M., Saraswathi, R., Shanthi, P., Suresh,R., Rao, D.S and Rajendran, R. 2016.Assessment of genetic variability intraditional rice varieties based on agro-morphological traits and iron zinc contentfor crop improvement. International Journalof Science and Nature. 7(2): 244-250.
Savitha, P and Kumari, U.R. 2016. Indigenousknowledge of traditional landraces in rice(Oryza sativa L.) in situ conservation ofTamilnadu, India. Indian Journal ofTraditional Knowledge. 15(2): 321-329.
Pulgam, M.B., Praveen, V., Sravanthi, S.M., Rao,S.D., Surekha K., Sundaram, R.M., Babu,R.V and Neeraja, C.N. 2015. Associationof Os YSL9 gene with high iron and zinccontent in rice grains and identification ofelite rice lines. International Journal ofTropical Agriculture. 33(4): 0254-8755.
EVALUATION OF RICE GENOTYPES FOR SCARCE RAINFALL ZONE OF A.P.
41
INTRODUCTION
Intensive cultivation, growing of exhaustivecrops, use of unbalanced and inadequate fertilizersaccompanied by restricted use of organic manureshave made soils not only deficient in nutrients, butalso deteriorated soil health resulting in decline incrop response to recommended dose of fertilizers.Boosting yield, reducing production cost andimproving soil health are three interlinked componentsof sustainable triangle (Kumar and Yadav, 1995).Therefore, there is need to improve soil fertility andquality of economic product by use of organicmanures and liquid biofertilizer consortium.Fingermillet is the third most important millet, nextto sorghum and pearlmillet. In India, fingermillet isgrown over an area of 1.13 Million ha with an annualproduction of 1.98 Million tonnes and a productivityof 1661 kg ha-1. In Andhra Pradesh, it is cultivated inan area of 44,000 ha with a production of 36,000tonnes and having a productivity of 1045 kg ha-1 (GoI,2016). Continuous use of inorganic nutrients mayadversely affect the physical and chemical propertiesof soil and thereby affect the crop yields. In order to
YIELD AND NUTRIENT UPTAKE OF FINGERMILLET AS INFLUENCED BYORGANICS AND LIQUID BIOFERTILIZER CONSORTIUM
K. LAVANYA*, G. KRISHNA REDDY, A. PRATAP KUMAR REDDY,P.V.R.M REDDY and P. LAVANYA KUMARI
Department of Agronomy, S.V. Agricultural College,Acharya N.G. Ranga Agricultural University, Tirupati -517 502
Date of Receipt: 30.06.2018 Date of Acceptance: 01.09.2018
ABSTRACTInfluence of organics and liquid bio fertilizer consortium on yield and nutrient uptake of fingermillet was studied during
Kharif, 2017. The results revealed that highest grain yield was recorded with seed treatment with ghanajeevamritham (STG) +soil application of jeevamritham (SAJ) + liquid bio fertilizer consortium (LBFC) (T6) (1057 kg ha-1) closely followed by RDF + LBFC(T8) (1029 kg ha-1), which were at par and significantly superior to the rest of the treatments. Highest nutrient uptake was with RDF+ LBFC (T8) (89.1, 30.0 and 106.7 kg ha-1) followed by RDF (T4) (58.0 kg ha-1, 12.9 kg ha-1 and 78.1 kg ha-1) which were statisticallyon par with each other. Lowest grain yield and nutrient uptake was recorded with control (T9). STG + SAJ and RDF in combinationwith liquid biofertilizer consortium holds promise as an appropriate technology for achieving efficient and economical way ofnutrient supply and also higher yield in fingermillet.
J.Res. ANGRAU 46(3) 41-44, 2018
*Corresponding Author E-mail: [email protected]
sustain the yield and reduce the dependency oninorganic fertilizer use, conjunctive use of organicmanures, biofertilizers and fertilizers is very muchessential (Anil Kumar et al., 2003). In India,numerous cow-based fermented products such asjeevamritham, ghanajeevamritham are being usedby the organic practitioners. These products containmacro, micronutrients, essential amino acids, growthpromoting factors like IAA, GA and rich in microbialdiversity (Sreenivasa et al., 2011). Liquid and solidmanures having a variety of beneficialmicroorganisms may activate biological reactions torestore soil fertility, further acting as plant growthstimulants which can enhance the crop yield andquality. Liquid biofertilizers have the capacity toreplace the traditional chemical fertilizers and carrier-based biofertilizers and play a major role in restoringthe soil health.
However, lot of measures in terms oftechnology, government support, subsidies andconstructive awareness by well trained techniciansare emphasized to increase the usage of liquidbiofertilizersamong the agrarians (Pavan Kumar and
42
LAVANYA et al.
Satyanarayana, 2012). Organic farming is gainingimportance, which lies in a simple principle ofutilizing on-farm resources devoid of agriculturalchemicals. Mostly, research on organic productionof fingermillet is concentrated on the use of FYM,compost, neemcake, etc. Limited research was doneon the effect of ghanajeevamritam and liquidbiofertilizer consortium alone or in combination infingermillet. Hence, the investigation was carried outwith an objective to study the effect of organics andliquid biofertilizer consortium on the yield and nutrientuptake of fingermillet in southern zone of AndhraPradesh.
MATERIAL AND METHODS
The experiment was carried out during Kharif,2017 on sandy clay loam soils of wetland, S.V.Agricultural College Farm, Tirupati in a randomizedblock design with nine treatments, replicated thriceas follows. T1: Farm yard manure on equal N basis(FYM); T2: Seed treatment with ghanajeevamritham(STG) + soil application of jeevamritham (SAJ) @500 l ha-1 from sowing to 15 days before harvest with10 days interval (STG + SAJ); T3: Neem cake onequal N basis (NC); T4: Recommended dose offertilizers : 60-30-20 kg N, P2O5, K2O ha-1 (RDF); T5:FYM (T1) + liquid biofertilizer consortium (LBFC); T6:STG + SAJ (T2) + LBFC; T7: Neem cake (T3) + LBFC;T8: RDF (T4) + LBFC; T9: Control. Liquid BiofertilizerConsortium (LBFC) consisting of phosphoroussolubilising bacteria (PSB) + Azospirillum + Potashreleasing bacteria (KRB) @ 3.75 l ha-1 + VesicularArbuscular Mycorrizae (VAM @ 12.5 kg ha-1) as soilapplication at the time of transplanting of fingermillet.The variety ‘sapthagiri’ was tested.
RESULTS AND DISCUSSION
Yield
Highest grain yield of fingermillet was withSTG + SAJ + LBFC (T6) (1057 kg ha-1) closelyfollowed by RDF + LBFC (T8) (1029 kg ha-1) whichwere at par and significantly superior to the rest of
the treatments. FYM + LBFC (T5) and neem cake +LBFC (T7) (998 and 997 kg ha-1) were on par withRDF + LBFC (T8) and significantly superior over restof the treatments. RDF (T4), FYM (T1), neem cake(T3) and STG + SAJ (T2), were on par with each other.Lowest grain yield with control (T9) (Table 1).
Significantly highest grain yield of fingermilletwith STG + SAJ + LBFC (T6) and RDF + LBFC (T8)can be attributed to improvement in growth and yieldattributes due to adequate supply of plant nutrientsall through the crop period by way of improvedmicrobial activity leading to mineralization of soilorganic matter. Uniform and well distributed rainfallof 860.8 mm in 45 rainy days also favoured for quickmultiplication of microbial population leading toincreased availability and better uptake of nutrientsby the crop resulted in highest grain yield. Apoorvaet al. (2010) reported that application of (STCRfertilizers + FYM @ 10 t ha-1) along with Azotobacter+ PSB recorded higher grain yield (3741 kg ha-1)which was on par with treatment receiving (STCRfertilizers + FYM @ 10 t ha-1) + PSB (3557.8 kgha-1) of fingermillet. This might be due to increasednutrient availability with conjunctive use of organicand inorganic along with biofertilizer inoculation wereresponsible for better growth and higher yield.
Combined effect of FYM @ 5 t ha-1 + 75%RDF + bio inoculants (Azospirillum + PSB) mighthave improved vigour and resulted in recording highervalues of morphological parameters, which increasesthe photosynthetic capacity of plant there byincreasing the straw yield (30.3 q ha-1) and grain yield(20.4 q ha-1) as reported by Ahiwale et al. (2013).
Nutrient uptake
Highest nutrient (nitrogen, phosphorous andpotassium) uptake was with RDF + LBFC (T8),closely followed by RDF (T4) which were at par andsignificantly superior to the rest of the treatments.FYM + LBFC (T5), STG + SAG + LBFC (T6) andneem cake + LBFC (T7) were on par with each otherand significantly superior over rest of the treatments.
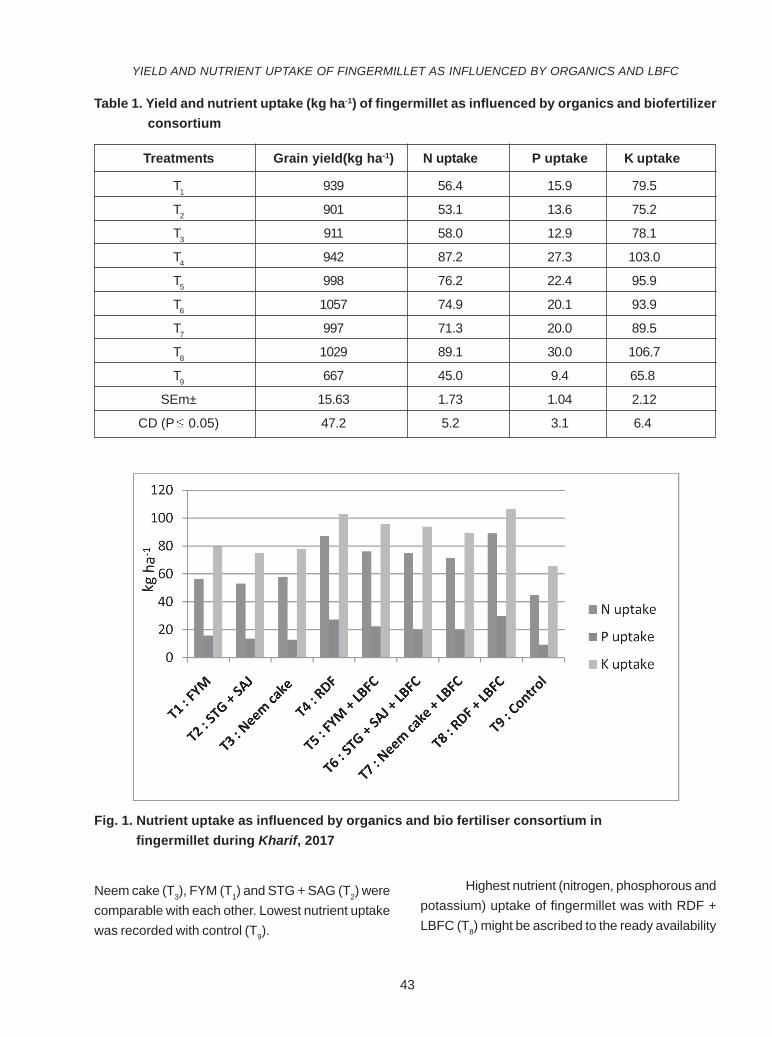
43
YIELD AND NUTRIENT UPTAKE OF FINGERMILLET AS INFLUENCED BY ORGANICS AND LBFC
Fig. 1. Nutrient uptake as influenced by organics and bio fertiliser consortium in fingermillet during Kharif, 2017
Table 1. Yield and nutrient uptake (kg ha-1) of fingermillet as influenced by organics and biofertilizer consortium
Treatments Grain yield(kg ha-1) N uptake P uptake K uptake
T1 939 56.4 15.9 79.5
T2 901 53.1 13.6 75.2
T3 911 58.0 12.9 78.1
T4 942 87.2 27.3 103.0
T5 998 76.2 22.4 95.9
T6 1057 74.9 20.1 93.9
T7 997 71.3 20.0 89.5
T8 1029 89.1 30.0 106.7
T9 667 45.0 9.4 65.8
SEm± 15.63 1.73 1.04 2.12
CD (P 0.05) 47.2 5.2 3.1 6.4
Neem cake (T3), FYM (T1) and STG + SAG (T2) werecomparable with each other. Lowest nutrient uptakewas recorded with control (T9).
Highest nutrient (nitrogen, phosphorous andpotassium) uptake of fingermillet was with RDF +LBFC (T8) might be ascribed to the ready availability
44
of the nutrients, resulting in greater absorption ascompared to organic sources. Among the organicsources of nutrients, FYM + LBFC (T7) and STG +SAJ + LBFC (T6) resulted in better nutrient uptake.Application of jeevamritham at 10 days interval incombination with liquid bio-fertilizer consortium mighthave improved the soil microbial activity enablingslow and steady release of nutrients for crop growthand development (Table 1). Vajantha et al. (2015)reported that N and P uptake was significantly highestin inorganic treated plot (60:40:30 kg NPK ha-1) thanorganic treated plot (75.2 kg ha-1 and 11.5 kg ha-1,respectively) in fingermillet.
Lowest nutrient uptake was recorded withcontrol (T9) as the crop was grown under nutrientstarved condition. For better multiplication ofmicrobes, continuous and well distributed moisturesupply through rainfall might have aided and finallyresulted in better nutrient uptake.
CONCLUSION
Results revealed that higher grain yield offingermillet with better nutrient uptake could beobtained by seed treatment with ghanajeevamritham+ soil application of jeevamritham @ 500 l ha-1 fromsowing to 15 days before harvest with 10 daysinterval with liquid biofertilizer consortium (STG + SAJ+ LBFC). Next best treatment recorded wasrecommended dose of fertilizers: 60-30-20 kg N, P2O5
and K2O ha-1 with liquid biofertilizer consortium (RDF+ LBFC).
REFERENCES
Ahiwale, P.H., Chavan, L.S., Jagtap, D.N., Mahadkar,U.V and Gawade, M.B. 2011. Effect ofestablishment methods and nutrientmanagement on yield attributes and yieldof fingermillet (Eleusine coracana L.). CropResearch. 45(1,2&3): 141-145.
Anil Kumar, B. H., Sharanappa, K.T., Krishne Gowdaand Sudhir, K. 2003. Growth, yield andnutrient uptake as influenced by integratednutrient management in dryland fingermillet.Mysore Journal of Agricultural Sciences.37(1): 24-28.
Apoorva, K.B., Prakash, S.S., Rajesh, N.L andNandini, B. 2010. STCR approach foroptimizing integrated plant nutrient supplyon growth, yield and economics offingermillet (Eleusine coracana (L.)Garten.). European Journal of BiologicalSciences. 4(1): 19-27.
Kumar, A and Yadav, D. S 1995. Use of organicmanures and fertilizers in rice- wheatcropping system for sustainability. IndianJournal of Agricultural Sciences. 65: 703-07.
GoI. 2016. Agricultural statistics at a glance. Ministryof Agriculture and Cooperation, New Delhi.Retrieved from website(www.agricoop.nic.in) on 27.6.2018.
Pavan Kumar, P and Satyanarayana, S.D.V. 2012.Liquid microbial consortium. A potential toolfor sustainable soil health. Journal ofBiofertilizers & Biopesticides. 3: 124.
Sreenivasa, M.N., Nagaraj, M., Naik, N and Bhat,S.N. 2011. Nutrient status and microbialload of different organic liquid manures.Karnataka Journal of Agricultural Sciences.24(4): 543-584.
Vajantha, B., Subbarao, M and Madhavilatha, L.2015. Yield, quality and nutrient uptake asinfluenced by organic manures andinorganic fertil izers in fingermillet.International Journal of Applied Biology andPharmaceutical Technology. 6(3): 46-48.
LAVANYA et al.
45
INTRODUCTION
Primary and secondary school children goto school every morning with over stuffed and heavyschool bags hanging over their shoulder. The bagsare unnecessarily heavy and often larger in size thantheir backs. The heavier the backpack, the morepressure it exerts on the spinal column and backmuscles as the children bend forward in an attemptto support the weight on the back rather than ontheir shoulders. Thus, heavy school bag will havenegative effects on posture and may induce pain inneck, shoulder and back. The peak rate of growthoccurs during childhood and puberty. As the childgrows, the development of the musculoskeletalsystem passes through different phases. Particularly,skeletal stature, body weight and height show aconstant increase from the age of 5 years onwarduntil approximately upto the age of 10 to 11 years.The rate of growth shows a peak between 11 and 15years. Body weight increases at a slower rate untilthe age of 9 to 10 years and afterwards weightincrease shows a rapid acceleration as the childenters puberty.
SCHOOL BAGS AND MUSCULOSKELETAL DISCOMFORTS IN NECK AMONGSCHOOL CHILDREN
CH. SOWJANYA* and T. NEERAJADepartment of Resource Management and Consumer Science, College of Home Science
Acharya N.G. Ranga Agricultural University, Guntur – 522 006
Date of Receipt: 26.07.2018 Date of Acceptance: 30.08.2018
ABSTRACTNon - specific back, neck and shoulder pain among school children are mostly related to over load caused by heavy
school bags. Sixty school going children (between 9 and 14 years of age) formed the sample. More than half of the schoolchildren (63.33%) felt that there was the occurrence of musculoskeletal discomfort in neck, but that was unnoticed. Only 18.33%of the school children clearly recognized and reported the occurrence of the musculoskeletal discomforts in neck. The frequencyof experiencing musculoskeletal discomforts such as pain, numbness, tingling sensation in the neck were moderate in case of68.33 percent of school children. The respondents who reported high intensity of musculoskeletal discomforts in the neck were10%. Nearly three-fourth of the respondents (73.33%) reported moderate level of musculoskeletal discomfort in neck. Together83.33 percent reported moderate to high intensity of musculoskeletal discomforts in neck.
*Corresponding Author E-mail: [email protected]
J.Res. ANGRAU 46(3) 45-51, 2018
The secondary ossification of vertebrae isnot complete until the mid -twenties. In these yearsthe skeletal tissue transforms from cartilage to bonethrough the process of ossification occurring inseveral stages. During these years the human bodyis sensitive and responsive to tension, compression,shear and torsion of the loads that are applied on it(Le Veau and Bernhardt, 1984). External forces, suchas heavy backpack loads during school going agemay affect the development of normal skeletalalignment (Chansirinukor et al., 2001 and Goodgoldet al., 2002). Ram Prasad et al. (2010) reported thatcarrying a back pack weighing 15% of body weightchange all the postural angles in preadolescentchildren in the study conducted with 200 healthy malehigh school children in Mangalore. Mayank et al.(2006) who studied 60 school children in age group10-15 years of New Delhi reported that loading schoolchildren with 10% of body weight would be too heavyfor the child to maintain normal cervical and shoulderposture alignment. The improper use of backpackduring school going age can lead to muscleimbalance that could turn into chronic back and neckproblems later in life. Keeping these in view, the study
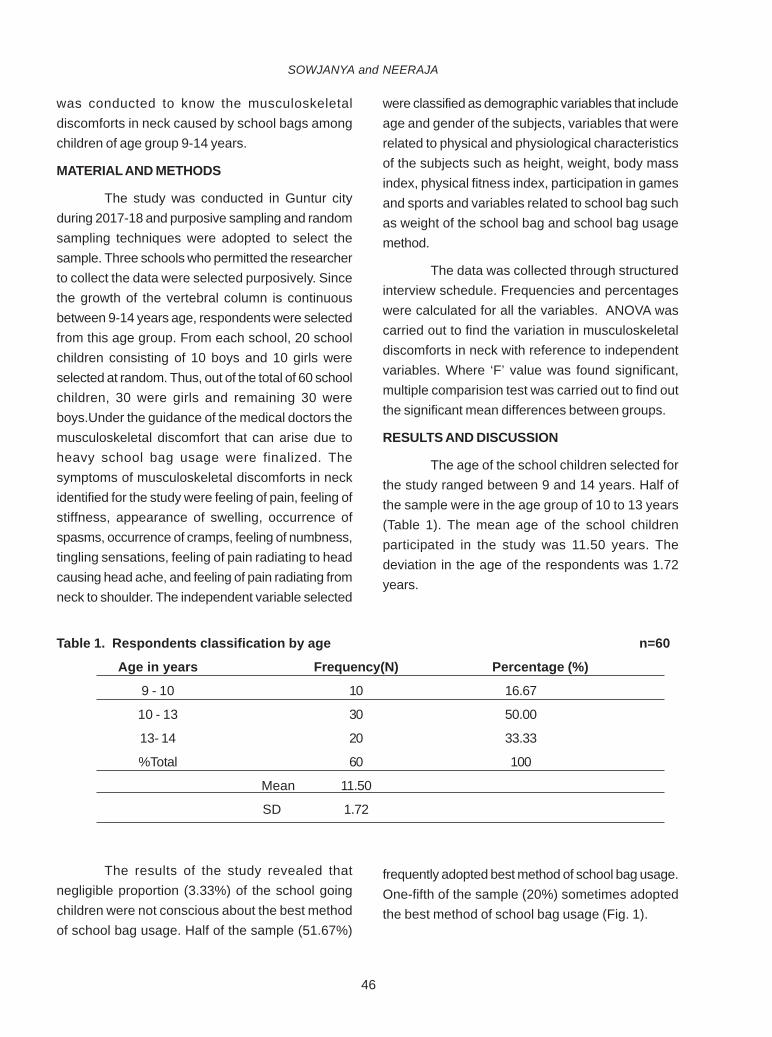
46
was conducted to know the musculoskeletaldiscomforts in neck caused by school bags amongchildren of age group 9-14 years.
MATERIAL AND METHODS
The study was conducted in Guntur cityduring 2017-18 and purposive sampling and randomsampling techniques were adopted to select thesample. Three schools who permitted the researcherto collect the data were selected purposively. Sincethe growth of the vertebral column is continuousbetween 9-14 years age, respondents were selectedfrom this age group. From each school, 20 schoolchildren consisting of 10 boys and 10 girls wereselected at random. Thus, out of the total of 60 schoolchildren, 30 were girls and remaining 30 wereboys.Under the guidance of the medical doctors themusculoskeletal discomfort that can arise due toheavy school bag usage were finalized. Thesymptoms of musculoskeletal discomforts in neckidentified for the study were feeling of pain, feeling ofstiffness, appearance of swelling, occurrence ofspasms, occurrence of cramps, feeling of numbness,tingling sensations, feeling of pain radiating to headcausing head ache, and feeling of pain radiating fromneck to shoulder. The independent variable selected
were classified as demographic variables that includeage and gender of the subjects, variables that wererelated to physical and physiological characteristicsof the subjects such as height, weight, body massindex, physical fitness index, participation in gamesand sports and variables related to school bag suchas weight of the school bag and school bag usagemethod.
The data was collected through structuredinterview schedule. Frequencies and percentageswere calculated for all the variables. ANOVA wascarried out to find the variation in musculoskeletaldiscomforts in neck with reference to independentvariables. Where ‘F’ value was found significant,multiple comparision test was carried out to find outthe significant mean differences between groups.
RESULTS AND DISCUSSION
The age of the school children selected forthe study ranged between 9 and 14 years. Half ofthe sample were in the age group of 10 to 13 years(Table 1). The mean age of the school childrenparticipated in the study was 11.50 years. Thedeviation in the age of the respondents was 1.72years.
Table 1. Respondents classification by age n=60
Age in years Frequency(N) Percentage (%)
9 - 10 10 16.67
10 - 13 30 50.00
13- 14 20 33.33
%Total 60 100
Mean 11.50
SD 1.72
The results of the study revealed thatnegligible proportion (3.33%) of the school goingchildren were not conscious about the best methodof school bag usage. Half of the sample (51.67%)
frequently adopted best method of school bag usage.One-fifth of the sample (20%) sometimes adoptedthe best method of school bag usage (Fig. 1).
SOWJANYA and NEERAJA
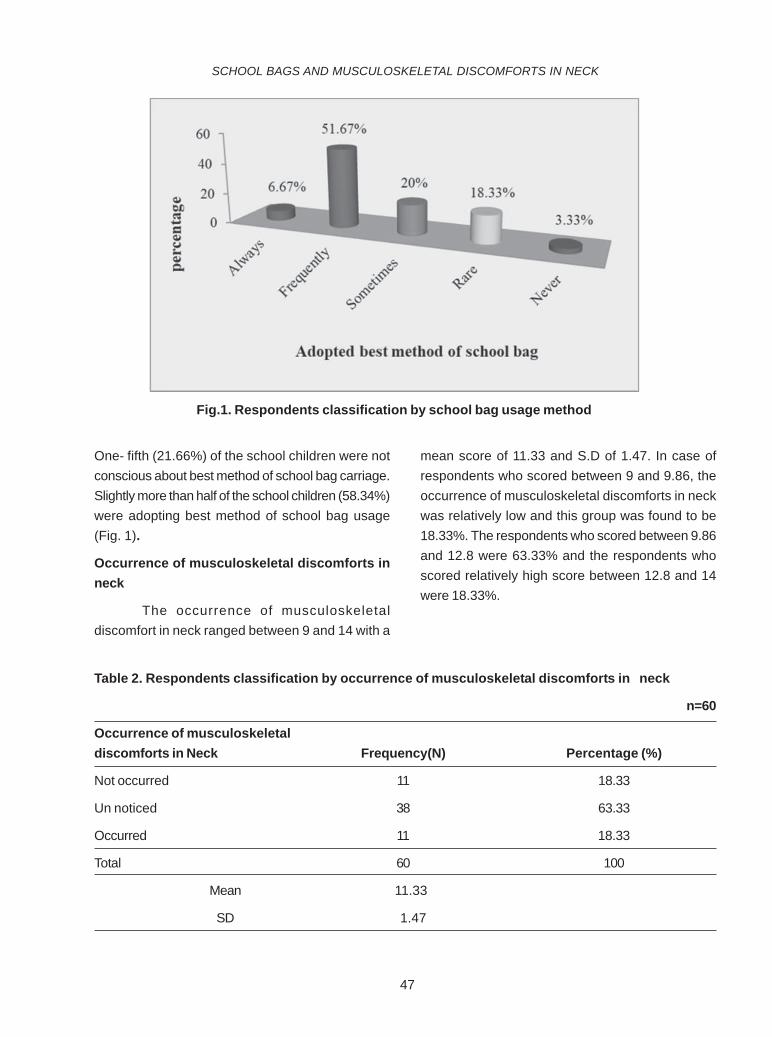
47
One- fifth (21.66%) of the school children were notconscious about best method of school bag carriage.Slightly more than half of the school children (58.34%)were adopting best method of school bag usage(Fig. 1).
Occurrence of musculoskeletal discomforts inneck
The occurrence of musculoskeletaldiscomfort in neck ranged between 9 and 14 with a
Fig.1. Respondents classification by school bag usage method
mean score of 11.33 and S.D of 1.47. In case ofrespondents who scored between 9 and 9.86, theoccurrence of musculoskeletal discomforts in neckwas relatively low and this group was found to be18.33%. The respondents who scored between 9.86and 12.8 were 63.33% and the respondents whoscored relatively high score between 12.8 and 14were 18.33%.
Table 2. Respondents classification by occurrence of musculoskeletal discomforts in neck
n=60
Occurrence of musculoskeletaldiscomforts in Neck Frequency(N) Percentage (%)
Not occurred 11 18.33
Un noticed 38 63.33
Occurred 11 18.33
Total 60 100
Mean 11.33
SD 1.47
SCHOOL BAGS AND MUSCULOSKELETAL DISCOMFORTS IN NECK
48
While indicating the occurrence ofmusculoskeletal discomfort, the children were unableto report whether they clearly experienced themusculoskeletal discomfort listed or not. Some ofthe children reported that they cannot confirm thatmusculoskeletal discomfort occurred. Relativelymore number of school children felt there was theoccurrence of musculoskeletal discomfort in neck,but that was unnoticed. Only 18.33 percent of theschool children reported the occurrence of themusculoskeletal discomfort in neck (Table 2).
Frequency of experiencing musculoskeletaldiscomforts in neck
The respondents score for frequency ofexperiencing of musculoskeletal discomforts in neckranged between 9 and 24. Taking mean and S.D intoconsideration, the respondents were divided into threegroups. The respondents who scored between 9 and9.86 were grouped as low. Respondents who scoredbetween 16.88 and 24 were grouped as high andrespondents who scored in between i.e. from 9.86to 16.88 were grouped as medium. Relatively morenumber of school children reported the occurrenceof musculoskeletal pain in neck more frequently. Incase of 13.33 percent of school going children thefrequency of occurrence of musculoskeletaldiscomforts in neck was relatively high (Fig. 2.).
The frequency of experiencingmusculoskeletal discomfort such as pain in the neck,were moderate in case of 68.33 percent of schoolchildren (Fig. 2.).
Intensity of musculoskeletal discomforts in neck
The schoolchildren were divided into threegroups based on the intensity of musculoskeletaldiscomforts reported in neck. The respondents whoscored between 15.65 and 19 were grouped as high
and who scored between 9 and 10.32 were groupedas low. The respondents whose score was between10.32 and 15.65 were grouped as moderate. Therespondents who reported high intensity ofmusculoskeletal discomforts in the neck were 10%(Table 3). Nearly three-fourth of the respondents(73.33%) reported moderate musculoskeletaldiscomfort in neck. Together 83.33 percent reportedmoderate to high intensity of musculoskeletal painin neck.
Fig. 2. Respondents classification by frequency of experiencing musculoskeletaldiscomforts in neck
LAVANYA et al.
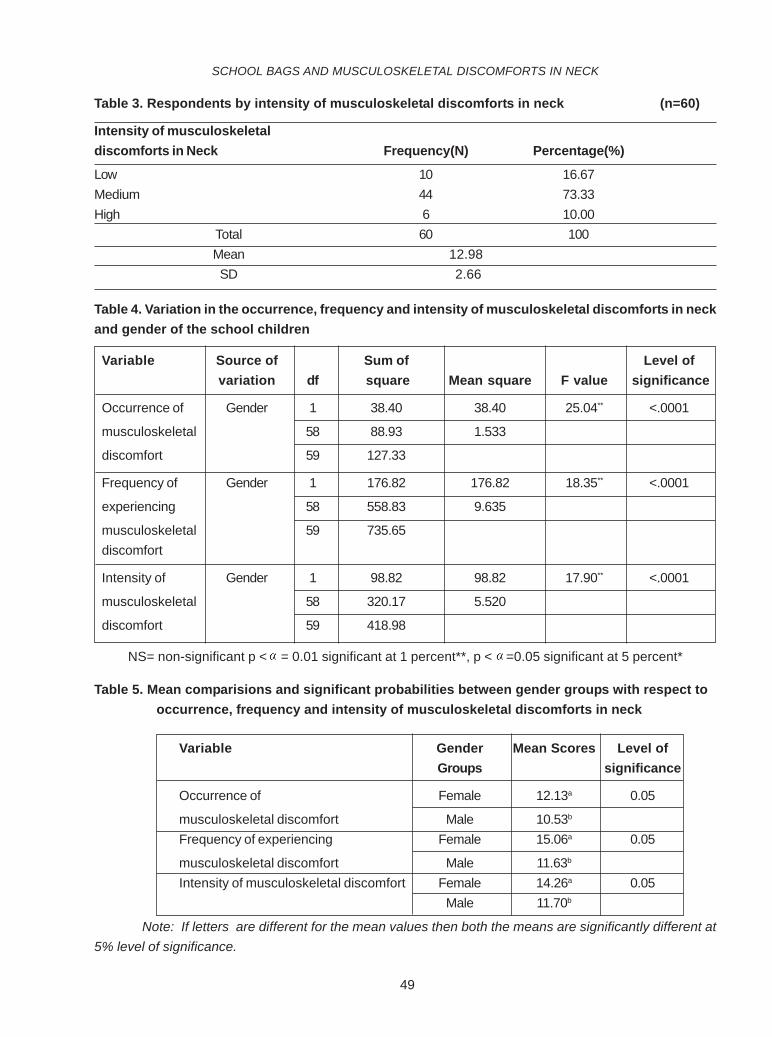
49
Table 3. Respondents by intensity of musculoskeletal discomforts in neck (n=60)
Intensity of musculoskeletaldiscomforts in Neck Frequency(N) Percentage(%)
Low 10 16.67Medium 44 73.33High 6 10.00
Total 60 100Mean 12.98SD 2.66
Table 4. Variation in the occurrence, frequency and intensity of musculoskeletal discomforts in neckand gender of the school children
Variable Source of Sum of Level ofvariation df square Mean square F value significance
Occurrence of Gender 1 38.40 38.40 25.04** <.0001
musculoskeletal 58 88.93 1.533
discomfort 59 127.33
Frequency of Gender 1 176.82 176.82 18.35** <.0001
experiencing 58 558.83 9.635
musculoskeletal 59 735.65discomfort
Intensity of Gender 1 98.82 98.82 17.90** <.0001
musculoskeletal 58 320.17 5.520
discomfort 59 418.98
NS= non-significant p < = 0.01 significant at 1 percent**, p < =0.05 significant at 5 percent*
SCHOOL BAGS AND MUSCULOSKELETAL DISCOMFORTS IN NECK
Table 5. Mean comparisions and significant probabilities between gender groups with respect to occurrence, frequency and intensity of musculoskeletal discomforts in neck
Variable Gender Mean Scores Level ofGroups significance
Occurrence of Female 12.13a 0.05
musculoskeletal discomfort Male 10.53b
Frequency of experiencing Female 15.06a 0.05
musculoskeletal discomfort Male 11.63b
Intensity of musculoskeletal discomfort Female 14.26a 0.05Male 11.70b
Note: If letters are different for the mean values then both the means are significantly different at5% level of significance.
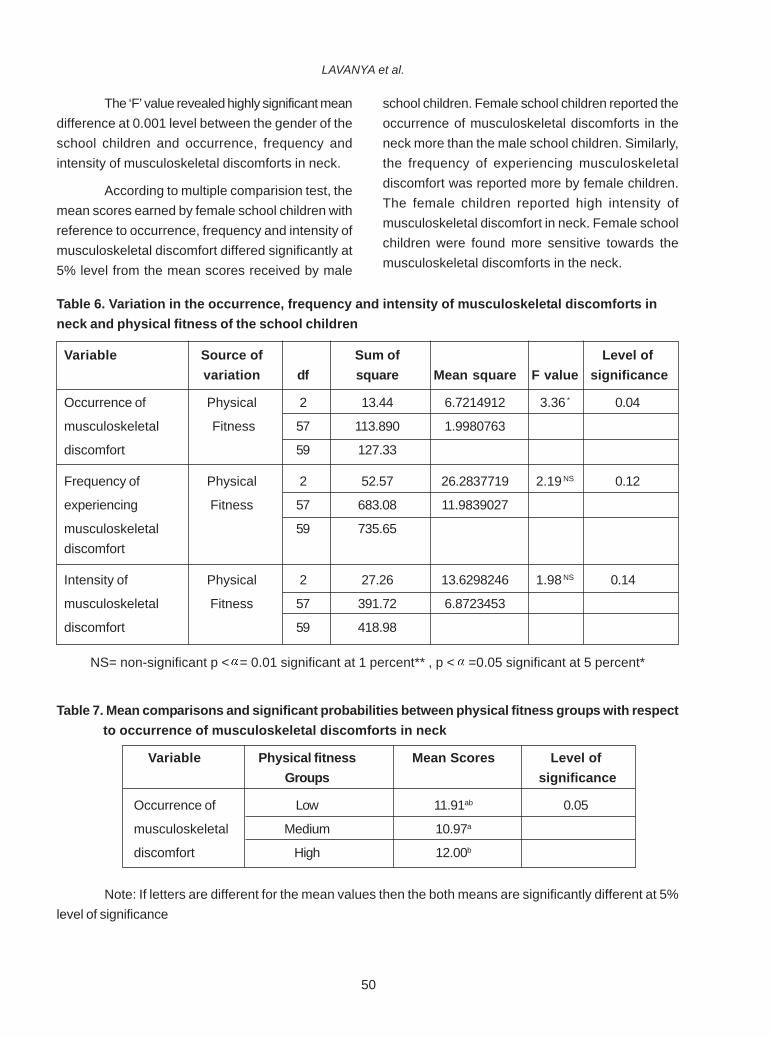
50
The ‘F’ value revealed highly significant meandifference at 0.001 level between the gender of theschool children and occurrence, frequency andintensity of musculoskeletal discomforts in neck.
According to multiple comparision test, themean scores earned by female school children withreference to occurrence, frequency and intensity ofmusculoskeletal discomfort differed significantly at5% level from the mean scores received by male
LAVANYA et al.
school children. Female school children reported theoccurrence of musculoskeletal discomforts in theneck more than the male school children. Similarly,the frequency of experiencing musculoskeletaldiscomfort was reported more by female children.The female children reported high intensity ofmusculoskeletal discomfort in neck. Female schoolchildren were found more sensitive towards themusculoskeletal discomforts in the neck.
Table 7. Mean comparisons and significant probabilities between physical fitness groups with respect to occurrence of musculoskeletal discomforts in neck
Variable Physical fitness Mean Scores Level ofGroups significance
Occurrence of Low 11.91ab 0.05
musculoskeletal Medium 10.97a
discomfort High 12.00b
Note: If letters are different for the mean values then the both means are significantly different at 5%level of significance
Table 6. Variation in the occurrence, frequency and intensity of musculoskeletal discomforts inneck and physical fitness of the school children
Variable Source of Sum of Level ofvariation df square Mean square F value significance
Occurrence of Physical 2 13.44 6.7214912 3.36 * 0.04
musculoskeletal Fitness 57 113.890 1.9980763
discomfort 59 127.33
Frequency of Physical 2 52.57 26.2837719 2.19 NS 0.12
experiencing Fitness 57 683.08 11.9839027
musculoskeletal 59 735.65discomfort
Intensity of Physical 2 27.26 13.6298246 1.98 NS 0.14
musculoskeletal Fitness 57 391.72 6.8723453
discomfort 59 418.98
NS= non-significant p < = 0.01 significant at 1 percent** , p < =0.05 significant at 5 percent*
51
The probable ‘F’ value revealed significantvariation in the occurrence of musculoskeletaldiscomforts in neck according to physical fitness ofthe school children and no significant difference inthe frequency and intensity of musculoskeletaldiscomforts in neck according to physical fitness ofthe school children.
According to the physical fitness index, theschool children were found to be in good physicalhealth. The physical fitness index of the schoolchildren and the frequency and intensity ofmusculoskeletal discomforts experienced by themwere found independent. School children with highphysical fitness scored more on the occurrence ofmusculoskeletal discomforts in neck and theydiffered significantly with school children whounnoticed the occurrence of musculoskeletaldiscomforts in neck.
CONCLUSION
While indicating the occurrence ofmusculoskeletal discomfort, the children were unableto identify whether they clearly experienced themusculoskeletal discomforts listed or not. More thanhalf of the school children (63.33%) felt that therewas the occurrence of musculoskeletal discomfortin neck, but that was unnoticed. Only 18.33% of theschool children clearly recognized and reported theoccurrence of the musculoskeletal discomforts inneck. The frequency of experiencing musculoskeletaldiscomforts such as pain, numbness, tinglingsensation in the neck were moderate in case of 68.33percent of school children. The respondents whoreported high intensity of musculoskeletal discomfortsin the neck were 10%. Nearly three-fourth of therespondents (73.33%) reported moderate level ofmusculoskeletal discomfort in neck. Together 83.33
percent reported moderate to high intensity ofmusculoskeletal discomforts in neck. Highlysignificant mean difference was observed betweenthe gender of the school children and occurrence,frequency and intensity of musculoskeletaldiscomforts in neck. There was a significant meandifference between physical fitness of school childrenand the frequency of experiencing musculoskeletaldiscomforts in neck.
REFERENCES
Chansirinukor, W., Wilson, D., Grimmer, K andDansie, B. 2001. Effects of backpacks onstudents: Measurement of cervical andshoulder posture. Australian Journal ofPhysiotherapy. 47 (2):110-6.
Goodgold, S., Mohr, K., Samant, A., Parke, T., Burns,T and Gardner, L. 2002. Effect of backpackload and task demand on trunk forward lean:pilot finding on two boys. Work. 18 (3): 213-20.
Le Leau, B.F and Bernhardt, D.B. 1984.Developmental biomechanics. Effect offorces on the growth, development, andmaintenance of the human body. PhysicalTherapy. 64 (12):1872-1882.
Mayank, M., Upendar, S and Nishat,Q. 2006.Effect of backpack loading on cervical andshoulder posture in Indian school children.Indian Journal of Physiotherapy andOccupational Therapy. 2006(1): 3–12.
Ram Prasad, M., Alias, J and Raghuveer, A.K. 2010.Effect of backpack weight on posturalangles in preadolescent children. IndianPaediatrics. 47(7):575-580.
SCHOOL BAGS AND MUSCULOSKELETAL DISCOMFORTS IN NECK
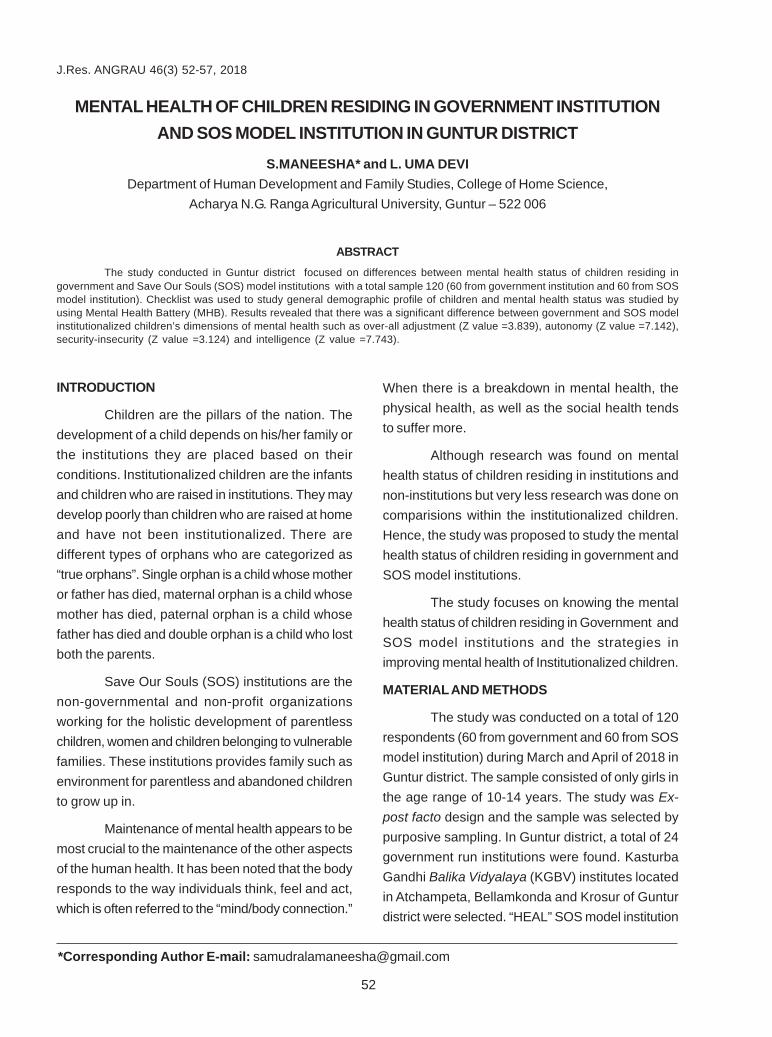
52
INTRODUCTION
Children are the pillars of the nation. Thedevelopment of a child depends on his/her family orthe institutions they are placed based on theirconditions. Institutionalized children are the infantsand children who are raised in institutions. They maydevelop poorly than children who are raised at homeand have not been institutionalized. There aredifferent types of orphans who are categorized as“true orphans”. Single orphan is a child whose motheror father has died, maternal orphan is a child whosemother has died, paternal orphan is a child whosefather has died and double orphan is a child who lostboth the parents.
Save Our Souls (SOS) institutions are thenon-governmental and non-profit organizationsworking for the holistic development of parentlesschildren, women and children belonging to vulnerablefamilies. These institutions provides family such asenvironment for parentless and abandoned childrento grow up in.
Maintenance of mental health appears to bemost crucial to the maintenance of the other aspectsof the human health. It has been noted that the bodyresponds to the way individuals think, feel and act,which is often referred to the “mind/body connection.”
MENTAL HEALTH OF CHILDREN RESIDING IN GOVERNMENT INSTITUTIONAND SOS MODEL INSTITUTION IN GUNTUR DISTRICT
S.MANEESHA* and L. UMA DEVIDepartment of Human Development and Family Studies, College of Home Science,
Acharya N.G. Ranga Agricultural University, Guntur – 522 006
ABSTRACTThe study conducted in Guntur district focused on differences between mental health status of children residing in
government and Save Our Souls (SOS) model institutions with a total sample 120 (60 from government institution and 60 from SOSmodel institution). Checklist was used to study general demographic profile of children and mental health status was studied byusing Mental Health Battery (MHB). Results revealed that there was a significant difference between government and SOS modelinstitutionalized children’s dimensions of mental health such as over-all adjustment (Z value =3.839), autonomy (Z value =7.142),security-insecurity (Z value =3.124) and intelligence (Z value =7.743).
*Corresponding Author E-mail: [email protected]
J.Res. ANGRAU 46(3) 52-57, 2018
When there is a breakdown in mental health, thephysical health, as well as the social health tendsto suffer more.
Although research was found on mentalhealth status of children residing in institutions andnon-institutions but very less research was done oncomparisions within the institutionalized children.Hence, the study was proposed to study the mentalhealth status of children residing in government andSOS model institutions.
The study focuses on knowing the mentalhealth status of children residing in Government andSOS model institutions and the strategies inimproving mental health of Institutionalized children.
MATERIAL AND METHODS
The study was conducted on a total of 120respondents (60 from government and 60 from SOSmodel institution) during March and April of 2018 inGuntur district. The sample consisted of only girls inthe age range of 10-14 years. The study was Ex-post facto design and the sample was selected bypurposive sampling. In Guntur district, a total of 24government run institutions were found. KasturbaGandhi Balika Vidyalaya (KGBV) institutes locatedin Atchampeta, Bellamkonda and Krosur of Gunturdistrict were selected. “HEAL” SOS model institution
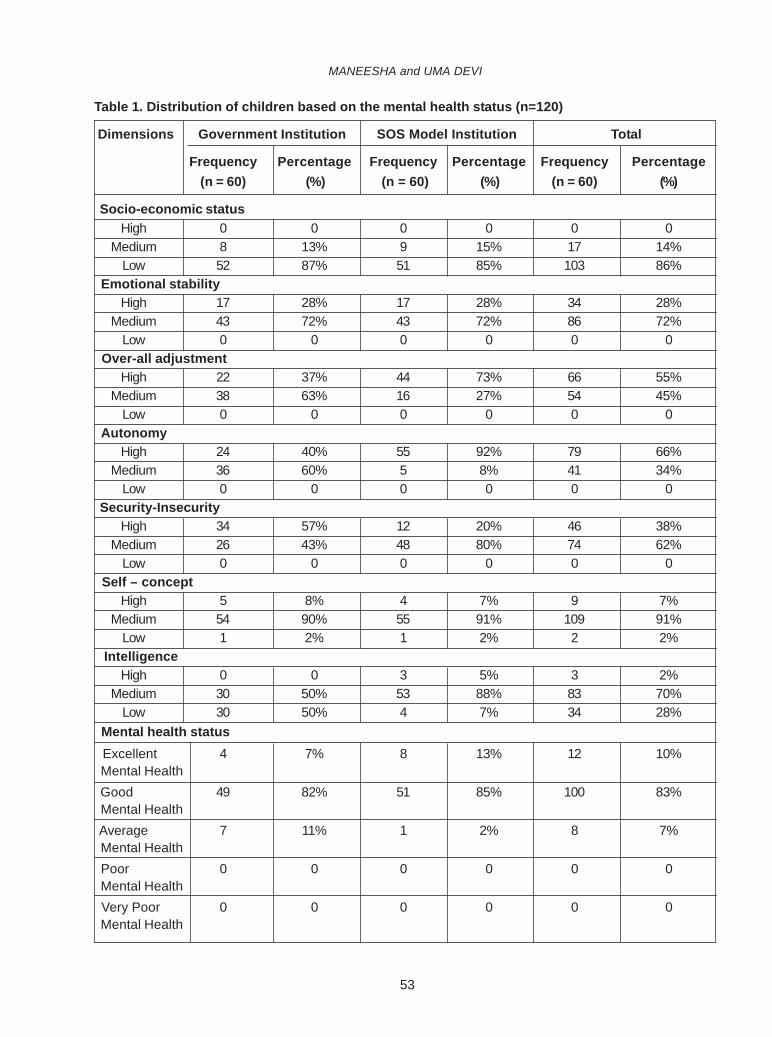
53
Table 1. Distribution of children based on the mental health status (n=120)
Dimensions Government Institution SOS Model Institution Total
Frequency Percentage Frequency Percentage Frequency Percentage(n = 60) (%) (n = 60) (%) (n = 60) (%)
Socio-economic statusHigh 0 0 0 0 0 0
Medium 8 13% 9 15% 17 14%Low 52 87% 51 85% 103 86%
Emotional stabilityHigh 17 28% 17 28% 34 28%
Medium 43 72% 43 72% 86 72%Low 0 0 0 0 0 0
Over-all adjustmentHigh 22 37% 44 73% 66 55%
Medium 38 63% 16 27% 54 45%Low 0 0 0 0 0 0
AutonomyHigh 24 40% 55 92% 79 66%
Medium 36 60% 5 8% 41 34%Low 0 0 0 0 0 0
Security-InsecurityHigh 34 57% 12 20% 46 38%
Medium 26 43% 48 80% 74 62%Low 0 0 0 0 0 0
Self – conceptHigh 5 8% 4 7% 9 7%
Medium 54 90% 55 91% 109 91%Low 1 2% 1 2% 2 2%
IntelligenceHigh 0 0 3 5% 3 2%
Medium 30 50% 53 88% 83 70%Low 30 50% 4 7% 34 28%
Mental health status Excellent 4 7% 8 13% 12 10% Mental Health Good 49 82% 51 85% 100 83% Mental Health Average 7 11% 1 2% 8 7% Mental Health Poor 0 0 0 0 0 0 Mental Health Very Poor 0 0 0 0 0 0 Mental Health
MANEESHA and UMA DEVI
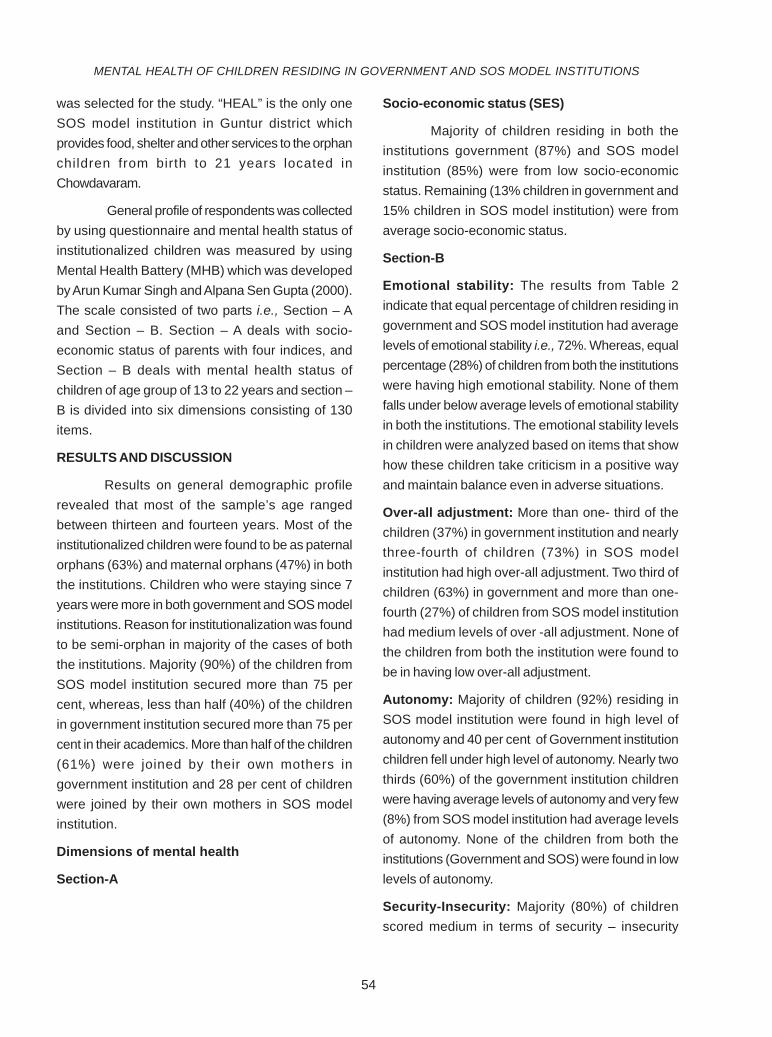
54
was selected for the study. “HEAL” is the only oneSOS model institution in Guntur district whichprovides food, shelter and other services to the orphanchildren from birth to 21 years located inChowdavaram.
General profile of respondents was collectedby using questionnaire and mental health status ofinstitutionalized children was measured by usingMental Health Battery (MHB) which was developedby Arun Kumar Singh and Alpana Sen Gupta (2000).The scale consisted of two parts i.e., Section – Aand Section – B. Section – A deals with socio-economic status of parents with four indices, andSection – B deals with mental health status ofchildren of age group of 13 to 22 years and section –B is divided into six dimensions consisting of 130items.
RESULTS AND DISCUSSION
Results on general demographic profilerevealed that most of the sample’s age rangedbetween thirteen and fourteen years. Most of theinstitutionalized children were found to be as paternalorphans (63%) and maternal orphans (47%) in boththe institutions. Children who were staying since 7years were more in both government and SOS modelinstitutions. Reason for institutionalization was foundto be semi-orphan in majority of the cases of boththe institutions. Majority (90%) of the children fromSOS model institution secured more than 75 percent, whereas, less than half (40%) of the childrenin government institution secured more than 75 percent in their academics. More than half of the children(61%) were joined by their own mothers ingovernment institution and 28 per cent of childrenwere joined by their own mothers in SOS modelinstitution.
Dimensions of mental health
Section-A
Socio-economic status (SES)
Majority of children residing in both theinstitutions government (87%) and SOS modelinstitution (85%) were from low socio-economicstatus. Remaining (13% children in government and15% children in SOS model institution) were fromaverage socio-economic status.
Section-B
Emotional stability: The results from Table 2indicate that equal percentage of children residing ingovernment and SOS model institution had averagelevels of emotional stability i.e., 72%. Whereas, equalpercentage (28%) of children from both the institutionswere having high emotional stability. None of themfalls under below average levels of emotional stabilityin both the institutions. The emotional stability levelsin children were analyzed based on items that showhow these children take criticism in a positive wayand maintain balance even in adverse situations.
Over-all adjustment: More than one- third of thechildren (37%) in government institution and nearlythree-fourth of children (73%) in SOS modelinstitution had high over-all adjustment. Two third ofchildren (63%) in government and more than one-fourth (27%) of children from SOS model institutionhad medium levels of over -all adjustment. None ofthe children from both the institution were found tobe in having low over-all adjustment.
Autonomy: Majority of children (92%) residing inSOS model institution were found in high level ofautonomy and 40 per cent of Government institutionchildren fell under high level of autonomy. Nearly twothirds (60%) of the government institution childrenwere having average levels of autonomy and very few(8%) from SOS model institution had average levelsof autonomy. None of the children from both theinstitutions (Government and SOS) were found in lowlevels of autonomy.
Security-Insecurity: Majority (80%) of childrenscored medium in terms of security – insecurity
MENTAL HEALTH OF CHILDREN RESIDING IN GOVERNMENT AND SOS MODEL INSTITUTIONS
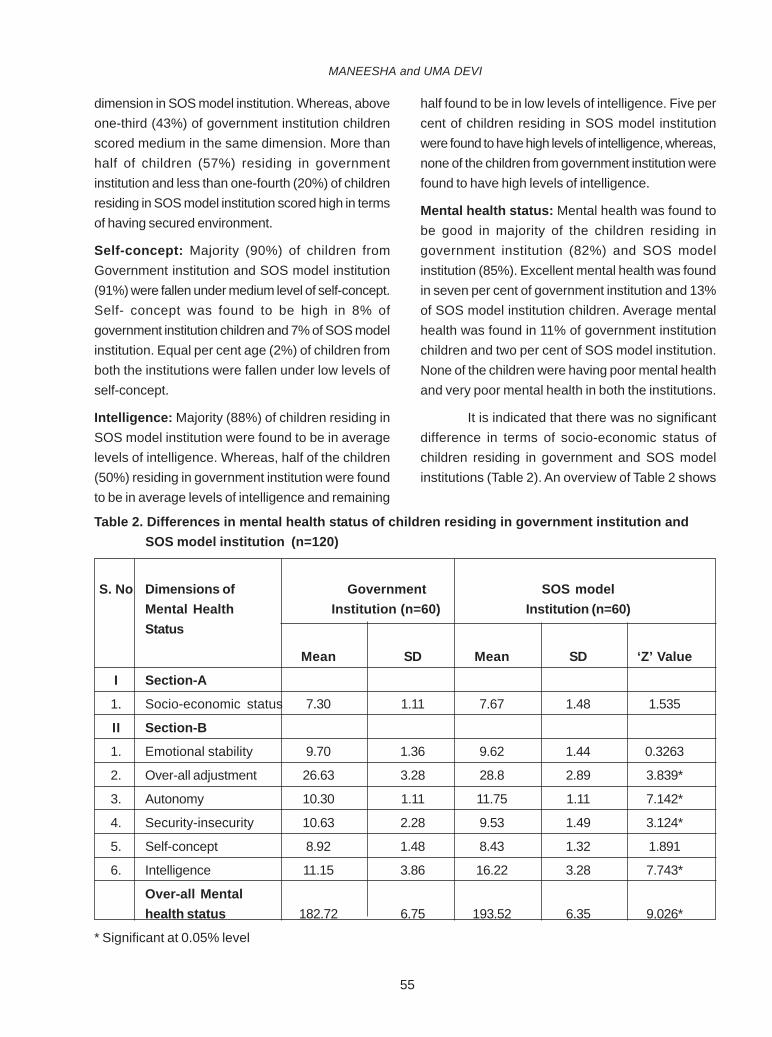
55
dimension in SOS model institution. Whereas, aboveone-third (43%) of government institution childrenscored medium in the same dimension. More thanhalf of children (57%) residing in governmentinstitution and less than one-fourth (20%) of childrenresiding in SOS model institution scored high in termsof having secured environment.
Self-concept: Majority (90%) of children fromGovernment institution and SOS model institution(91%) were fallen under medium level of self-concept.Self- concept was found to be high in 8% ofgovernment institution children and 7% of SOS modelinstitution. Equal per cent age (2%) of children fromboth the institutions were fallen under low levels ofself-concept.
Intelligence: Majority (88%) of children residing inSOS model institution were found to be in averagelevels of intelligence. Whereas, half of the children(50%) residing in government institution were foundto be in average levels of intelligence and remaining
half found to be in low levels of intelligence. Five percent of children residing in SOS model institutionwere found to have high levels of intelligence, whereas,none of the children from government institution werefound to have high levels of intelligence.
Mental health status: Mental health was found tobe good in majority of the children residing ingovernment institution (82%) and SOS modelinstitution (85%). Excellent mental health was foundin seven per cent of government institution and 13%of SOS model institution children. Average mentalhealth was found in 11% of government institutionchildren and two per cent of SOS model institution.None of the children were having poor mental healthand very poor mental health in both the institutions.
It is indicated that there was no significantdifference in terms of socio-economic status ofchildren residing in government and SOS modelinstitutions (Table 2). An overview of Table 2 shows
Table 2. Differences in mental health status of children residing in government institution and SOS model institution (n=120)
S. No Dimensions of Government SOS modelMental Health Institution (n=60) Institution (n=60)Status
Mean SD Mean SD ‘Z’ Value
I Section-A
1. Socio-economic status 7.30 1.11 7.67 1.48 1.535
II Section-B
1. Emotional stability 9.70 1.36 9.62 1.44 0.3263
2. Over-all adjustment 26.63 3.28 28.8 2.89 3.839*
3. Autonomy 10.30 1.11 11.75 1.11 7.142*
4. Security-insecurity 10.63 2.28 9.53 1.49 3.124*
5. Self-concept 8.92 1.48 8.43 1.32 1.891
6. Intelligence 11.15 3.86 16.22 3.28 7.743*
Over-all Mentalhealth status 182.72 6.75 193.52 6.35 9.026*
* Significant at 0.05% level
MANEESHA and UMA DEVI
56
that children residing in government and SOS modelinstitution differed significantly in the dimensions ofmental health like over-all adjustment, autonomy,security-insecurity and intelligence.
Over-all adjustment: It was observed that childrenresiding in SOS model institution had a high meanscore(Z value=3.839) in over-all adjustment comparedto the children residing in government institutionwhich infers that children residing in SOS modelinstitution were having better over-all adjustmentcompared to children residing in SOS modelinstitution. Saraswati and Gaonkar (2008) in theirstudy revealed that majority of the institutionalchildren had unsatisfactory social, emotional andeducational adjustment and very few of them hadgood adjustment. Further, their age and academicperformance had significant influence on adjustment.The adjustment of different types of abused childrenand their different periods of stay in the institutiondid not differ significantly.
Autonomy: It was evident that there was a significantdifference between children residing in governmentand SOS model institutions favouring children residingin SOS model institution (Z value =7.142).Thesedifferences might be due to the presence of fosteringenvironment in SOS model institution.
Security-insecurity: Significant difference impliedthat the children of government institution scoredbetter(Z value=3.124) in security-insecurity whichrefers to a high sense of safety, confidence, freedomfrom fear, apprehension or anxiety particularly withrespect to fulfilling the person’s present or futureneeds.
Intelligence: Children from SOS model institutionwere found to have better intelligence score(Zvalue=7.743) than children of government institution.This might be because of implementing scheduledtime table and due to the presence of evening tuitionsin SOS model institutions. Kreppner et al. (2007)reported that the poor conditions and deprivation
encountered by children in Romanian ‘children’shomes’ prepared them intellectually and sociallydisadvantage even after six years. Whereas, childrenwho were placed in family based care before the ageof six months have shown significant improvement.Children who were placed later made significantimprovements in their development after leavinginstitutional care, but were still at an intellectual andsocial behavior disadvantage six years later. Anoverview of the Table 2 shows that children residingin government and SOS model institution did notdiffered significantly in the dimensions of mentalhealth like emotional stability and self-concept.
Emotional stability: Though there was no significantdifference between government and SOS modelinstitution children related to emotional stability.However, the mean values showed that children fromgovernment institution reported better emotionalstability compared with the children residing in SOSmodel institution. The emotional component isusually reflected in increased resentment, sharp,sometimes hysterical reactions to the mostinnocuous external “irritants”. Low emotional stabilitynoticeably complicates a child’s communication withthe outer world, which can lead to isolation and allsorts of geeky, inappropriate behaviour, up to criminal.Bhat (2014) reported that the orphans and non-orphansecondary school students do not differ significantlyin emotional stability. Bhat also found that 34% ofadolescent orphans showed low level, 48.66%average level and 17.33% had high level of emotionalstability. In comparision, 48% of non-orphans showlow level, 36% average and 16% of high level ofemotional stability.
Self-concept: It was observed that there was nosignificant difference in level of self-concept betweengovernment and SOS model institutionalizedchildren. Vacaru et al. (2017) reported that institution– reared children with disturbed attachmentbehaviours were likely to have a negative perceptionof self and one’s own competences.The findings
MENTAL HEALTH OF CHILDREN RESIDING IN GOVERNMENT AND SOS MODEL INSTITUTIONS
57
provided an important empirical evidence in supportof the notion that disturbed attachment ofinstitutionalized children is associated with poor self-concept and point to a potentially importantunderlying mechanism through which these effectsoccur, namely, exploratory behaviours.
Results showed that there was a significantdifference between over-all mental health status ofchildren residing in government institution and SOSmodel institution in Guntur district. Based on meanvalues we can assume that children residing in SOSmodel had better mental health compared to childrenresiding in government institution. The results werein line with the study on Karachi SOS conducted byLassi et al. (2011) who reported that the SOS villagecan be used as a model facility for orphan children.Their philosophy of providing children with a mother,siblings and home can be applied to otherorphanages as it has shown some positive impacton the child’s mental and social development.
CONCLUSION
Results showed significant difference (Zvalue= 9.026) between mental health status ofchildren residing in government institution and SOSmodel institution favouring children residing in SOSmodel institution.
REFERENCES
Bhatt, M.N.2014.A study of emotional stability anddepression in orphan secondary schoolstudents. International Journal of Education
and Psychological Research (IJEPR).3(2):95-100.
Kreppner, J.M., Rutter, M., Beckett, C., Castle, J.,Colvert, E., Groothues, C and Sonuga-Barke, E.J.S. 2007.Normality andimpairment following profound earlyinstitutional deprivation: A longitudinal follow-up into early adolescence. DevelopmentalPsychology. 43:931–946.
Lassi,Z.S., Mahmud,S., Syed,E.U and Janjua, N.Z.2011.Behavioural problems among childrenliving in orphanage facilities of Karachi,Pakisthan : Comparision of children in anSOS village with those in conventionalorphanages. Social Psychiatry andEpidemiology. 46(8):787-96.
Saraswati,C., Hunshal and Gaonkar, V.2008. A studyon adjustment of institutionalized children.Karnataka Journal of Agricultural Sciences.21(4):548-552.
Singh, A.K and Gupta, A.S. 2000. Mental HealthBattery. National PsychologicalCorporation, Agra, India. pp. 1-12.
Vacaru, V.S., Sterkenburg, P.S. and Schuengel,C.2017. Self-concept in institutionalizedchildren with disturbed attachment: Themediating role of exploratory behaviours.Child: Care Health and Development.pp.1-9.
MANEESHA and UMA DEVI
58
INTRODUCTION
In order to address issues of degradation ofnatural resources, rainwater runoff, soil erosion,floods, frequent droughts and desertification, reducedforest cover, low agricultural productivity, poor waterquantity and quality, and poor access to land andrelated resources, an integrated watershedmanagement approach is found to be an appropriatesolution world over (Paul Bhaskar et al., 2014). InIndia, the Department of Land Resources (DoLR),under the Ministry of Rural Development (MoRD),has been implementing the Integrated WatershedManagement Programme (IWMP) since 2009. InAndhra Pradesh, the Department of RuralDevelopment through the State Level Nodal Agency(SLNA) is implementing 372 watershed projects withan outlay of Rs.1985.16 crores covering an extent of15.83 lakh ha in five batches from 2009-10 to 2013-2014.
As detailed in the Common Guidelines forWatershed Management Projects (2011), theoutcomes are prevention of rain water run-off and soil
IMPACT OF ENTRY POINT ACTIVITIES ON LIFESTYLE CHANGES INTRIBALS OF WATERSHED PROGRAMME
P. RANJITBASHA, M. SIVA PRASAD, B. VENKATESULU NAIK, S.V.N. RAO,D.V.S.R.L. REKHA* and B. MAHESH
Water and Power Consultancy Services Limited, Ministry of Water Resources,River Development and Ganga Rejuvenation, Hyderabad- 500 004
Date of Receipt: 30.06.2018 Date of Acceptance: 29.08.2018
ABSTRACTThe study on life style changes has been conducted to assess the impact of the Entry Point Activities (EPA) taken up
during the preparatory phase of the Pradhan Mantri Krishi Sinchai Yojana (PMKSY) Watershed Programme for selected tribalcommunity in Addangi watershed in Srikakulam District. Preliminary data of the project was obtained through secondary publishedsources/records of District Watershed Management Agency (DWMA), Watershed Computer Centre (WCC) and State Level NodalAgency (SLNA) and primary data was collected through Participatory Rural Appraisal (PRA) techniques. Extension of pipe linesfor drinking water supply and weighing machines were selected as Entry Point Activities based on location requirements. Incomegeneration activities and life style parameters were considered for analysing the impact of EPA on life style changes in tribalareas. The analysis revealed that there is an increase in the income to some extent directly or indirectly as perceived by selectedfarmers due to EPA through supply of weighing machines and laying pipelines for drinking water facility which will reflect on theirday to day life styles of tribal people. It was also clear that there is marginal change in their life style.
*Corresponding Author E-mail: [email protected]
J.Res. ANGRAU 46(3) 58-65, 2018
loss, regeneration of natural vegetation, rain waterharvesting and recharging of the ground water table.This enables multi-cropping and the introduction ofdiverse agro-based activities which would lead toimproved biophysical and socio-economicenvironment through increased agricultural and alliedsector productivity, that help to provide sustainableand alternative livelihoods to watershed communitiesin the rainfed rural areas. In the Pradhan Mantri KrishiSinchai Yojana (PMKSY) mission, watershedsinvolvement of primary stakeholders is at the centreof planning, budgeting, implementation, andmanagement of watershed projects. Communityorganizations such as Watershed Committees (WC),Self help Groups (SHG), User Groups (UG) areclosely associated with and accountable to GramSabhas in project activities.
The project duration is in the range of 4 yearsto 7 years depending upon nature of activities spreadover 3 distinct phases, viz., preparatory phase (1 to2 years), works phase (2 to 3 years) andconsolidation and withdrawal (1 to 2 years) phase.
59
The major objective of preparatory phase is to buildappropriate mechanisms for adoption of participatoryapproach and empowerment of local institutions (WC,SHG, and UG). Watershed Development Team (WDT)will assume a facilitating role during this phase. Inthis phase, the main activities will include taking upof Entry Point Activities (EPA) in the watershed areas,where there is a provision of 4% of the project fundsfor the EPA during the preparatory phase.
Role of EPA in Watershed Management:
The EPAs are the project initiation activitiesthat make the village community feel the entry of thewatershed project in the village. It helps in confidencebuilding among the village community about theproject. Organizing meetings, pasting posters,distributing pamphlets are various means of projectinitiation activities for creating awareness amongstthe village community about watershed project andconfidence building, faith development in watershedproject. The EPA activities are striking for villagecommunity as they address location specific urgentneeds. Community get mobilized and the confidencebuilding process will be strengthened.
Points to be considered while selecting EPA
The EPA should be selected in openmeetings based on the priority of the villagecommunity and it must be approved by the watershedmanagement committee (WC). However, theWatershed Development Team (WDT) membersshould play a facilitating role in selection of EPA.The EPA works taken up should have a direct impacton village community rather than indirect and timetaking impact. EPA should preferably be done in allrevenue villages of the project area so that thepublicity of entry of project in village can be done inthe entire watershed area. EPA should clearly bedisplayed in the form of wall painting or board. EPAmay be a bundle of different activities and notnecessarily a single activity for a village. EPA neednot be capital intensive. No cost or low cost activitiescan be taken up.
Entry Point Activities were taken up in allthe PMKSY Watershed Projects during thepreparatory phase. However, the impact of these EPAactivities particularly on the life style changes in thetribal area watersheds were not studied in detail. Inthis study an effort has been made to assess theimpact of EPA in the tribal dominated areas.
Keeping these in view, the study wasconducted with the objectives of i) to assess theincremental income generated through EPA in thetribal dominated hilly areas of Srikakulam district ofAndhra Pradesh and ii) to analyse the change in lifestyles of the households in the selected tribal area.
MATERIAL AND METHODS
Srikakulam district of Andhra Pradesh waspurposively selected for the study as this is the onlydistrict in north coastal area where PMKSYWatershed Programmes have been implementedduring 2009-10 to 2012-13. Further, among the 4th
batch projects, one project out of three, namelyAddangi was selected randomly. The project fallsunder High Altitude & TRIBAL Area Agro-ClimaticZone in the remote Integrated Tribal DevelopmentAuthority (ITDA) area. Again in the project, AddangiMicro Watershed (MWS) having 17 habitations israndomly chosen for the analysis where the PMKSYWatershed is in operation from 2012-13 by the DistrictWatershed Management Agency (DWMA),Srikakulam, Andhra Pradesh.
The EPAs taken up were: 1) Supply of fourweighing machines in four habitations for weighingagricultural produce with a cost of Rs.0.66/- lakhs;and 2) Extension of pipe lines and water storagetanks for supply of drinking water in five habitationscosting Rs.2.15/- lakhs. The location and otherdetails of EPAs are presented in Table 1 and Table2.
To evaluate the impact of EPA, the study ofthe Addangi Micro Watershed was conducted,information on before and after EPA has been
RANJITBASHA et al.
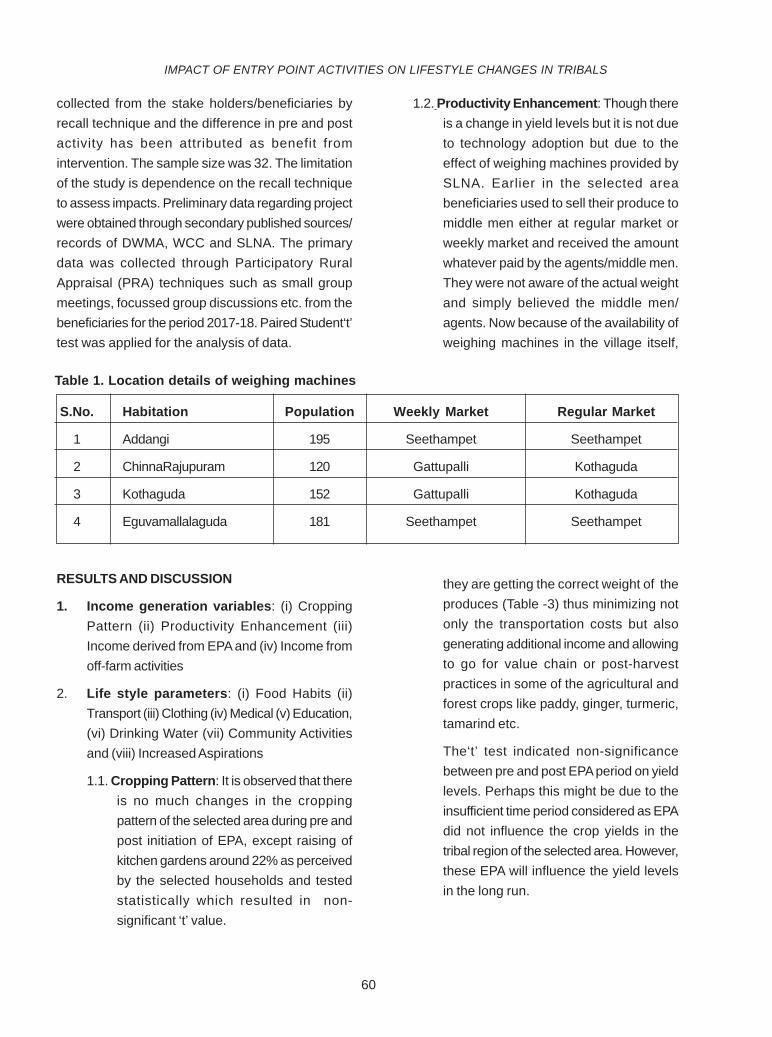
60
collected from the stake holders/beneficiaries byrecall technique and the difference in pre and postactivity has been attributed as benefit fromintervention. The sample size was 32. The limitationof the study is dependence on the recall techniqueto assess impacts. Preliminary data regarding projectwere obtained through secondary published sources/records of DWMA, WCC and SLNA. The primarydata was collected through Participatory RuralAppraisal (PRA) techniques such as small groupmeetings, focussed group discussions etc. from thebeneficiaries for the period 2017-18. Paired Student‘t’test was applied for the analysis of data.
1.2. Productivity Enhancement: Though thereis a change in yield levels but it is not dueto technology adoption but due to theeffect of weighing machines provided bySLNA. Earlier in the selected areabeneficiaries used to sell their produce tomiddle men either at regular market orweekly market and received the amountwhatever paid by the agents/middle men.They were not aware of the actual weightand simply believed the middle men/agents. Now because of the availability ofweighing machines in the village itself,
IMPACT OF ENTRY POINT ACTIVITIES ON LIFESTYLE CHANGES IN TRIBALS
RESULTS AND DISCUSSION
1. Income generation variables: (i) CroppingPattern (ii) Productivity Enhancement (iii)Income derived from EPA and (iv) Income fromoff-farm activities
2. Life style parameters: (i) Food Habits (ii)Transport (iii) Clothing (iv) Medical (v) Education,(vi) Drinking Water (vii) Community Activitiesand (viii) Increased Aspirations
1.1. Cropping Pattern: It is observed that thereis no much changes in the croppingpattern of the selected area during pre andpost initiation of EPA, except raising ofkitchen gardens around 22% as perceivedby the selected households and testedstatistically which resulted in non-significant ‘t’ value.
they are getting the correct weight of theproduces (Table -3) thus minimizing notonly the transportation costs but alsogenerating additional income and allowingto go for value chain or post-harvestpractices in some of the agricultural andforest crops like paddy, ginger, turmeric,tamarind etc.
The‘t’ test indicated non-significancebetween pre and post EPA period on yieldlevels. Perhaps this might be due to theinsufficient time period considered as EPAdid not influence the crop yields in thetribal region of the selected area. However,these EPA will influence the yield levelsin the long run.
Table 1. Location details of weighing machines
S.No. Habitation Population Weekly Market Regular Market
1 Addangi 195 Seethampet Seethampet
2 ChinnaRajupuram 120 Gattupalli Kothaguda
3 Kothaguda 152 Gattupalli Kothaguda
4 Eguvamallalaguda 181 Seethampet Seethampet
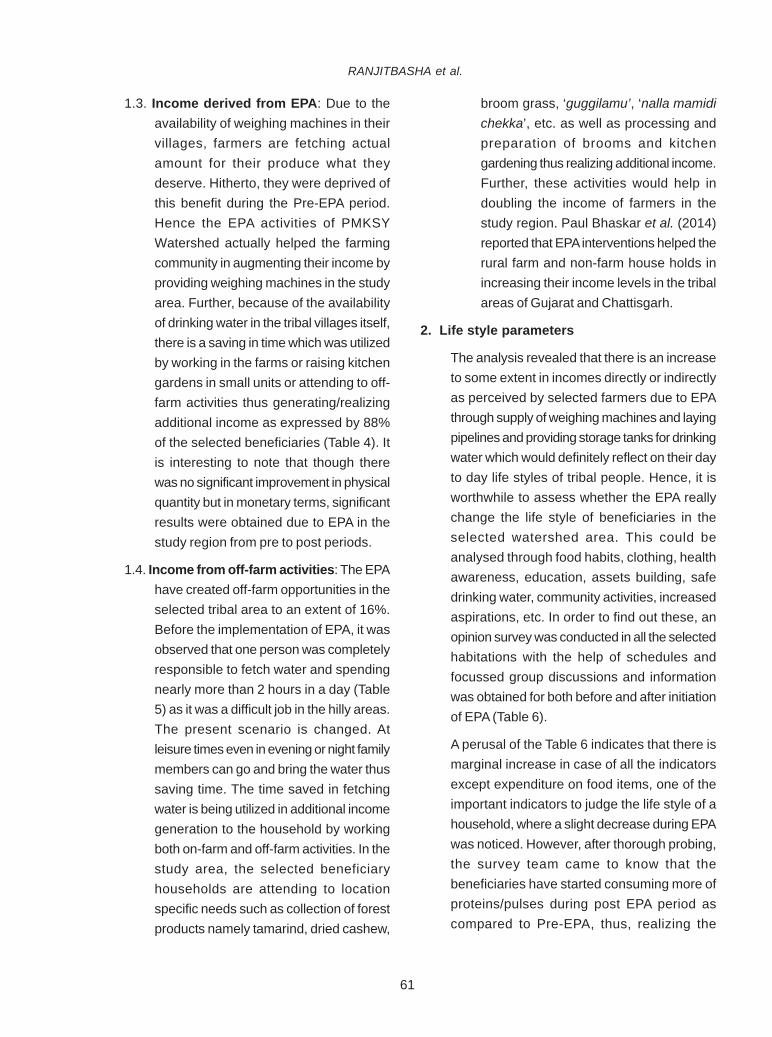
61
1.3. Income derived from EPA: Due to theavailability of weighing machines in theirvillages, farmers are fetching actualamount for their produce what theydeserve. Hitherto, they were deprived ofthis benefit during the Pre-EPA period.Hence the EPA activities of PMKSYWatershed actually helped the farmingcommunity in augmenting their income byproviding weighing machines in the studyarea. Further, because of the availabilityof drinking water in the tribal villages itself,there is a saving in time which was utilizedby working in the farms or raising kitchengardens in small units or attending to off-farm activities thus generating/realizingadditional income as expressed by 88%of the selected beneficiaries (Table 4). Itis interesting to note that though therewas no significant improvement in physicalquantity but in monetary terms, significantresults were obtained due to EPA in thestudy region from pre to post periods.
1.4. Income from off-farm activities: The EPAhave created off-farm opportunities in theselected tribal area to an extent of 16%.Before the implementation of EPA, it wasobserved that one person was completelyresponsible to fetch water and spendingnearly more than 2 hours in a day (Table5) as it was a difficult job in the hilly areas.The present scenario is changed. Atleisure times even in evening or night familymembers can go and bring the water thussaving time. The time saved in fetchingwater is being utilized in additional incomegeneration to the household by workingboth on-farm and off-farm activities. In thestudy area, the selected beneficiaryhouseholds are attending to locationspecific needs such as collection of forestproducts namely tamarind, dried cashew,
broom grass, ‘guggilamu’, ‘nalla mamidichekka’, etc. as well as processing andpreparation of brooms and kitchengardening thus realizing additional income.Further, these activities would help indoubling the income of farmers in thestudy region. Paul Bhaskar et al. (2014)reported that EPA interventions helped therural farm and non-farm house holds inincreasing their income levels in the tribalareas of Gujarat and Chattisgarh.
2. Life style parameters
The analysis revealed that there is an increaseto some extent in incomes directly or indirectlyas perceived by selected farmers due to EPAthrough supply of weighing machines and layingpipelines and providing storage tanks for drinkingwater which would definitely reflect on their dayto day life styles of tribal people. Hence, it isworthwhile to assess whether the EPA reallychange the life style of beneficiaries in theselected watershed area. This could beanalysed through food habits, clothing, healthawareness, education, assets building, safedrinking water, community activities, increasedaspirations, etc. In order to find out these, anopinion survey was conducted in all the selectedhabitations with the help of schedules andfocussed group discussions and informationwas obtained for both before and after initiationof EPA (Table 6).
A perusal of the Table 6 indicates that there ismarginal increase in case of all the indicatorsexcept expenditure on food items, one of theimportant indicators to judge the life style of ahousehold, where a slight decrease during EPAwas noticed. However, after thorough probing,the survey team came to know that thebeneficiaries have started consuming more ofproteins/pulses during post EPA period ascompared to Pre-EPA, thus, realizing the
RANJITBASHA et al.
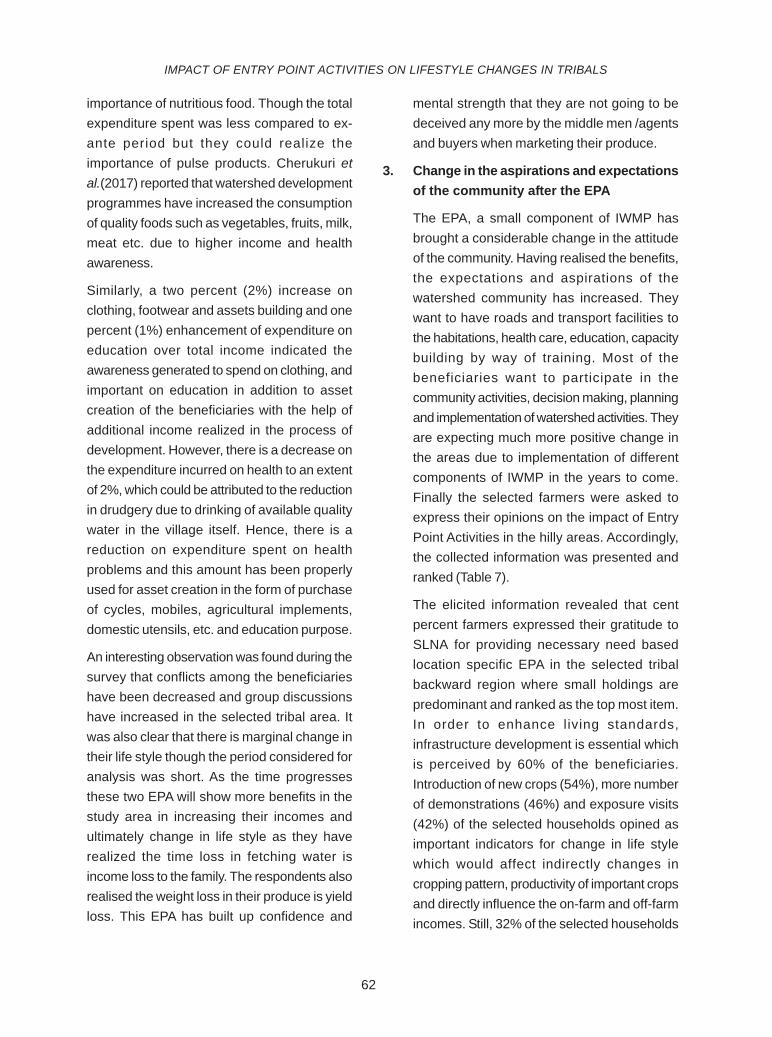
62
importance of nutritious food. Though the totalexpenditure spent was less compared to ex-ante period but they could realize theimportance of pulse products. Cherukuri etal.(2017) reported that watershed developmentprogrammes have increased the consumptionof quality foods such as vegetables, fruits, milk,meat etc. due to higher income and healthawareness.
Similarly, a two percent (2%) increase onclothing, footwear and assets building and onepercent (1%) enhancement of expenditure oneducation over total income indicated theawareness generated to spend on clothing, andimportant on education in addition to assetcreation of the beneficiaries with the help ofadditional income realized in the process ofdevelopment. However, there is a decrease onthe expenditure incurred on health to an extentof 2%, which could be attributed to the reductionin drudgery due to drinking of available qualitywater in the village itself. Hence, there is areduction on expenditure spent on healthproblems and this amount has been properlyused for asset creation in the form of purchaseof cycles, mobiles, agricultural implements,domestic utensils, etc. and education purpose.
An interesting observation was found during thesurvey that conflicts among the beneficiarieshave been decreased and group discussionshave increased in the selected tribal area. Itwas also clear that there is marginal change intheir life style though the period considered foranalysis was short. As the time progressesthese two EPA will show more benefits in thestudy area in increasing their incomes andultimately change in life style as they haverealized the time loss in fetching water isincome loss to the family. The respondents alsorealised the weight loss in their produce is yieldloss. This EPA has built up confidence and
mental strength that they are not going to bedeceived any more by the middle men /agentsand buyers when marketing their produce.
3. Change in the aspirations and expectationsof the community after the EPA
The EPA, a small component of IWMP hasbrought a considerable change in the attitudeof the community. Having realised the benefits,the expectations and aspirations of thewatershed community has increased. Theywant to have roads and transport facilities tothe habitations, health care, education, capacitybuilding by way of training. Most of thebeneficiaries want to participate in thecommunity activities, decision making, planningand implementation of watershed activities. Theyare expecting much more positive change inthe areas due to implementation of differentcomponents of IWMP in the years to come.Finally the selected farmers were asked toexpress their opinions on the impact of EntryPoint Activities in the hilly areas. Accordingly,the collected information was presented andranked (Table 7).
The elicited information revealed that centpercent farmers expressed their gratitude toSLNA for providing necessary need basedlocation specific EPA in the selected tribalbackward region where small holdings arepredominant and ranked as the top most item.In order to enhance living standards,infrastructure development is essential whichis perceived by 60% of the beneficiaries.Introduction of new crops (54%), more numberof demonstrations (46%) and exposure visits(42%) of the selected households opined asimportant indicators for change in life stylewhich would affect indirectly changes incropping pattern, productivity of important cropsand directly influence the on-farm and off-farmincomes. Still, 32% of the selected households
IMPACT OF ENTRY POINT ACTIVITIES ON LIFESTYLE CHANGES IN TRIBALS
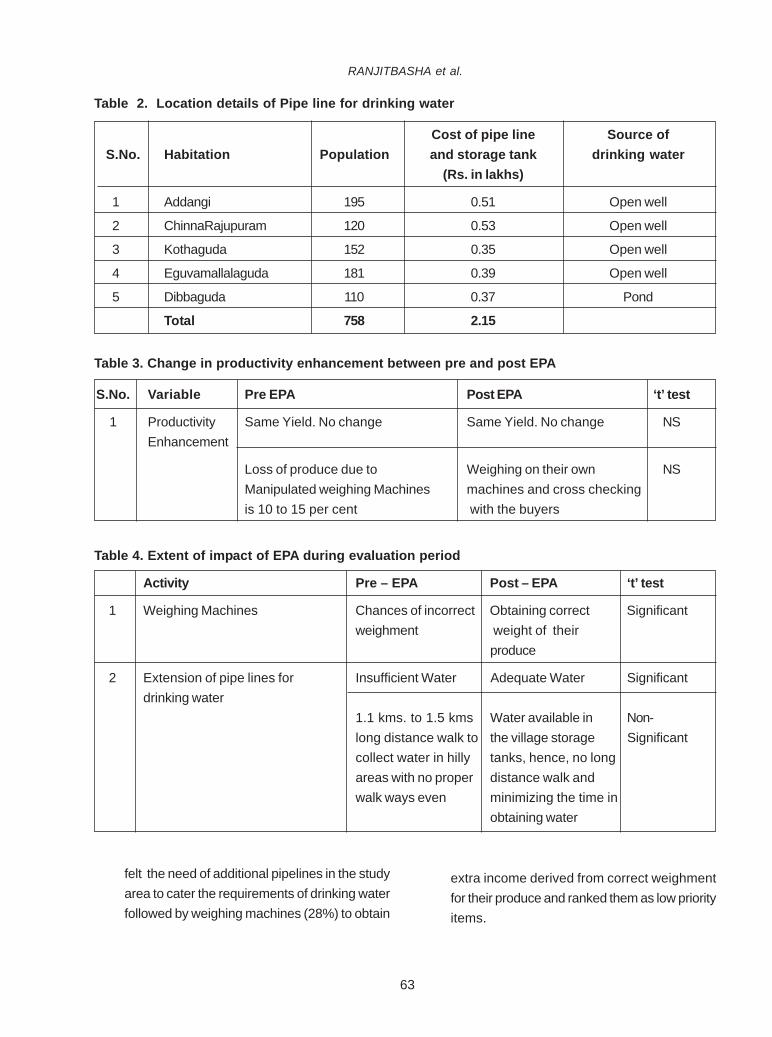
63
Table 2. Location details of Pipe line for drinking water
Cost of pipe line Source of S.No. Habitation Population and storage tank drinking water
(Rs. in lakhs)
1 Addangi 195 0.51 Open well
2 ChinnaRajupuram 120 0.53 Open well
3 Kothaguda 152 0.35 Open well
4 Eguvamallalaguda 181 0.39 Open well
5 Dibbaguda 110 0.37 Pond
Total 758 2.15
Table 3. Change in productivity enhancement between pre and post EPA
S.No. Variable Pre EPA Post EPA ‘t’ test
1 Productivity Same Yield. No change Same Yield. No change NSEnhancement
Loss of produce due to Weighing on their own NSManipulated weighing Machines machines and cross checkingis 10 to 15 per cent with the buyers
Table 4. Extent of impact of EPA during evaluation period
Activity Pre – EPA Post – EPA ‘t’ test
1 Weighing Machines Chances of incorrect Obtaining correct Significantweighment weight of their
produce
2 Extension of pipe lines for Insufficient Water Adequate Water Significantdrinking water
1.1 kms. to 1.5 kms Water available in Non-long distance walk to the village storage Significantcollect water in hilly tanks, hence, no longareas with no proper distance walk andwalk ways even minimizing the time in
obtaining water
RANJITBASHA et al.
felt the need of additional pipelines in the studyarea to cater the requirements of drinking waterfollowed by weighing machines (28%) to obtain
extra income derived from correct weighmentfor their produce and ranked them as low priorityitems.
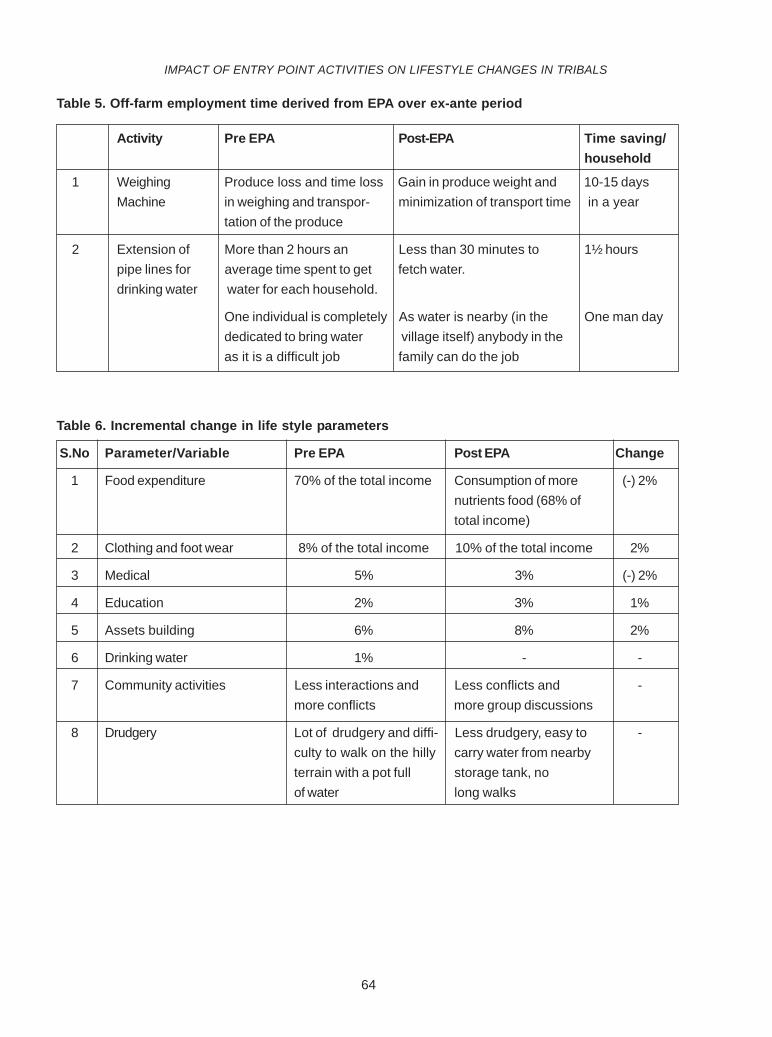
64
Table 5. Off-farm employment time derived from EPA over ex-ante period
Activity Pre EPA Post-EPA Time saving/household
1 Weighing Produce loss and time loss Gain in produce weight and 10-15 daysMachine in weighing and transpor- minimization of transport time in a year
tation of the produce
2 Extension of More than 2 hours an Less than 30 minutes to 1½ hourspipe lines for average time spent to get fetch water.drinking water water for each household.
One individual is completely As water is nearby (in the One man daydedicated to bring water village itself) anybody in theas it is a difficult job family can do the job
Table 6. Incremental change in life style parameters
S.No Parameter/Variable Pre EPA Post EPA Change
1 Food expenditure 70% of the total income Consumption of more (-) 2%nutrients food (68% oftotal income)
2 Clothing and foot wear 8% of the total income 10% of the total income 2%
3 Medical 5% 3% (-) 2%
4 Education 2% 3% 1%
5 Assets building 6% 8% 2%
6 Drinking water 1% - -
7 Community activities Less interactions and Less conflicts and -more conflicts more group discussions
8 Drudgery Lot of drudgery and diffi- Less drudgery, easy to -culty to walk on the hilly carry water from nearbyterrain with a pot full storage tank, noof water long walks
IMPACT OF ENTRY POINT ACTIVITIES ON LIFESTYLE CHANGES IN TRIBALS
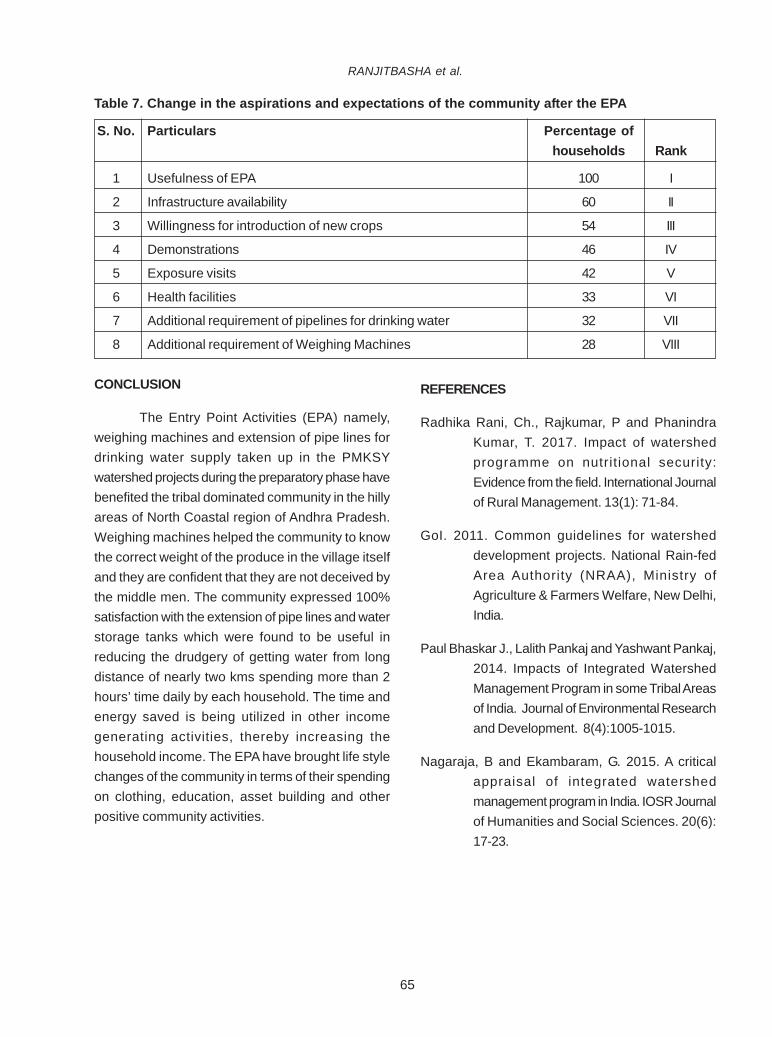
65
CONCLUSION
The Entry Point Activities (EPA) namely,weighing machines and extension of pipe lines fordrinking water supply taken up in the PMKSYwatershed projects during the preparatory phase havebenefited the tribal dominated community in the hillyareas of North Coastal region of Andhra Pradesh.Weighing machines helped the community to knowthe correct weight of the produce in the village itselfand they are confident that they are not deceived bythe middle men. The community expressed 100%satisfaction with the extension of pipe lines and waterstorage tanks which were found to be useful inreducing the drudgery of getting water from longdistance of nearly two kms spending more than 2hours’ time daily by each household. The time andenergy saved is being utilized in other incomegenerating activities, thereby increasing thehousehold income. The EPA have brought life stylechanges of the community in terms of their spendingon clothing, education, asset building and otherpositive community activities.
REFERENCES
Radhika Rani, Ch., Rajkumar, P and PhanindraKumar, T. 2017. Impact of watershedprogramme on nutritional security:Evidence from the field. International Journalof Rural Management. 13(1): 71-84.
GoI. 2011. Common guidelines for watersheddevelopment projects. National Rain-fedArea Authority (NRAA), Ministry ofAgriculture & Farmers Welfare, New Delhi,India.
Paul Bhaskar J., Lalith Pankaj and Yashwant Pankaj,2014. Impacts of Integrated WatershedManagement Program in some Tribal Areasof India. Journal of Environmental Researchand Development. 8(4):1005-1015.
Nagaraja, B and Ekambaram, G. 2015. A criticalappraisal of integrated watershedmanagement program in India. IOSR Journalof Humanities and Social Sciences. 20(6):17-23.
Table 7. Change in the aspirations and expectations of the community after the EPA
S. No. Particulars Percentage ofhouseholds Rank
1 Usefulness of EPA 100 I
2 Infrastructure availability 60 II
3 Willingness for introduction of new crops 54 III
4 Demonstrations 46 IV
5 Exposure visits 42 V
6 Health facilities 33 VI
7 Additional requirement of pipelines for drinking water 32 VII
8 Additional requirement of Weighing Machines 28 VIII
RANJITBASHA et al.
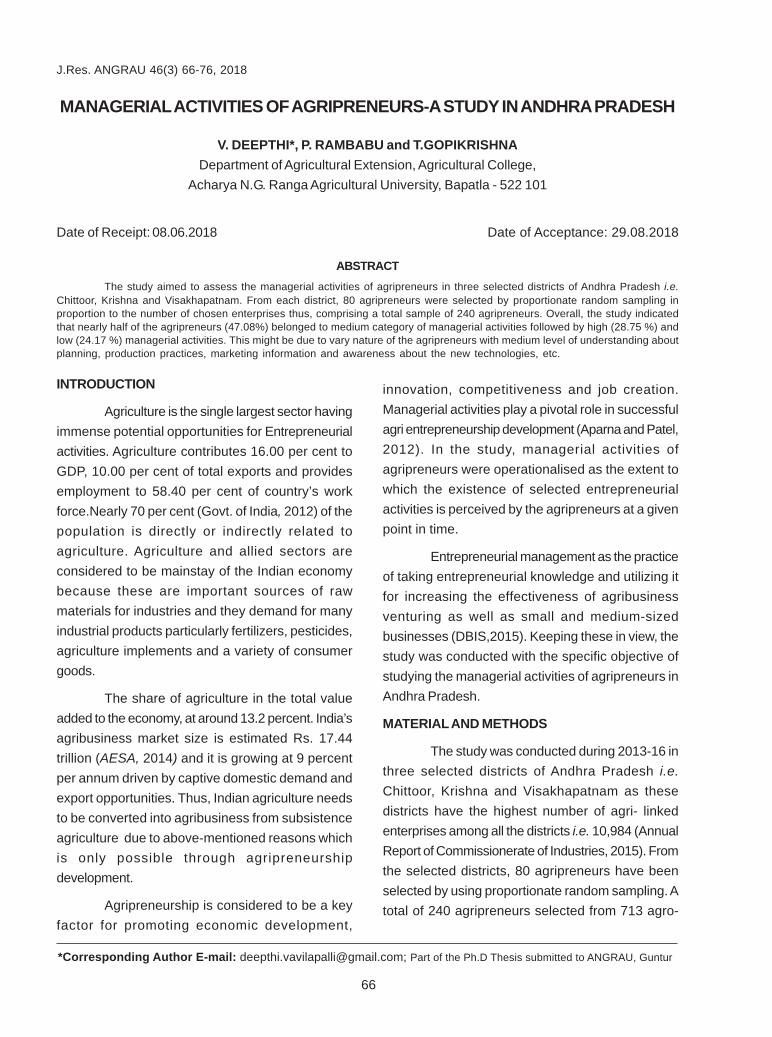
66
INTRODUCTION
Agriculture is the single largest sector havingimmense potential opportunities for Entrepreneurialactivities. Agriculture contributes 16.00 per cent toGDP, 10.00 per cent of total exports and providesemployment to 58.40 per cent of country’s workforce.Nearly 70 per cent (Govt. of India, 2012) of thepopulation is directly or indirectly related toagriculture. Agriculture and allied sectors areconsidered to be mainstay of the Indian economybecause these are important sources of rawmaterials for industries and they demand for manyindustrial products particularly fertilizers, pesticides,agriculture implements and a variety of consumergoods.
The share of agriculture in the total valueadded to the economy, at around 13.2 percent. India’sagribusiness market size is estimated Rs. 17.44trillion (AESA, 2014) and it is growing at 9 percentper annum driven by captive domestic demand andexport opportunities. Thus, Indian agriculture needsto be converted into agribusiness from subsistenceagriculture due to above-mentioned reasons whichis only possible through agripreneurshipdevelopment.
Agripreneurship is considered to be a keyfactor for promoting economic development,
MANAGERIAL ACTIVITIES OF AGRIPRENEURS-A STUDY IN ANDHRA PRADESH
V. DEEPTHI*, P. RAMBABU and T.GOPIKRISHNADepartment of Agricultural Extension, Agricultural College,
Acharya N.G. Ranga Agricultural University, Bapatla - 522 101
Date of Receipt: 08.06.2018 Date of Acceptance: 29.08.2018
ABSTRACTThe study aimed to assess the managerial activities of agripreneurs in three selected districts of Andhra Pradesh i.e.
Chittoor, Krishna and Visakhapatnam. From each district, 80 agripreneurs were selected by proportionate random sampling inproportion to the number of chosen enterprises thus, comprising a total sample of 240 agripreneurs. Overall, the study indicatedthat nearly half of the agripreneurs (47.08%) belonged to medium category of managerial activities followed by high (28.75 %) andlow (24.17 %) managerial activities. This might be due to vary nature of the agripreneurs with medium level of understanding aboutplanning, production practices, marketing information and awareness about the new technologies, etc.
*Corresponding Author E-mail: [email protected]; Part of the Ph.D Thesis submitted to ANGRAU, Guntur
J.Res. ANGRAU 46(3) 66-76, 2018
innovation, competitiveness and job creation.Managerial activities play a pivotal role in successfulagri entrepreneurship development (Aparna and Patel,2012). In the study, managerial activities ofagripreneurs were operationalised as the extent towhich the existence of selected entrepreneurialactivities is perceived by the agripreneurs at a givenpoint in time.
Entrepreneurial management as the practiceof taking entrepreneurial knowledge and utilizing itfor increasing the effectiveness of agribusinessventuring as well as small and medium-sizedbusinesses (DBIS,2015). Keeping these in view, thestudy was conducted with the specific objective ofstudying the managerial activities of agripreneurs inAndhra Pradesh.
MATERIAL AND METHODS
The study was conducted during 2013-16 inthree selected districts of Andhra Pradesh i.e.Chittoor, Krishna and Visakhapatnam as thesedistricts have the highest number of agri- linkedenterprises among all the districts i.e. 10,984 (AnnualReport of Commissionerate of Industries, 2015). Fromthe selected districts, 80 agripreneurs have beenselected by using proportionate random sampling. Atotal of 240 agripreneurs selected from 713 agro-
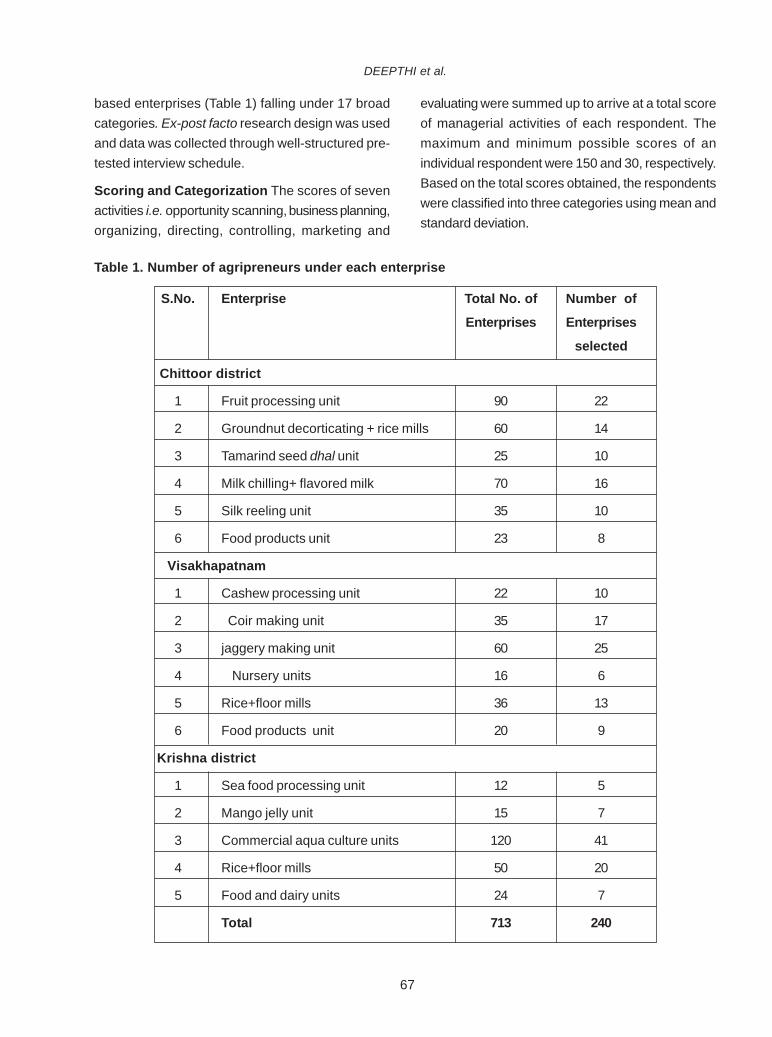
67
based enterprises (Table 1) falling under 17 broadcategories. Ex-post facto research design was usedand data was collected through well-structured pre-tested interview schedule.
Scoring and Categorization The scores of sevenactivities i.e. opportunity scanning, business planning,organizing, directing, controlling, marketing and
Table 1. Number of agripreneurs under each enterprise
S.No. Enterprise Total No. of Number of
Enterprises Enterprises
selected
Chittoor district
1 Fruit processing unit 90 22
2 Groundnut decorticating + rice mills 60 14
3 Tamarind seed dhal unit 25 10
4 Milk chilling+ flavored milk 70 16
5 Silk reeling unit 35 10
6 Food products unit 23 8
Visakhapatnam
1 Cashew processing unit 22 10
2 Coir making unit 35 17
3 jaggery making unit 60 25
4 Nursery units 16 6
5 Rice+floor mills 36 13
6 Food products unit 20 9
Krishna district
1 Sea food processing unit 12 5
2 Mango jelly unit 15 7
3 Commercial aqua culture units 120 41
4 Rice+floor mills 50 20
5 Food and dairy units 24 7
Total 713 240
evaluating were summed up to arrive at a total scoreof managerial activities of each respondent. Themaximum and minimum possible scores of anindividual respondent were 150 and 30, respectively.Based on the total scores obtained, the respondentswere classified into three categories using mean andstandard deviation.
DEEPTHI et al.
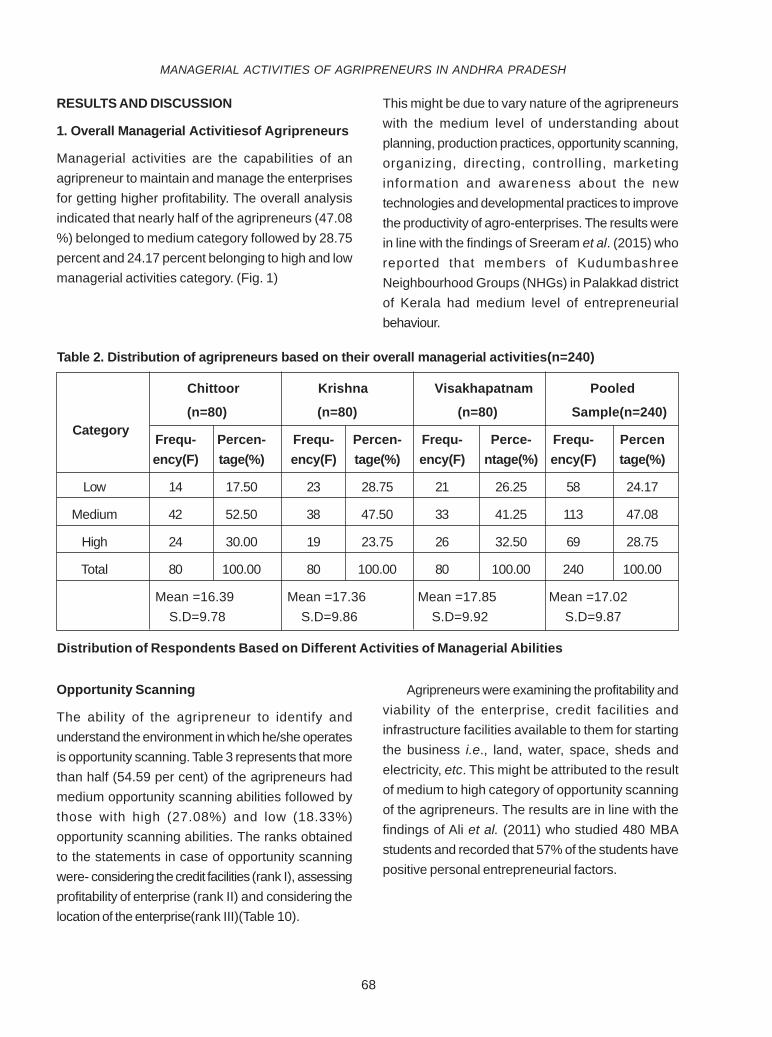
68
RESULTS AND DISCUSSION
1. Overall Managerial Activitiesof Agripreneurs
Managerial activities are the capabilities of anagripreneur to maintain and manage the enterprisesfor getting higher profitability. The overall analysisindicated that nearly half of the agripreneurs (47.08%) belonged to medium category followed by 28.75percent and 24.17 percent belonging to high and lowmanagerial activities category. (Fig. 1)
This might be due to vary nature of the agripreneurswith the medium level of understanding aboutplanning, production practices, opportunity scanning,organizing, directing, controlling, marketinginformation and awareness about the newtechnologies and developmental practices to improvethe productivity of agro-enterprises. The results werein line with the findings of Sreeram et al. (2015) whoreported that members of KudumbashreeNeighbourhood Groups (NHGs) in Palakkad districtof Kerala had medium level of entrepreneurialbehaviour.
Table 2. Distribution of agripreneurs based on their overall managerial activities(n=240)
Chittoor Krishna Visakhapatnam Pooled
(n=80) (n=80) (n=80) Sample(n=240)
Frequ- Percen- Frequ- Percen- Frequ- Perce- Frequ- Percenency(F) tage(%) ency(F) tage(%) ency(F) ntage(%) ency(F) tage(%)
Low 14 17.50 23 28.75 21 26.25 58 24.17
Medium 42 52.50 38 47.50 33 41.25 113 47.08
High 24 30.00 19 23.75 26 32.50 69 28.75
Total 80 100.00 80 100.00 80 100.00 240 100.00
Mean =16.39 Mean =17.36 Mean =17.85 Mean =17.02 S.D=9.78 S.D=9.86 S.D=9.92 S.D=9.87
Distribution of Respondents Based on Different Activities of Managerial Abilities
Category
Opportunity Scanning
The ability of the agripreneur to identify andunderstand the environment in which he/she operatesis opportunity scanning. Table 3 represents that morethan half (54.59 per cent) of the agripreneurs hadmedium opportunity scanning abilities followed bythose with high (27.08%) and low (18.33%)opportunity scanning abilities. The ranks obtainedto the statements in case of opportunity scanningwere- considering the credit facilities (rank I), assessingprofitability of enterprise (rank II) and considering thelocation of the enterprise(rank III)(Table 10).
Agripreneurs were examining the profitability andviability of the enterprise, credit facilities andinfrastructure facilities available to them for startingthe business i.e., land, water, space, sheds andelectricity, etc. This might be attributed to the resultof medium to high category of opportunity scanningof the agripreneurs. The results are in line with thefindings of Ali et al. (2011) who studied 480 MBAstudents and recorded that 57% of the students havepositive personal entrepreneurial factors.
MANAGERIAL ACTIVITIES OF AGRIPRENEURS IN ANDHRA PRADESH
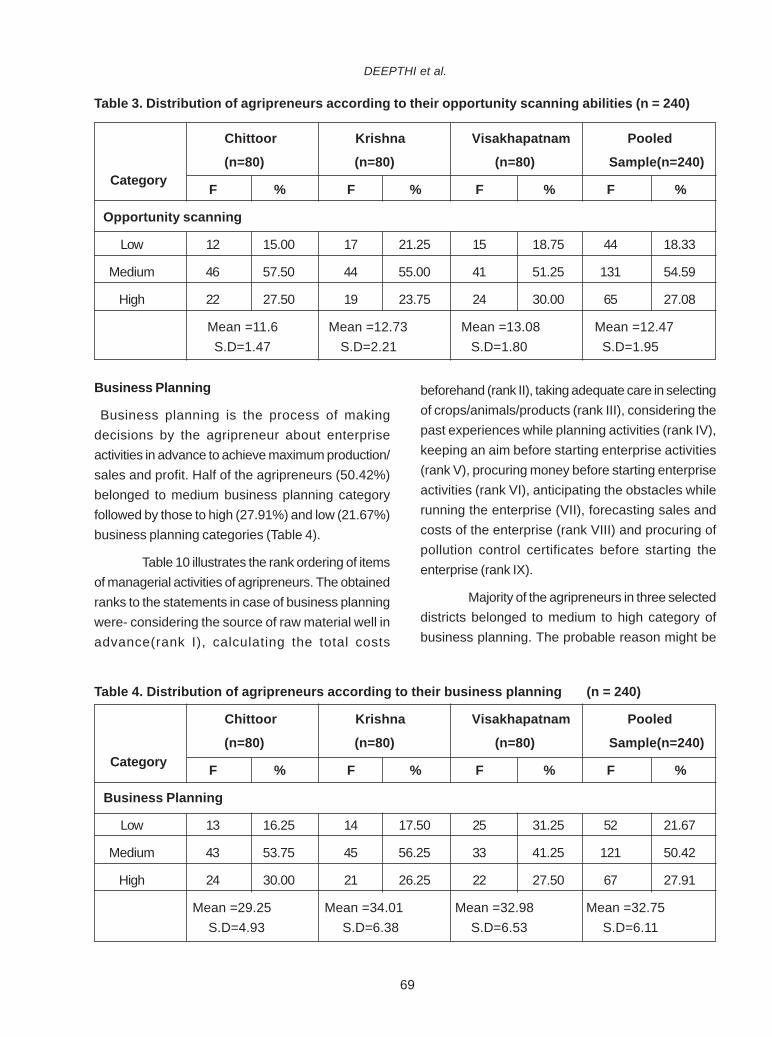
69
Table 3. Distribution of agripreneurs according to their opportunity scanning abilities (n = 240)
Chittoor Krishna Visakhapatnam Pooled
(n=80) (n=80) (n=80) Sample(n=240)
F % F % F % F %
Opportunity scanning
Low 12 15.00 17 21.25 15 18.75 44 18.33
Medium 46 57.50 44 55.00 41 51.25 131 54.59
High 22 27.50 19 23.75 24 30.00 65 27.08
Mean =11.6 Mean =12.73 Mean =13.08 Mean =12.47 S.D=1.47 S.D=2.21 S.D=1.80 S.D=1.95
Business Planning
Business planning is the process of makingdecisions by the agripreneur about enterpriseactivities in advance to achieve maximum production/sales and profit. Half of the agripreneurs (50.42%)belonged to medium business planning categoryfollowed by those to high (27.91%) and low (21.67%)business planning categories (Table 4).
Table 10 illustrates the rank ordering of itemsof managerial activities of agripreneurs. The obtainedranks to the statements in case of business planningwere- considering the source of raw material well inadvance(rank I), calculating the total costs
beforehand (rank II), taking adequate care in selectingof crops/animals/products (rank III), considering thepast experiences while planning activities (rank IV),keeping an aim before starting enterprise activities(rank V), procuring money before starting enterpriseactivities (rank VI), anticipating the obstacles whilerunning the enterprise (VII), forecasting sales andcosts of the enterprise (rank VIII) and procuring ofpollution control certificates before starting theenterprise (rank IX).
Majority of the agripreneurs in three selecteddistricts belonged to medium to high category ofbusiness planning. The probable reason might be
Category
DEEPTHI et al.
Category
Table 4. Distribution of agripreneurs according to their business planning (n = 240)
Chittoor Krishna Visakhapatnam Pooled
(n=80) (n=80) (n=80) Sample(n=240)
F % F % F % F %
Business Planning
Low 13 16.25 14 17.50 25 31.25 52 21.67
Medium 43 53.75 45 56.25 33 41.25 121 50.42
High 24 30.00 21 26.25 22 27.50 67 27.91
Mean =29.25 Mean =34.01 Mean =32.98 Mean =32.75 S.D=4.93 S.D=6.38 S.D=6.53 S.D=6.11
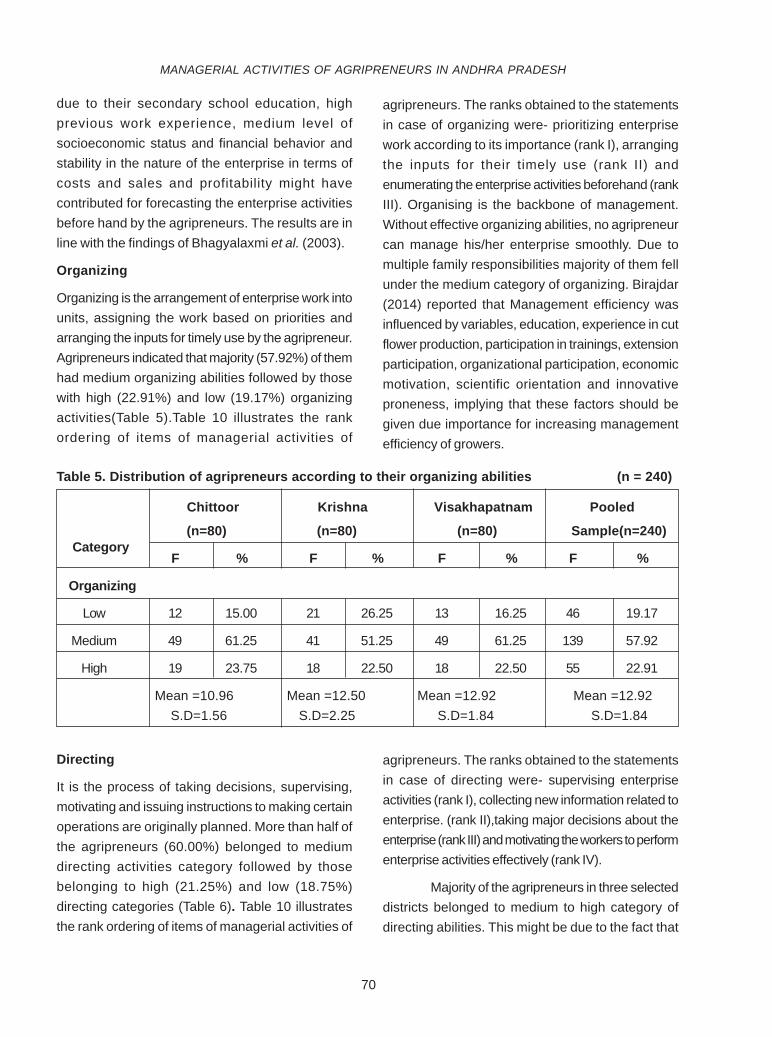
70
due to their secondary school education, highprevious work experience, medium level ofsocioeconomic status and financial behavior andstability in the nature of the enterprise in terms ofcosts and sales and profitability might havecontributed for forecasting the enterprise activitiesbefore hand by the agripreneurs. The results are inline with the findings of Bhagyalaxmi et al. (2003).
Organizing
Organizing is the arrangement of enterprise work intounits, assigning the work based on priorities andarranging the inputs for timely use by the agripreneur.Agripreneurs indicated that majority (57.92%) of themhad medium organizing abilities followed by thosewith high (22.91%) and low (19.17%) organizingactivities(Table 5).Table 10 illustrates the rankordering of items of managerial activities of
agripreneurs. The ranks obtained to the statementsin case of organizing were- prioritizing enterprisework according to its importance (rank I), arrangingthe inputs for their timely use (rank II) andenumerating the enterprise activities beforehand (rankIII). Organising is the backbone of management.Without effective organizing abilities, no agripreneurcan manage his/her enterprise smoothly. Due tomultiple family responsibilities majority of them fellunder the medium category of organizing. Birajdar(2014) reported that Management efficiency wasinfluenced by variables, education, experience in cutflower production, participation in trainings, extensionparticipation, organizational participation, economicmotivation, scientific orientation and innovativeproneness, implying that these factors should begiven due importance for increasing managementefficiency of growers.
Table 5. Distribution of agripreneurs according to their organizing abilities (n = 240)
Category
Chittoor Krishna Visakhapatnam Pooled
(n=80) (n=80) (n=80) Sample(n=240)
F % F % F % F %
Organizing
Low 12 15.00 21 26.25 13 16.25 46 19.17
Medium 49 61.25 41 51.25 49 61.25 139 57.92
High 19 23.75 18 22.50 18 22.50 55 22.91
Mean =10.96 Mean =12.50 Mean =12.92 Mean =12.92 S.D=1.56 S.D=2.25 S.D=1.84 S.D=1.84
MANAGERIAL ACTIVITIES OF AGRIPRENEURS IN ANDHRA PRADESH
Directing
It is the process of taking decisions, supervising,motivating and issuing instructions to making certainoperations are originally planned. More than half ofthe agripreneurs (60.00%) belonged to mediumdirecting activities category followed by thosebelonging to high (21.25%) and low (18.75%)directing categories (Table 6). Table 10 illustratesthe rank ordering of items of managerial activities of
agripreneurs. The ranks obtained to the statementsin case of directing were- supervising enterpriseactivities (rank I), collecting new information related toenterprise. (rank II),taking major decisions about theenterprise (rank III) and motivating the workers to performenterprise activities effectively (rank IV).
Majority of the agripreneurs in three selecteddistricts belonged to medium to high category ofdirecting abilities. This might be due to the fact that
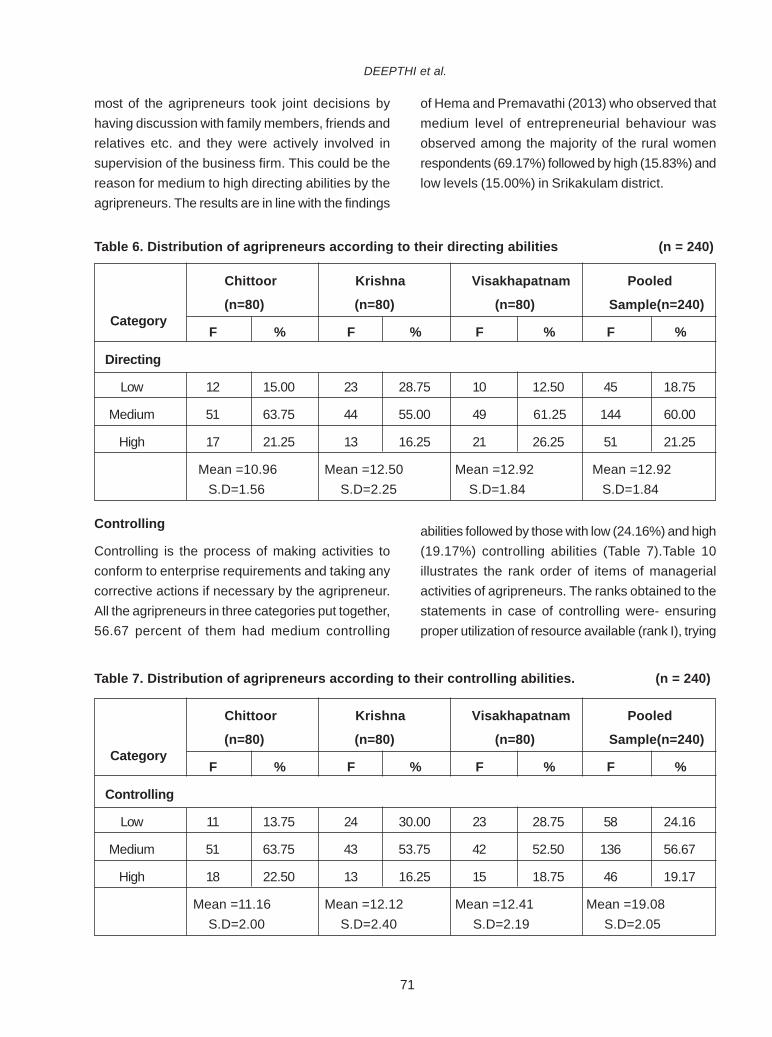
71
most of the agripreneurs took joint decisions byhaving discussion with family members, friends andrelatives etc. and they were actively involved insupervision of the business firm. This could be thereason for medium to high directing abilities by theagripreneurs. The results are in line with the findings
of Hema and Premavathi (2013) who observed thatmedium level of entrepreneurial behaviour wasobserved among the majority of the rural womenrespondents (69.17%) followed by high (15.83%) andlow levels (15.00%) in Srikakulam district.
Category
Chittoor Krishna Visakhapatnam Pooled
(n=80) (n=80) (n=80) Sample(n=240)
F % F % F % F %
Directing
Low 12 15.00 23 28.75 10 12.50 45 18.75
Medium 51 63.75 44 55.00 49 61.25 144 60.00
High 17 21.25 13 16.25 21 26.25 51 21.25
Mean =10.96 Mean =12.50 Mean =12.92 Mean =12.92 S.D=1.56 S.D=2.25 S.D=1.84 S.D=1.84
Controlling
Controlling is the process of making activities toconform to enterprise requirements and taking anycorrective actions if necessary by the agripreneur.All the agripreneurs in three categories put together,56.67 percent of them had medium controlling
Table 6. Distribution of agripreneurs according to their directing abilities (n = 240)
abilities followed by those with low (24.16%) and high(19.17%) controlling abilities (Table 7).Table 10illustrates the rank order of items of managerialactivities of agripreneurs. The ranks obtained to thestatements in case of controlling were- ensuringproper utilization of resource available (rank I), trying
DEEPTHI et al.
Category
Chittoor Krishna Visakhapatnam Pooled
(n=80) (n=80) (n=80) Sample(n=240)
F % F % F % F %
Controlling
Low 11 13.75 24 30.00 23 28.75 58 24.16
Medium 51 63.75 43 53.75 42 52.50 136 56.67
High 18 22.50 13 16.25 15 18.75 46 19.17
Mean =11.16 Mean =12.12 Mean =12.41 Mean =19.08 S.D=2.00 S.D=2.40 S.D=2.19 S.D=2.05
Table 7. Distribution of agripreneurs according to their controlling abilities. (n = 240)
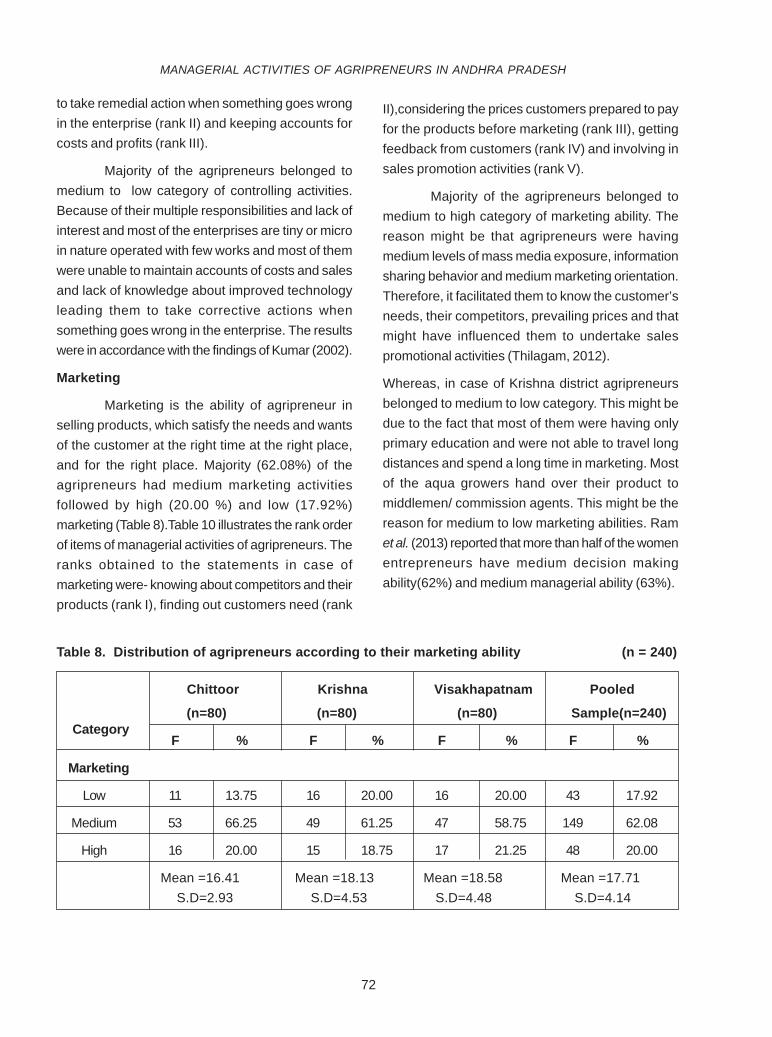
72
to take remedial action when something goes wrongin the enterprise (rank II) and keeping accounts forcosts and profits (rank III).
Majority of the agripreneurs belonged tomedium to low category of controlling activities.Because of their multiple responsibilities and lack ofinterest and most of the enterprises are tiny or microin nature operated with few works and most of themwere unable to maintain accounts of costs and salesand lack of knowledge about improved technologyleading them to take corrective actions whensomething goes wrong in the enterprise. The resultswere in accordance with the findings of Kumar (2002).
Marketing
Marketing is the ability of agripreneur inselling products, which satisfy the needs and wantsof the customer at the right time at the right place,and for the right place. Majority (62.08%) of theagripreneurs had medium marketing activitiesfollowed by high (20.00 %) and low (17.92%)marketing (Table 8).Table 10 illustrates the rank orderof items of managerial activities of agripreneurs. Theranks obtained to the statements in case ofmarketing were- knowing about competitors and theirproducts (rank I), finding out customers need (rank
II),considering the prices customers prepared to payfor the products before marketing (rank III), gettingfeedback from customers (rank IV) and involving insales promotion activities (rank V).
Majority of the agripreneurs belonged tomedium to high category of marketing ability. Thereason might be that agripreneurs were havingmedium levels of mass media exposure, informationsharing behavior and medium marketing orientation.Therefore, it facilitated them to know the customer’sneeds, their competitors, prevailing prices and thatmight have influenced them to undertake salespromotional activities (Thilagam, 2012).
Whereas, in case of Krishna district agripreneursbelonged to medium to low category. This might bedue to the fact that most of them were having onlyprimary education and were not able to travel longdistances and spend a long time in marketing. Mostof the aqua growers hand over their product tomiddlemen/ commission agents. This might be thereason for medium to low marketing abilities. Ramet al. (2013) reported that more than half of the womenentrepreneurs have medium decision makingability(62%) and medium managerial ability (63%).
MANAGERIAL ACTIVITIES OF AGRIPRENEURS IN ANDHRA PRADESH
Category
Chittoor Krishna Visakhapatnam Pooled
(n=80) (n=80) (n=80) Sample(n=240)
F % F % F % F %
Marketing
Low 11 13.75 16 20.00 16 20.00 43 17.92
Medium 53 66.25 49 61.25 47 58.75 149 62.08
High 16 20.00 15 18.75 17 21.25 48 20.00
Mean =16.41 Mean =18.13 Mean =18.58 Mean =17.71 S.D=2.93 S.D=4.53 S.D=4.48 S.D=4.14
Table 8. Distribution of agripreneurs according to their marketing ability (n = 240)
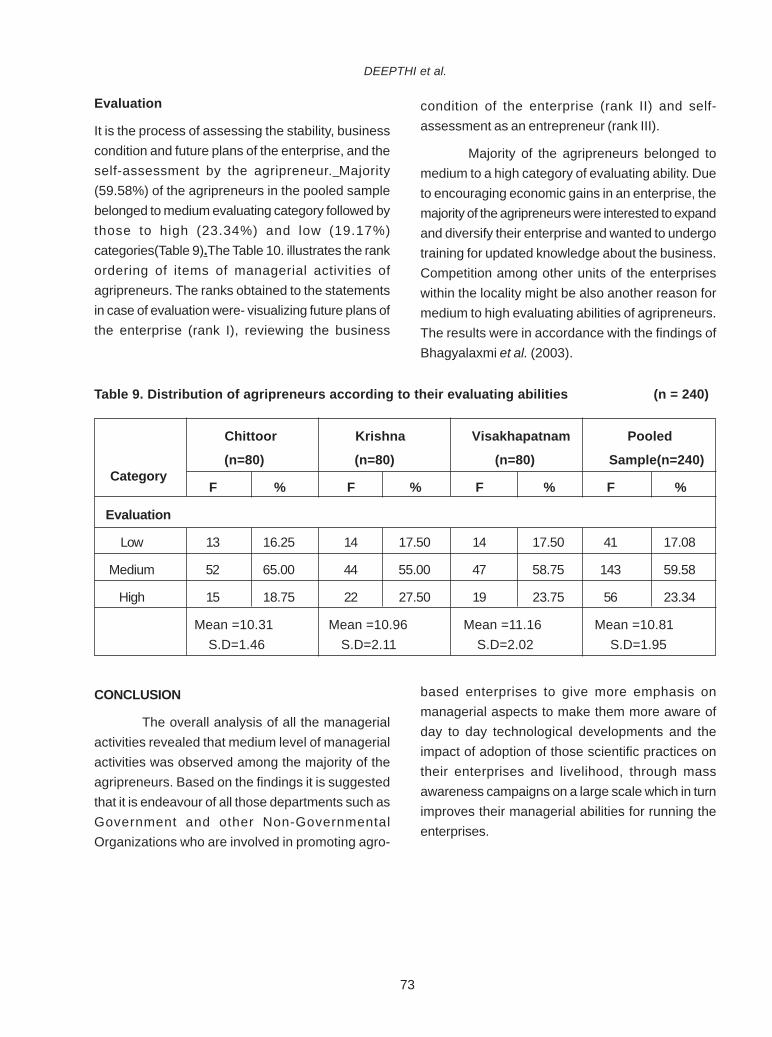
73
Evaluation
It is the process of assessing the stability, businesscondition and future plans of the enterprise, and theself-assessment by the agripreneur. Majority(59.58%) of the agripreneurs in the pooled samplebelonged to medium evaluating category followed bythose to high (23.34%) and low (19.17%)categories(Table 9).The Table 10. illustrates the rankordering of items of managerial activities ofagripreneurs. The ranks obtained to the statementsin case of evaluation were- visualizing future plans ofthe enterprise (rank I), reviewing the business
condition of the enterprise (rank II) and self-assessment as an entrepreneur (rank III).
Majority of the agripreneurs belonged tomedium to a high category of evaluating ability. Dueto encouraging economic gains in an enterprise, themajority of the agripreneurs were interested to expandand diversify their enterprise and wanted to undergotraining for updated knowledge about the business.Competition among other units of the enterpriseswithin the locality might be also another reason formedium to high evaluating abilities of agripreneurs.The results were in accordance with the findings ofBhagyalaxmi et al. (2003).
Category
Chittoor Krishna Visakhapatnam Pooled
(n=80) (n=80) (n=80) Sample(n=240)
F % F % F % F %
Evaluation
Low 13 16.25 14 17.50 14 17.50 41 17.08
Medium 52 65.00 44 55.00 47 58.75 143 59.58
High 15 18.75 22 27.50 19 23.75 56 23.34
Mean =10.31 Mean =10.96 Mean =11.16 Mean =10.81 S.D=1.46 S.D=2.11 S.D=2.02 S.D=1.95
Table 9. Distribution of agripreneurs according to their evaluating abilities (n = 240)
DEEPTHI et al.
CONCLUSION
The overall analysis of all the managerialactivities revealed that medium level of managerialactivities was observed among the majority of theagripreneurs. Based on the findings it is suggestedthat it is endeavour of all those departments such asGovernment and other Non-GovernmentalOrganizations who are involved in promoting agro-
based enterprises to give more emphasis onmanagerial aspects to make them more aware ofday to day technological developments and theimpact of adoption of those scientific practices ontheir enterprises and livelihood, through massawareness campaigns on a large scale which in turnimproves their managerial abilities for running theenterprises.
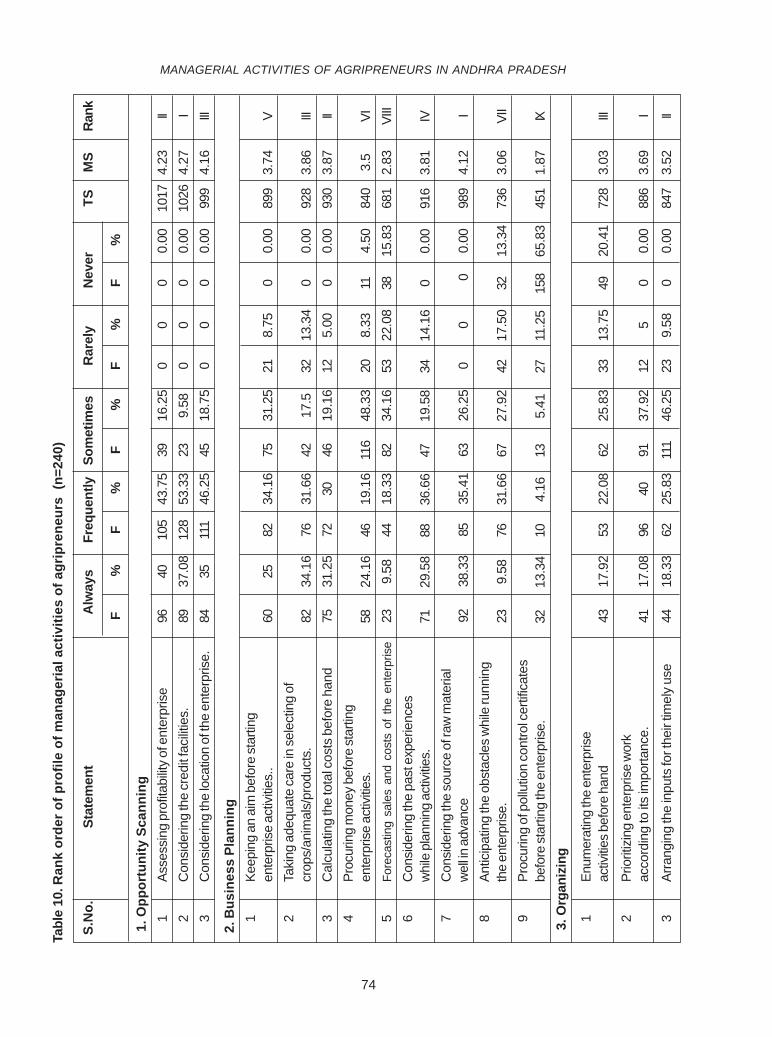
74
Tabl
e 10
. Ran
k or
der o
f pro
file
of m
anag
eria
l act
iviti
es o
f agr
ipre
neur
s (n
=240
)
S.N
o.
S
tate
men
t
A
lway
s
Fr
eque
ntly
So
met
imes
Rar
ely
N
ever
TSM
SRa
nk
F%
F%
F%
F%
F%
1.
Opp
ortu
nity
Sca
nnin
g1
Asse
ssin
g pr
ofita
bilit
y of
ent
erpr
ise
9640
105
43.7
539
16.2
50
00
0.00
1017
4.23
II2
Con
side
ring
the
cred
it fac
ilitie
s.89
37.0
812
853
.33
239.
580
00
0.00
1026
4.27
I3
Con
side
ring
the
loca
tion
of th
e en
terp
rise.
8435
111
46.2
545
18.7
50
00
0.00
999
4.16
III
2.
Bus
ines
s Pl
anni
ng1
Keep
ing
an a
im b
efor
e st
artin
gen
terp
rise
activ
ities.
.60
2582
34.1
675
31.2
521
8.75
00.
0089
93.
74V
2Ta
king
ade
quat
e ca
re in
sel
ectin
g of
crop
s/an
imal
s/pr
oduc
ts.
8234
.16
7631
.66
4217
.532
13.3
40
0.00
928
3.86
III3
Cal
cula
ting
the
tota
l cos
ts b
efor
e ha
nd75
31.2
572
3046
19.1
612
5.00
00.
0093
03.
87II
4Pr
ocur
ing
mon
ey b
efor
e st
artin
gen
terp
rise
activ
ities.
5824
.16
4619
.16
116
48.3
320
8.33
114.
5084
03.
5VI
5Fo
reca
stin
g sa
les
and
cost
s of
the
ente
rpris
e23
9.58
4418
.33
8234
.16
5322
.08
3815
.83
681
2.83
VIII
6C
onsi
derin
g th
e pa
st e
xper
ienc
esw
hile
pla
nnin
g ac
tivitie
s.71
29.5
888
36.6
647
19.5
834
14.1
60
0.00
916
3.81
IV7
Con
side
ring
the
sour
ce o
f raw
mat
eria
lw
ell in
adv
ance
9238
.33
8535
.41
6326
.25
00
0
0.00
989
4.12
I8
Antic
ipat
ing
the
obst
acle
s w
hile
runn
ing
the
ente
rpris
e.23
9.58
7631
.66
6727
.92
4217
.50
3213
.34
736
3.06
VII
9Pr
ocur
ing
of p
ollu
tion
cont
rol c
ertif
icat
esbe
fore
star
ting
the
ente
rpris
e.32
13.3
410
4.16
135.
4127
11.2
515
865
.83
451
1.87
IX
3. O
rgan
izin
g
1En
umer
atin
g th
e en
terp
rise
activ
ities b
efor
e ha
nd43
17.9
253
22.0
862
25.8
333
13.7
549
20.4
172
83.
03III
2Pr
iorit
izin
g en
terp
rise
wor
kac
cord
ing
to it
s im
porta
nce.
4117
.08
9640
9137
.92
125
00.
0088
63.
69I
3Ar
rang
ing
the
inpu
ts fo
r the
ir tim
ely
use
4418
.33
6225
.83
111
46.2
523
9.58
00.
0084
73.
52II
MANAGERIAL ACTIVITIES OF AGRIPRENEURS IN ANDHRA PRADESH
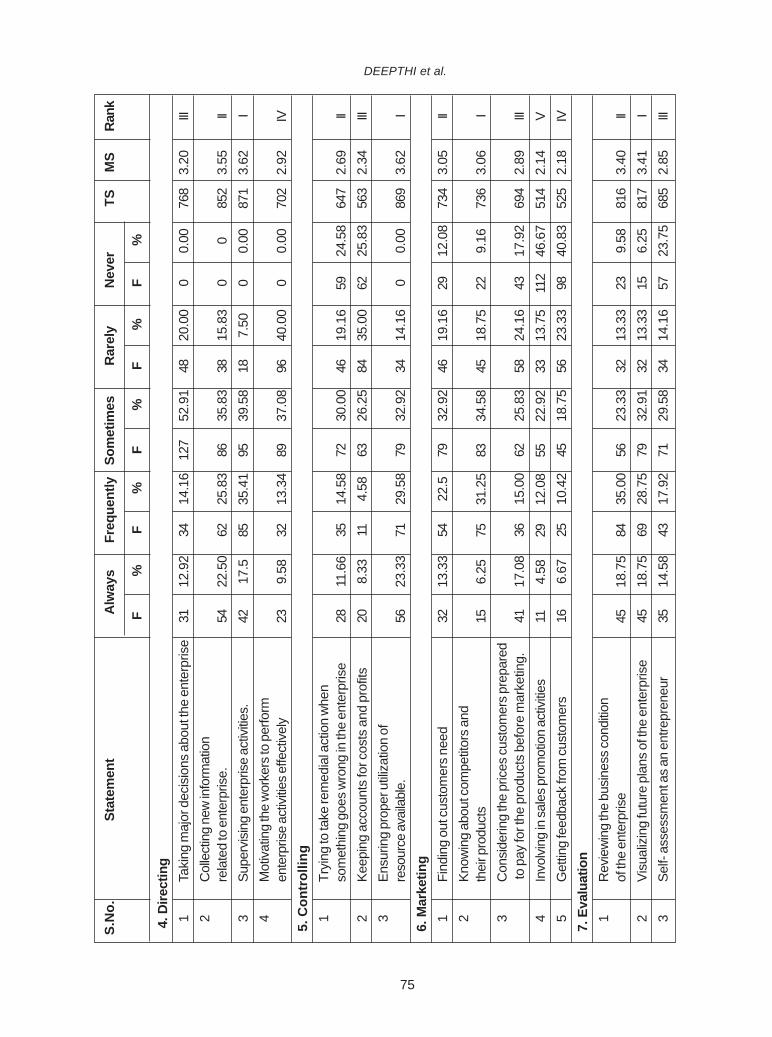
75
S.N
o.
Sta
tem
ent
Alw
ays
Freq
uent
ly
Som
etim
es
R
arel
y
Nev
erTS
MS
Rank
F%
F%
F%
F%
F%
4
. Dire
ctin
g1
Taki
ng m
ajor
dec
isio
ns a
bout
the
ente
rpris
e31
12.9
234
14.1
612
752
.91
4820
.00
00.
0076
83.
20III
2C
olle
ctin
g ne
w in
form
atio
nre
late
d to
ent
erpr
ise.
5422
.50
6225
.83
8635
.83
3815
.83
00
852
3.55
II3
Supe
rvis
ing
ente
rpris
e ac
tivitie
s.42
17.5
8535
.41
9539
.58
187.
500
0.00
871
3.62
I4
Mot
ivat
ing
the
wor
kers
to p
erfo
rmen
terp
rise
activ
ities e
ffect
ivel
y23
9.58
3213
.34
8937
.08
9640
.00
00.
0070
22.
92IV
5.
Con
trol
ling
1Tr
ying
to ta
ke re
med
ial a
ctio
n w
hen
som
ethi
ng g
oes
wro
ng in
the
ente
rpris
e28
11.6
635
14.5
872
30.0
046
19.1
659
24.5
864
72.
69II
2Ke
epin
g ac
coun
ts fo
r cos
ts a
nd p
rofit
s20
8.33
114.
5863
26.2
584
35.0
062
25.8
356
32.
34III
3En
surin
g pr
oper
utili
zatio
n of
reso
urce
ava
ilabl
e.56
23.3
371
29.5
879
32.9
234
14.1
60
0.00
869
3.62
I
6. M
arke
ting
1Fi
ndin
g ou
t cus
tom
ers
need
3213
.33
5422
.579
32.9
246
19.1
629
12.0
873
43.
05II
2Kn
owin
g ab
out c
ompe
titor
s an
dth
eir p
rodu
cts
156.
2575
31.2
583
34.5
845
18.7
522
9.16
736
3.06
I3
Con
side
ring
the
pric
es c
usto
mer
s pr
epar
ed to
pay
for t
he p
rodu
cts
befo
re m
arke
ting.
4117
.08
3615
.00
6225
.83
5824
.16
4317
.92
694
2.89
III4
Invo
lvin
g in
sale
s pro
mot
ion
activ
ities
114.
5829
12.0
855
22.9
233
13.7
511
246
.67
514
2.14
V5
Get
ting
feed
back
from
cus
tom
ers
166.
6725
10.4
245
18.7
556
23.3
398
40.8
352
52.
18IV
7.
Eva
luat
ion
1R
evie
win
g th
e bu
sine
ss co
nditio
nof
the
ente
rpris
e45
18.7
584
35.0
056
23.3
332
13.3
323
9.58
816
3.40
II2
Visu
aliz
ing
futu
re p
lans
of t
he e
nter
pris
e45
18.7
569
28.7
579
32.9
132
13.3
315
6.25
817
3.41
I3
Self-
ass
essm
ent a
s an
ent
repr
eneu
r35
14.5
843
17.9
271
29.5
834
14.1
657
23.7
568
52.
85III
DEEPTHI et al.
76
REFERENCES
AESA.2014. Fostering entrepreneurship throughagribusiness incubation: Role ofextension professionals. Retrieved fromwebsite (http://www.aesa-gfras.net) on11.06.2018.
Ali, Akhtar, Topping, K.J and Riaz, H.T.2011.Entrepreneurial attitudes among potentialentrepreneurs. Pakistan Journal ofCommerce and Social Science. 5(1):12-46.
Commissionerate of Industries. 2015. Annual Report2014-15. Ministry of Micro Small MediumEnterprises. Government of India, NewDelhi.
Govt. of India. 2012. Agricultural Statistics at aGlance. Department of Agriculture andCooperation, Government of India, NewDelhi.
Aparna, J and Patel, H.M. 2012. Entrepreneurialbehaviour of rural women. Indian ResearchJournal of Extension Education. 2(1):55-59.
Bhagyalaxmi, K., Gopalakrishna Rao, V andSudarshan Reddy, M. 2003. Profile of therural women micro-entrepreneurs. TheJournal of Research ANGRAU. 31(4): 51-54.
Birajdar, V. M. 2014. Determinants of managementefficiency of cut flower growers. KarnatakaJournal of Agricultural Science.27(4):489-492.
Department for business innovation and skills(DBIS).2015. Entrepreneurship Skills:literature and policy review. BIS researchpaper no.236. September, 2015.1-10.
Hema, B and Premavathi, S. 2013. Entrepreneurialbehaviour of rural women –A criticalanalysis. Journal of Extension Education.25 (3): 154-159.
Kumar, V.S. 2002. Knowledge and adoption ofrecommended coconut farming practices inThiruvananthapuram District. M.Sc. Thesissubmitted to Annamalai University,Annamalai Nagar.
Leedon, J and Tsang, E. 2001. The effects ofentrepreneurial personality background andnetwork activities on Venture Growth. Journalof Managerial Studies. 38 (4): 583-602.
Ram, D., Singh, M.K., Chauddary, K.P and Jayarani,L. 2013. Entrepreneurial behaviour ofwomen entrepreneurs in Imphal of Manipur.Indian Research Journal of ExtensionEducation. 13(2): 31-35.
Sreeram,V., Prasad,S.V. and Lakshmi,T.2015. AStudy on entrepreneurial behaviour ofKudumbashree Neighbourhood Group(NHG) members in Kerala. Indian ResearchJournal of Extension Education. 15 (2):45-49.
Thilagam, J. 2012. Indicators of agri entrepreneurshipand evaluation of business planning anddevelopment unit-A Diagnostic Study. Ph.DThesis submitted to Tamil Nadu AgriculturalUniversity, Coimbatore.
MANAGERIAL ACTIVITIES OF AGRIPRENEURS IN ANDHRA PRADESH
77
INTRODUCTION
Higher production in agriculture can only beachieved through the adoption of improved agriculturalpractices. This could be possible if the researchfindings are brought to the door step of the end users.A breakthrough in any field of agriculture is notpossible without an effective communication supportto disseminate the research findings. Speedydissemination of agricultural information andtechnological know-how to the farmers is essentialfor bridging the gap between the agriculturalscientists and farming community. The existingextension services are too small to perform their task,so, the print media with its tremendous outreachpotential offer the greatest possibility for effectivecommunication of agricultural technology. Farmpeople are more anxious about the advancement inscience and technology to know what is happeningin the field of agriculture research (Manjula et al.,2015). The Acharya N.G.Ranga Agricultural Universitystarted publishing the Vyavasaya Panchangam(Agriculture Almanac) from the year 1969-70consisting of information on Agriculture and alliedsectors in Telugu with an aim to disseminate andpopularize the scientific methods of agriculture among
FARMERS PERCEPTION TOWARDS UNDERSTANDABILITY ANDPREFERENCES ABOUT CONTENTS OF VYAVASAYA PANCHANGAM
M. VENKATA RAMULU*, P. PUNNARAO, A. LALITHA and K. KIRAN PRAKASHAgricultural Information and Communication Centre,
Acharya N.G. Ranga Agricultural University, Guntur -522 034
Date of Receipt: 25.06.2018 Date of Acceptance: 04.09.2018
ABSTRACTReaders personal characteristics, perception towards understandability and preferences about contents of Vyavasaya
Panchangam (Agriculture Almanac) published by ANGRAU was studied during 2016-17 with a total of 130 farmers. Majority of therespondents were middle aged (47.7%) and were having high school education (32.3%) and above (58.40). With respect to theperception towards understandability, more than half of the respondents (58.5%) had medium perception towards understandabilityof contents in Vyavasaya Panchangam. It could also be observed that majority of the respondents preferred to read informationon crop varieties followed by seed to seed operations among the contents published in Vyavasaya Panchangam. The independentvariables age, education and reading experience have exhibited positive correlation with the understandability.
*Corresponding Author E-mail: [email protected]
J.Res. ANGRAU 46(3) 76-84, 2018
the farming community of Andhra Pradesh state. Theprinted information in Vyavasaya Panchangamremains more permanent; ensure greater accuracyand serves as ready reckoner for farmers and forfuture reference.
The study has been taken up with the aimto make Vyavasaya Panchangam best utilized byfarmers by making it easily understandable and byincluding the most preferred content. The study wasundertaken to study the personal characteristics ofthe respondents and their relationship withunderstandabilty of Vyavasaya Panchangam; tostudy the perception of respondents towardsunderstandability of the publication and to elicit thepreferences of farmers about the contents publishedin Vyavasaya Panchangam.
MATERIAL AND METHODS
Ex post – facto research design wasfollowed for the study and systematic samplingmethod was used for selecting the respondents. Thestudy was conducted in 13 districts of AndhraPradesh during 2016-17. The VyavasayaPanchangam books published in 2016-17, 2015-16and 2014-15 were considered as basis for the study.
78
The readers of these three publications formed thepopulation of the study. The list of readers of theVyavasaya Panchangam was obtained from theDistrict Agricultural Advisory and Transfer ofTechnology Centres and Krishi Vigyan Kendras ofconcerned district. From each district, list of readerswas prepared in an alphabetical manner and every10th reader was selected as sample for the study.Thus, primarily 10 readers were selected from eachof the district and a total of 130 readers wereselected as sample.
A set of statements were prepared to elicitthe perception of respondents towards understandingvarious components of the publication with three pointcontinuum of easy to understand, moderate anddifficult to understand carrying the scores of three,two and one, respectively. For measuring thepreferences, ten contents from the book were listedand the respondents were asked to mark theirpreferences from 1 to 10. The score of 10 was givenfor top preference and nine score for preferencenumber 2 and so on. The questionnaire was preparedand mailed to selected sample respondents. The datawas collected from unresponsive readers throughtelephone interview. The results were drawn afterprocessing the data by using mean, standarddeviation, frequency, percentage and correlation.
RESULTS AND DISCUSSION
Personal characteristics of the respondents
It was observed from the Table 1 that nearlyhalf (47.69%) of the readers belonged to middle agefollowed by old (33.85%) and young age (18.46%)groups. The middle aged and old aged respondentswere found to be more interested in reading thepublication. However, the potential young agerespondents are less in number due to lack ofexperience in farming and they needed to beencouraged in utilising the scientific information eitheras hard copy or as soft copy through mobile apps tolearn various new farming practices. For this to
happen, young age farmers to be trained on creatingawareness and utilization of various agriculture andallied sectors related apps in google play store asthis age group is more inclined to use of mobiles.
The results in the Table 1 indicated that one-third (32.3%) of the respondents had education upto high school level followed by Intermediate level(24.6%) and under graduation (23.8%). The primaryschooling (6.2%) and upper primary schoolingrespondents are also to be encouraged more to referVyavasaya Panchangam, since the book is publishedin simple local language i.e. Telugu. The publicationshould also be sold to poor and marginal literatefarmers on subsidised basis by the state governmentsimilar to farm inputs.
Regarding farming experience, it could beobserved from Table 1 that nearly half of therespondents (49.2%) had medium farming experiencefollowed by low farming experience (38.5%). This maybe due to the fact that majority of the respondentsbelonged to middle aged group and the result is inconformity with the findings of Shireesha et al. (2011)who conducted study on the same publication.
The findings also revealed that majority ofthe respondents are reading Vyavasaya Panchangamfrom one to ten years. Hence, the educated andrecently practising agriculture farmers are to befocused to spread the technologies throughinformation materials (Table 1).
2. Perception towards understandability ofinformation
The respondents were classified into threecategories based on their perception towardsunderstandability of the information provided in thebook using class interval technique. It was observedfrom Table 2 that more than half of respondents(58.5%) had medium perception towardsunderstandability followed by high (37.7%) and low(3.8%).
VENKATA RAMULU et al.
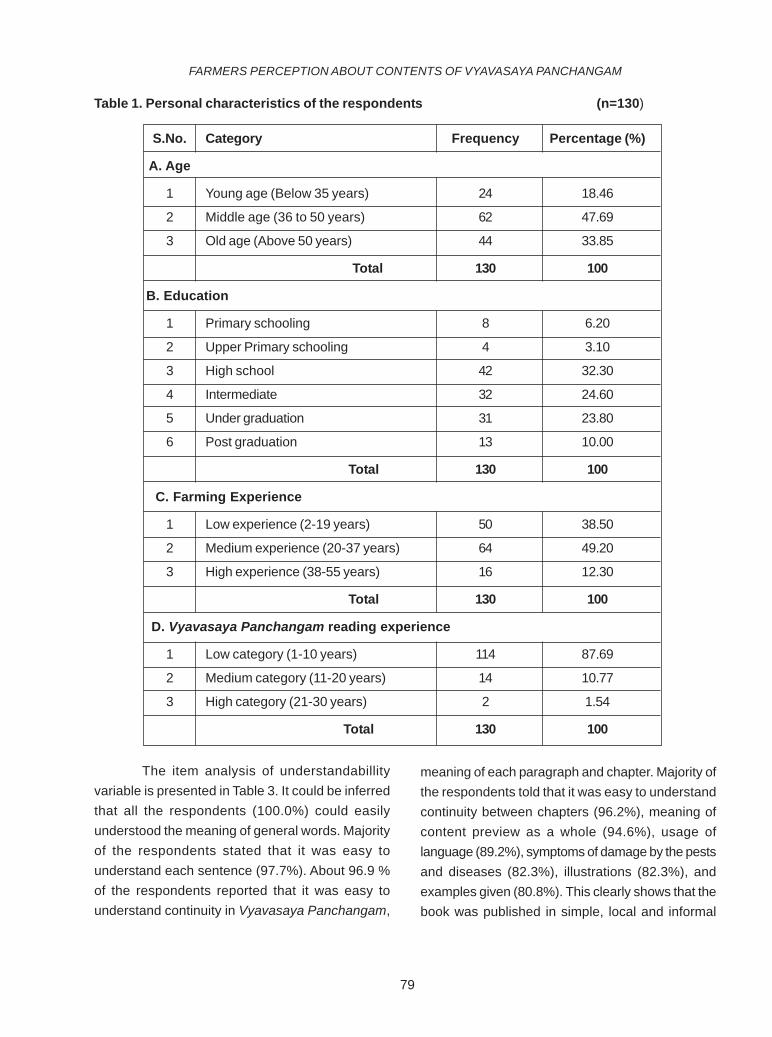
79
FARMERS PERCEPTION ABOUT CONTENTS OF VYAVASAYA PANCHANGAM
Table 1. Personal characteristics of the respondents (n=130)
S.No. Category Frequency Percentage (%)
A. Age
1 Young age (Below 35 years) 24 18.46
2 Middle age (36 to 50 years) 62 47.69
3 Old age (Above 50 years) 44 33.85
Total 130 100
B. Education
1 Primary schooling 8 6.20
2 Upper Primary schooling 4 3.10
3 High school 42 32.30
4 Intermediate 32 24.60
5 Under graduation 31 23.80
6 Post graduation 13 10.00
Total 130 100
C. Farming Experience
1 Low experience (2-19 years) 50 38.50
2 Medium experience (20-37 years) 64 49.20
3 High experience (38-55 years) 16 12.30
Total 130 100
D. Vyavasaya Panchangam reading experience
1 Low category (1-10 years) 114 87.69
2 Medium category (11-20 years) 14 10.77
3 High category (21-30 years) 2 1.54
Total 130 100
The item analysis of understandabillityvariable is presented in Table 3. It could be inferredthat all the respondents (100.0%) could easilyunderstood the meaning of general words. Majorityof the respondents stated that it was easy tounderstand each sentence (97.7%). About 96.9 %of the respondents reported that it was easy tounderstand continuity in Vyavasaya Panchangam,
meaning of each paragraph and chapter. Majority ofthe respondents told that it was easy to understandcontinuity between chapters (96.2%), meaning ofcontent preview as a whole (94.6%), usage oflanguage (89.2%), symptoms of damage by the pestsand diseases (82.3%), illustrations (82.3%), andexamples given (80.8%). This clearly shows that thebook was published in simple, local and informal
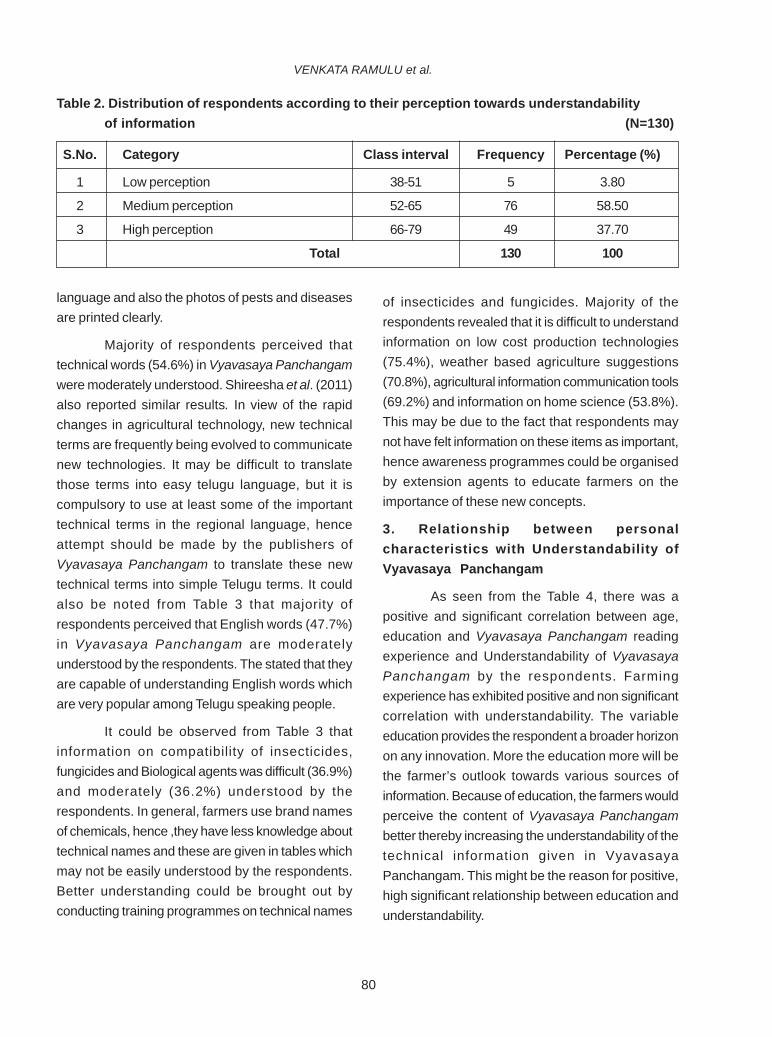
80
Table 2. Distribution of respondents according to their perception towards understandabilityof information (N=130)
S.No. Category Class interval Frequency Percentage (%)
1 Low perception 38-51 5 3.80
2 Medium perception 52-65 76 58.50
3 High perception 66-79 49 37.70
Total 130 100
language and also the photos of pests and diseasesare printed clearly.
Majority of respondents perceived thattechnical words (54.6%) in Vyavasaya Panchangamwere moderately understood. Shireesha et al. (2011)also reported similar results. In view of the rapidchanges in agricultural technology, new technicalterms are frequently being evolved to communicatenew technologies. It may be difficult to translatethose terms into easy telugu language, but it iscompulsory to use at least some of the importanttechnical terms in the regional language, henceattempt should be made by the publishers ofVyavasaya Panchangam to translate these newtechnical terms into simple Telugu terms. It couldalso be noted from Table 3 that majority ofrespondents perceived that English words (47.7%)in Vyavasaya Panchangam are moderatelyunderstood by the respondents. The stated that theyare capable of understanding English words whichare very popular among Telugu speaking people.
It could be observed from Table 3 thatinformation on compatibility of insecticides,fungicides and Biological agents was difficult (36.9%)and moderately (36.2%) understood by therespondents. In general, farmers use brand namesof chemicals, hence ,they have less knowledge abouttechnical names and these are given in tables whichmay not be easily understood by the respondents.Better understanding could be brought out byconducting training programmes on technical names
of insecticides and fungicides. Majority of therespondents revealed that it is difficult to understandinformation on low cost production technologies(75.4%), weather based agriculture suggestions(70.8%), agricultural information communication tools(69.2%) and information on home science (53.8%).This may be due to the fact that respondents maynot have felt information on these items as important,hence awareness programmes could be organisedby extension agents to educate farmers on theimportance of these new concepts.
3. Relationship between personalcharacteristics with Understandability ofVyavasaya Panchangam
As seen from the Table 4, there was apositive and significant correlation between age,education and Vyavasaya Panchangam readingexperience and Understandability of VyavasayaPanchangam by the respondents. Farmingexperience has exhibited positive and non significantcorrelation with understandability. The variableeducation provides the respondent a broader horizonon any innovation. More the education more will bethe farmer’s outlook towards various sources ofinformation. Because of education, the farmers wouldperceive the content of Vyavasaya Panchangambetter thereby increasing the understandability of thetechnical information given in VyavasayaPanchangam. This might be the reason for positive,high significant relationship between education andunderstandability.
VENKATA RAMULU et al.
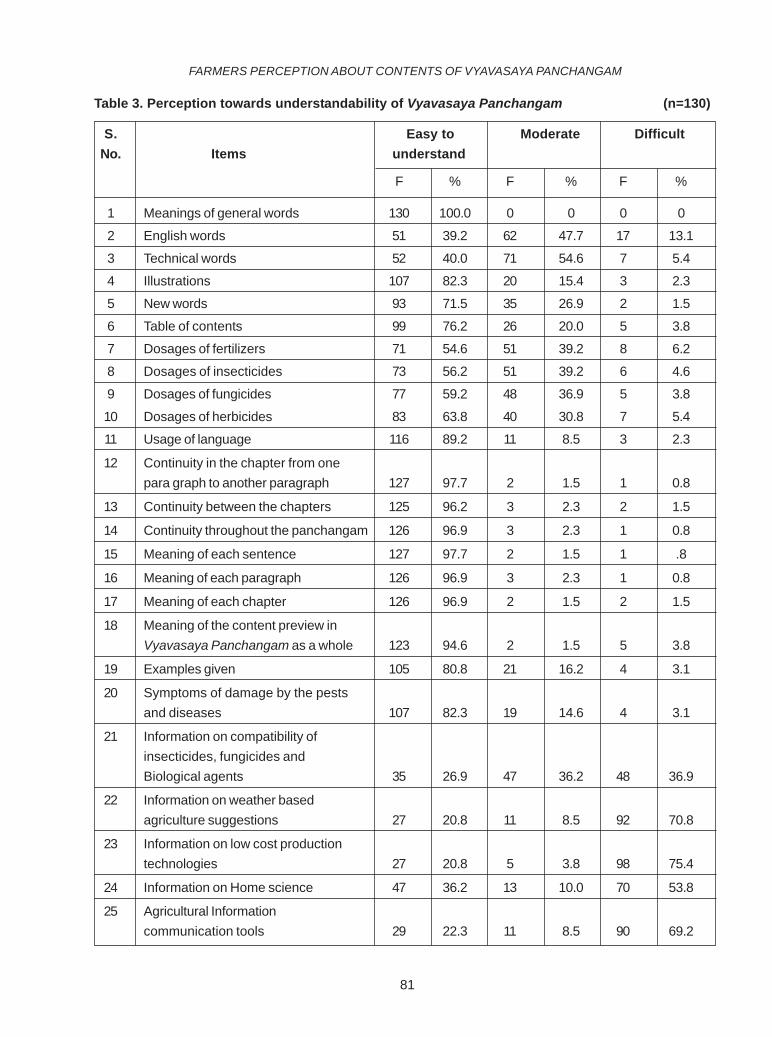
81
FARMERS PERCEPTION ABOUT CONTENTS OF VYAVASAYA PANCHANGAM
1 Meanings of general words 130 100.0 0 0 0 0
2 English words 51 39.2 62 47.7 17 13.1
3 Technical words 52 40.0 71 54.6 7 5.4
4 Illustrations 107 82.3 20 15.4 3 2.3
5 New words 93 71.5 35 26.9 2 1.5
6 Table of contents 99 76.2 26 20.0 5 3.8
7 Dosages of fertilizers 71 54.6 51 39.2 8 6.2
8 Dosages of insecticides 73 56.2 51 39.2 6 4.6
9 Dosages of fungicides 77 59.2 48 36.9 5 3.8
10 Dosages of herbicides 83 63.8 40 30.8 7 5.4
11 Usage of language 116 89.2 11 8.5 3 2.3
12 Continuity in the chapter from onepara graph to another paragraph 127 97.7 2 1.5 1 0.8
13 Continuity between the chapters 125 96.2 3 2.3 2 1.5
14 Continuity throughout the panchangam 126 96.9 3 2.3 1 0.8
15 Meaning of each sentence 127 97.7 2 1.5 1 .8
16 Meaning of each paragraph 126 96.9 3 2.3 1 0.8
17 Meaning of each chapter 126 96.9 2 1.5 2 1.5
18 Meaning of the content preview inVyavasaya Panchangam as a whole 123 94.6 2 1.5 5 3.8
19 Examples given 105 80.8 21 16.2 4 3.1
20 Symptoms of damage by the pestsand diseases 107 82.3 19 14.6 4 3.1
21 Information on compatibility ofinsecticides, fungicides andBiological agents 35 26.9 47 36.2 48 36.9
22 Information on weather basedagriculture suggestions 27 20.8 11 8.5 92 70.8
23 Information on low cost productiontechnologies 27 20.8 5 3.8 98 75.4
24 Information on Home science 47 36.2 13 10.0 70 53.8
25 Agricultural Informationcommunication tools 29 22.3 11 8.5 90 69.2
S. Easy to Moderate DifficultNo. Items understand
F % F % F %
Table 3. Perception towards understandability of Vyavasaya Panchangam (n=130)
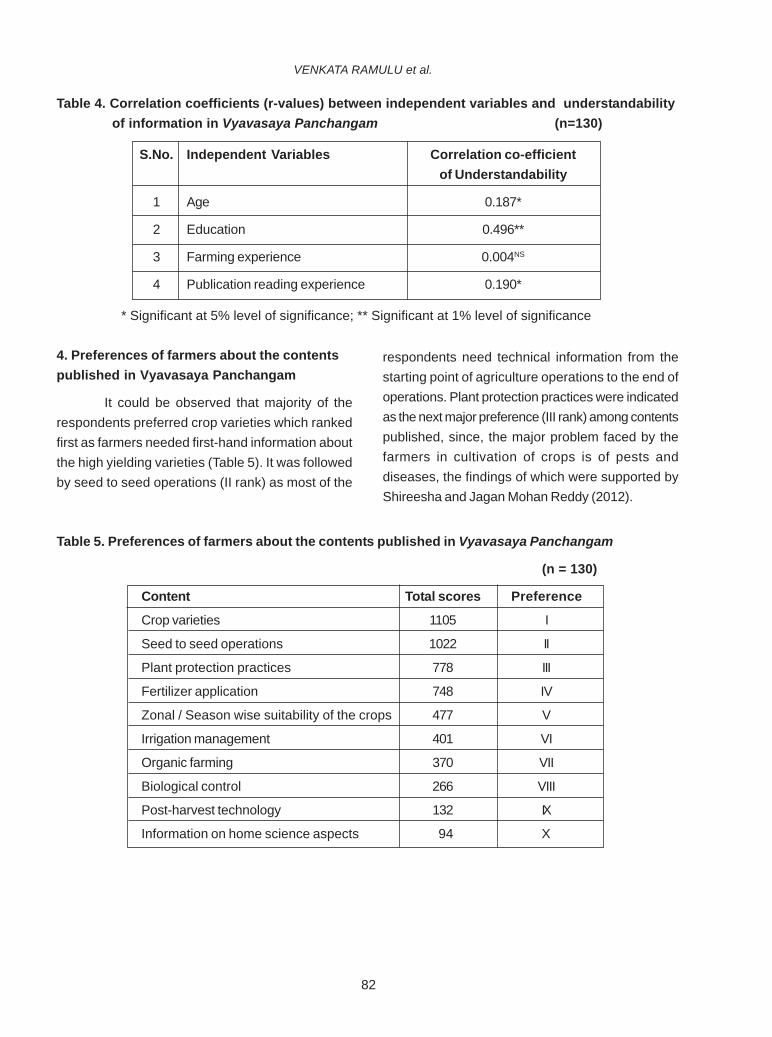
82
Table 5. Preferences of farmers about the contents published in Vyavasaya Panchangam
(n = 130)
Content Total scores Preference
Crop varieties 1105 I
Seed to seed operations 1022 II
Plant protection practices 778 III
Fertilizer application 748 IV
Zonal / Season wise suitability of the crops 477 V
Irrigation management 401 VI
Organic farming 370 VII
Biological control 266 VIII
Post-harvest technology 132 IX
Information on home science aspects 94 X
Table 4. Correlation coefficients (r-values) between independent variables and understandability of information in Vyavasaya Panchangam (n=130)
S.No. Independent Variables Correlation co-efficientof Understandability
1 Age 0.187*
2 Education 0.496**
3 Farming experience 0.004NS
4 Publication reading experience 0.190*
* Significant at 5% level of significance; ** Significant at 1% level of significance
4. Preferences of farmers about the contentspublished in Vyavasaya Panchangam
It could be observed that majority of therespondents preferred crop varieties which rankedfirst as farmers needed first-hand information aboutthe high yielding varieties (Table 5). It was followedby seed to seed operations (II rank) as most of the
respondents need technical information from thestarting point of agriculture operations to the end ofoperations. Plant protection practices were indicatedas the next major preference (III rank) among contentspublished, since, the major problem faced by thefarmers in cultivation of crops is of pests anddiseases, the findings of which were supported byShireesha and Jagan Mohan Reddy (2012).
VENKATA RAMULU et al.
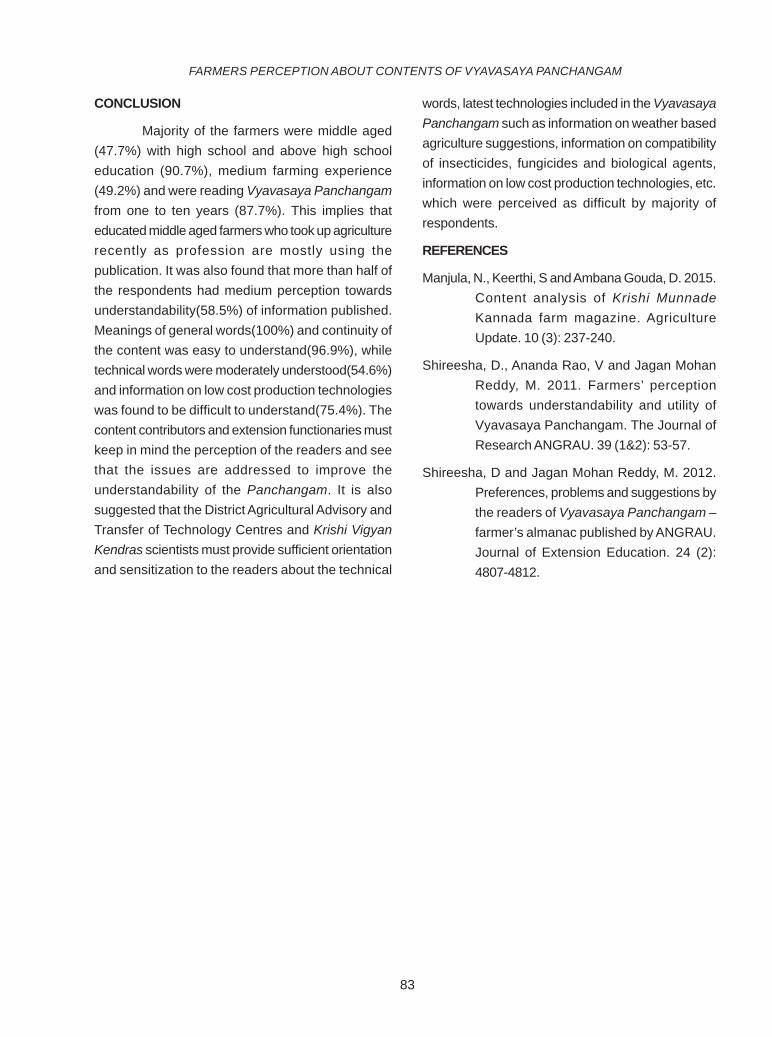
83
CONCLUSION
Majority of the farmers were middle aged(47.7%) with high school and above high schooleducation (90.7%), medium farming experience(49.2%) and were reading Vyavasaya Panchangamfrom one to ten years (87.7%). This implies thateducated middle aged farmers who took up agriculturerecently as profession are mostly using thepublication. It was also found that more than half ofthe respondents had medium perception towardsunderstandability(58.5%) of information published.Meanings of general words(100%) and continuity ofthe content was easy to understand(96.9%), whiletechnical words were moderately understood(54.6%)and information on low cost production technologieswas found to be difficult to understand(75.4%). Thecontent contributors and extension functionaries mustkeep in mind the perception of the readers and seethat the issues are addressed to improve theunderstandability of the Panchangam. It is alsosuggested that the District Agricultural Advisory andTransfer of Technology Centres and Krishi VigyanKendras scientists must provide sufficient orientationand sensitization to the readers about the technical
FARMERS PERCEPTION ABOUT CONTENTS OF VYAVASAYA PANCHANGAM
words, latest technologies included in the VyavasayaPanchangam such as information on weather basedagriculture suggestions, information on compatibilityof insecticides, fungicides and biological agents,information on low cost production technologies, etc.which were perceived as difficult by majority ofrespondents.
REFERENCES
Manjula, N., Keerthi, S and Ambana Gouda, D. 2015.Content analysis of Krishi MunnadeKannada farm magazine. AgricultureUpdate. 10 (3): 237-240.
Shireesha, D., Ananda Rao, V and Jagan MohanReddy, M. 2011. Farmers’ perceptiontowards understandability and utility ofVyavasaya Panchangam. The Journal ofResearch ANGRAU. 39 (1&2): 53-57.
Shireesha, D and Jagan Mohan Reddy, M. 2012.Preferences, problems and suggestions bythe readers of Vyavasaya Panchangam –farmer’s almanac published by ANGRAU.Journal of Extension Education. 24 (2):4807-4812.
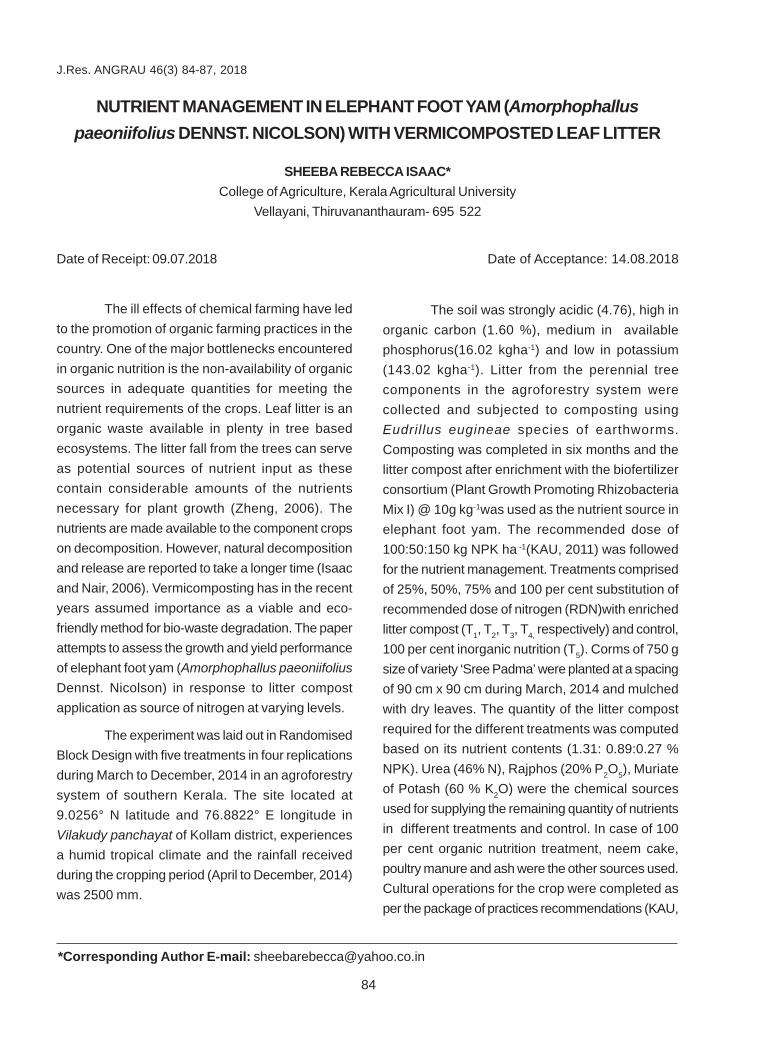
84
The ill effects of chemical farming have ledto the promotion of organic farming practices in thecountry. One of the major bottlenecks encounteredin organic nutrition is the non-availability of organicsources in adequate quantities for meeting thenutrient requirements of the crops. Leaf litter is anorganic waste available in plenty in tree basedecosystems. The litter fall from the trees can serveas potential sources of nutrient input as thesecontain considerable amounts of the nutrientsnecessary for plant growth (Zheng, 2006). Thenutrients are made available to the component cropson decomposition. However, natural decompositionand release are reported to take a longer time (Isaacand Nair, 2006). Vermicomposting has in the recentyears assumed importance as a viable and eco-friendly method for bio-waste degradation. The paperattempts to assess the growth and yield performanceof elephant foot yam (Amorphophallus paeoniifoliusDennst. Nicolson) in response to litter compostapplication as source of nitrogen at varying levels.
The experiment was laid out in RandomisedBlock Design with five treatments in four replicationsduring March to December, 2014 in an agroforestrysystem of southern Kerala. The site located at9.0256° N latitude and 76.8822° E longitude inVilakudy panchayat of Kollam district, experiencesa humid tropical climate and the rainfall receivedduring the cropping period (April to December, 2014)was 2500 mm.
NUTRIENT MANAGEMENT IN ELEPHANT FOOT YAM (Amorphophalluspaeoniifolius DENNST. NICOLSON) WITH VERMICOMPOSTED LEAF LITTER
SHEEBA REBECCA ISAAC*College of Agriculture, Kerala Agricultural University
Vellayani, Thiruvananthauram- 695 522
Date of Receipt: 09.07.2018 Date of Acceptance: 14.08.2018
*Corresponding Author E-mail: [email protected]
J.Res. ANGRAU 46(3) 84-87, 2018
The soil was strongly acidic (4.76), high inorganic carbon (1.60 %), medium in availablephosphorus(16.02 kgha-1) and low in potassium(143.02 kgha-1). Litter from the perennial treecomponents in the agroforestry system werecollected and subjected to composting usingEudrillus eugineae species of earthworms.Composting was completed in six months and thelitter compost after enrichment with the biofertilizerconsortium (Plant Growth Promoting RhizobacteriaMix I) @ 10g kg-1was used as the nutrient source inelephant foot yam. The recommended dose of100:50:150 kg NPK ha -1(KAU, 2011) was followedfor the nutrient management. Treatments comprisedof 25%, 50%, 75% and 100 per cent substitution ofrecommended dose of nitrogen (RDN)with enrichedlitter compost (T1, T2, T3, T4, respectively) and control,100 per cent inorganic nutrition (T5). Corms of 750 gsize of variety ‘Sree Padma’ were planted at a spacingof 90 cm x 90 cm during March, 2014 and mulchedwith dry leaves. The quantity of the litter compostrequired for the different treatments was computedbased on its nutrient contents (1.31: 0.89:0.27 %NPK). Urea (46% N), Rajphos (20% P2O5), Muriateof Potash (60 % K2O) were the chemical sourcesused for supplying the remaining quantity of nutrientsin different treatments and control. In case of 100per cent organic nutrition treatment, neem cake,poultry manure and ash were the other sources used.Cultural operations for the crop were completed asper the package of practices recommendations (KAU,
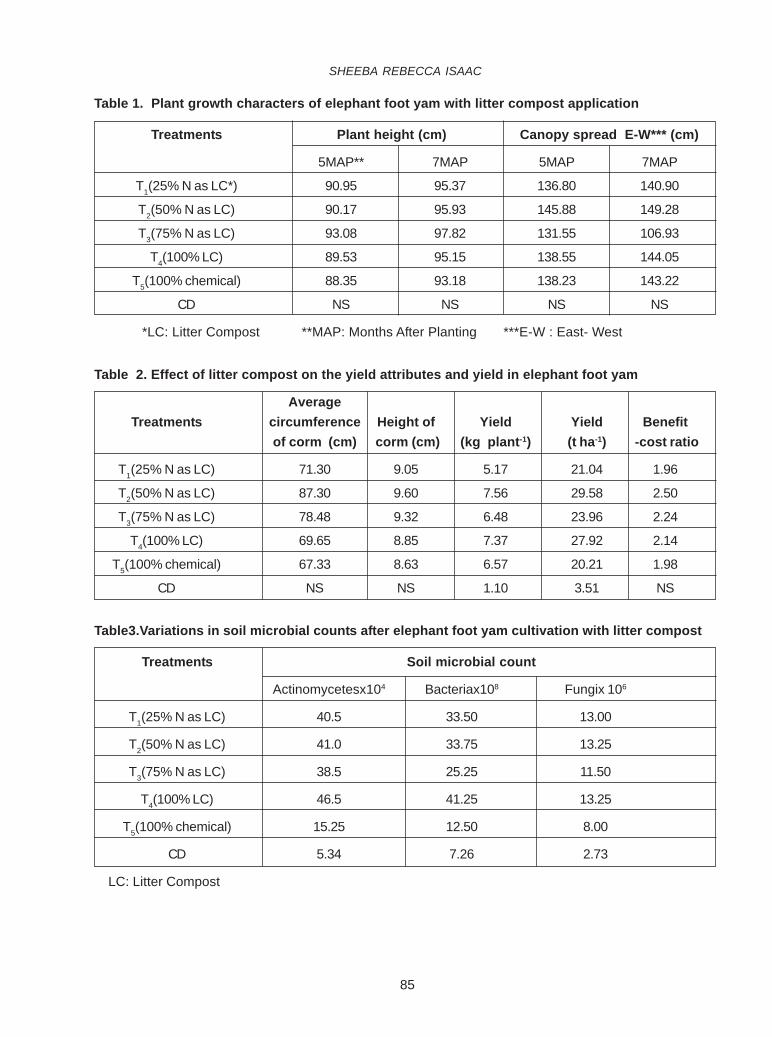
85
Table 1. Plant growth characters of elephant foot yam with litter compost application
Treatments Plant height (cm) Canopy spread E-W*** (cm)
5MAP** 7MAP 5MAP 7MAP
T1(25% N as LC*) 90.95 95.37 136.80 140.90
T2(50% N as LC) 90.17 95.93 145.88 149.28
T3(75% N as LC) 93.08 97.82 131.55 106.93
T4(100% LC) 89.53 95.15 138.55 144.05
T5(100% chemical) 88.35 93.18 138.23 143.22
CD NS NS NS NS
*LC: Litter Compost **MAP: Months After Planting ***E-W : East- West
Table 2. Effect of litter compost on the yield attributes and yield in elephant foot yam
AverageTreatments circumference Height of Yield Yield Benefit
of corm (cm) corm (cm) (kg plant-1) (t ha-1) -cost ratio
T1(25% N as LC) 71.30 9.05 5.17 21.04 1.96
T2(50% N as LC) 87.30 9.60 7.56 29.58 2.50
T3(75% N as LC) 78.48 9.32 6.48 23.96 2.24
T4(100% LC) 69.65 8.85 7.37 27.92 2.14
T5(100% chemical) 67.33 8.63 6.57 20.21 1.98
CD NS NS 1.10 3.51 NS
Table3.Variations in soil microbial counts after elephant foot yam cultivation with litter compost
Treatments Soil microbial count
Actinomycetesx104 Bacteriax108 Fungix 106
T1(25% N as LC) 40.5 33.50 13.00
T2(50% N as LC) 41.0 33.75 13.25
T3(75% N as LC) 38.5 25.25 11.50
T4(100% LC) 46.5 41.25 13.25
T5(100% chemical) 15.25 12.50 8.00
CD 5.34 7.26 2.73
LC: Litter Compost
SHEEBA REBECCA ISAAC
86
2011). Biometric observations were recorded at bi-monthly intervals, five months and seven months afterplanting (MAP) and yield attributes, at harvest.Microbial counts in soil were assessed adoptingserial dilution and plate count technique for fungi,bacteria and actinomycetes (Johnson and Curl,1972). The data collected was statistically analysedto assess the response of the tuber crop to littercompost application. The significance was testedby F test (Gomez and Gomez, 1984). In the caseswhere the variations were found to be significant, CDvalues at 5 % level of significance were computedfor comparision of means. Student’s T test wascarried out for comparision.
The results revealed that there was nosignificant variation in plant height and canopy spreadboth at 5 MAP and 7 MAP (Table 1). Maximum plantheight was recorded in the treatment of 75 per centsubstitution of N with the compost (93.08 cm and97.82 cm at 5 MAP and 7 MAP, respectively). Canopyspread (E-W) at 5 MAP and 7 MAP.
The different levels of N substitution with littercompost did not record any significant influence onthe yield attributes (Table 2), nevertheless, cormyield plant-1 were higher in 50 per cent substitution(7.56 kg plant-1) and recorded on par with yield plant-1 at 100 per cent organic nutrition (7.37 kg plant-1).The significant variation in per plant yields might beattributed to the presence of cormels of varying sizeswhich were not accounted in the corm height andcircumference observations. The per hectare cormyields also followed similar trend with 50 percentsubstitution recording maximum yield (29.58 t ha-1)but on a par with 100 per cent organic (27.92 t ha-1)nutrition, and, significantly superior to all other levelsof substitution.
Elephant foot yam has been reported torespond well to organic nutrition (Suja et al., 2006).The better performance at 50 per cent integrationwould be due to availability of nutrients in the earlymonths from chemical fertilizers as evidenced in the
canopy spread of plants. This would have improvedthe photosynthetic efficiency contributing to thehigher yields in the treatment. Economic analysisalso revealed higher B: C ratio (2.50) for 50 per centsubstitution (Table 2) indicating that litter compostcan be included in the fertilizer package of elephantfoot yam at 50 per cent substitution of therecommended dose of N.
The effect of the litter compost applicationson soil microbial population (bacteria andactinomycetes) registered maximum counts under100 per cent organic nutrition while fungi recordedsimilar count at 50 per cent substitution (Table 3).The floral counts in the 100 per cent chemicalfertilizer applied plots were significantly lower andthis could be attributed to lesser quantum of organicsubstrates in soil with chemical fertilizer applicationwhich interfered with the proliferation and activitiesof microbes. Thus, it can be concluded that inclusionof organic nutrient sources would lead to better soilbiological activity and hence can result in sustainableproduction in the long run.
The research experiment has brought to lightthe potential for use of leaf litters as a nutrient inputin elephant foot yam cultivation. Recycling of the litteras vermicompost would ensure productive disposalof the biowastes and can be recommended inelephant foot yam as a nutrient source at 50 percent substitution of the recommended nitrogen dosealong with P and K as chemical fertilisers. Organicnutrition will be economically feasible if the organicmanures can be produced insitu, within the farm.
REFERENCES
Gomez, K. A and Gomez, A. A. 1984.Statisticalprocedures for agricultural research. JohnWiley and Sons, New York.pp. 680.
Isaac, S. R andNair, M.A. 2006. Litter dynamics ofsix multipurpose trees in a home garden in
Southern Kerala, India. AgroforestrySystems. 67: 203-213.
NUTRIENT MANAGEMENT IN ELEPHANT FOOT YAM WITH VERMICOMPOSTED LEAF LITTER
87
Johnson, L. F and Curl, E. A. 1972. Methods forresearch in the ecology of soil borne plantpathogen. Burgers Publication Co.,Minneapolis, U.S.A. pp. 247.
Kerala Agricultural University. 2011. Package ofpractices recommendations: Crops. FourthEdition. Kerala Agricultural University,Thrissur. pp. 393.
Suja, G., Nayar, T.V.R., Potty, V.P and Sundaresan,S. 2006.Organic farming: a viable strategyfor high yield and quality tuber cropproduction. Indian Horticulture. 51(6):4-5.
Zheng, Z. 2006. Litter decomposition and nutrientrelease in a tropical seasonal rainforest ofXishuangbanna, Southwest China.Biotropica. 38(3): 342–347.
SHEEBA REBECCA ISAAC
88
INSTRUCTIONS TO AUTHORSThe Journal of Research ANGRAU is published quarterly by Acharya N.G. Ranga Agricultural University.Papers submitted will be peer reviewed. On the basis of referee’s comments, author(s) will be asked by theeditor to revise the paper. All authors must be members. Papers are accepted on the understanding thatthe work described is original and has not been published elsewhere and that the authors have obtainednecessary authorization for publication of the material submitted. A certificate signed by all authors indicatingthe originality of research work should be enclosed along with the manuscript. Articles should contain datanot older than five years. The period shall be caluclated from the following January or July afterthe completion of the field experiment in Kharif (rainy) and Rabi (winter) seasons, respectively.Subject Matter: Articles on all aspects of agriculture, horticulture, forestry, agricultural engineering, homesciences and social sciences with research and developments on basic and applied aspects of cropimprovement, crop management, crop protection, farm implements, agro-technologies, rural development,extension activities and other suitable topics.Typed script: It should be in clear concise English, typewritten in double space using Times New RomanFont (size 12) on one side of A4 size paper with at least 2 cm margin. Full research paper should not exceed10 typed pages including tables and figures and should contain abstract, introduction, material and methods,results and discussion, conclusion and references. All articles should be submitted at E-mail i.d.:[email protected]. Hard copy is not required. The contents of Research Paper should be organized as Title, Abstract, Introduction, Material andMethods, Results and Discussion, Conclusion and References.TITLE: This should be informative but concise. While typing the title of the paper/note all the letters mustbe in upper case. The title must be typed just before the commencement of abstract. No abbreviationsshould be used in the title.Names should be in capitals prefixed with initials and separated by commas. For more than twoauthors the names should be followed by ‘and’ in small letters before the end of last name. Fulladdress of the place of research in small letters should be typed below the names. E-mail i.d of the authormay be given as foot note.ABSTRACT: A brief informative abstract should follow on the first page of the manuscript. It should clearlybring out the scope of the work and its salient features. It should be single paragraph of not more than 200words.INTRODUCTION: It should be brief, crisp and introduce the work in clear terms. It should state the objectiveof the experiment. Key references related to the work must be cited.MATERIAL AND METHODSThis should include experimental design, treatments and techniques employed. The year of experiment/investigation carried out should be mentioned. Standard and already reported method must be clearly givenor cited. Any modification of the original method must be duly highlighted. Use standard abbreviations ofthe various units.RESULTS AND DISCUSSIONThis should govern the presentation and interpretation of experimental data only and each of the experimentshould be properly titled. Salient results must be highlighted and discussed with related works. Commonnames of plant species, micro- organisms, insects etc., should be supported with authentic, latest Latin
89
names, which should be Italics in the typescript. When such names are first mentioned, the full genericname and the species name with the authority should be mentioned and in subsequent reference, the genericname must be abbreviated and the authority be deleted. The treatments should be briefly expressed insteadof abbreviations like T1, T 2, etc.All headings must be typed in upper case from the left hand margin. The sub- headings must be typed in lowercase and only first letter must be in capital. Sub –headings must start from the left hand margin.CONCLUSION(S): A brief conclusion(s) of the research finding and future line of work may be given at the end.Tables: Tables should be typed on separate sheets and numbered consecutively within the text. The units ofthe data should be defined. The weights and measures should be given in the metric system following thelatest units. For e.g.: kg ha-1, kg ha-1 cm, mg g-1, dS m-1, g m-3, C mol kg-1, etc.Illustrations: The illustrations, text- figures and photo prints should be clear. Legends to figures andphotos should be typed on the foot of the figure/photo. Figures must be numbered with figure numbers likeFig.1, Fig 2, and their approximate position in the text indicated. It is author’s responsibility to providesuitable figures. Colour photos, if needed in research articles could be printed at extra cost.Abbreviations should be used sparingly if advantageous to the reader. All new or unusual abbreviationsshould be defined when they are used for the first time in the paper. Ordinarily, the sentences should notbegin with abbreviations or numbers.REFERENCES: Relevant references shall be quoted under each section and must be cited in full in thereference section. References to unpublished work and abstract citation may be avoided. References neednot be numbered but should be arranged alphabetically in chronological order. Please avoid using “Anonymous”in the reference. In the text, the references should be cited as (Kumar, 2009) or Kumar (2009), Shivay andPrasad (2009) or (Shivay and Prasad, 2009), Lee et al. (2012) or (Lee et al., 2012), when there are more thantwo authors. Full name of the Journal should be mentioned. Recent references should be included.Names of authors, their spelling and year of publication should coincide both in the text andreferences.Citing References: The papers cited in the text should only be included in the References. While listing theReferences, the following format should be followed strictly.While citing an article from:Journals and BulletinsHu, J., Yue, B and Vick, B.A. 2007. Integration of trap makers onto a sunflower SSR marker linkage mapconstructed from 92 recombinant inbred lines. Helia. 30 (46):25-36.Sharma, D.K., Thimmappa, K., Chinchmalatpure, R. Anil, Mandal, A.K., Yadav, R.K., Chaudari, S.K.,Kumar, S and Sikka, A.K. 2015. Assessment of production and monetary losses from salf- affected soils inIndia. Technical Bulletin No. 5, ICAR-CSSRI, Karnal.BooksAOAC. 1990. Official methods of analysis. Association of official analytical chemists. 15th Edition.Washington DC. USA. pp. 256.Yellamanda Reddy, T and Sankara Reddy, G.H. 2005. Principles of Agronomy. Kalyani Publishers,Ludhiana, India. pp. 125.
90
Edited BookBreckler, S.J and Wiggins, E.C.1992. On defining attitude and attitude theory: Once more with feeling. In:Attitude Structure and Function. Pratkins, A.R., Breckler, S.J and Greenwald, A.G.(Eds). Hillsdale, NJ:Lawrence Erlbaum Associates. pp. 407-427.ThesisIbrahim, F. 2007. Genetic variability for resistance to sorghum aphid (Melanaphis sacchari, Zentner) insorghum. Ph.D. Thesis submitted to Acharya N.G. Ranga Agricultural University, Hyderabad.Seminars / Symposia / WorkshopsNaveen Kumar, P.G and Shaik Mohammad. 2007. Farming Systems approach – A way towards organicfarming. Paper presented at the National symposium on integrated farming systems and its role towardslivelihood improvement. Jaipur, 26th – 28th October, 2007. pp. 43-46.Proceedings of Seminars / SymposiaBind, M and Howden, M. 2004. Challenges and opportunities for cropping systems in a changing climate.Proceedings of International crop science congress. Brisbane –Australia. 26th September – 1st October,2004. pp. 52-54.WebsiteCotton Corporation of India. 2017. Area, production and productivity of cotton in India. Retreived fromwebsite (www.cotcorp.gov.in/statistics.aspx) on 21.9.2017.Annual ReportAICCIP. 2017. Annual Report 2016-17. All India Coordinated Cotton Improvement Project. Coimbatore,Tamilnadu. pp. 26-28.Manuscripts and communication
• Give your e-mail address and mobile number for fast communication.• Send soft copy of the manuscript at E-mail i.d: [email protected]• Hard copy is not essential
SUBSCRIPTION RATESANNUALIndividual: Rs. 400/- per authorInstitution: Rs. 2000/-LIFEIndividual: Rs. 2000/-PRINTING CHARGESPer page: Rs. 125/-Demand drafts drawn in favour of Comptroller, ANGRAU payable at Guntur should be sent to the ManagingEditor, Agricultural Information & Communication Centre, Srinivasa Citadel, Lam, Guntur 522 034, AndhraPradesh.URL: www. angrau.ac.in/ publicationsFurther details on Journal style can be obtained from book “Style Manual for Biological Journals” Edition 4,1978, American Institute of Biological Sciences, Washington, D.C.

91
THE JOURNAL OF RESEARCH ANGRAU
DECLARATION CERTIFICATE TO BE SUBMITTED BY THE AUTHOR(S)
Certified that the article entitled __________________________________________________________
____________________________________________________________________________________
1. is based on my / our original research work / M.Sc / Ph.D thesis (strike off whichever is not applicable)
2. The article has been seen by all the authors and the order of authorship is agreed.
3. The results presented have not been published or submitted for publication elsewhere in part or full underthe same or other title
4. The names of the authors are those who made a notable contribution.
5. No authorship is given to anyone who did not make a notable contribution.
S.No. Name/s Present address Permanent address Signature
1.
2.
3.
CERTIFICATE BY THE COMPETENT AUTHORITY
( Professor & Head of the Department/ Principal Scientist of the Station/ Associate Director of Research).
Certified that the article ————————————————————————————————————
———————————————————————————————————————————————
authored by —————————————————————————————————————————
———————————————————————— is fit for publication. It fulfills all the requirements for
publication in The Journal of Research ANGRAU.
Name :
Signature :
Office seal :
Note: In case it is not possible to obtain the signature of a particular author for reasons beyondhis/her reach, the reasons thereof should be explained.
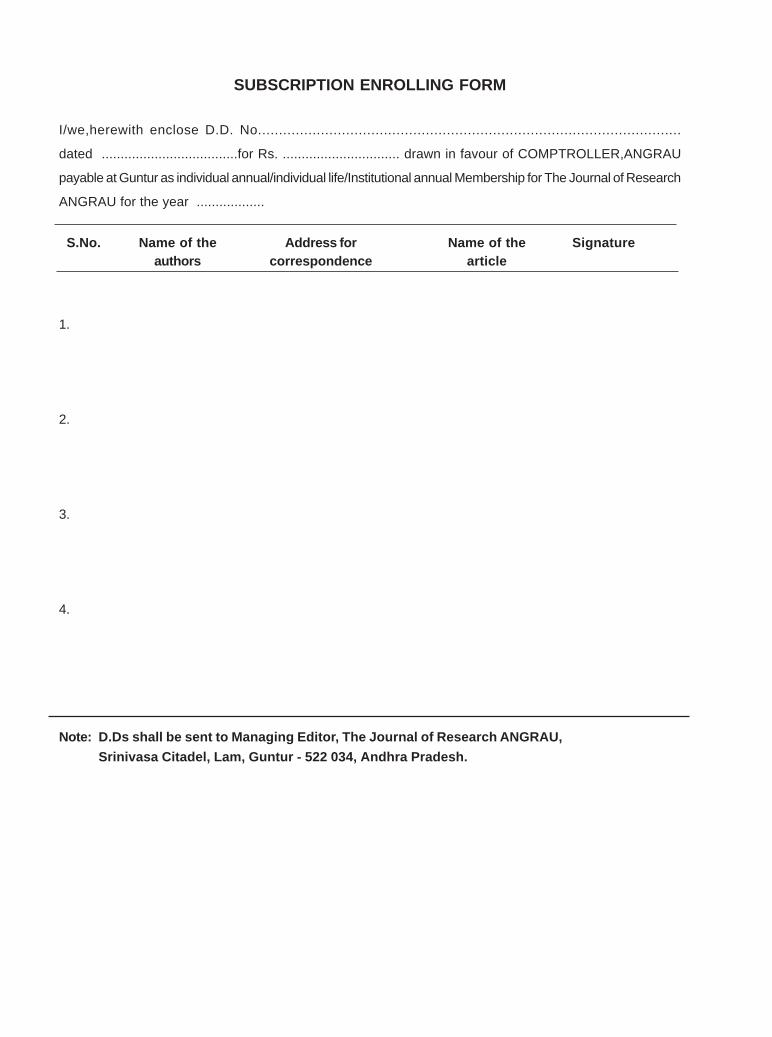
92
SUBSCRIPTION ENROLLING FORM
I/we,herewith enclose D.D. No.....................................................................................................
dated ....................................for Rs. ............................... drawn in favour of COMPTROLLER,ANGRAU
payable at Guntur as individual annual/individual life/Institutional annual Membership for The Journal of Research
ANGRAU for the year ..................
S.No. Name of the Address for Name of the Signatureauthors correspondence article
1.
2.
3.
4.
Note: D.Ds shall be sent to Managing Editor, The Journal of Research ANGRAU,Srinivasa Citadel, Lam, Guntur - 522 034, Andhra Pradesh.
93
Statement about the ownership and other particulars about JournalTHE JOURNAL OF RESEARCH ANGRAU (since 1973)
Form IV (SEE RULE 8)
Place of Publication : Guntur
Periodicity of publication : Once in three months (Quarterly)
Printer’s Name : Ritunestham Press, Guntur
Nationality : INDIAN
Address : Ritunestham PressD.No. 8-198, Kornepadu, Guntur - 522 017
Publisher’s Name : Dr. D. Balaguravaiah
Address : Dean of P.G. Studies, Administrative Office,Acharya N.G. Ranga Agricultural University,Lam, Guntur- 522 034, Andhra Pradesh
Editor -in - Chief 's Name : Dr. D. Balaguravaiah
Nationality : INDIAN
Address : Dean of P.G. Studies, Administrative Office,Acharya N.G. Ranga Agricultural University,Lam, Guntur- 522 034, Andhra Pradesh
Name and address of the individuals : Acharya N.G.Ranga Agricultural University,who own the Journal and partners or Administrative Office,share holders holding more than one Lam, Guntur- 522 034,percent of the total capital Andhra Pradesh.
I, Dr. D. Balaguravaiah, hereby declare that the particulars given above are true to the best of my knowledgeand belief.
Signature of the Publisher
Sd/- D. Balaguravaiah

ANGRAU/AI & CC/2018 Regd. No. 25487/73
Printed at Ritunestham Press, Guntur and Published by Dr. D. Balaguravaiah, Dean of P.G. Studies and Editor-in- Chief,The Journal of Research ANGRAU, Acharya N.G. Ranga Agricultural University, Lam, Guntur - 522 034
E-mail : [email protected], URL: www.angrau.ac.in/publications
ACHARYA N.G. RANGA AGRICULTURAL UNIVERSITYLam, Guntur - 522 034
ISSN No. 0970-0226
ANGRAU
THE JOURNAL OFRESEARCHANGRAU
The J. Res. A
NG
RA
U, Vol. XLV I N
o. (3), pp. 1-95, July-September, 2018
Indexed by CAB International (CABI)www.cabi.org and www.angrau.ac.in
The J. Res. ANGRAU, Vol. XLVI No. (3), pp. 1-95, July-September, 2018


![25487 US Softtouch span port Druck Ordner/assets... · 2020. 10. 2. · cronos caracteri]am-se pela sua grande conÀaEilidade. Um sistema de recuperação de energia inteligente garante](https://img.pdfslide.net/doc/110x75/6137e0670ad5d2067648e89f/25487-us-softtouch-span-port-druck-ordnerassets-2020-10-2-cronos-caracteriam-se.jpg)