Embed Size (px)
Citation preview

The Key Dynamics of Private Debt
Data provided by

2 THE KEY DYNAMICS OF PRIVATE DEBT © 2021 Akin Gump Strauss Hauer & Feld LLP https: //www.akingump.com/en/
Contents
Executive summary 2
Overiew: The private equity landscape 3-4
Current trends in private debt 5-8
Q&A 9-11
About Akin Gump & methodology 12
Executive summary• Despite the COVID-19 pandemic, 2020 still saw robust private equity (PE) activity relative to historical activity, with
well over 5,000 completed transactions even amid a drop in aggregate deal value to just over $664 billion. This healthy volume helped drive significant demand for private debt lending to PE portfolio companies.
• Private capital fundraising, especially PE, still saw healthy levels of capital committed even as the tally of closed funds plunged.
• The trend of more experienced and larger fund managers still closing on significantly sized pools of capital also held true for the private debt universe.
• Opportunism characterized trends in fundraising by strategy throughout 2020, with special situations benefiting, along with general debt, as PE fund managers sought bespoke financing solutions for portfolios and private debt players targeted distressed companies.
• Pandemic-driven drawdowns reduced record private debt capital overhang during 2020, but strong fundraising should help replenish.
• Heading into 2021, fund managers will face rising demand from PE firms and other entities given strengthening economic recovery with persisting dislocations, yielding further opportunities for capital deployment.

THE KEY DYNAMICS OF PRIVATE DEBT 3© 2021 Akin Gump Strauss Hauer & Feld LLP https: //www.akingump.com/en/
Overview: The private equity landscape
Even amid the tumult induced by the COVID-19 pandemic, PE dealmakers remained active. Although transaction volume declined year-over-year (YoY), and aggregate deal value fell markedly, 2020 saw relatively robust levels of investment. Quarterly data reinforces the temporality of the slowdown in dealmaking, with Q2 2020 experiencing a sharp, sudden plunge in deal count before the back half of the year saw concluded transactions come roaring back. Supported by the sheer heft of over a trillion dollars in committed capital, such vigorous dealmaking was accompanied by heightened demand for well-positioned companies, leading to buyout multiples remaining as high as ever and equity portions inching to a record (albeit based on small sample sizes). Record dry powder was a phenomenon long anticipated given the robust nature of past fundraising cycles, with 2019 seeing a massive $322.2 billion committed to U.S. PE funds. 2020 did see a sharp downturn in volume, but capital committed still exceeded $200 billion. All in all, the PE industry’s quick rebound in dealmaking helped drive significant demand for private debt. First, during the immediate onset of the pandemic, PE portfolios required shoring up and bespoke financing packages; second, as dealmaking roared back, fund managers tapped debt markets to close deals.
$279
.3
$339
.1
$375
.4
$432
.9
$528
.3
$498
.9
$597
.0
$641
.1
$742
.9
$764
.0
$664
.3
$140
.0
2,7563,106
3,534 3,377
4,2224,410 4,483
4,904
5,640 5,5905,257
1,198
2010 2011 2012 2013 2014 2015 2016 2017 2018 2019 2020 2021*
Deal value ($B) Deal count
Source: PitchBook *As of March 31, 2021
U.S. PE deal activity
0
200
400
600
800
1,000
1,200
1,400
1,600
1,800
2,000
$0
$50
$100
$150
$200
$250
$300
Q1Q2Q3Q4 Q1Q2Q3Q4 Q1Q2Q3Q4 Q1Q2Q3Q4 Q1Q2Q3Q4 Q12016 2017 2018 2019 2020 2021*
Deal value ($B) Deal count
Source: PitchBook *As of March 31, 2021
U.S. PE deal activity

4 THE KEY DYNAMICS OF PRIVATE DEBT © 2021 Akin Gump Strauss Hauer & Feld LLP https: //www.akingump.com/en/
4.5x
4.6x
4.7x 6.
0x 6.7x
5.6x 6.
6x
6.1x
6.1x 6.9x
5.9x 7.
5x
3.6x 4.
6x
4.1x
4.3x
6.0x
4.9x
6.7x
5.9x
5.8x
8.0x
7.3x
3.6x8.2x
9.1x 8.7x
10.2x
12.6x
10.5x
13.3x
11.9x 11.9x
14.9x
13.2x
11.1x
2010
2011
2012
2013
2014
2015
2016
2017
2018
2019
2020
2021
*
Debt/EBITDA Equity/EBITDA EV/EBITDA
Median U.S. EV/EBITDA buyout multiples
44.8%
67.9%
0%
10%
20%
30%
40%
50%
60%
70%
80%
2010
2011
2012
2013
2014
2015
2016
2017
2018
2019
2020
2021
*
Source: PitchBook *As of March 31, 2021
Note: Debt/EBITDA, equity/EBITDA, and debt percentages for 2021 are based on non-normative datasets where n < 30.
Median U.S. buyout debt proportion (%) of overall buyout value
$190
.7
$228
.3
$297
.7
$378
.7
$440
.5
$509
.2
$484
.9
$636
.9
$551
.8
$683
.5
$539
.4
$179
.0661751
957
1,192
1,568
1,7921,699 1,757 1,765 1,750
1,100
323
2010
2011
2012
2013
2014
2015
2016
2017
2018
2019
2020
2021
*
Capital raised ($B) Fund count
Source: PitchBook *As of March 31, 2021
U.S. private capital fundraising activity
$56.
3
$71.5
$106
.1
$160
.2
$177
.8
$159
.1
$224
.2
$271
.6
$206
.9
$322
.2
$213
.5
$89.
6145
184219
305
401 395420
483
416448
292
101
2010
2011
2012
2013
2014
2015
2016
2017
2018
2019
2020
2021
*
Capital raised ($B) Fund count
Source: PitchBook *As of March 31, 2021
U.S. PE fundraising activity
Source: PitchBook *As of March 31, 2021
Note: Debt/EBITDA, equity/EBITDA, and debt percentages for 2021 are based on non-normative datasets where n < 30.
THE KEY DYNAMICS OF PRIVATE DEBT 5© 2021 Akin Gump Strauss Hauer & Feld LLP https: //www.akingump.com/en/
Current trends in private debt
Source: PitchBook
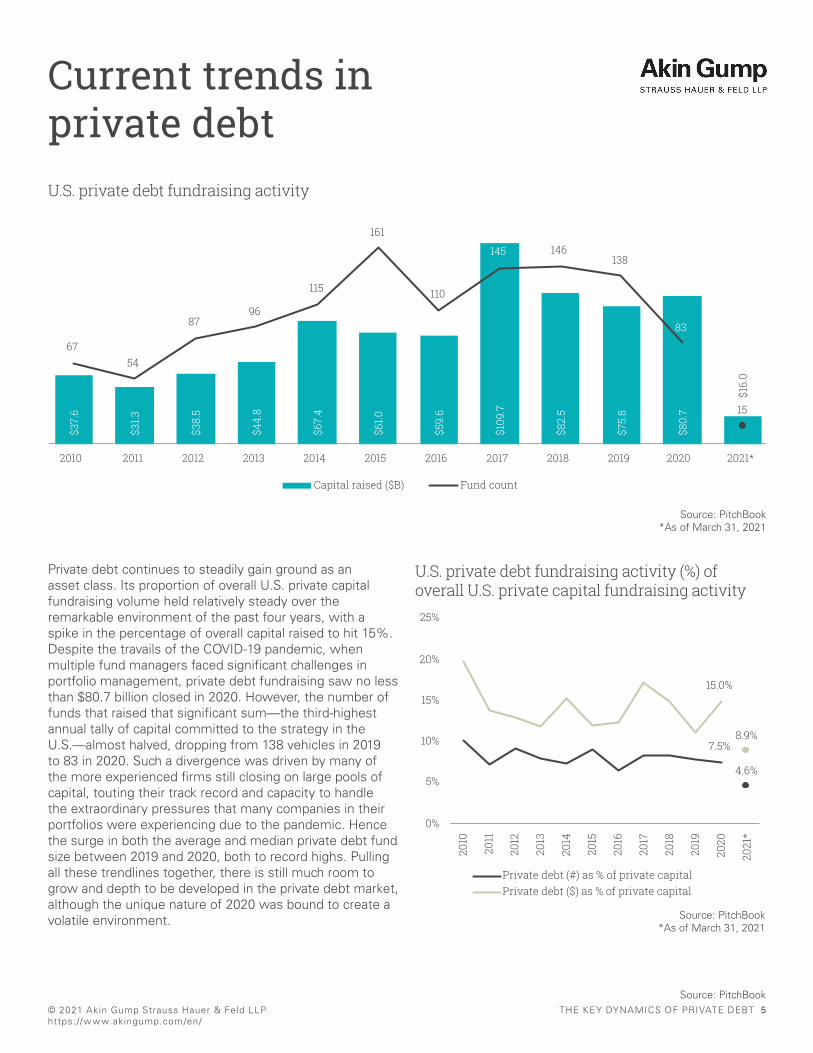
Private debt continues to steadily gain ground as an asset class. Its proportion of overall U.S. private capital fundraising volume held relatively steady over the remarkable environment of the past four years, with a spike in the percentage of overall capital raised to hit 15%. Despite the travails of the COVID-19 pandemic, when multiple fund managers faced significant challenges in portfolio management, private debt fundraising saw no less than $80.7 billion closed in 2020. However, the number of funds that raised that significant sum—the third-highest annual tally of capital committed to the strategy in the U.S.—almost halved, dropping from 138 vehicles in 2019 to 83 in 2020. Such a divergence was driven by many of the more experienced firms still closing on large pools of capital, touting their track record and capacity to handle the extraordinary pressures that many companies in their portfolios were experiencing due to the pandemic. Hence the surge in both the average and median private debt fund size between 2019 and 2020, both to record highs. Pulling all these trendlines together, there is still much room to grow and depth to be developed in the private debt market, although the unique nature of 2020 was bound to create a volatile environment.
$37.
6
$31.3
$38.
5
$44.
8
$67.
4
$61.0
$59.
6
$109
.7
$82.
5
$75.
8
$80.
7
$16.
0
6754
8796
115
161
110
145 146138
83
15
2010 2011 2012 2013 2014 2015 2016 2017 2018 2019 2020 2021*
Capital raised ($B) Fund count
Source: PitchBook *As of March 31, 2021
U.S. private debt fundraising activity
7.5%
4.6%
15.0%
8.9%
0%
5%
10%
15%
20%
25%
2010
2011
2012
2013
2014
2015
2016
2017
2018
2019
2020
2021
*
Private debt (#) as % of private capitalPrivate debt ($) as % of private capital
Source: PitchBook *As of March 31, 2021
U.S. private debt fundraising activity (%) of overall U.S. private capital fundraising activity
6 THE KEY DYNAMICS OF PRIVATE DEBT © 2021 Akin Gump Strauss Hauer & Feld LLP https: //www.akingump.com/en/
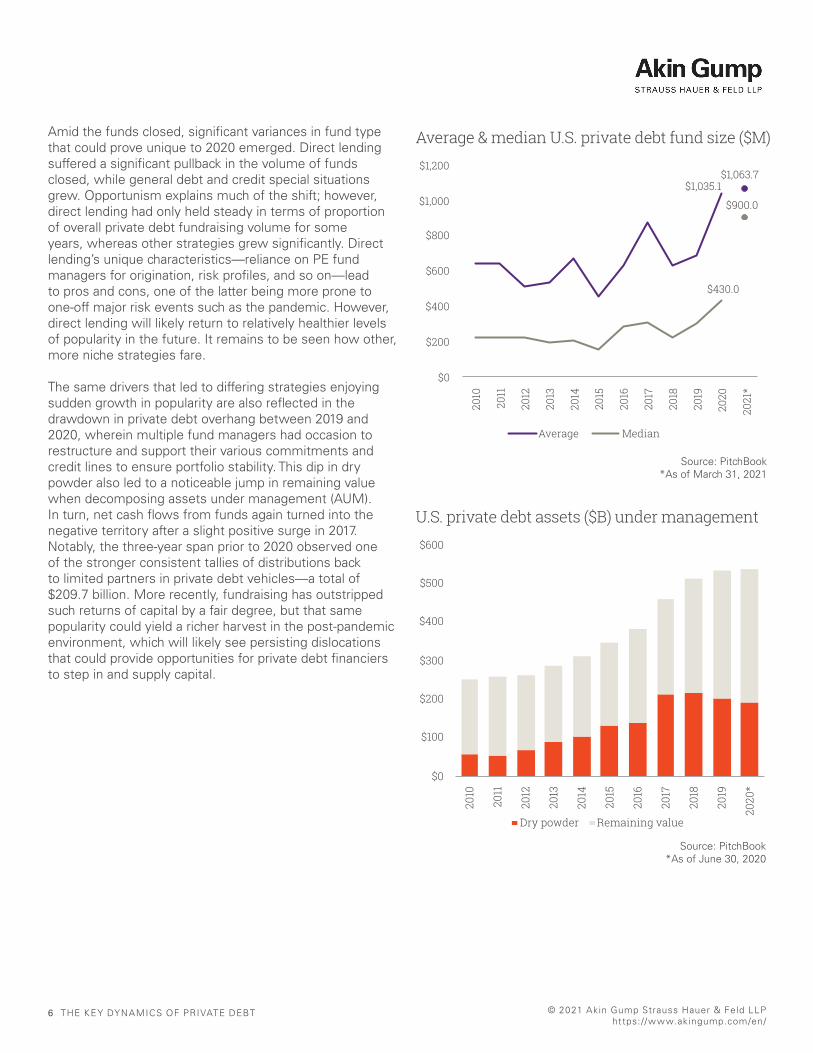
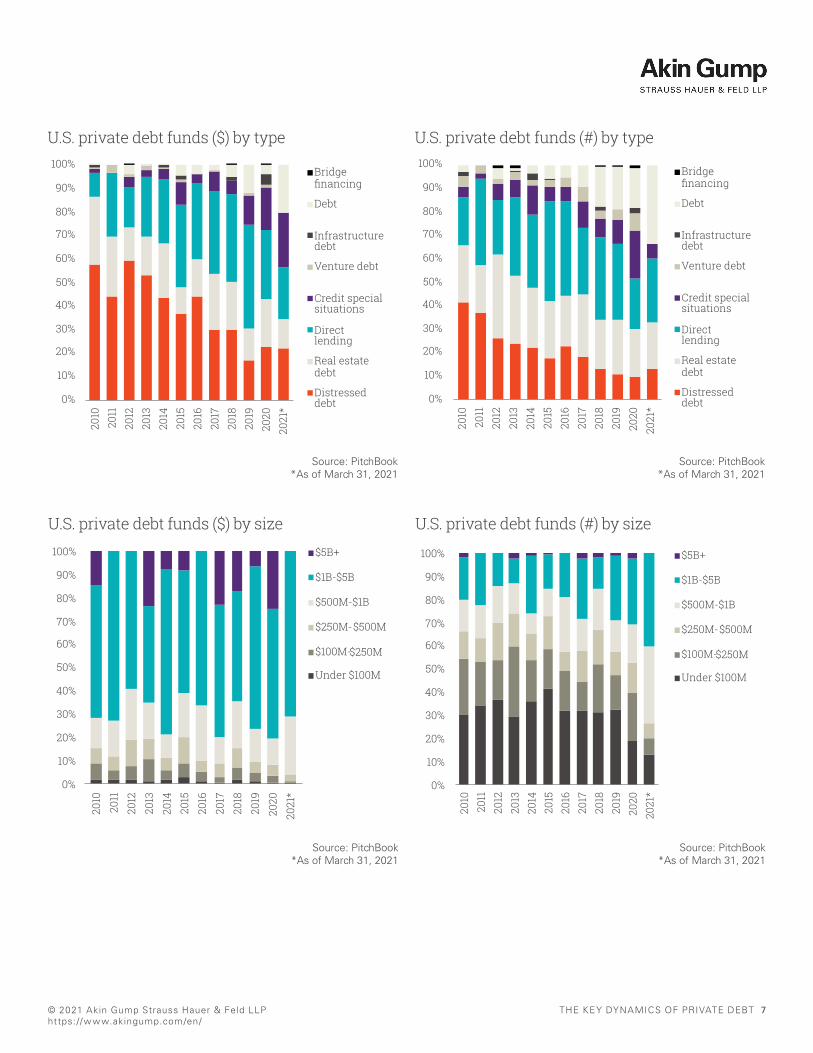
Amid the funds closed, significant variances in fund type that could prove unique to 2020 emerged. Direct lending suffered a significant pullback in the volume of funds closed, while general debt and credit special situations grew. Opportunism explains much of the shift; however, direct lending had only held steady in terms of proportion of overall private debt fundraising volume for some years, whereas other strategies grew significantly. Direct lending’s unique characteristics—reliance on PE fund managers for origination, risk profiles, and so on—lead to pros and cons, one of the latter being more prone to one-off major risk events such as the pandemic. However, direct lending will likely return to relatively healthier levels of popularity in the future. It remains to be seen how other, more niche strategies fare.
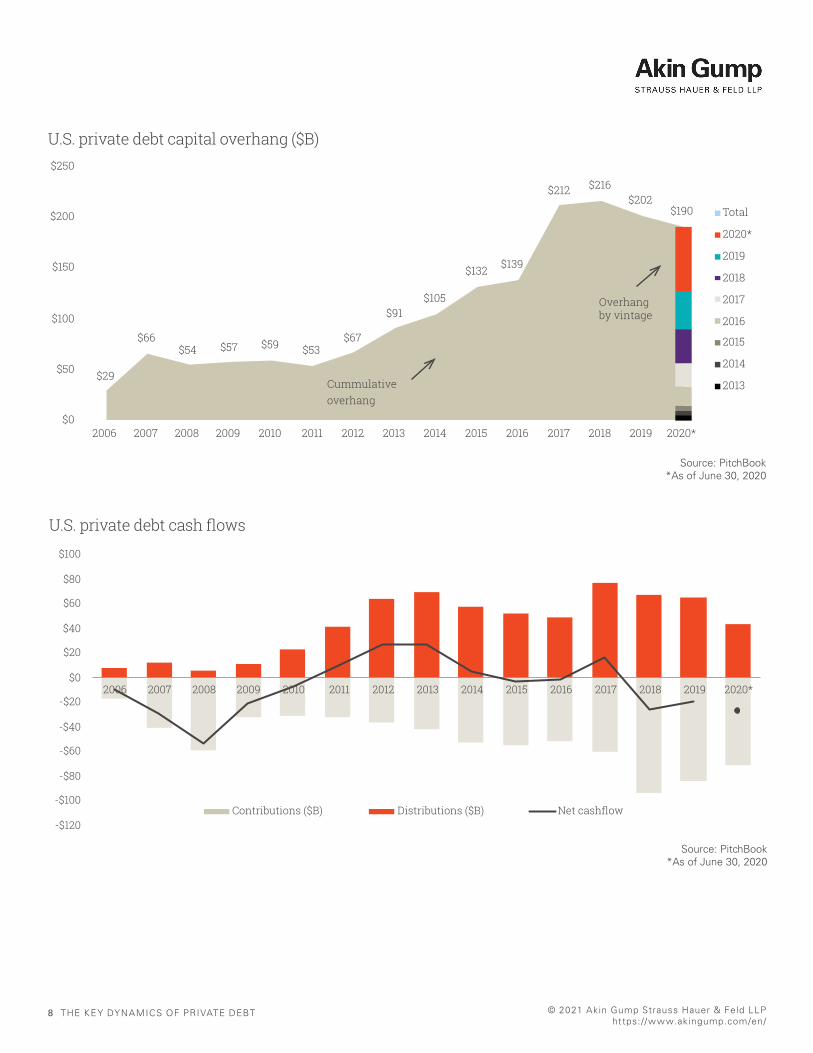
The same drivers that led to differing strategies enjoying sudden growth in popularity are also reflected in the drawdown in private debt overhang between 2019 and 2020, wherein multiple fund managers had occasion to restructure and support their various commitments and credit lines to ensure portfolio stability. This dip in dry powder also led to a noticeable jump in remaining value when decomposing assets under management (AUM). In turn, net cash flows from funds again turned into the negative territory after a slight positive surge in 2017. Notably, the three-year span prior to 2020 observed one of the stronger consistent tallies of distributions back to limited partners in private debt vehicles—a total of $209.7 billion. More recently, fundraising has outstripped such returns of capital by a fair degree, but that same popularity could yield a richer harvest in the post-pandemic environment, which will likely see persisting dislocations that could provide opportunities for private debt financiers to step in and supply capital.
$1,035.1$1,063.7
$430.0
$900.0
$0
$200
$400
$600
$800
$1,000
$1,200
2010
2011
2012
2013
2014
2015
2016
2017
2018
2019
2020
2021
*
Average Median
Source: PitchBook *As of March 31, 2021
Average & median U.S. private debt fund size ($M)
$0
$100
$200
$300
$400
$500
$600
2010
2011
2012
2013
2014
2015
2016
2017
2018
2019
2020
*
Dry powder Remaining value
Source: PitchBook *As of June 30, 2020
U.S. private debt assets ($B) under management
THE KEY DYNAMICS OF PRIVATE DEBT 7© 2021 Akin Gump Strauss Hauer & Feld LLP https: //www.akingump.com/en/
0%
10%
20%
30%
40%
50%
60%
70%
80%
90%
100%
2010
2011
2012
2013
2014
2015
2016
2017
2018
2019
2020
2021
*
Bridgefinancing
Debt
Infrastructuredebt
Venture debt
Credit specialsituations
Directlending
Real estatedebt
Distresseddebt
Source: PitchBook *As of March 31, 2021
U.S. private debt funds ($) by type
0%
10%
20%
30%
40%
50%
60%
70%
80%
90%
100%
2010
2011
2012
2013
2014
2015
2016
2017
2018
2019
2020
2021
*
Bridgefinancing
Debt
Infrastructuredebt
Venture debt
Credit specialsituations
Directlending
Real estatedebt
Distresseddebt
Source: PitchBook *As of March 31, 2021
U.S. private debt funds (#) by type
$5B+
$1B-$5B
$500M-$1B
$250M-$500M
$100M-$250M
Under $100M
0%
10%
20%
30%
40%
50%
60%
70%
80%
90%
100%
2010
2011
2012
2013
2014
2015
2016
2017
2018
2019
2020
2021
*
Source: PitchBook *As of March 31, 2021
U.S. private debt funds ($) by size
0%
10%
20%
30%
40%
50%
60%
70%
80%
90%
100%
2010
2011
2012
2013
2014
2015
2016
2017
2018
2019
2020
2021
*
$5B+
$1B-$5B
$500M-$1B
$250M-$500M
$100M-$250M
Under $100M
Source: PitchBook *As of March 31, 2021
U.S. private debt funds (#) by size
8 THE KEY DYNAMICS OF PRIVATE DEBT © 2021 Akin Gump Strauss Hauer & Feld LLP https: //www.akingump.com/en/
$29
$66$54 $57 $59 $53
$67
$91$105
$132 $139
$212 $216$202
$190
$0
$50
$100
$150
$200
$250
2006 2007 2008 2009 2010 2011 2012 2013 2014 2015 2016 2017 2018 2019 2020*
Total
2020*
2019
2018
2017
2016
2015
2014
2013Cummulative overhang
Overhang by vintage
Source: PitchBook *As of June 30, 2020
U.S. private debt capital overhang ($B)
-$120
-$100
-$80
-$60
-$40
-$20
$0
$20
$40
$60
$80
$100
2006 2007 2008 2009 2010 2011 2012 2013 2014 2015 2016 2017 2018 2019 2020*
Contributions ($B) Distributions ($B) Net cashflow
Source: PitchBook *As of June 30, 2020
U.S. private debt cash flows
THE KEY DYNAMICS OF PRIVATE DEBT 9© 2021 Akin Gump Strauss Hauer & Feld LLP https: //www.akingump.com/en/
Q&AGiven the maturation of the private debt market, as well as the unique environment induced by the COVID-19 pandemic, what are your top findings from the past 12 months?
The unique nature of the COVID-19 pandemic crisis produced a slew of both challenges and opportunities for private credit funds to help portfolio companies and establish new relationships. Q2 2020 was undeniably difficult for so many fund managers and companies given the sheer degree of uncertainty and novel challenges presented by the shock to consumer demand, required pivots in technology, and more that stemmed from the crisis. However, after the initial shock, several private debt strategies adapted and capitalized on the brand-new market needs, specifically fund managers focused on real estate, infrastructure, special situations, and distressed debt. This tells us that, given the uptick in fundraising in such vehicles, there is appetite from both target companies and limited partners for swift, opportunistic players to capitalize on their established strengths. That same adaptability was required for general private credit managers to manage their portfolios closely to prevent any one credit from “bleeding” too much during any significant economic and financial challenges presented by the pandemic. However, such adaptability was more common than one might expect, precisely due to the maturation of the debt market overall. There are more experienced, larger private credit fund managers now active in the market that had the wherewithal—both financial and experiential—to help their portfolio companies navigate through the succession of challenges presented during 2020.
A recent Bloomberg article had some insights from Akin Gump’s special situations group; building on those quotes, what is the outlook for private debt dealmaking for the year overall, having seen a few months of 2021 pass?
Dan Fisher, our head of Akin Gump’s special situations integrated group, put it well when, to paraphrase, he noted that the private debt market could continue to see a flurry of dealmaking—as volume has been robust—but both lenders and borrowers would still need to be cognizant of ongoing challenges. Although many credit portfolios weathered the severe challenges of 2020 better than could
Daniel I. Fisher PartnerDan Fisher, the co-leader of Akin Gump’s integrated special situations group, practices at the nexus of M&A, restructuring, securities and finance and has market-leading experience in the unique issues raised by distressed and special situations.
Frederick Taehoon Lee PartnerFred Lee focuses on acquisition financing transactions, such as representing alternative capital sources in connection with loan originations and distressed debt.
Jaisohn Jungbin Im PartnerJaisohn Im concentrates on financing transactions, representing private equity sponsors, hedge funds, financial investors, special situation investors, portfolio companies and other corporate borrowers focusing on private equity-related corporate finance, direct lending, special situation financings and out-of-court and in-court restructurings.

10 THE KEY DYNAMICS OF PRIVATE DEBT © 2021 Akin Gump Strauss Hauer & Feld LLP https: //www.akingump.com/en/
be expected, due to the variance in economic recoveries across geographies and sectors, there are still myriad scenarios for multiple companies. Covenant waivers, workouts and other one-off tactics that were used in restructurings last year can present complex pictures for companies given ongoing uncertainty as to the nature of any recovery in their businesses. They won’t necessarily want to renew those, but also, there is potentially less leeway the stronger a broader economic recovery gets. So that extra nuance, considering the most recent history of flexibility negotiated during periods of direr need, will have to be navigated by companies. From lenders’ perspectives, it’ll be more a matter of still hedging risk and capitalizing upon new opportunities. Competition is likely to be fierce, especially as fund managers that had to primarily manage extant credits and associated risk last year look to put their dry powder to work.
A key driver of lending activity will be PE buyout funds continuing to tap into established relationships but also in order to win out in the currently highly competitive environment, looking to secure the best loan package that could help them win out in a deal. That spate of activity will contribute to overall activity across private credit markets.
What differentiated the most successful private debt fund strategies from others over that same timeframe?
It’s been alluded to earlier: flexibility. However, to take it a level deeper, and calling back to the 2019 Akin Gump publication focused on private debt, there was a balance between lenders having anticipated and built in better cushions for risk variability overall and those that didn’t
necessarily build in such cushions but were still able to navigate novel scenarios due to niche expertise and being sole parties on transactions. Of course, some credit managers did face challenges in the onset of the COVID-19 pandemic that were exacerbated by prior easing in transactions to fend off competitors, but that is a natural cyclical outcome that happens during any unforeseen shock. Prior to the pandemic, loosening of standards that EBITDA calculations were based on occurred, which affected leverage ratios and complicated matters for some credits in fund portfolios when the crisis struck, but many were able to navigate adeptly.
Another key factor that differentiated fund managers was the level of sophistication and conservatism they brought to estimating recovery timing based on default scenarios. Some fund managers estimated more accurately with more complex and sophisticated models, as well as with the use of larger and more reliable datasets. Others simply had more innovative models. And, some were more conservative and therefore addressed the issues stemming from the pandemic or pivoted as necessary.
Do you foresee different private debt categories, (for example, direct lending) becoming more popular in 2021? Why?
As anticipated, when PE activity dropped in the middle of 2020, direct lending eventually saw the biggest hit in terms of fundraising volume due to its reliance on direct deal flow. Strategies most closely associated with distress and niche situations benefited the most. However, as the pandemic and its knock-on effects hopefully recede, we anticipate that fundraising volume will normalize back
“
“
There are more experienced, larger private credit fund managers now active in the market that had the wherewithal—both financial and experiential— to help their portfolio companies navigate through the succession of challenges presented during 2020.

THE KEY DYNAMICS OF PRIVATE DEBT 11© 2021 Akin Gump Strauss Hauer & Feld LLP https: //www.akingump.com/en/
toward strategies that ultimately can be as flexible as possible while taking advantage of economies of scale and the ability to hedge a diverse series of risks. Although eventually the memory of crises tends to fade, it will take some time for portfolio managers to unlearn the lessons in risk management taught by the pandemic. As a result, general debt will likely stay in strong demand on the part of capital allocators. The degree of demand from PE buyout funds will likely also create a return to direct lending given the advantages of that model.
Although it may be too early to tell, there could be interesting opportunities for private credit funds focused on real estate, as REITs and commercial realtors grapple with surges in demand in some locations while others see slackening or flattening occupancy rates in the coming months.
Finally, while it is difficult to predict with any measure of certainty, depending on stimulus plans encouraging infrastructure development, we will likely see public-private partnerships or privatization-focused efforts across different domiciles that could result in opportunities for major players within private credit. It’s not that opportunities will be specifically earmarked, but enterprising fund managers are likely to find opportunities to help companies capitalize on new infrastructure-related business.
The economic stresses induced by the COVID-19 pandemic prompted much reexamination of risk management minutiae in contracts and specific covenants. Have you seen any intriguing development of any of these innovations?
If they didn’t already exist, there was much restructuring of covenants, debt thresholds, flexibility in timing of payments and more—all the classic levers, just redone at an accelerated pace and normally on a one-off basis. However, what’s more interesting is what has evolved since then, in line with PE investment across the whole market. As identified by Amy Kennedy in a recent piece for Private Debt Investor, there can be significant variance in deal documentation between regions and company size. Lenders are more frequently including grower baskets tied to company performance in the case of buyouts in
the lower middle market. Contextualizing Kennedy’s observation, prior to the pandemic, PE fund managers were pushing further into the reaches of the middle market due to significant competition and record sums of dry powder. Now, add-ons of smaller companies have reached even higher levels, with the pandemic’s effects leading even more company holders to consider selling to deep-pocketed PE buyers. Such smaller businesses often have tried to ensure protection from any ongoing or even future COVID-19-related disruptions, which has prompted significant negotiation around documentation overall. Given that trading performance has been propped up by what could be temporary liquidity measures, restructurings in the future of loan packages closed during the pandemic’s duration could yield opportunities for lenders to tighten on terms and reintroduce covenants that are more desirable on their end.
““
A key driver of lending activity will be PE buyout funds continuing to tap into established relationships but also in order to win out in the currently highly competitive environment, looking to secure the best loan package that could help them win out in a deal.

© 2021 Akin Gump Strauss Hauer & Feld LLP. All rights reserved. Attorney Advertising. Prior results do not guarantee a similar outcome.
Akin Gump Strauss Hauer & Feld LLP is a leading global law firm p roviding innovative legal services and business solutions to individuals and institutions. Founded in 1945 by Richard Gump and Robert Strauss with the guiding vision that commitment, excellence and integrity would drive its success, the firm focuses on building lasting and mutually beneficial relationships with its clients. Our firm’s clients range from individuals to corporations and nations. Since 1945, Akin Gump has served clients, providing creative, effective transactional, litigation and public policy counsel and representation in industries ranging from the traditional to cutting-edge technology. From a single office and two lawyers in Dallas, the firm has grown to 20 offices spanning the U.S., Europe, Asia and the Middle East, and a diverse workforce of more than 900 lawyers, working alongside clients to address challenges and achieve goals where they live and work.
akingump.com
Methodology PitchBook private debt funds are comprised of the following subcategories: bridge financing, credit special situations, debt (general), direct lending, distressed debt, infrastructure debt, real estate debt, and venture debt. Only closed, fully invested and liquidated fund statuses were included. All other private equity datasets followed PitchBook’s reports methodology, available here.