Embed Size (px)
Citation preview
The Keys to Successful Risk Identificationy
Sim Segal, FSA, CERA, MAAAPresidentPresidentSimErgy Consulting LLC
ERM SymposiumS i 2B Th K t S f l Ri k Id tifi tiSession 2B: The Keys to Successful Risk IdentificationApril 13, 2010

Risk identification componentsRisk identification components
Risk categorization and definitionRisk categorization and definition Qualitative risk assessment
E i i k id tifi ti Emerging risk identification
Copyright © SimErgy. All rights reserved.
2

Common practice is not best practiceCommon practice is not best practice
Risk identification most common ERM stage completed, g p ,since it’s the first
Yet, suboptimal practices are pervasive, resulting in:– Incorrect prioritization from qualitative risk assessment
o Focusing on some minor riskso Missing some key risks altogether
– Inaccuracies in downstream ERM stageso Incomplete and misleading risk quantificationo Poor risk decision-makingo Improper risk disclosures
Copyright © SimErgy. All rights reserved.
3

5 Keys to successful risk identification5 Keys to successful risk identification
1) Define risks by source1) Define risks by source
2) Categorize risks evenly
3) Identify risks prospectively
4) Gather data appropriately
5) Define metrics clearly
Copyright © SimErgy. All rights reserved.
4

1) DEFINE RISKS BY SOURCE
Copyright © SimErgy. All rights reserved.
5

Risks are commonly defined inconsistently, by b th d tboth source and outcome
BySource
ByOutcome
New competitorWhich risks are
defined by source and which by
outcome?
pSupplier failureTechnology failureR t ti d outcome?Reputation damageRatings downgradeNew costly regulationsy gTerrorist attack
Copyright © SimErgy. All rights reserved.
6

Risks are commonly defined inconsistently, by b th d tboth source and outcome
BySource
ByOutcome
New competitor XpSupplier failure XTechnology failure XR t ti d XReputation damage XRatings downgrade XNew costly regulations Xy gTerrorist attack X
Copyright © SimErgy. All rights reserved.
7

Many different sources of risk can cause t ti d
OUTCOMEINTERMEDIATESOURCE
reputation damage
Lower Revenues
Negative Media
Poor Product Quality
Higher ExpensesNegative Media
CoveragePoor Customer
ServiceHigher Cost of
Internal Fraud or Scandal
Reputation Damage
Higher Cost of Capital
Poor External Relations
Lower Enterprise Value
Copyright © SimErgy. All rights reserved.
8

Ratings downgrades can be triggered by l diff t i k
OUTCOMEINTERMEDIATESOURCE
several different risk sources
Poor Strategy
Lower Revenues
Ratings Downgrade
Poor Execution
Higher Expenses
Higher Cost of
Poor Rating Agency
Higher Cost of Capital
RelationsLower Enterprise
Value
Copyright © SimErgy. All rights reserved.
9

Issues caused by inconsistent risk definitions l d h d fi i i k bare resolved when defining risks by source
Common Practice Best Practice
Inconsistent Definition Consistent Def. by SourceQualitative Risk
Survey participants not all considering same risk
Consistent understanding of each risk source by surveyRisk
Assessmentconsidering same risk source when scoring
each risk source by survey participants
RiskQuantification
Risk scenarios hampered by ambiguous definition
Risk scenarios flow logically from originating source
Risk Decision-making
Mitigation difficult to identify (since mitigation
Mitigation readily identified/evaluated:For both pre- and post-eventmaking is done at source of risk) Source and downstream impacts apparent
Copyright © SimErgy. All rights reserved.
10

2) CATEGORIZE RISKS EVENLY
Copyright © SimErgy. All rights reserved.
11

Categorize risks evenly to avoid difficultiesCategorize risks evenly to avoid difficulties
Level of Abstraction Too High Too Low AppropriateAbstraction
Example Talent management
Low retention of mid-level staff in business
Ability to recruit/retainSuccession planningLabor relationsg
segment X Etc.
Poor qualitative Causes some risks to be
Difficultiesrisk assessment, since it obscuresindividual risks within category
missed, since it may omit the overarching category andwithin category category and its other risks
Copyright © SimErgy. All rights reserved.
12

3) IDENTIFY RISKS PROSPECTIVELY
Copyright © SimErgy. All rights reserved.
13

Identify risks prospectively to avoid the “fi hti th l t b ttl ” d“fighting the last battle” syndrome
Diagnosis “Fighting the Last Battle” SyndromeDiagnosis Fighting the Last Battle Syndrome
Cause Over-emphasis in risk identification process of past events
S i k k i k li t lSymptom
Some risks on key risk list merely because of a recent past event burned into management’s memoryQualitative risk assessment scoring
Prognosis
Qualitative risk assessment scoring will be skewed, over-emphasizing risks with recent occurrencesSome risks that should be on the radar may be crowded out
Copyright © SimErgy. All rights reserved.
14

4) GATHER DATA APPROPRIATELY
Copyright © SimErgy. All rights reserved.
15

The right data, at the right time, in the right wayThe right data, at the right time, in the right way
Common Practice Best Practice
What data?
Frequency scoreSeverity scoreAdditional data
• Historical experience data
Frequency scoreSeverity score
(only purpose: identify key risks)• Historical experience data• Mitigation in place/planned• Etc.
(only purpose: identify key risks)
Additional data: during risk Selected additional data: during When?
gidentification phase (too early), and for all risks
grisk quantification (when needed), and only for key risks
TemplatesOft fill d i t i kl
InterviewsC i t t ti t hHow ? Often filled in too quickly
No live guidanceNo confidentiality
Consistent time spent on each Interactive guidance/discussionConfidential, anonymous input
Copyright © SimErgy. All rights reserved.
16

5) DEFINE METRICS CLEARLY
Copyright © SimErgy. All rights reserved.
17

Typical Frequency-Severity Scoring Guide for Q lit ti Ri k A tQualitative Risk Assessment
Frequency Severityq y y5 Very high 5 > $100M4 High 4 $50M - $100M3 Moderate 3 $25M $50M3 Moderate 3 $25M - $50M2 Low 2 $10M - $25M1 Very low 1 < $10M
Copyright © SimErgy. All rights reserved.
18
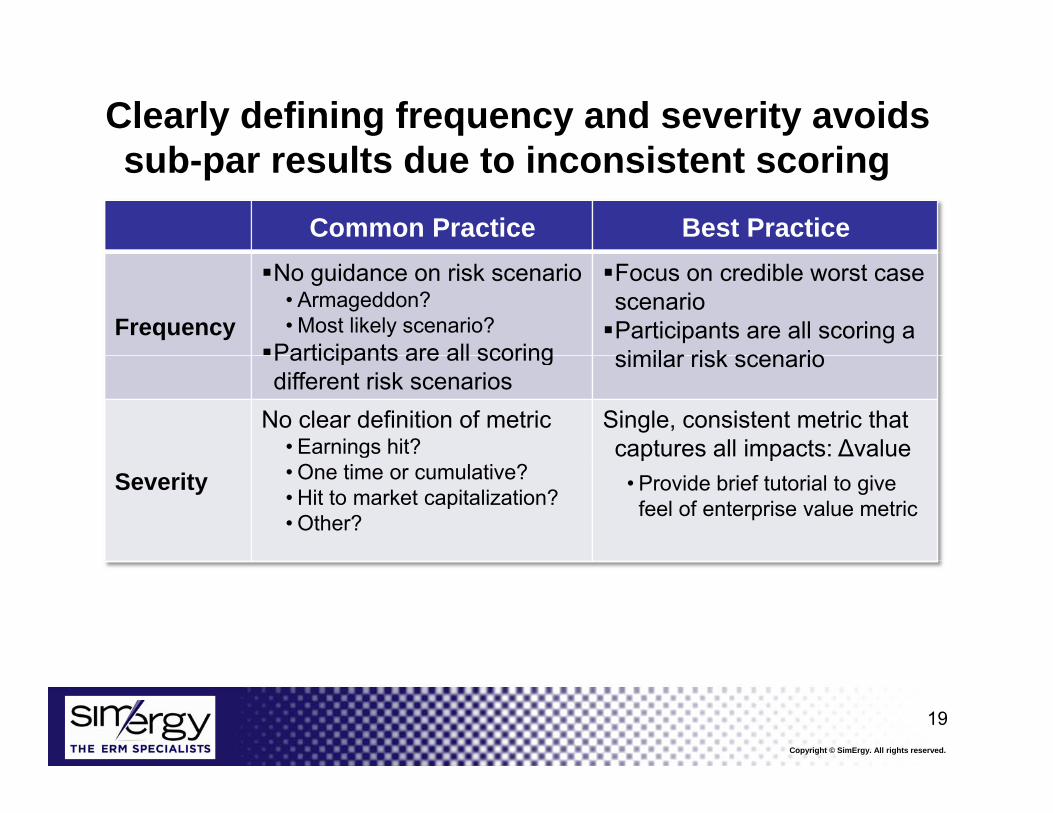
Clearly defining frequency and severity avoids b lt d t i i t t isub-par results due to inconsistent scoring
Common Practice Best Practice
Frequency
No guidance on risk scenario• Armageddon?• Most likely scenario?
Participants are all scoring
Focus on credible worst case scenarioParticipants are all scoring a similar risk scenarioParticipants are all scoring
different risk scenariossimilar risk scenario
No clear definition of metric• Earnings hit?
Single, consistent metric that captures all impacts: Δvalue
Severityg
• One time or cumulative?• Hit to market capitalization?• Other?
p p• Provide brief tutorial to give feel of enterprise value metric
Copyright © SimErgy. All rights reserved.
19

Contact informationCo tact o at o
Sim Segal, FSA, CERA, MAAAPresident
SimErgy Consulting LLCSimErgy Consulting LLCChrysler Building405 Lexington Ave., 26th FlrNew York, NY 10174
(917) 699-3373 Mobile(646) 862-6134 Office(347) 342-0346 Fax( )
[email protected] www.simergy.com
Copyright © SimErgy. All rights reserved.
20