Embed Size (px)
Citation preview
The KloudReadiness Playbook Step 5: Continuously Measure Success
Copyright © 2016 KloudReadiness, LLC Page 1 of 22
The KloudReadiness Playbook
Step 5: Continuous Success Measurement
Turn Sales and Marketing from an Art into a Science
The fifth and final success factor for building a successful Cloud and Managed Service
Provider (MSP) business is to continuously measure your success with “Metrics That
Matter”. In the previous four (4) chapters we invested considerable time and energy into
the areas of go‐to‐market strategy, business modeling, content development and process
management for your sales and marketing functions. Clearly these are critical ingredients for
success and areas in which you should feel very confident about your approach and your
execution. However, we want you to be much more than confident. We want you to be in
control of your progress and convinced of your success. We believe it is just as important to
measure progress towards meeting your goals as it is to measure your final achievement
against those goals. So in this chapter we are going to provide you with key performance
metrics that will not only allow you to measure the results of your hard work, but also the
leading indicators that show you are moving in the right direction. We will take you through
the metrics that matter most and describe how to use them on a daily, weekly, monthly and
yearly basis.
Let’s start by building on the concepts covered in Chapter 4. Recall that we began Chapter 4
with a description of the lead funnel and the sales pipeline and we emphasized the
importance of measuring your marketing and sales effectiveness separately. Measuring and
managing the lead funnel allows you to focus on how well your marketing dollars are being
spent and where your dollars are being invested for greatest impact. It also lets you track the
number of leads you are generating by program and then applying a lead qualification
process to quickly sort those leads into convenient buckets. That way, your sales team will
chase leads they are most likely to close and leads that match your ideal customer profile. By
comparing the cost, response rate and qualification rate of your marketing programs, you
can easily identify which ones are worthy of continued investment and which ones are not.
Measuring and managing your sales pipeline is a separate process and one that has very
different goals and benefits. Your sales process must efficiently convert highly qualified leads
into customers in a consistent and predictable manner. To that end, we described a pipeline
management process in Chapter 4 that assigns stages to the sales process based on
milestones and win probabilities. This allows you to measure the size and maturity of your
pipeline opportunities so you can forecast the high percentage deals and focus your
attention on improving your chances in the lower probability deals.
The KloudReadiness Playbook Step 5: Continuously Measure Success
Copyright © 2016 KloudReadiness, LLC Page 2 of 22
How to Measure Marketing Effectiveness
We will assume that you are now completely comfortable with these concepts and are ready
to put them into practice. Let’s start by looking at ways to track your lead funnel in more
detail.
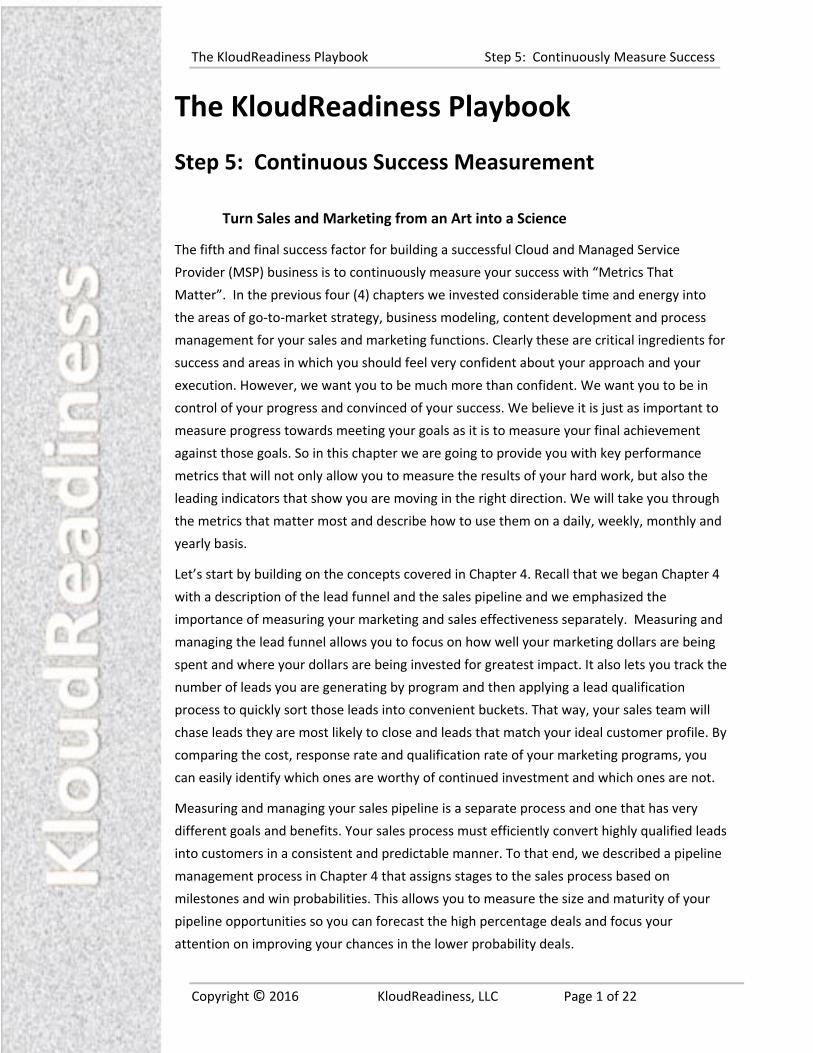
We have created a Lead Funnel Tracking Worksheet and it can be found in the appendix of
the Playbook. In this worksheet you will learn how to use the key performance metrics for
tracking the effectiveness of your marketing programs. You can use the worksheet to
measure the performance of your marketing programs by entering the number of contacts,
leads (total of unqualified leads, qualified leads and marketing leads), the number of deals
closed from each program, the average sales value and the total program cost. These inputs
are highlighted on the worksheet as yellow boxes. For each program that you analyze on the
worksheet, be sure to name the program in the yellow box provide in column C. The
worksheet will calculate the remaining values and display them in the gray boxes in columns
H, K, L and M.
Use your prospect qualification worksheet to rate the value of each lead and classify them as
qualified, unqualified or disqualified. If you don’t have qualification scores for your leads,
then estimate the number of leads in each category as best as you can. Recall that Qualified
Leads are those prospects with a score of 20 or more, Marketing Leads have a score between
10 and 20 and Disqualified Leads have a score less than 10. Now enter the number of Deals
Closed from each marketing program and the Average Sales Value (ASV) for these deals. The
worksheet will calculate the average Incremental Pipeline value that is generated by your
program and the average Incremental Revenue that was generated.
The KloudReadiness Playbook Step 5: Continuously Measure Success
Copyright © 2016 KloudReadiness, LLC Page 3 of 22
Finally, input the total Program Cost for each marketing program and compare this cost to
the average Annual Revenue that resulted from each marketing program. The worksheet will
calculate the Revenue Multiplier (program cost x multiplier equals annual revenue
contribution). It’s a somewhat crude ROI indicator, but it provides a quick and consistent way
to compare the effectiveness of your programs by comparing cost to revenue ‐ the higher
the revenue multiplier, the more effective the program.
You can also use this worksheet as a planning tool. You can create “what if” scenarios for
your programs by keying in the expected values for various programs to see what kind of
deal volume and revenue contribution will be created by them. You can also plan the cost
and frequency of your marketing programs based on your revenue targets for the coming
month, quarter or year.
How to Measure Sales Effectiveness
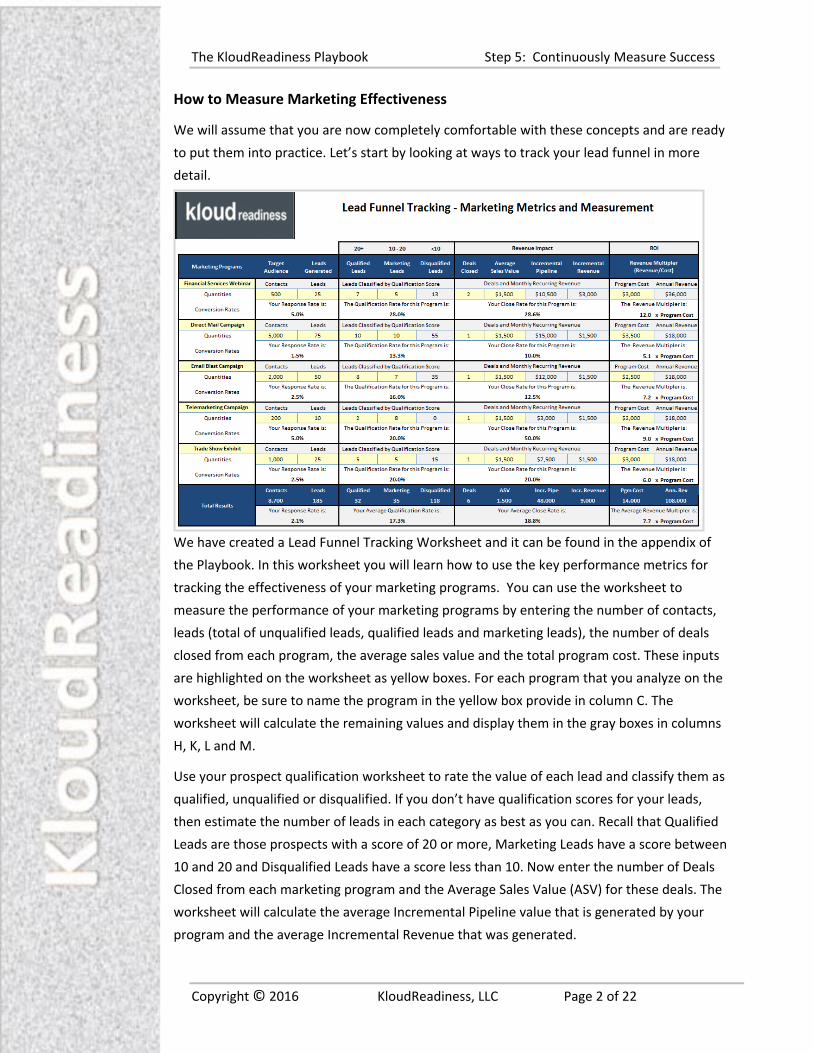
As your marketing programs generate leads, the highly qualified leads are ready to enter the
first stage of the sales pipeline. Let’s take a closer look at the pipeline management process
with a Sales Cycle and Pipeline Tracking Worksheet that you can also find in the appendix of
the Playbook.
In this worksheet you will learn how to track your sales pipeline. This will allow you to
manage the sales process more efficiently and remove the guesswork when projecting the
30, 60 or 90‐day revenue performance of your business. The pipeline tracking worksheet
follows the KloudReadiness 4‐stage sales process which tracks the sales cycle using 4 major
milestones: (1) quotation submitted, (2) making the short list, (3) becoming the selected
supplier and (4) getting a signed contract. Each stage has an assigned win probability and
The KloudReadiness Playbook Step 5: Continuously Measure Success
Copyright © 2016 KloudReadiness, LLC Page 4 of 22
they are 20%, 50%, 75% and 90% respectively. You can change these values in the worksheet
if you want to assign different percentages.
There are three additional categories that allow you to classify deals that are Closed within
the forecast period, deals that you place On Hold and deals that are Lost. The On Hold status
is meant for opportunities that are neither won nor lost but are stalled for some reason that
prevents them from progressing through the sales cycle (e.g., the funding is put on hold or a
decision‐maker is unavailable for an extended period of time).
To use the worksheet, start by keying in all of your current sales opportunities. Remember,
qualified leads are NOT opportunities. A lead becomes a sales opportunity only after a rep
visits the prospect, understands their requirements and prepares a quotation. Your sales
pipeline is not a prospect list ‐ it represents viable and closeable business for your company.
For each opportunity that you add to the worksheet, provide the initials of the sales rep
assigned to the account, the projected close date, the value of the monthly recurring
revenue (MRC), the contract term and the appropriate pipeline stage (1, 2, 3 or 4). The
worksheet will then calculate the total contract value based on the contract term and the
factored revenue value based on the pipeline stage. There is also a comments section where
you can add remarks such as the marketing program that generated the lead, key
competitors, current status and critical next steps.
After you have entered all of your sales opportunities, you might find it helpful to sort the list
based on the pipeline stage (column H). This will order your list of opportunities from the
earliest stage to the latest stage and provide an interesting visual representation of your deal
flow and distribution of deals by stage.
On the bottom of the worksheet you will find Totals and Averages for your Unfactored
Revenue, Average Deal Size, Factored Revenue, and Projected Close Ratio. Unfactored
Revenue is a total of MRC values for all deals in play (not counting deals won, lost or on
hold). Factored Revenue is the total MRC value of your deals multiplied by the win
probability based on the opportunity stage (20%, 50%, 75% and 90%). The Close Ratio is the
ratio of Factored Revenue to Unfactored Revenue. In the final analysis, the revenue you
forecast for your business must include your judgment and intuition on which deals will close
and which deals will not. Use factored revenue and close ratio metrics as a guide for guiding
and refining your own judgment before committing to a forecast number. These metrics are
not meant to be a replacement for this important management decision process.
The KloudReadiness Playbook Step 5: Continuously Measure Success
Copyright © 2016 KloudReadiness, LLC Page 5 of 22
Optimizing Your Marketing and Sales Efficiency
Now that we have looked separately at success measurement processes for sales and
marketing, let’s look at these two methodologies side‐by‐side and see how they work
together to optimize your marketing and sales efficiency.
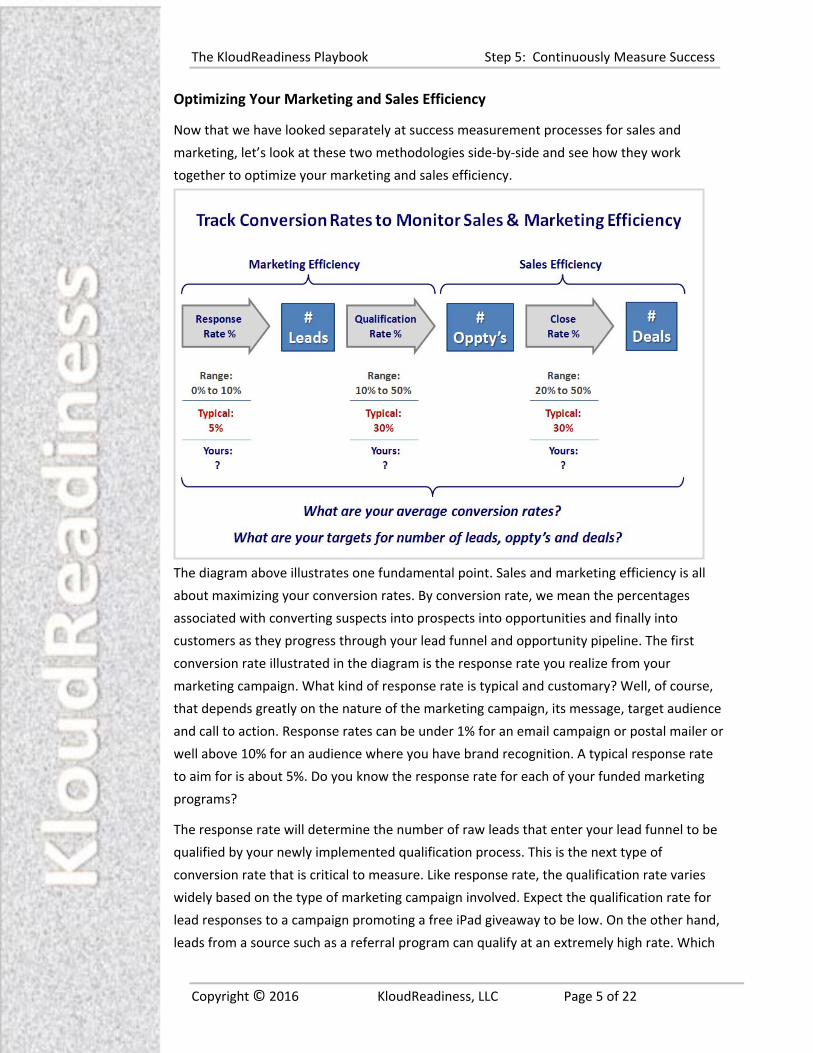
The diagram above illustrates one fundamental point. Sales and marketing efficiency is all
about maximizing your conversion rates. By conversion rate, we mean the percentages
associated with converting suspects into prospects into opportunities and finally into
customers as they progress through your lead funnel and opportunity pipeline. The first
conversion rate illustrated in the diagram is the response rate you realize from your
marketing campaign. What kind of response rate is typical and customary? Well, of course,
that depends greatly on the nature of the marketing campaign, its message, target audience
and call to action. Response rates can be under 1% for an email campaign or postal mailer or
well above 10% for an audience where you have brand recognition. A typical response rate
to aim for is about 5%. Do you know the response rate for each of your funded marketing
programs?
The response rate will determine the number of raw leads that enter your lead funnel to be
qualified by your newly implemented qualification process. This is the next type of
conversion rate that is critical to measure. Like response rate, the qualification rate varies
widely based on the type of marketing campaign involved. Expect the qualification rate for
lead responses to a campaign promoting a free iPad giveaway to be low. On the other hand,
leads from a source such as a referral program can qualify at an extremely high rate. Which
The KloudReadiness Playbook Step 5: Continuously Measure Success
Copyright © 2016 KloudReadiness, LLC Page 6 of 22
of your marketing programs has the highest lead qualification rate? You should expect a
typical marketing program to produce leads where about 30% of them meet your
qualification criteria and can be handed off to sales as a newly qualified opportunity for the
sales pipeline.
Now that you have established a flow of leads into the funnel and pipeline, you will want to
maximize your sales efficiency and convert a healthy percentage of them into customers.
This is where your pipeline tracking process comes into play. At the end of your pipeline time
horizon –30, 60 or 90 days – you will want to attain the highest close rate possible. We have
found that a close rate of 30% is a typical conversion rate. That means that you should
expect to close 30% of the qualified leads handed off from marketing and convert them into
customers. What is the average close rate for your sales pipeline? Is it consistent from month
to month or quarter to quarter? Is it also consistent from sales rep to sales rep?
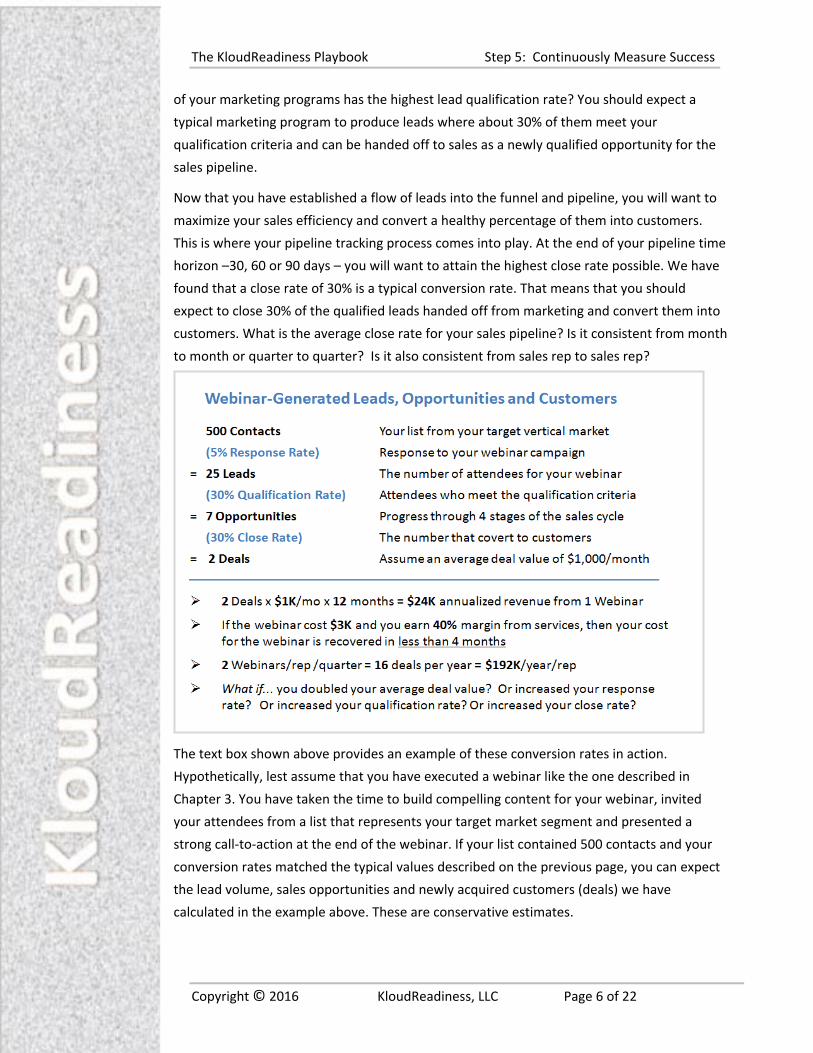
The text box shown above provides an example of these conversion rates in action.
Hypothetically, lest assume that you have executed a webinar like the one described in
Chapter 3. You have taken the time to build compelling content for your webinar, invited
your attendees from a list that represents your target market segment and presented a
strong call‐to‐action at the end of the webinar. If your list contained 500 contacts and your
conversion rates matched the typical values described on the previous page, you can expect
the lead volume, sales opportunities and newly acquired customers (deals) we have
calculated in the example above. These are conservative estimates.
The KloudReadiness Playbook Step 5: Continuously Measure Success
Copyright © 2016 KloudReadiness, LLC Page 7 of 22
Now let’s go one step further and examine the ROI for this webinar based on these
conservative numbers. If each of the two deals closed from this webinar represent an
average value of $1K per month, then over $24K of annualized revenue will be realized from
this one webinar. If the cost of producing and executing the webinar was $3K and your
margin from the incremental revenue is 40%, then you will recover the cost of the webinar in
less than 4 months of revenue from these new customers ($2K x 40% = $800 and $3k/.8K =
3.75 months).
If each of your reps held two webinars per quarter, they would drive 16 new deals per year,
or $192K of incremental sales, from this marketing activity alone. Now ask yourself these
questions: What if you could double your average deal value by targeting a new market
segment or by selling more bundled services? What if you experienced a higher response
rate or qualification rate than these very conservative numbers? What if you could improve
your close rate by managing your pipeline more proactively?
This is the power and the benefit of tracking conversion rates across the marketing and sales
process. You are suddenly able to see where you have efficiencies and where you have
inefficiencies. You are in a position to replicate what works and discontinue what does not
work. You can identify areas for continuous improvement in either the marketing function or
the sales function. Accurate and consistent measurement of these key metrics is the key to
building an effective marketing and sales machine to grow your business.
Measuring the Cost of Customer Acquisition
In Chapter 2 we talked about the importance of measuring the cost of service delivery for
your IT solutions so you can track your total service costs as well as the cost for each bundled
service offering separately. Doing so will allow you to (1) set cost targets designed to meet
your gross margin objectives, (2) manage your service costs against those targets and look
for cost reduction opportunities and (3) understand which of your services are high margin
producers and which ones are poor performers. This enables you to maximize your gross
margins.
Because your sales and marketing expenses are funded by gross margin dollars, we want to
apply the same kind of discipline to measuring and managing these costs as well. This helps
you to maximize the net profitability of your business and this is your ultimate end goal.
Higher net operating margins translate to three fundamental benefits: (1) you get to keep
more of the dollars generated by your business, (2) you are better able to invest in the
growth of your business and (3) you will increase the valuation of your business if and when
the day comes that you wish to sell it. For these reasons, we will measure the costs
associated with sales and marketing together. We will look at them in the context of your
total cost of customer acquisition or COA.
The KloudReadiness Playbook Step 5: Continuously Measure Success
Copyright © 2016 KloudReadiness, LLC Page 8 of 22
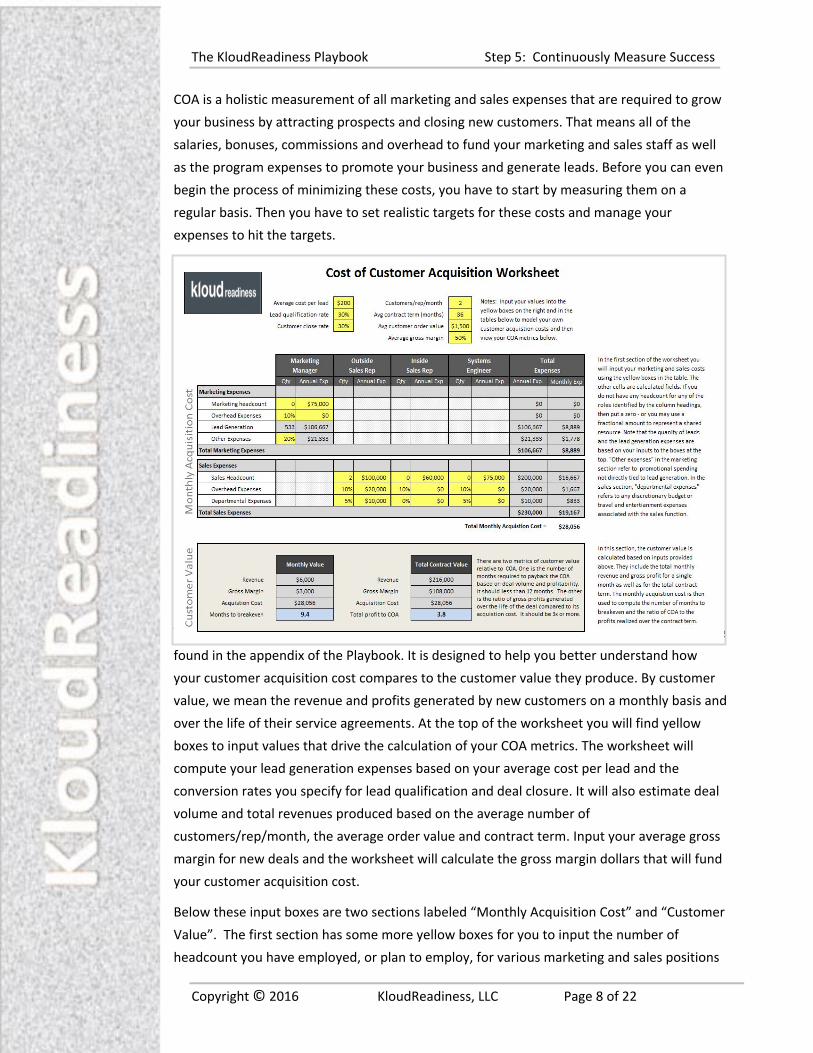
COA is a holistic measurement of all marketing and sales expenses that are required to grow
your business by attracting prospects and closing new customers. That means all of the
salaries, bonuses, commissions and overhead to fund your marketing and sales staff as well
as the program expenses to promote your business and generate leads. Before you can even
begin the process of minimizing these costs, you have to start by measuring them on a
regular basis. Then you have to set realistic targets for these costs and manage your
expenses to hit the targets.
The screen shot above is taken from the Cost of Customer Acquisition Worksheet that can be
found in the appendix of the Playbook. It is designed to help you better understand how
your customer acquisition cost compares to the customer value they produce. By customer
value, we mean the revenue and profits generated by new customers on a monthly basis and
over the life of their service agreements. At the top of the worksheet you will find yellow
boxes to input values that drive the calculation of your COA metrics. The worksheet will
compute your lead generation expenses based on your average cost per lead and the
conversion rates you specify for lead qualification and deal closure. It will also estimate deal
volume and total revenues produced based on the average number of
customers/rep/month, the average order value and contract term. Input your average gross
margin for new deals and the worksheet will calculate the gross margin dollars that will fund
your customer acquisition cost.
Below these input boxes are two sections labeled “Monthly Acquisition Cost” and “Customer
Value”. The first section has some more yellow boxes for you to input the number of
headcount you have employed, or plan to employ, for various marketing and sales positions
The KloudReadiness Playbook Step 5: Continuously Measure Success
Copyright © 2016 KloudReadiness, LLC Page 9 of 22
along with their annual salaries. There are also cells for you to specify a percentage for
estimating any overhead expenses required to fully burden these salaries. Overhead includes
the cost of benefit programs and a facilities expense allocation if you maintain an office for
them. In the marketing expense section you will notice that the lead generation expenses are
calculated for you based on average cost per lead and the volume of leads required to drive
the customer acquisition rate. The lead volume required on an annual basis is calculated and
inserted in the “Qty” column and the annual lead generation expenses are found in the next
column over. “Other Expenses” refers to any marketing budget dollars that are not directly
associated with lead generation. This would include the cost of your website, marketing
literature, outside contractors, trade association fees, etc. The worksheet estimates these
expenses as a percentage of your lead generation expenses. The default value is 20% but you
can change this percentage, or the actual dollar value, to reflect your own situation.
The sales expense section has areas to capture the cost of the various positions in your sales
organization. We have used positions that make up a typical sales organization as described
in Chapter 4. They include outside sales rep, inside sales rep and pre‐sales systems engineer.
Input the headcount values for each position as well as overhead and departmental
expenses. The departmental expenses should include any budget for discretionary spending
items such as travel, entertainment and office supplies.
After you input values into all of the yellow boxes, you will see a total customer acquisition
cost that includes all marketing and sales expenses calculated on an annual and a monthly
basis. For the purpose of measuring COA metrics, we are only interested in the total monthly
acquisition cost. You will see this number on the bottom right hand side under the first
section of the worksheet. This number is used in the second section of the worksheet to
compare your monthly COA with the amount of customer value those COA dollars generate.
The section labeled “Customer Value” shows the revenue and gross margin value that is
produced by all of the customers generated by your sales and marketing resources during
the course of one year. In other words, the number of customers/rep times the number of
reps times the average order value drives the total revenue value. The monthly value of this
incremental revenue is calculated along with the gross profit (based on your average gross
margin percentage). Because these gross margin dollars are used to fund the COA, we are
interested in the number of months it will take to payback this investment. You will find the
“Months to Breakeven” value in the bottom cell of the “Monthly Value” column. Your goal is
to have the number of months to breakeven be less than 12 months so that all of the
investment required to acquire a long‐term customer is paid back within the first year of the
contract. Lower numbers indicate a more efficient customer acquisition model and higher
numbers indicate a less efficient model. If your COA is recaptured in 6 to 12 months, you are
running very efficient sales and marketing organization.
The KloudReadiness Playbook Step 5: Continuously Measure Success
Copyright © 2016 KloudReadiness, LLC Page 10 of 22
Next to the “Monthly Value” column is a second column labeled “Total Contract Value”. This
column measures a COA metric that reflects the long term value of your customer
acquisition model. It compares the lifetime value (i.e., profitability) of your customers to the
COA required to produce it. The total contract value of new customers is calculated based on
the average contract term specified. The total gross profits are then calculated based on the
average gross margin percentage. The gross profits are then compared to the COA and
expressed as a ratio. If the ratio of total lifetime value (total gross profit) is three times the
acquisition cost or greater, you have a very efficient customer acquisition model.
These principles for measuring COA and the metrics calculated by the worksheet to measure
the efficiency of your customer acquisition model are used by many successful monthly
recurring revenue businesses. From Software as a Service (SaaS) and cloud computing
companies to managed service providers, any business that must invest short term dollars to
acquire customers with long term value must have metrics to evaluate the return on their
COA investment. This is the methodology they use. It is also the methodology used by
prominent venture capital firms and investment bankers when they consider making an
xMSP investment or when facilitating an MSP acquisition. In addition to the size of your
installed customer base and the tangible assets you possess, the valuation of your business
will be based on these two very important criteria.
Do you have a scalable and repeatable business model? Investors and acquirers want
to know that their invested capital will generate a low risk return in the form of
profitable growth. Your business model will come under intense scrutiny to ensure it
will produce a healthy return on investment. By implementing your own best
practices for managing the lead funnel and sales pipeline, along with a cost effective,
predictable and scalable model for sales and marketing, you will be ready for this
level of scrutiny.
What is the net profitability of your operation? The days of assigning valuation based
on a multiple over sales are fading fast. The more prevalent valuation methods place
a strong emphasis on net profits, or more specifically your Earnings Before Interest,
Taxes and Amortization Expenses (EBITA). The two most critical, controllable and
costly elements affecting EBITA are your cost of service delivery (see Chapter 2) and
your cost of acquisition (see Chapter 4). Cost of service directly impacts your gross
margin while COA directly impacts your net margin. Take the necessary steps to
optimize both and it will pay huge dividends in the end.
As you begin to examine the Cost of Customer Acquisition Worksheet, you will notice that
there are two tabs – one labeled “Partial Territory” and the other labeled “Full Territory”.
This allows you to create a “before and after” comparison of a partial sales territory that has
only one or two sales reps with a full sales territory that has a complete staff of
The KloudReadiness Playbook Step 5: Continuously Measure Success
Copyright © 2016 KloudReadiness, LLC Page 11 of 22
inside/outside reps, technical pre‐sales support and a dedicated marketing resource. The
screen shot provided earlier in this chapter represents a partial territory scenario. This
scenario assumes that you are just getting started with building your scalable sales and
marketing operation and you need a baseline, or starting point, for measuring your COA
metrics. This is an important first step. It will tell you where you are in‐control of your
customer acquisition expenses and where you are not. It will tell you how efficient your
current sales model is performing and what level of improvement you may want to target for
the future. Is your current COA being recovered within 12 months? Is the ratio of gross profit
generated over the life of the contract related to the customer acquisition cost 3 times or
more? If not, you should carefully assess your current marketing and sales costs and
performance levels to identify areas for improvement. The proven best practices that are
presented in this Playbook are designed to optimize sales and marketing performance. The
more successfully you implement them, the greater the impact they will have on your COA
metrics.
The beauty of COA metrics is how they point out which factors matter most in controlling
your acquisition cost and maximizing customer value. What are these factors? They are all on
the worksheet and represented by the yellow boxes that drive the COA formulas. For
example, your average cost per lead bears a direct correlation to the amount of lead
generation investment needed to drive sales. Similarly, your conversion rates have a direct
impact on the volume of raw leads that must be generated to sustain the deal volume
required. Your average order value drives the amount of revenue that will pay back your
acquisition cost. Your gross margin percentage determines profitability and how fast you
break even. It also determines lifetime profits realized over the full contract term and is
reflected in the ratio of long term customer value to its acquisition cost. To improve your
COA metrics, focus on these critical efficiency drivers: cost per lead, conversion rates (lead
qualification rate and customer close rate), average order value and gross margin
percentage. And, of course, hold down the cost of labor and closely manage your
departmental expenses and overhead. We will summarize these and all of the key “Metrics
That Matter” later in this chapter.
After you have input your current values into the worksheet and have a baseline for your
current COA metrics, you are ready to model these metrics with a fully staffed and ramped
sales territory. This is the purpose of the second tab in the worksheet. It contains the cost
factors for an up‐and‐running sales organization that is managed according to the sales and
marketing best practices provided in this Playbook.
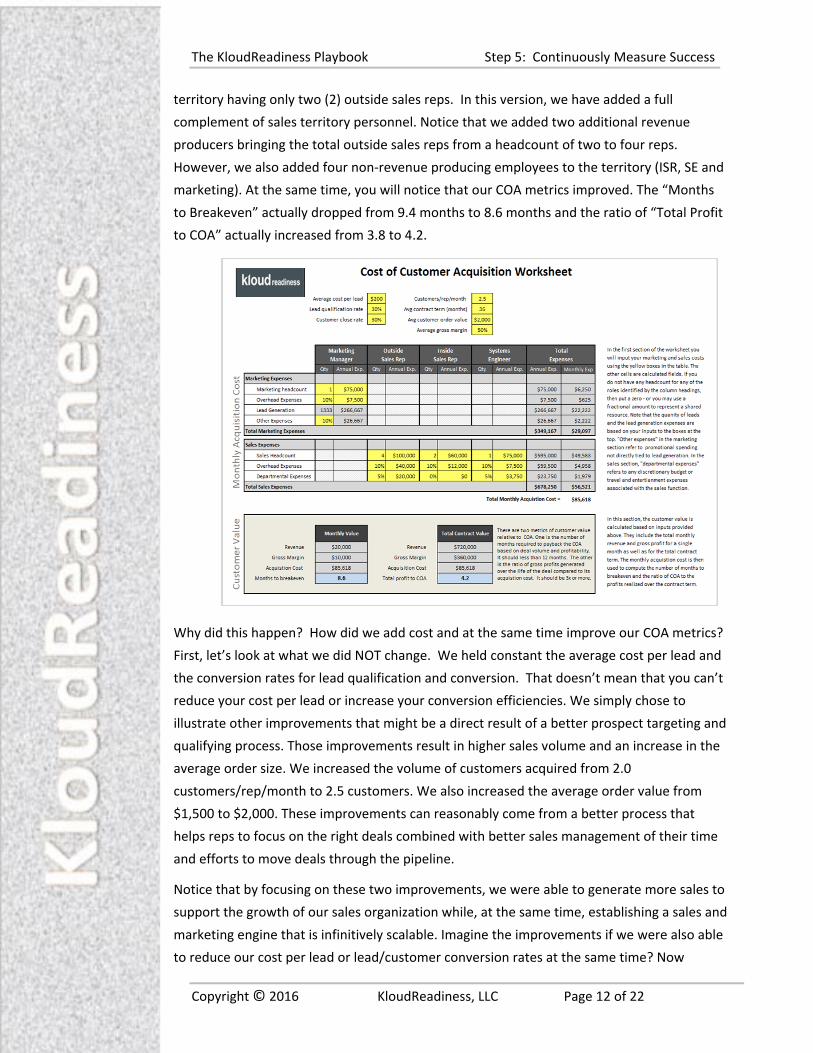
A screen shot for a full territory is provided below. We will use hypothetical values to
illustrate how you can monitor the impact of a scaled and well‐managed marketing sales
operation on your COA metrics. In the first version of the worksheet, we modeled a partial
The KloudReadiness Playbook Step 5: Continuously Measure Success
Copyright © 2016 KloudReadiness, LLC Page 12 of 22
territory having only two (2) outside sales reps. In this version, we have added a full
complement of sales territory personnel. Notice that we added two additional revenue
producers bringing the total outside sales reps from a headcount of two to four reps.
However, we also added four non‐revenue producing employees to the territory (ISR, SE and
marketing). At the same time, you will notice that our COA metrics improved. The “Months
to Breakeven” actually dropped from 9.4 months to 8.6 months and the ratio of “Total Profit
to COA” actually increased from 3.8 to 4.2.
Why did this happen? How did we add cost and at the same time improve our COA metrics?
First, let’s look at what we did NOT change. We held constant the average cost per lead and
the conversion rates for lead qualification and conversion. That doesn’t mean that you can’t
reduce your cost per lead or increase your conversion efficiencies. We simply chose to
illustrate other improvements that might be a direct result of a better prospect targeting and
qualifying process. Those improvements result in higher sales volume and an increase in the
average order size. We increased the volume of customers acquired from 2.0
customers/rep/month to 2.5 customers. We also increased the average order value from
$1,500 to $2,000. These improvements can reasonably come from a better process that
helps reps to focus on the right deals combined with better sales management of their time
and efforts to move deals through the pipeline.
Notice that by focusing on these two improvements, we were able to generate more sales to
support the growth of our sales organization while, at the same time, establishing a sales and
marketing engine that is infinitively scalable. Imagine the improvements if we were also able
to reduce our cost per lead or lead/customer conversion rates at the same time? Now
The KloudReadiness Playbook Step 5: Continuously Measure Success
Copyright © 2016 KloudReadiness, LLC Page 13 of 22
imagine that we are concurrently managing down our cost of service delivery to improve the
gross margin percentage. Then imagine the impact of those gross margin contributions on
our COA metrics. There are many opportunities to improve efficiencies.
As you will probably agree, measuring COA metrics is a powerful way to monitor and manage
continuous improvements in the efficiency of your sales and marketing engine. You can
measure your COA for your business as a whole or for each one of your sales territories
individually. COA provides a framework for you to predetermine the profitability of a
standard sales territory and allows you to invest in new sales territories with confidence. The
framework also provides a mechanism for you to compare the operational efficiency of one
sales territory against another territory or against the baseline metrics of a standard
territory. Success measurement based on COA is an essential part of the formula for building
a scalable xMSP business. It helps you to establish a predictable sales model and provides
the means by which you can measure and manage its operational efficiency. As we have
been saying throughout this Playbook, successful sales and marketing is not an art, it’s really
all about the science.
Your Sales and Marketing Dashboard
We have covered a number of metrics in a variety of areas related to cost, efficiency and
performance. Of course, metrics can be established for almost any aspect of your business
and you can measure them constantly, but there is a point of diminishing returns when it
comes to metrics. There comes a point when there are simply too many numbers involved
and you find yourself looking at reports that don’t help you run your business. They become
metrics for the sake of metrics. We don’t want that and you don’t want that. So we have
defined the key metrics that represent the most critical elements of running a successful
sales and marketing operation. We call them the “Metrics That Matter”. At this point in our
discussion, it is important for you to take stock of these key metrics and thoroughly
understand how to use them on a regular basis. As the owner or management executive in
charge of managing sales and marketing, the goal is for you to have the ingredients for a
management dashboard that helps you drive your business effectively and efficiently. You
will want to monitor some of these key metrics weekly as you manage your sales reps on an
individual basis. Some metrics will be more appropriate to measure on a monthly or
quarterly basis as a rolled up measurement of the sales and marketing function. And some of
them will be important to compare annually to track your business against your annual
growth targets.
The KloudReadiness Playbook Step 5: Continuously Measure Success
Copyright © 2016 KloudReadiness, LLC Page 14 of 22
The Top Fifteen (15) “Metrics That Matter”
In the pages that follow, we will review the top fifteen metrics that matter. These are the
metrics that have the most impact on building a predictable and profitable sales and
marketing engine for your xMSP business. You will recognize most of them from the
worksheets covered in the five (5) chapters of the Playbook. Use these worksheets, and the
key metrics they contain, on a regular basis to manage your sales and marketing engine. You
can also build these metrics into reports generated by your Customer Relationship
Management (CRM) or Professional Services Automation (PSA) systems.
Lead volume: This metric is used to track the quantity of leads that your marketing function
must generate within a given timeframe to produce the pipeline volume required to meet
revenue targets. Lead volume can be a monthly, quarterly or annual objective but it should
always be measured on a monthly basis to ensure a consistent flow of leads into the lead
funnel and ultimately the opportunity pipeline.
Lead qualification rate: If lead volume is your measure of quantity, then lead qualification
rate is your measure of quality. These two metrics are complementary and should be
measured at the same frequency. High lead volume is not helpful if the quality is low and,
conversely, high lead quality is nice but you need sufficient quantity to drive pipeline
volume. A qualified lead is a lead that meets the majority of your criteria for entering the
sales pipeline. We recommend that you measure only the highest qualified leads
(qualification scores of 20 or higher). These are your “A” leads. Leads with a lower score are
either “B” leads (scores between 15 and 20) or “C” leads (unqualified leads). Leads that are
disqualified are simply discarded.
Cost per lead: The first two key metrics provide concrete measurements of quality lead
production. The cost per lead metric determines the cost of producing each qualified lead. It
is simply the total cost of the marketing programs used to generate all leads divided by the
number of qualified leads. So, if a lead gen program cost $5,000 to execute and it produced
25 qualified leads, then your cost per lead is $200. All of the other leads generated by the
program are not counted as they would artificially reduce the cost per lead. We only care
about the leads that have the ability to convert to the pipeline as opportunities and drive
incremental revenue and new customer acquisition.
Pipeline Deal Volume: As the first in a series of sales metrics, pipeline deal volume is your
primary measure of the sales activity that has the potential to create revenue. You always
want to have a solid understanding of how many deals are in your pipeline – on a sales rep
basis, territory basis and for the total sales force. To use a baseball analogy, deals in the
pipeline, are your “at‐bats”. The more at‐bats you have, the more opportunity you will have
to score runs in the ballgame. The sales function operates the same way.
The KloudReadiness Playbook Step 5: Continuously Measure Success
Copyright © 2016 KloudReadiness, LLC Page 15 of 22
Pipeline Revenue Value: While pipeline deal volume is a measure of sales activity, you will
also need a metric to measure the potential revenue value for that activity. Pipeline revenue
value is a measure of the factored and un‐factored revenue value of your pipeline. Factored
revenue is not a forecast; it provides an at‐a‐glance measure of the revenue value contained
in your pipeline by factoring in the win probability based on the stage of each opportunity in
the sales cycle. This prevents a false sense of security that can result from assuming that 10
deals each with a potential value of $2,000 is going to result in $20K of new revenue ‐ even if
they are all at the first stage of the sales cycle. You may only win 25% of those deals, so if you
factor the value accordingly, you will have a more realistic view of the pipe. At the same
time, you may want to compare the factored revenue with the un‐factored value to have
both perspectives of your pipeline.
Opportunity Close Rate: Similar to the marketing metric for the lead qualification rate, the
opportunity close rate is a conversion metric that tells you how many sales opportunities
are closed, or converted into new customers. This is your measure of sales efficiency and
one that you will want to compare between individual sales reps and across sales
territories. You can also use this metric to evaluate the type of deals that are closed. For
example, your close rate for one vertical market segment might be higher than another
segment. The magnitude of the deal can also be useful to compare to close rate. If you are
successful at closing small, short cycle deals but unsuccessful at closing large deals with a
long sales cycle, then you have an issue to address or a decision to make – either figure out
how to win the major deals or stop chasing them.
Average Customer MRC: This metric is important for projecting the growth of your xMSP
business. It is the average monthly sales value of a new customer order. Increasing the
average customer MRC is an important goal and one that is often identified by xMSPs. If
your average MRC is low, say $500 to $1,000, then you must run a high volume business
with a very low COA in order to scale profitably. As you increase your average MRC you will
accelerate your growth and profitability dramatically. A low average MRC can also be an
indication of a problem selling the value of your xMSP service or bundling together more of
your services to upsell the total deal value. It can also be an indication that you are
competing with another xMSP that is able to win those larger deals at your expense.
Monitor your average MRC and constantly look for ways to maximize its value
Customer Acquisition Rate: This metric is sometimes referred to as deal velocity. It is a
measure of how many customers you acquire within a span of time. Put another way, it is
the rate that your sales staff can close deals in the pipeline and add new customers to your
business. This is a key metric for tracking the scalability of your business. If your customer
acquisition rate is 2 customers/rep/month and your average MRC is $2,000, then with two
reps you can grow your business by $8k per month in recurring revenue during the first
The KloudReadiness Playbook Step 5: Continuously Measure Success
Copyright © 2016 KloudReadiness, LLC Page 16 of 22
year. As a result, your business will realize $1.15 million in annual revenue from those deals
during the second year after they all produce a full 12 months of recurring revenue.
Customer acquisition rate is a key metric used to plot a trajectory to meeting long term
growth targets – after one year, three years, five years, etc.
Average Revenue per Rep: This metric represents the monthly recurring and annualized
revenue that your sales reps generate for your business. It is an important metric for
setting your growth targets and establishing resource requirements. It is also important for
defining performance goals in your sales compensation plans. If your sales force does not
generate sufficient revenue per rep, then one of two undesirable outcomes will occur: (1)
your COA will be too high relative to the value of new customers acquired or (2) your
business will scale at a low rate of growth. Your average revenue per rep should result in
COA metrics that fall in the ranges outlined in this chapter – 6 to 12 months to breakeven
and a ratio of COA to lifetime value (gross profit) of 3x or more.
Cost of Service Delivery: To maximize total gross margin, you must have an accurate
measurement of your cost of service delivery. This metric includes all of the cost elements
required to deliver the cloud and managed services represented by your MRC. That means
all of the labor, facilities and overhead costs as well as any outsourced or white label
services that are included with your solution. These costs were detailed in Chapter 2 and
also in the Pricing and Packaging Worksheet. You can measure your cost of service delivery
as an aggregated cost for all cloud and managed services or separately for individual IT
Solutions (service bundles) that have been priced separately with their own MRC.
Gross Margin Percentage: Gross margin percentage represents the total gross profit
generated by your newly acquired customers after subtracting the total cost of service
from total revenue. Measure your gross margin percentage for all services across all
customers to get an aggregated value. Then measure it for each IT solution that is delivered
to your targeted customer segments to determine your most profitable customers.
Calculate your gross margin percentage on both a monthly and an annualized basis. That
way you can see trends that occur during the year to understand if your gross margin is
trending up or down. You can also track the blended gross margin for your business on an
annual basis.
The KloudReadiness Playbook Step 5: Continuously Measure Success
Copyright © 2016 KloudReadiness, LLC Page 17 of 22
Cost of Acquisition: As detailed in this chapter, your cost of acquisition is the total
marketing and sales investment that is required to acquire new customers for your
business. It is a key metric for managing the efficiency of your sales and marketing function
and it is also a vehicle to maximize the value of your net operating profits. Two COA metrics
are important to measure: (1) the months required to breakeven (payback) the COA
investment with gross margin dollars and (2) the ratio of life time customer value
(profitability) to the COA investment. The first COA metric should be less than 12 months
and the second COA metric should be a ratio of 3:1 or greater.
Average Contract Term: The average contract term of the customers you acquire is used
to compute their lifetime value in terms of revenue and gross profits. Longer contract
terms translate to a higher lifetime value while shorter contract terms will reflect a lower
lifetime value. If you are like most xMSP businesses, you probably offer several options for
contract terms ranging from 12 months to 60 months ‐ with 36 and 48 month agreements
being most common. This metric represents the average term for all of your agreements
and it is an important metric for representing the value of your business. If you can
maintain a high average contract term, it signals to future investors and potential acquirers
that you have built a very solid and stable business with a customer base that is locked
down by long term contracts. However, this metric is not the sole indicator of customer
retention nor is it the most accurate measure of lifetime customer value. After all, we
expect a very high percentage of your customers to renew their agreements. And there will
probably be some small percentage of your customers who, for whatever reason, do not
complete a full contract term. For this reason, we have identified a second metric to
provide a more complete assessment of customer retention. That metric is the customer
churn rate and it is described below.
Average Contract Value: A metric that closely parallels the average contract term is the
average contract value. This metric is the average customer MRC multiplied by the average
contract term. For example, if your average MRC is $2,000 and your average contract term
is 36 months, then your average contract value is $2,000 x 36 = $72,000. In the calculation
of COA metrics, we take your average contract value and multiply it by your gross margin
percentage to compute the average lifetime value of a customer. Then we compare the
lifetime value to the cost of acquiring that customer. This is also a metric that investors and
acquirers look at when assessing your business and assigning a valuation for its worth. If
your business combines high average contract value with high gross margin production,
your valuation will reflect this very strong financial position.
Customer Churn Rate: As stated above, average contract value is a standard metric that
allows us to compute the COA metrics that gauge sales and marketing efficiency and
position the strength and stability of the business to potential investors and acquirers.
The KloudReadiness Playbook Step 5: Continuously Measure Success
Copyright © 2016 KloudReadiness, LLC Page 18 of 22
However, a separate and more accurate assessment of your customer retention is to
measure your customer churn rate. Customer churn is the number of customers that either
cancel their service or are terminated by the business within a fixed period of time. The
churn rate is the percentage of lost customers to total customers and is often expressed as
both a monthly and an annual value. If your monthly churn rates are less than 1%, you will
be considered to have a very loyal and satisfied customer base. This metric, combined with
a strong contract renewal rate can be used to augment assessment of lifetime customer
value, which only considers a single contract term.
Building “Reports That Matter”
Now that you understand the top fifteen metrics that matter, your next step will be to
integrate them into a daily, weekly, monthly and yearly management and review process.
You will want to look at some of these metrics weekly (perhaps even daily). Your sales
pipeline reports are a good example. Changes in pipeline status can happen at any time
and the availability of your reps to review the status of their individual accounts can be a
moving target. So you will want to have access to the most current pipeline data at all
times.
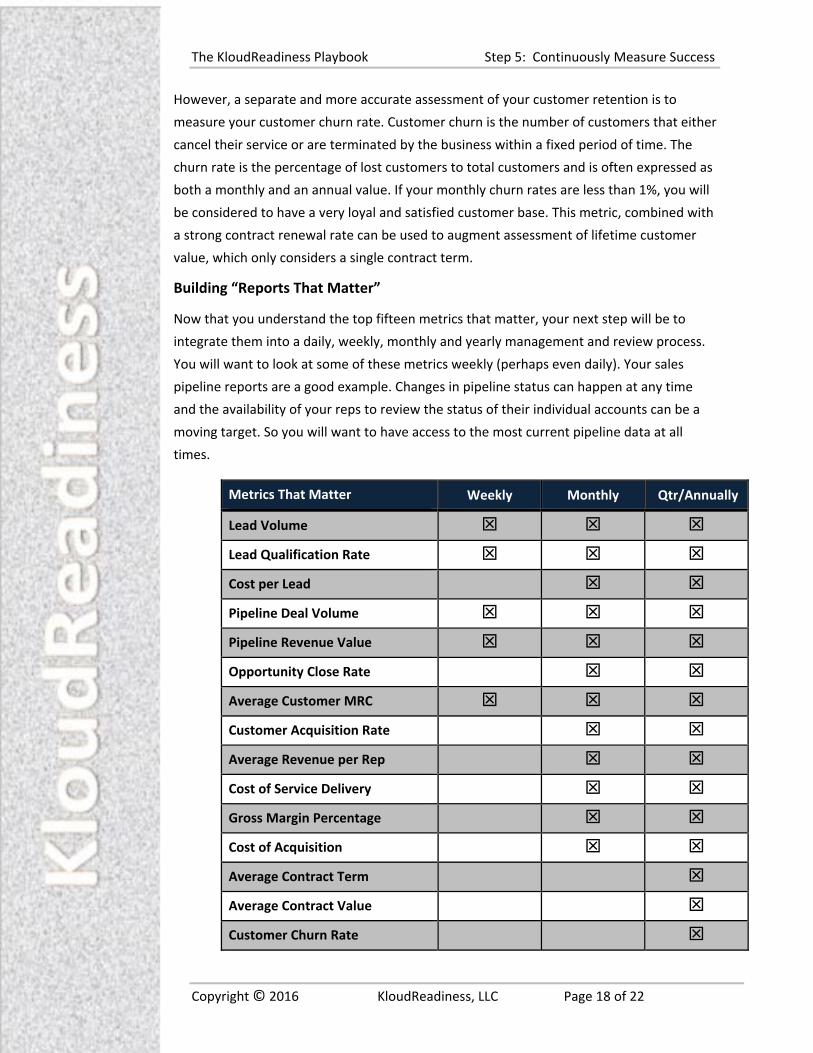
Metrics That Matter Weekly Monthly Qtr/Annually
Lead Volume
Lead Qualification Rate
Cost per Lead
Pipeline Deal Volume
Pipeline Revenue Value
Opportunity Close Rate
Average Customer MRC
Customer Acquisition Rate
Average Revenue per Rep
Cost of Service Delivery
Gross Margin Percentage
Cost of Acquisition
Average Contract Term
Average Contract Value
Customer Churn Rate
The KloudReadiness Playbook Step 5: Continuously Measure Success
Copyright © 2016 KloudReadiness, LLC Page 19 of 22
Other metrics are more appropriate to review on a monthly or annual basis and most likely
with a wider audience, like your executive management team or your board of directors.
We have created the table above to provide our recommendations for translating the
“Metrics That Matter” into “Reports That Matter”. The table indicates which metrics you
may want to build into reports that are generated on a weekly, monthly or annual basis.
Integrating some or all of these reports into your management process is essential to
achieving sales and marketing success. Once you have an understanding of the concepts
behind these metrics and how to apply them to your business, don’t stop there. Take the
next step and use them. Take advantage of the worksheets in this Playbook for tracking as
many of these metrics as possible. Yes, we created them as an instructional aid for teaching
sales and marketing best practices. However, we also designed them to provide you with
interim reports ‐ a bridge to building your own automated systems for tracking these critical
metrics within your own CRM or PSA. In fact, starting with a manual process is the best way
to define the metrics, methodologies and management reports that matter most to you and
your business. We have aided the manual process with our worksheets. Use them and refine
the process and business logic before building a fully automated system. Then automate the
process by customizing your existing internal CRM/PSA systems.
Weekly Reports That Matter
The weekly metrics and reports that you should focus on can be based on the lead funnel
tracking and sales pipeline worksheets. Simply update these worksheets as described at the
beginning of this chapter and you will be on your way to tracking all of the key metrics for
your marketing and sales function. Update the lead funnel tracking report whenever you
start or complete a lead generation campaign. It has inputs for you to provide values for lead
volume and the number of qualified leads (based on the qualification score). The worksheet
will tell you the lead qualification rate for each of your programs. It also has space for you to
indicate how many customers were closed from each campaign and it will provide a program
ROI based on cost versus revenue. Update the sales pipeline tracking worksheet whenever
you get status updates from your sales reps – or better yet, make each rep responsible for
their own updates and have them sent to you once or twice a week. The updated worksheet
will act as your daily dashboard and your weekly pipeline report until you decide to take the
necessary steps to integrate the worksheet into your CRM/PSA to fully automate the
process. The worksheet provides a number of key metrics that are essential to successfully
manage the sales process including the deal volume, the factored or unfactored revenue
value and the average customer MRC. It provides all of these metrics by sales rep and totals
these values for all sales reps.
The KloudReadiness Playbook Step 5: Continuously Measure Success
Copyright © 2016 KloudReadiness, LLC Page 20 of 22
Monthly Reports That Matter
Once you are regularly updating your lead funnel and pipeline tracking worksheets, you can
review the status of your sales and marketing operation on a monthly basis. With a 30‐day
view, you will have more data for analyzing lead generation results and pipeline
opportunities. It will be valuable to take a snapshot of these metrics (lead volume,
conversion rates and deals closed) to compare them month to month.
Other metrics that will be useful to compare on a monthly basis include the average cost per
lead, the deal size and customer acquisition rate, the average revenue per rep and the
customer close ratio by rep. Each month you can assess how each sales rep is doing in
meeting their targets and how the sale force as a whole is performing against your company
growth targets. Other metrics that are valuable to track and review on a monthly basis with
the executive team include the cost of service delivery and your gross margins. Are your
costs staying within their target range? If so, are your margins on target as well, or has there
been heavy discounting from the sales team to meet their sales goals with a negative impact
on margin performance? Finally, calculate your COA metrics based on the previous month’s
operating data. You will have monthly data for each of the key metrics required on the Cost
of Customer Acquisition Worksheet. And this will provide you with another important
snapshot to compare month to month. How are your COA metrics trending? Are they
improving? If not, why not? Which of your key metrics are down? Is pipeline deal volume
down? If so, you may need additional lead generation programs. Is average MRC down? If
so, your reps may be chasing smaller deals. Are your margins down? If so, you will want to
understand why costs have gone up or why your average selling price has gone down. Use
these monthly snapshots to identify key trends – either positive or negative– and take the
necessary steps to repeat the positive trends and turn the negative trends around.
The KloudReadiness Playbook Step 5: Continuously Measure Success
Copyright © 2016 KloudReadiness, LLC Page 21 of 22
Quarterly/Annual Reports That Matter
Your annual reports should enable a high level strategic assessment of how well your
business is scaling quarter to quarter and year to year. If you have been consistently taking
monthly snapshots of your sales and marketing performance, then preparing for an annual
review will be a relatively straight forward process. Like any good analysis of operating
results, you will want to compare your sales and marketing performance metrics on a year‐
over‐year basis as well as understand the sequential, month‐to‐month trends that have
taken place during the year. Has there been continuous improvement in the conversion of
leads to opportunities to customers? Has your cost per lead held steady or gone down? Has
your average customer value held steady or has it increased? Are all of your reps consistently
meeting their goals for deal volume and revenue per rep? Is your business seasonal or is it
constant throughout the year? This data will be essential for your planning process as you set
targets for the coming fiscal year. You will want to measure some additional metrics only on
annual basis. For example, measure your average contract term and average contract value.
Are they where you expect them to be? Measure your customer churn rate on both a
monthly and an annual basis. Is it more or less than 1% per month? If it is more, find out
why. Do you have customer loyalty issues and are they associated with either service quality
or functionality? Are there pricing issues or competitive pressures that are causing customer
defection? Have you terminated customers for lack of payment or poor profitability? Use
these metrics as part of an annual check‐up of your business and then take any corrective
measures that will help to improve to health of your business and its prospects for a healthy
future.
The KloudReadiness Playbook Step 5: Continuously Measure Success
Copyright © 2016 KloudReadiness, LLC Page 22 of 22
Final Thoughts
Congratulations! Together we have reached the end of the five essential steps for
establishing, managing and scaling a profitable xMSP business. Whether you followed the
five steps systematically from beginning to end or cherry‐picked a few concepts and
methodologies that you were lacking, we hope that you have realized value from the
Playbook. The five steps are building blocks and each one of them can be applied
independently. Taken together, they form a solid foundation for your business. It’s really up
to you to take what you need from these best practices and apply them as appropriate for
your business.
We would like to emphasize a couple points as we conclude the final chapter. First, the
market analysts are telling us that there is a huge opportunity for selling IT services and it will
continue for many years to come. However, there will be intense competition among the
more than 100,000 VARs and xMSPs around the world to win this business. That means the
focus will be squarely on sales and marketing execution. So invest in your own ability to
execute with sales and marketing excellence.
Second, always remember that effective sales and marketing is a science. Whether or not
you have a sales and marketing background, you can execute with excellence if you follow
the science and abandon any doubts that you must be a creative marketing wizard or a
charismatic sales veteran. Just like the technology side of your business, all it takes is doing
your homework and executing a plan. In this Playbook we have given you the homework and
the success plan to follow. Now it’s up to you to do the rest.
Last, but not least, congratulate yourself for what you have already accomplished. If you
have assessed your current business and go‐to‐market strategies and have taken just a few
of the steps in this Playbook to improve them, then you are already ahead of your
competition. Now, build on that head start. Continue to take more ideas from the Playbook,
add some of your own and put them into practice. It’s all about execution. Once you have
established a scalable sales and marketing operation, then re‐assess your progress. Take the
business readiness assessment introduced in Chapter 1 again and compare where your
business was before and how it progressed after implementing some or all of the five steps.
You may find that there are still gaps to fill. In fact, you will find it to be a journey that never
ends, but the success you will experience along the way will not only be financially rewarding
it will also be a lot of fun. We hope you enjoy the ride and we wish you great success!