Embed Size (px)
Citation preview

British Journal of Mathematics & Computer Science
14(2): 1-21, 2016, Article no.BJMCS.19958
ISSN: 2231-0851
SCIENCEDOMAIN international www.sciencedomain.org
_____________________________________ *Corresponding author: E-mail: [email protected];
The Kumaraswamy-Burr Type III Distribution: Propert ies and Estimation
S. M. Behairy1, G. R. AL-Dayian1 and A. A. EL-Helbawy1*
1Department of Statistics, Faculty of Commerce, AL-Azhar University (Girls’ Branch), Cairo, Egypt.
Authors’ contributions
This work was carried out in collaboration between all authors. All authors read and approved the final
manuscript.
Article Information
DOI: 10.9734/BJMCS/2016/19958 Editor(s):
(1) Luís Miguel Lindinho da Cunha Mendes Grilo, Polytechnic Institute of Tomar (IPT), (ESTT), Departmental Unit of Mathematics and Physics, Portugal.
(2) Paul Bracken, Department of Mathematics, The University of Texas-Pan American Edinburg, TX 78539, USA. Reviewers:
(1) P. M. Kgosi, University of Botswana, Botswana. (2) Grienggrai Rajchakit, Maejo University, Thailand.
Complete Peer review History: http://sciencedomain.org/review-history/13092
Received: 4th July 2015 Accepted: 6th November 2015 Published: 27th January 2016
_______________________________________________________________________________
Abstract
The Burr Type III distribution attracts special attention in life testing and reliability analysis as it is applied in several areas such as economics and environmetrics among others. A composite distribution of Kumaraswamy and Burr Type III distributions, referred to as Kumaraswamy-Burr Type III distribution, is introduced and studied. It contains some special well-known distributions, which are discussed in lifetime literature, such as the Burr Type III, exponentiated Burr Type III and Kumaraswamy-Burr Type XII, among several others. Some properties of the proposed distribution are studied including explicit expressions for the moments, the density functions of the order statistics, Rényi entropy, quantiles and moment generating function. The method of maximum likelihood is applied under Type II censored samples for estimating the model parameters, reliability and hazard rate functions. For different values of sample sizes, Monte Carlo simulation is performed to investigate the precision of the maximum likelihood estimates.
Keywords: Kumaraswamy distribution; stress-strength; reversed hazard rate function; censored sampling;
maximum likelihood method; asymptotic information matrix.
Original Research Article

Behairy et al.; BJMCS, 14(2): 1-21, 2016; Article no.BJMCS.19958
2
1 Introduction [1] Constructed a distribution with two shape parameters on (0, 1) which is known as Kumaraswamy distribution and denoted by Kum (�, b). Its cumulative distribution function (cdf) is defined by
)1,0(,)1(1),;()( ∈−−=≡ yybayHyH ba , (1) where 0, >ba are shape parameters.
[1] argued that the beta distribution does not faithfully fit hydrological random variables such as daily rainfall, daily stream flow, etc. He developed a more general probability density function (pdf) for double bounded random processes. It has simple explicit formulae for the distribution and quantile functions. This distribution is applicable to many natural phenomena whose outcomes have lower and upper bounds, such as the heights of individuals, scores obtained on a test, atmospheric temperatures and hydrological data. The Kum distribution is considered a better alternative to the beta distribution in hydrology and related areas (see [2,3,4]). Burr Type III distribution attracts special attention since it includes several families of nonnormal distributions (e.g. gamma distribution) and it includes the characteristics of other distributions such as logistic and exponential distributions. This distribution has been widely applied in various fields such as environmental studies, survival and reliability analysis, forestry, economics, meteorology and water resources among others. It is suitable to fit lifetime data since it has flexible shape and controllable scale parameters. Its distribution is used to study of income, wages and wealth as it is employed in financial literature. Its distribution can be used to simulate random sampling from a normal distribution. [5,6] focused on the distribution in terms of derivation and properties and the estimation through Bayesian and non-Bayesian estimation and also Bayesian prediction (see [7,8]). [9] used a composite distribution function, F, as a generated function by composing a cdf H with another cdf G. Kumaraswamy-Burr Type III (Kum-BIII(�, �, �, �)) distribution is a composite distribution of Kum distribution with parameters (�, b) and Burr Type III (c, k) (Burr III). [10] proposed the Kumaraswamy generalized distribution (Kum-G) with the following cdf and pdf respectively
baxGxGHxF ])}({1[1)]([)( −−== , −∞ < � < ∞; �, � > 0, (2) and �(�; �, �) = ���(�) (�(�))��� 1])}({1[ −− baxG , −∞ < � < ∞; �, � > 0. (3) The density family in (3) has many more properties better than the class of generalized beta distributions (see [11]), also it has some advantages in terms of tractability, since it does not involve any special functions. The reliability function of the Kum-G distribution can be written in closed form, thus the Kum-G distribution can be used quite effectively even if the data are censored. Recently the composite between Kum and other distributions have been studied such as the Kum-Weibull by [12,13] and [14], Kum-log-logistic by [15], Kum generalized exponentiated Pareto by [16], also Kum Burr Type XII by [17], Kum modified Weibull by [18], exponentiated Kum-Dagum by [19] and Kum–Kum by [20]. In particular, if G has Burr III (c, k), with cdf given by �(�; �, �) = (1 + ���)�� , � > 0; �, � > 0, (4)

Behairy et al.; BJMCS, 14(2): 1-21, 2016; Article no.BJMCS.19958
3
where c and k are shape parameters. Then the pdf corresponding to (4) is as follows �(�; �, �) = ����(���)(1 + ���)�(���), � > 0; �, � > 0. (5)
Substituting (4) in (2), the cdf of the Kum-BIII (�, b, c, k) distribution can be obtained as follows �(�; �, �, �, �) = 1 − (1 − (1 + ���)���)�, � > 0; �, �, �, � > 0, (6) and the pdf corresponding to (6) is given by �(�; �, �, c, k) = ������(���)(1 + ���)�(����)(1 − (1 + ���)���)���, � > 0; �, �, �, � > 0. (7)
The Kum-BIII distribution can be obtained as a special sub-model from the Beta-Burr III distribution which was introduced by [21] and exponentiated Kum-Dagum distribution which was introduced by [19]. The limiting distribution of the Kum-BIII (�, �, �, �) distribution, as the parameter c tends to infinity, is the cdf of Kum-I generalized logistic distribution among several others as special sub-models and the limiting distribution for the cdf of the Kum-BIII (�, �, �, �) distribution, given by (6), as the parameter k tends to infinity, is the cdf of the Kum-inverse Weibull distribution among several others as special sub-models. The importance of the pdf in (7) is that it contains several well-known sub models distributions, such as the Kum-Burr XII, Kum-Burr II, Kum-Weibull, Kum-exponential, Kum-Rayleigh, Kum-Beta I, Kum-Beta II, Kum-Pareto II, Kum-I generalized logistic, Kum-extreme value, Kum-Gompertz and Kum-F distributions
(see Table 1, in page 10). Clearly, the Burr III distribution is the basic exemplar for � = � = 1. For � = 1, it becomes the exponentiated Burr III distribution, which was introduced by [22].
1.1 A general expansion for the density function of the Kum-BIII distribution The cdf given in (6) can be simplified using the binomial expansion theorem of the last bracket in the right hand side as shown below �(�; �, �, �, �) = 1 − �� (−1)! "�# $ %&�; '(, )
!*+
� > 0; �, �, �, � > 0, (8)
where � > 0 is non-integer, � is integer and %&�; '( is the Burr III cdf in (4) with parameters ' = (�, ��#). If � > 0 is integer and � is integer, then the index # stops at �. Similarly the pdf given in (7) can be written as follows:
�(�; �, �, �, �) = ���� ��(���) ,!-1 + ���.�/,)!*+
where 0 = ��(# + 1) + 1 and ,! = (−1)! 1���! 2, (9) hence � 1�; 32 = �� ∑ ,! � 1�; 32 ,)!*+ � > 0; �, �, �, � > 0, (10)

Behairy et al.; BJMCS, 14(2): 1-21, 2016; Article no.BJMCS.19958
4
where � > 0 is non-integer , � is integer and � 1�; 32 denotes the Burr III distribution with parameters
3 = (�, ��(# + 1) + 1).
If � > 1 is integer and a is integer then the index # stops at � – 1. 1.2 Reliability function The reliability function (rf) for the Kum-BIII distribution is given below: 61(�; �, �, �, �) = 7(8 ≥ �) = (1 − (1 + ���)���)�,
� > 0; �, �, �, � > 0, (11)
where the limit of rf, as k or � tends to infinity, equals one. Stress-strength reliability The stress-strength model is a measure of the reliability of a component. Considering that X is a random strength of a component subjected to a random stress Y, a component fails if the applied stress is greater than the strength at any time and there is no failure when Y is less than X. Hence the reliability 62 is the probability that the unit is strong enough to overcome the stress and can be defined as follows 62 = 7(; < 8) = < �=(�) �>(�)?�@ , where FB(�) is a cdf of Y at the point x and f=(�) is the pdf, X and Y are independent, also if X has the Kum-BIII ( �1, b1, c, k1) and Y has the Kum-BIII (�2, b2, c, k2) as the parameters �, b and k change but c does not change. Then 62 = 7(; < 8) = < �(�; �1, �1, �, �1) �D(�; �2, �2, �, �2)?�)+ , (12)
= < �1�1��1 ��(���)(1 + ���)�(������)(1 − (1 + ���)�����)����)+ × -1 − (1 − (1 + ���)��F�F)�F. ?� = 1 − ∑ ∑ ������(��)GHIJ(����)J(�F) K!M!(����(K��)��F�FM) J(���K��)J(�F�M) )K*+)M*+ , (13)
where N(. ) represents the gamma function. The stress-strength modeling was studied by many authors [see [23] and [24]]. Hazard and reversed hazard functions
The hazard rate function (hrf) of the Kum-BIII distribution is given by ℎ(�; �, �, �, �) = P(@)Q�(@) = ����@R(SHT)(��@RS)R(UVHT)��(��@RS)RUV , � > 0; �, �, �, � > 0, (14)

Behairy et al.; BJMCS, 14(2): 1-21, 2016; Article no.BJMCS.19958
5
and the reversed hazard (rh) rate function, which is also known by the dual of the hazard rate, extends the concept of the hazard rate to a reverse time direction and is given by Wℎ(�; �, �, �, �) = P(@)X(@) = ����@R(SHT)(��@RS)R(UVHT)&��(��@RS)RUV(YRT
��&��(��@RS)RUV(Y , � > 0; �, �, �, � > 0. (15)
1.3 Graphical description
� =0.4, b=0.02, c=0.05, k=0.01
Figure 1
� =1.1, b=0.9, c=5, k=1.5
Figure 2
� =1.1, b=1.2, c=1.3, k=1.5
Figure 3
� =1.1, b=0.9, c=0.5, k=1.5
Figure 4
The plots of the probability density and hazard rate functions
From Figures 1-4, one can observe that the pdf is almost constant, approximately symmetric, decreasing and positive skewed respectively. The Kum-BIII distribution is a flexible model since the hrf represents major hazard shapes: constant, monotone decreasing and positive skewed respectively for different values of its parameters. In Figure 1, when the parameters b, c and k tend to zero, the hrf is approximately constant such as the hrf of the exponential distribution. This paper is outlined as follows: In Section 2, some statistical properties are studied, such as: quantile function, skewness and kurtosis, order statistics and characteristic functions. In Section 3, some limiting distributions and relations between the Kum-BIII and other distributions are presented. Maximum likelihood estimation based on Type II censoring scheme is performed and the observed information matrix is determined in Section 4. In Section 5, Monte Carlo simulation is carried out to investigate the precision of
Behairy et al.; BJMCS, 14(2): 1-21, 2016; Article no.BJMCS.19958
6
the maximum likelihood estimates (MLEs) for different values of parameters and sample sizes. Finally some concluding remarks are given in Section 6.
2 Some Statistical Properties In this section, the quantile function, the characteristic function, the WZ[ central and non-central moments, the mean, the variance, the skewness, the kurtosis and the \Z[ order statistic of the Kum-BIII (�, �, �, �) distribution are derived.
• The quantile function, can be obtained as follows: � = ���(]) = ^_1 − -1 − ].� �⁄ a�� ��⁄ − 1b�� �⁄ , 0 < ] < 1. (16)
One can easily generate � by taking ] as a uniform random variable on (0, 1). Special quantiles can be obtained using (16). For example, if ] = 1 2⁄ , the median of the Kum-BIII (�, �, �, �) is given by
median= ���(1 2⁄ ) = ^_1 − -1 − 0.5.� �⁄ a�� ��⁄ − 1b�� �⁄.
• The characteristic function is
d@(e) = ��� ∑ ,!)!*+ ∑ 1(fZ)gh! 2)h*+ Β 11 − h� , 0 − 1 + h�2, � > ?, 1 + h� < 0. (17)
where s and ,! are given by (9), B(., .) represents the beta function, i= (−1)� F⁄ and e ∈ R.
• The WZ[ non-central moments is as follows
lmn = o(�n) = ��� ,!)
!*+ Β 11 − W� , 0 − 1 + W�2 , � > W, 1 + n� < 0. (18)
The mean and the variance are given respectively by
l = ��� ,! )!*+ Β "1 − 1� , 0 − 1 + 1�$ , � > 1, 1 + 1� < 0,
and
p(�) = ���
qrrs ,!
)!*+ Β "1 − 2� , 0 − 1 + 2�$ − ��� t ,!
)!*+ Β "1 − 1� , 0 − 1 + 1�$u
F
vwwx,
� > 2, 1 + F� < 0,
where s and ,! are given by (9).

Behairy et al.; BJMCS, 14(2): 1-21, 2016; Article no.BJMCS.19958
7
The central moments can be obtained using the relationship between the central moments and the non-central moments in (18) as follows: ln = ∑ 1n!2 (−1)!l !n!*+ lmn�! . (19) The standard moments can be obtained using (19), then yn = z{|z}{ . (20)
When W = 3 in (20), then the skewness is given by
y� = �∑ ������ ������� ∑ ������ �T ∑ ������ �}�F(���)}1∑ ������ �T2��(���)T }� �∑ ������ �}����1∑ ������ �T2}�� }� , (21)
where �M = Β 11 − M� , 0 − 1 + M�2, � = 1, 2, 3 and � > 3; 1 + M� < 0. When W = 4 in (20), then the kurtosis is
y� = �∑ ������ ������� ∑ ������ �T ∑ ������ ����1��� ∑ ������ �T2} ∑ ������ �}��(���)�1∑ ������ �T2������∑ ������ �}����1∑ ������ �T2}�} , (22)
where �M = � 11 − M� , 0 − 1 + M�2, � = 1, 2, 3, 4 , � > 4, 1 + M� < 0,
s and ,! are given by (9). Rényi entropy An entropy of a random variable X with the pdf �(. ) is a measure of variation of the uncertainty and is denoted by �Q(�). The Rényi entropy was introduced by [25]. It is defined by �Q(�) = ���� ln_<@ (�(�))� ?�a, � > 0 and � ≠ 1. (23) Substituting (7) into (23), then the Rényi entropy of Kum-BIII (�, �, �, �) distribution is given by �Q(�) = �1 − � (ln � + ln � + ln � + ln �)
+ ���� ln ∑ (−1)�&�(���)� ( 1− ��2 Β(�1, �2))�*+ , (24)
where �1 = � 11 + ��2 − �� and �2 = ��(� + �) − �� (� − 1). The ��� order statistic Let 8�, 8F , … , 8� be independent identically distribution (iid) random variables from the Kum-BIII (�, �, �, �) distribution. Let 8(�) denote the \Z[ order statistic. Then the pdf of 8(�) can be written as a linear combination of Kum-BIII (�, �, �, �) density functions. It is well known that the pdf of \Z[ order statistic is given by ℎ�:�&�(�)( = �(\)�&�(�)(�&�(�)(���_1 − �&�(�)(a��� , (25)

Behairy et al.; BJMCS, 14(2): 1-21, 2016; Article no.BJMCS.19958
8
substituting the cdf and pdf given by (6) and (7) in (25), and using the binomial expansion theorem, then the pdf of ℎ�:�&�(�)( can be rewritten as follows ℎ�:�&�(�)( = ���� �(\) ∑ �(�)� ∗(hT,h},h�)*+ ,
� > 0, �, �, �, � > 0, \ = 1, 2, … , ¢, (26) where
�(\) = \ 1¢\ 2 = ¢!(\ − 1)! (¢ − \)! = 1�(\, ¢ − \ + 1), = (−1)hT�h}�h� "\ − 1?� $ " £?F$ "£�?�$)
h�*+)
h}*+���
hT*+∗
(hT ,h},h�)*+ , ¤ = �(?� + 1) + 1, £ = �(¢ − \ + ?� + 1) − 1 and £� = ��(?F + 1) + 1. Special cases:
I. The pdf of the first order statistic can be obtained; if \ = 1 in (26), as follows
��:�(��) = ¢!(¢ − 1)! ���� �(�)�¥∗∗(¦,¦T)*+ ,
�(�) > 0; �, �, �, � > 0, (27)
where
∑ = ∑ ∑ (−1)¦�¦T 1§}¦ 2 1§∗¦T2)¦T*+)¦*+∗∗(¦,¦T)*+ , ¨ = �(�� + 1) + 1, £F = �¢ − 1 and £∗ = ��(� + 1) + 1.
II. The pdf of the largest order statistic can be obtained; if \ = ¢ in (26), and is given by
��:�(��) = ¢!(¢ − 1)! ���� �(�)�¥T∗∗∗&¦},¦�,¦�∗(*+ ,
�(�) > 0; �, �, �, � > 0, (28) where
= (−1)¦}�¦��¦�∗ "¢ − 1�F $ "£���$ "£�∗��∗$)¦�∗*+
)¦�*+
)¦}*+
∗∗∗&¦},¦�,¦�∗(*+
�̈ = �(��∗ + 1) + 1, £� = �(1 + �F) − 1 and £�∗ = ��(�� + 1) + 1.
III. One can obtain the median observable in the odd case; if \ = ���F in (26), which is given by
Behairy et al.; BJMCS, 14(2): 1-21, 2016; Article no.BJMCS.19958
9
�©HT} :� "�1©HT} 2$ = ¢!1���F 2 ! 1���F 2 ! ���� �(©HT} )�¥} ,∗∗∗∗&¦�,¦ª,¦ª∗(*+
�(©HT} ) > 0; �, �, �, � > 0, (29)
where
= (−1)¦��¦ª�¦ª∗ "£���$ "£«�«$ "£«∗�«∗$)¦ª∗*+
)¦ª*+
)¦�*+
∗∗∗∗&¦�,¦ª,¦ª∗(*+ ,
F̈ = �(�«∗ + 1) + 1, £« = � 1���F 2 + �� − 1 and £«∗ = ��(�« + 1) + 1.
Remark All statistical properties of the Burr Type III (�, �) distribution, which was introduced by [5], can be derived from Kum-BIII (�, �, �, �) distribution, if � = � = 1.
3 Some Limiting and Transformed Distributions Kum-BIII (�, �, �, �) distribution is related through variable transformations to a wide range of some other commonly distributions. In this section, some limiting and transformed distributions of the Kum-BIII (�, �, �, �) distribution are derived.
3.1 Some limiting distributions The following limiting distributions provide relationships between Kum-BIII (�, �, �, �) and other well-known distributions.
I. If 8 ~ Kum-BIII (�, �, �, �), then lim�→) 7 °8 ≤ exp µ� "1 + ��F $¶· = 1 − -1 − -1 + exp(−�).���.� ,
−∞ < � < ∞; �, �, � > 0, (30)
which is the limit of the cdf of the Kum-BIII (�, �, �, �) distribution, given by (6), as the parameter c tends to infinity, and also is the cdf of a Kum-I generalized logistic distribution with parameters �, b and k. If k=1, the Kum-logistic distribution can be obtained. When � = � = 1, the Type I generalized logistic (k) distribution can be derived. For b = 1, it becomes the exponentiated Type I generalized logistic distribution.
When � = b = k= 1, the logistic distribution is given with mean = 0 and variance = ¹F 3� .
II. If 8 ~ Kum-BIII (�, �, �, �), then
lim�→) 7 º8 ≤ "1�$�� �� �» = 1 − -1 − exp(−����).� , � > 0, �, �, � > 0, (31)
which is the limit of the cdf of the Kum-BIII (�, �, �, �) distribution, given by (6), as the parameter k tends to infinity, which is the cdf of a Kum-inverse Weibull distribution with parameters �, b and c. If c =1, the

Behairy et al.; BJMCS, 14(2): 1-21, 2016; Article no.BJMCS.19958
10
Kum-inverse gamma distribution can be obtained. When � = � = 1, the inverse Weibull distribution can be derived. For b = 1, the exponentiated inverse Weibull distribution can be proposed. When � = b = c= 1, inverse gamma distribution can be obtained.
3.2 Some transformed distributions Table 1 presents the transformations of 8 which provide different relationships between Kum-BIII (�, �, �, �) and other well-known distributions such as Kum-Burr XII, Kum-Burr II, Kum-Weibull, Kum-exponential, Kum-Rayleigh, Kum-Beta I, Kum-Beta II, Kum-Pareto II, Kum-I generalized logistic, Kum-extreme value, Kum-Gompertz and Kum-F.
Table 1. Summary of transformations applied to the Kumaraswamy-Burr Type III and resulting distributions
Transformations Distribution pdf Range 8�� Kum-Burr Type XII (�, �, �, �) ����¼���� -1 + ¼��.�(����) × -1 − -1 + ¼��.���.���
¼� > 0 �ln (8) Kum-Burr Type II (�, �, �)
��� exp(−¼F) × -1 + exp(−¼F).�(����) × -1 − -1 + exp(−¼F).���.���
−∞ < ¼F < ∞
-ln(1 + 8��).� �� Kum-Weibull (�, �, �, �)
����¼���� × -exp(−�¼��).� × -1 − exp(−�¼��)�.���
¼� > 0
ln(1 + 8��) Kum-exponential(�, �, �)
���-exp(−�¼�).� × -1 − -exp(−�¼�).�.��� ¼� > 0
-ln(1 + 8��).� F� Kum- Rayleigh(�, �, 2, �)
2���¼«-exp(−�¼«F).� × -1 − exp(−�¼«F)�.��� ¼« > 0
-1 + 8��.�� Kum-Beta Type I (��, �)
���¼�����-1 − ¼���.��� 0 < ¼� < 1 8�� Kum-Beta Type II (�, �, 1, �) ���-1 + ¼½.�(����) × -1 + (1 + ¼½)���.��� ¼½ > 0
1 + 8�� Kum-Pareto Type II (�, �, 1, �) ���(¼¾)�(����) × -1 − (¼¾)���.��� ¼¾ > 1 ln(8��) Kum-Type I generalized-
logistic(�, �, �)
��� exp(−¼¿) × -1 + exp(−¼¿).�(����) × -1 − -1 + exp(−¼¿).���.���
−∞ < ¼¿ < ∞
ln-ln(1 + 8��)�.�� �⁄ Kum-extreme value (�, �, �)
��� × -exp-−�¼�+ − � exp(−�¼�+).. × ^1 − _exp&exp(−�¼�+)(a��b���
−∞ < ¼�+ < ∞ ln-1+ ln(1 + X�Á).�� Â⁄
Kum-Gompertz (�, �, ], £) ��£ Ãexp °]¼�� + °exp µ− £] (]¼��
− 1)¶·�·» × �1 − ^exp 1− £] -exp(]¼��
− 1).2b�����
¼�� > 0
�8�� Kum-F (�, �, 2,2�)
�� ^1 + ¼�F� b�(����)
× �1 − 11 + ¼�F� 2�������
¼�F > 0
Behairy et al.; BJMCS, 14(2): 1-21, 2016; Article no.BJMCS.19958
11
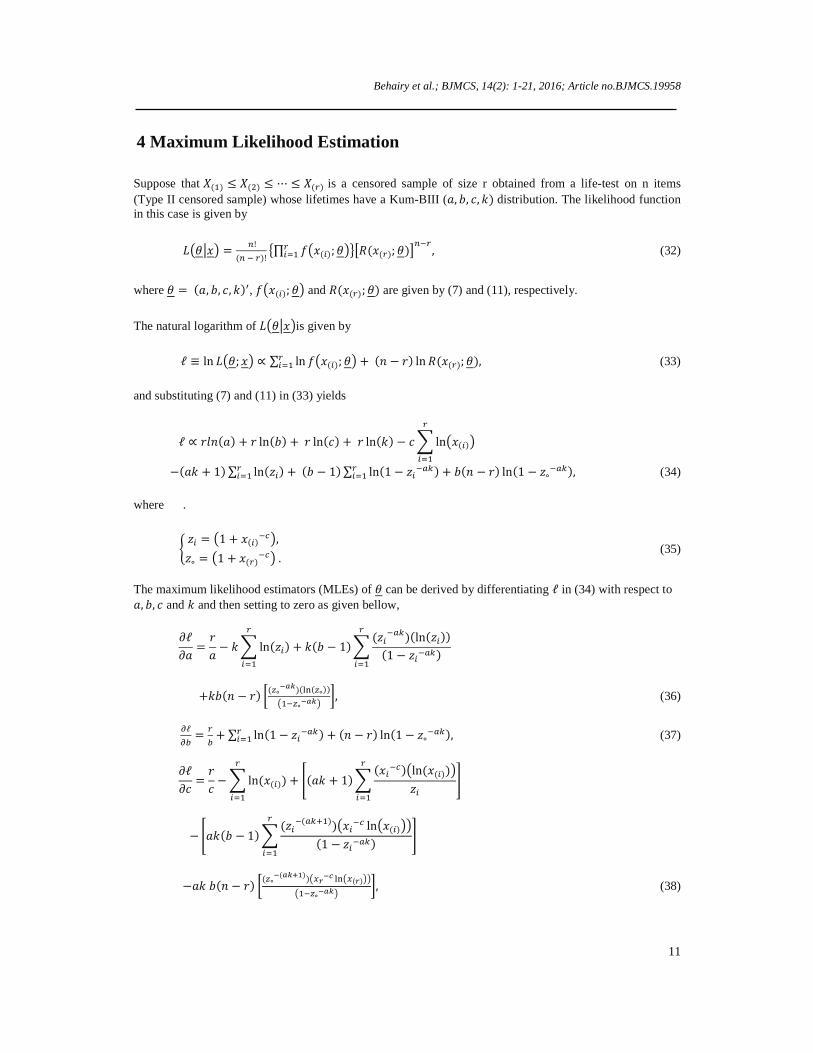
4 Maximum Likelihood Estimation Suppose that 8(�) ≤ 8(F) ≤ ⋯ ≤ 8(n) is a censored sample of size r obtained from a life-test on n items (Type II censored sample) whose lifetimes have a Kum-BIII (�, �, �, �) distribution. The likelihood function in this case is given by
Å&ÆÇ�( = �!(� � n)! È∏ �&�(�); Æ(n�*� Ê_6(�(n); Æ)a��n , (32)
where Æ = (�, �, �, �)m, �&�(�); Æ( and 6(�(n); Æ) are given by (7) and (11), respectively.
The natural logarithm of Å&ÆÇ�(is given by ℓ ≡ ln Å&Æ; �( ∝ ∑ ln �&�(�); Æ( + (¢ − W) ln 6(�(n); Æ)n�*� , (33)
and substituting (7) and (11) in (33) yields
ℓ ∝ W�¢(�) + W ln(�) + W ln(�) + W ln(�) − � ln&�(�)( n�*�
−(�� + 1) ∑ ln(£�)n�*� + (� − 1) ∑ ln(1 − £����) + �(¢ − W) ln(1 − £∘���),n�*� (34) where .
Ï £� = &1 + �(�)��(,£∘ = &1 + �(n)��( .Ð (35)
The maximum likelihood estimators (MLEs) of Æ can be derived by differentiating ℓ in (34) with respect to �, �, � and � and then setting to zero as given bellow, ÑℓÑ� = W� − � ln(£�)n
�*� + �(� − 1) (£����)(ln(£�))(1 − £����)n�*�
+��(¢ − W) �(§∘RUV)(ÒÓ(§∘))&��§∘RUV( �, (36)
ÔℓÔ� = n� + ∑ ln(1 − £����)n�*� + (¢ − W) ln(1 − £∘���), (37)
ÑℓÑ� = W� − ln(�(�))n�*� + º(�� + 1) (����)&ln(�(�))(£�
n�*� »
− º��(� − 1) (£��(����))&���� ln&�(�)(((1 − £����)n�*� »
−�� �(¢ − W) �(§∘R(UVHT))&@{RS ÒÓ&@({)((&��§∘RUV( �, (38)

Behairy et al.; BJMCS, 14(2): 1-21, 2016; Article no.BJMCS.19958
12
and ÑℓÑ� = W� − � ln(£�)n
�*� + º�(� − 1) (£����)(ln(£�))(1 − £����)n�*� »
+ ��(¢ − W) �(§∘RUV)(ÒÓ(§∘))&��§∘RUV( �. (39)
The solution of the system of nonlinear Equations (36), (38) and (39) can be solved numerically to obtain the MLEs of the parameters �, �, � and the MLE of � can be obtained by equating (37) to zero, hence �Õ = �n/T , (40)
where 0� = ∑ ln(1 − £����)n�*� + (¢ − W) ln(1 − £∘���). Remarks:
I. If ��� = Ö, then from (37) the uniformly minimum variance unbiased estimator (UMVUE) of Ö is, Ö× = ��n -∑ ln(1 − £����) + (¢ − W) ln(1 − £∘���) n�*� ., (41)
where £� and £∘ are defined by (35).
II. When W = ¢, all the results obtained for Type II censored sample reduce to those of the complete
sample.
III. Considering that 8�, 8F, … , 8� is a random sample of size ¢ drawn from a Kum-BIII (�, �, �, �) distribution with pdf given by (7). One can obtain a sufficient and complete statistic for the parameter b using the exponential family which is 0F, 0F = ∑ ln-1 − (1 + ���)���..��*� (42)
Maximum likelihood estimators for the reliability and hazard rate functions Applying the invariance property, the MLEs of the rf and hrf are obtained by replacing the parameters �, �, � and � in (11) and (14) by their MLEs. Hence, for a given value of �, the MLEs of 6(�) and ℎ(�) are given, respectively by 6Õ(�) = 11 − &1 + ���̂(��Ù�Õ 2�Õ�� , � > 0, (43)
and ℎÕ(�) = �Ù�Õ�̂�Õ @R(SÙHT)&��@RSÙ(R&UÚVÛHT(
��&��@RSÙ(RUÚVÛ , � > 0, (44)
where �,Ú �,Û �̂ �¢? �Õ are the MLEs of �, �, � and �.

Behairy et al.; BJMCS, 14(2): 1-21, 2016; Article no.BJMCS.19958
13
The asymptotic Fisher information matrix is given by ÜÝ = − � Ô}ℓÔÞßÔÞ�� , \, # = 1,2,3,4, (45)
where Æ� = �, ÆF = �, Æ� = � and Æ� = � and the elements of the information matrix are derived. The asymptotic variance-covariance matrix of the MLEs �Ù, �Õ, �̂ �¢? �Õ is the inverse of the asymptotic Fisher information matrix. For large sample size, the MLEs under regularity conditions are consistent and asymptotically unbiased as well as asymptotically normally distributed, hence the asymptotic confidence intervals (ACI) for the MLE is
obtained by 7 µ−à < ÞÛßáâ�ÞßãäÛßáâ < ච= 1 − y where Z is the 10011 − åF2th standard normal percentile. The
two sided approximate 100(1 − α)% the confidence intervals are as shown below ÅÅÞ = ÆÕ�èé − àê} ëÙÞÛßáâ and ìÅÞ = ÆÕ�èé + àê} ëÙÞÛßáâ , (46)
where ëÙÞÛßáâ is the standard deviation and ÆÕ�èé is �Ù, �Õ, �̂ or �Õ respectively.
5 Simulation Study
• In this section, a numerical study is given to illustrate the results obtained on the basis of generated data from Kum-BIII (�, �, �, �) distribution.
• The computations are performed using Mathematica 9, where N = 1000 is the number of repetitions, for different sample sizes (n=20, 50, 100) and the number of survival units are (r= 0.90 n and 0.80n).
• Tables 2 and 3, in Appendix 1, show the MLEs of the parameters, rf and hrf where the initial parameter values are � =1.1, b=1.2, c=1.3 and k=1.5 based on two levels of Type II censoring. Similarly Tables 5 and 6 display the MLEs of the parameters, rf and hrf with the initial parameter values � =0.7, b=0.9, c=1.2 and k=1.4.
• Some measurements of accuracy are used to evaluate the performance of the estimators �, b, c and k. Tables 2 and 5 show the variances, biases2 and the estimated risks (ER) of the estimates to study the precision and the variation of MLEs. Also Tables 4 and 6 present the estimated risks of the reliability and the hazard rate functions.
• Tables 4 and 7 present the two-sided 95% ACI for the parameters, rf and hrf of Kum-BIII (�, �, �, �) distribution. These tables contain the estimates, lower limit (LL), upper limit (UL) and the length of the intervals.
6 Concluding Remarks
• Tables 2 and 5 indicate that the variances, biases2 and ER decrease when the sample size n increases. For all sample sizes Table 2 shows that, the ER (�Ù) performs better than other estimates. It is observed that as the level of censoring decreases the variances, biasF and ER decrease.
• Tables 3 and 6 show that the ER of rf and hrf decrease when the different values of time e+ and the sample size increase, while the hrf increases when the different values of time e+ and the sample size increase.
• From Tables 4 and 7, for all different sample sizes, one can observe that the lengths of the ACI of the four model parameters, rf and hrf become narrower when the sample size n increases and the level of censoring decreases. Also the lengths of �Ù performs better than other estimates.

Behairy et al.; BJMCS, 14(2): 1-21, 2016; Article no.BJMCS.19958
14
• The first and the last remark are expected since decreasing the level of censoring means that more information is provided by the sample and hence increases the accuracy of the estimates.
Acknowledgements The authors would like to thank the Referees and the Editor for their helpful comments and suggestions to improve the earlier version of this manuscript.
Competing Interests Authors have declared that no competing interests exist.
References [1] Kumaraswamy P. A generalized probability density functions for double-bounded random processes.
Journal of Hydrology. 1980;79–88. [2] Ganji A, Ponnambalam K, Khalili D. Grain yield reliability analysis with crop water demand
uncertainty. Stochastic Environmental Research and Risk Assessment. 2006;20:259-277.
[3] Jones MC. A beta-type distribution with some tractability advantages. Statistical Methodology. 2009;6:70–81.
[4] Sharaf El-Deen MM, AL-Dayian GR, EL-Helbawy AA. Statistical inference for Kumaraswamy
distribution based on generalized order statistics with applications. British Journal of Mathematics & Computer Science. 2014;4(12):1710-1743.
[5] AL-Dayian GR. Burr type III distribution: Properties and estimation. The Egyptian Statistical Journal,
ISSR, Cairo University. 1999a;43:102-116. [6] AL-Dayian GR. Bayesian estimation and prediction bounds under Burr type III model. Journal of
Faculty of Commerce AL-Azhar University Girls' Branch, Cairo, Egypt. 1999b;16:13-28. [7] Shao Q, Chen YD, Zhang L. An extension of three-parameter Burr III distribution for low-flow
frequency analysis. Computational Statistics and Data Analysis. 2008;52:1304-1314. [8] Cordeiro GM, Gomes AE, da-Silva CQ. Another extended Burr III model: Some properties and
applications. Journal of Statistical Computation and Simulation. 2014b;84(12):2524–2544. [9] AL-Hussaini EK. Composition of cumulative distribution functions. Journal of Statistical Theory and
Applications. 2012;11:333-336. [10] Cordeiro GM, de Castro M. A new family of generalized distributions. Journal of Statistical
Computation and Simulation. 2011;81(7):883-898. [11] Eugene N, Lee C, Famoye F. Beta-normal distribution and its applications. Communication.
Statistics. Theory and Methods. 2002;31:497–512. [12] Cordeiro GM, Ortega EMM, Nadarajah S. The Kumaraswamy Weibull distribution with application
to failure data. Journal of the Franklin Institute. 2010;347:1399–1429.

Behairy et al.; BJMCS, 14(2): 1-21, 2016; Article no.BJMCS.19958
15
[13] Rezk HR, EL-Helbawy AA, AL-Dayian GR. Statistical inference for a simple step-stress model based on censored data from Kumaraswamy Weibull distribution. British Journal of Mathematics and Computer Science. 2014;4(11):1496-1514.
[14] AL-Dayian GR, EL-Helbawy AA, Rezk HR. Statistical inference for a simple constant stress model
based on censored sampling data from the Kumaraswamy Weibull distribution. International Journal of Statistics and Probability. 2014;3(3):80-95.
[15] Cordeiro GM, Ortega EMM, de Santana TVF, Silva GO. The Kumaraswamy-log-logistic distribution.
Journal of Statistical Theory and Applications. 2012;3:265-291. [16] Shams MT. The Kumaraswamy generalized exponentiated Pareto distribution. European Journal of
Applied Sciences. 2013;5(3):92-99. [17] Paranaiba PF, Ortega EMM, Cordeiro GM, de Pascoa MAR. The Kumaraswamy Burr XII
distribution: theory and practice. Journal of Statistical Computation and Simulation iFirst. 2013;1–27. [18] Cordeiro GM, Antonio CR, Braga Junior AC, Demetrio CG, Ortega EMM, Pescim RR. Some new
results for the Kumaraswamy modified Weibull distribution. Journal of Statistical Theory and Applications. 2014a;13(1):86-104.
[19] Huang S, Oluyede BO. Exponentiated Kumaraswamy-Dagum distribution with applications to
income and lifetime data. Huang and Oluyede Journal of Statistical Distributions and Applications. 2014;1-20.
[20] El-Sherpieny EA, Ahmed MA. On the Kumaraswamy-Kumaraswamy distribution. Institute of Statistical Studies and Research, Cairo University, Egypt. International Journal of Basic and Applied Sciences. 2014;3(4):372-381.
[21] Gomes AE, da-Silva CQ, Cordeiro GM, Ortega EMM. The beta Burr type III model for lifetime data.
Brazilian Journal of Probability and Statistics. 2013;27(4):502-543. [22] Sayyareh A, Moradi N, Panahi H. Estimation of the parameters of a exponentiated Burr type III
distribution under type II censoring. Journal of Statistical Sciences. 2014;8(1):93-109.
[23] Mokhlis NA. Reliability of a stress-strength model with Burr type III distributions. Communication in Statistics - Theory and Methods. 2005;34:1643-1657.
[24] Shawky AI, AL-Kashkar FH. On a stress – strength model in Burr of type III. International Journal of Statistics. 2007;Vol. LXV(3):371-385.
[25] Rényi A. On Measures of entropy and information. Proceedings of the fourth Berkeley symposium on mathematical statistics and probability. Contributions to the Theory of Statistics, University of California Press, Berkeley, Calif. 1961;1:547-561.

Behairy et al.; BJMCS, 14(2): 1-21, 2016; Article no.BJMCS.19958
16
Appendix 1 Table 2. ML estimates of the parameters, variances, biases2 and their estimated risks based on Type II
censoring, N=1000, r=0.80 n and 0.90 n, ð =1.1, b=1.2, c=1.3 and k=1.5
ER ñ�ðòó Variance Estimates r n 0.0455 0.2223 0.1583 0.0760
0.0045 0.0136 0.0274 0.0031
0.0409 0.2087 0.1309 0.0729
�Ù �Õ �̂ �Õ
16
20 0.0336
0.1598 0.0997 0.0556
0.0023 0.0043 0.0212 0.0009
0.0313 0.1554 0.0785 0.0556
�Ù �Õ �̂ �Õ
18
0.0299 0.1593 0.0906 0.0513
0.0011 0.0003 0.0313 0.0001
0.0288 0.1589 0.0593 0.0512
�Ù �Õ �̂ �Õ
40
50
0.0194 0.0799 0.0658 0.0347
0.0001 0.0038 0.0259 0.0004
0.0193 0.0760 0.0398 0.0343
�Ù �Õ �̂ �Õ
45
0.0195 0.1034 0.0860 0.0364
0.0000 0.0198 0.0432 0.0018
0.0195 00836 0.0428 0.0347
�Ù �Õ �̂ �Õ
80
100 0.0096
0.0453 0.0525 0.0193
0.0001 0.0139 0.0269 0.0025
0.0095 0.0313 0.0255 0.0168
�Ù �Õ �̂ �Õ
90
Table 3. The estimated reliability and hazard rate functions at different time �ô and different sample
sizes
n r �ô õÛ(�ô) ER ö× (�ô) ER 20
16 0.4 1
0.9048 0.6486
0.0059 0.0166
0.4017 0.6803
0.6572 0.1015
18 0.4 1
0.9042 0.6445
0.0040 0.0138
0.4487 0.6649
0.0592 0.0717
50
40 0.4 1
0.9072 0.6592
0.0028 0.0085
0.4299 0.6224
0.0998 0.0266
45 0.4 1
0.9049 0.6471
0.0019 0.0064
0.4566 0.6283
0.0269 0.0196
100
80 0.4 1
0.9131 0.6592
0.0015 0.0047
0.4215 0.6059
0.0204 0.0101
90 0.4 1
0.9063 0.6446
0.0011 0.0031
0.4525 0.6218
0.0137 0.0094

Behairy et al.; BJMCS, 14(2): 1-21, 2016; Article no.BJMCS.19958
17
Table 4. Confidence intervals for the parameters ð, b, c, k, rf and hrf based on Type II censoring at confidence level 95% at different sample sizes
n r Parameters Estimates UL LL Length 20
16
� � � � 6(e) ℎ(e)
1.1671 1.3167 1.4656 1.5561 0.6486 0.6803
1.5639 2.2121 2.1747 2.0852 0.8989 1.2855
0.7703 0.4213 0.7564 1.0270 0.3982 0.0751
0.7936 1.7908 1.4183 1.0582 0.5008 1.2104
18
� � � � 6(e) ℎ(e)
1.1477 1.2659 1.4456 1.5302 0.6445 0.6649
1.4944 2.0386 1.9947 1.9925 0.8733 1.1749
0.8009 0.4932 0.8965 1.0679 0.4157 0.1548
0.6934 1.5454 1.0982 0.9246 0.4576 1.0201
50
40
� � � � 6(e) ℎ(e)
1.1329 1.1818 1.4769 1.5106 0.6592 0.6224
1.4655 1.9633 1.9544 1.9539 0.8309 0.9394
0.8004 0.4003 0.9994 1.0673 0.4875 0.3054
0.6649 1.5629 0.9549 0.8866 0.3434 0.6341
45
� � � � 6(e) ℎ(e)
1.1097 1.1380 1.4612 1.4797 0.6471 0.6283
1.3818 1.6785 1.8522 1.8424 0.8013 0.8979
0.8377 0.5975 1.0701 1.1169 0.4930 0.3588
0.5442 1.0810 0.7820 0.7256 0.3082 0.5391
100
80
� � � � 6(e) ℎ(e)
1.0936 1.0594 1.5078 1.4581 0.6592 0.6059
1.3673 1.6262 1.9135 1.8230 0.7824 0.8023
0.8199 0.4925 1.1022 1.0932 0.5360 0.4096
0.5474 1.1338 0.8113 0.7298 0.2463 0.3928
90
� � � � 6(e) ℎ(e)
1.0878 1.0817 1.4641 1.4504 0.6446 0.6218
1.2785 1.4283 1.7774 1.7046 0.7506 0.8081
0.8972 0.7351 1.1509 1.1962 0.5385 0.4355
0.3813 0.6932 0.6265 0.5084 0.2121 0.3726

Behairy et al.; BJMCS, 14(2): 1-21, 2016; Article no.BJMCS.19958
18
Table 5. ML estimates of the parameters, variances, biases2 and their estimated risks based on Type II censoring, N=1000, r=0.80 n and 0.90 n, ð =0.7, b=0.9, c=1.2 and k=1.4
ER ñ�ðòó variance estimates r n 0.0503 0.1331 0.1018 0.0540
0.0318 0.0178 0.0030 0.0149
0.0185 0.1153 0.0988 0.0391
�Ù �Õ �̂ �Õ
16
20 0.0421
0.0934 0.0680 0.0497
0.0278 0.0078 0.0033 0.0194
0.0143 0.0858 0.0651 0.0303
�Ù �Õ �̂ �Õ
18
0.0241 0.0483 0.0289 0.0461
0.0184 0.0029 0.0072 0.0341
0.0057 0.0454 0.0217 0.0121
�Ù �Õ �̂ �Õ
40
50
0.0228 0.0328 0.0165 0.0433
0.0184 0.0012 0.0043 0.0340
0.0044 0.0315 0.0122 0.0093
�Ù �Õ �̂ �Õ
45
0.0162 0.0192 0.0149 0.0467
0.0144 0.0001 0.0087 0.0429
0.0018 0.0191 0.0062 0.0038
�Ù �Õ �̂ �Õ
80
100 0.0142
0.0112 0.0107 0.0443
0.0140 6.0553× 10�¾ 0.0057 0.0403
0.0002 0.0112 0.0050 0.0040
�Ù �Õ �̂ �Õ
90
Table 6. The estimated reliability and hazard rate functions at different time �ô
and different sample sizes
n r �ô õÛ(�ô) ER ö× (�ô) ER 20
16 0.2 0.4
0.8884 0.7816
0.0081 0.0095
0.5421 0.6634
2.1067 0.1995
18 0.2 0.4
0.8936 0.7843
0.0051 0.0078
0.5962 0.6710
1.3250 0.0662
50
40 0.2 0.4
0.8892 0.7766
0.0023 0.0037
0.6680 0.7069
0.3002 0.0286
45 0.2 0.4
0.8927 0.7769
0.0415 0.0036
0.6648 0.6975
0.0361 0.0267
100
80 0.2 0.4
0.8926 0.7764
0.0009 0.0019
0.6736 0.7036
0.0196 0.0172
90 0.2 0.4
0.8917 0.7788
0.0008 0.0013
0.6743 0.6891
0.0169 0.0135

Behairy et al.; BJMCS, 14(2): 1-21, 2016; Article no.BJMCS.19958
19
Table 7. Confidence intervals for the parameters ð, b, c, k, rf and hrf based on Type II censoring at confidence level 95% at different sample sizes
n r parameters estimates UL LL Length 20
16
� � � � 6(e) ℎ(e)
0.8784 1.0335 1.2549 1.2776 0.7816 0.6634
1.1447 1.6991 1.8709 1.6651 0.9697 1.5377
0.6120 0.3679 0.6389 0.8902 0.5936 0
0.5327 1.3311 1.2319 0.7749 0.3761 1.5377
18
� � � � 6(e) ℎ(e)
0.8668 0.9875 1.2578 1.2608 0.7843 0.6710
1.1013 1.5616 1.7577 1.6018 0.9531 1.1745
0.6323 0.4134 0.7579 0.9198 0.6155 0.1676
0.4689 1.1481 0.9999 0.6821 0.3376 1.0069
50
40
� � � � 6(e) ℎ(e)
0.8356 0.9536 1.2849 1.2154 0.7766 0.7069
0.9837 1.3713 1.5736 1.4308 0.8944 1.0357
0.6875 0.5358 0.9963 1.0001 0.6587 0.3783
0.2961 0.8354 0.5773 0.4307 0.2356 0.6574
45
� � � � 6(e) ℎ(e)
0.8357 0.9354 1.2653 1.2155 0.7769 0.6975
0.9656 1.2835 1.4818 1.4046 0.8926 1.0173
0.7057 0.5872 1.0487 1.0265 0.6612 0.3777
0.2599 0.6962 0.4331 0.3781 0.2313 0.6396
100
80
� � � � 6(e) ℎ(e)
0.8202 0.9101 1.2934 1.1929 0.7764 0.7036
0.9032 1.1813 1.4472 1.313 0.8607 0.9583
0.7371 0.6389 1.1395 1.0721 0.6920 0.4488
0.1661 0.5423 0.3078 0.2416 0.1687 0.5095
90
� � � � 6(e) ℎ(e)
0.8245 0.8998 1.2756 1.1993 0.7789 0.6891
0.9001 1.1069 1.4144 1.3237 0.8587 0.9167
0.7370 0.6926 1.1367 1.0749 0.6988 0.4615
0.1631 0.4144 0.2777 0.2488 0.1599 0.4553

Behairy et al.; BJMCS, 14(2): 1-21, 2016; Article no.BJMCS.19958
20
Appendix 2
The elements of the information matrix; the second partial derivatives of the log-likelihood function, are given below
Ü�� = ÑFℓÑ�F = −W�F + (� − 1) (−)(1 − £����)£����(� ln(£�))F − -£����(� ln(£�)).F-1 − £����.Fn
�*�
+�(¢ − W)((�)(§∘RUV)(� ÒÓ(§∘))}∙&��§∘RUV(�^(§∘RUV)(� ÒÓ(§∘))b}
&��§∘RUV(} ), Ü�� = Ô}ℓÔ�} = �n�} ,
Ü�� = ÑFℓÑ�F = −W�F − º(�� + 1) (−)£����� ln(�(�))F + &���� ln(�(�))(F-£�.Fn
�*� » − (� − 1)
× {∑ &��§ßRUV(^&��(����)§ßR(UVH})(&@ßRS ÒÓ(@(ß))(}�1��@ßRS§ßR(UVHT)&ÒÓ(@(ß))(}2b&��§ßRUV(}n�*�
+ &��@ßRS ÒÓ&@(ß)(§ßR(UVHT)(}&��§ßRUV(} } − �(¢ − W)-&��§∘RUV({�(��)(§∘R(UVHT))&@{RS⟨ÒÓ&@({)(⟩}( &��§∘RUV(}
+ (��)(����)§∘R(UVH}) &@{RS ÒÓ&@({)((}}�^(��)(§∘R(UVHT))&@{RS ÒÓ&@({)((b} &��§∘RUV(} ., Ü�� = ÑFℓÑ�F = −W�F
+(� − 1) −-(1 − £����)£����(� ln(£�))F. − -£� ���(� ln(£�)).F-1 − £����.Fn
�*�
+�(¢ − W)-�&§∘RUV� ÒÓ(§∘)(}�(��§∘RUV)&§∘RUV(� ÒÓ(§∘))}(&��§∘RUV(} .,
Ü�� = ÑFℓÑ�Ñ� = £����(� ln(£�))(1 − £����) + (¢ − W) °(£∘���)(� ln(£∘))(1 − £∘���) ·n�*� ,
Ü�� = ÑFℓÑ�Ñ� = −� −���� ln(�(�))£�n
�*� + (� − 1)
× -∑ &��§ßRUV(°(�� §ßR(UVHT))@ßRS ÒÓ(@(ß))(� ÒÓ(§ß))��§ßRUVµüßRS ýþ(ü(ß))�ß ¶·
_��§ßRUVa}n�*�

Behairy et al.; BJMCS, 14(2): 1-21, 2016; Article no.BJMCS.19958
21
+ (�� §ßR(UVHT))@ßRS ÒÓ(@(ß))(§ßRUV)(� ÒÓ(§ß))_��§ßRUVa} . + �(¢ − W){&��§∘RUV({�§∘RUV�Vü{RS ýþ1ü({)2�∘ �
&��§∘RUV(}
+ ��}(§∘R(UVHT))&@{RS ÒÓ&@({)(( ÒÓ(§∘)}���}§∘R(}UVHT)&@{RS ÒÓ&@({)(( ÒÓ(§∘)&��§∘RUV(} },
Ü�� = Ô}ℓÔ�Ô� = − ∑ ln(£�) + (� − 1)n�*�
× °∑ &��§ßRUV(^§ßRUV ÒÓ(§ß)�{§ßRUV(� ÒÓ(§ß))(� ÒÓ(§ß))}b�^&§ßRUV(}(� ÒÓ(§ß))(� ÒÓ(§ß))b_��§ßRUVa}n�*� · +�(¢ − W)-&��§∘RUV({§∘RUV ÒÓ(§∘)���§∘RUV(ÒÓ(§∘))}}���&§∘RUV ÒÓ(§∘)(}
&��§∘RUV(} ., Ü�� = Ô}ℓÔ�Ô� = ∑ �(�� §ßR(UVHT))@ßRS ÒÓ(@(ß))&��§ßRUV(n�*� − (¢ − W) ��§∘R(UVHT)&@{RS ÒÓ&@({)((��§∘RUV ,
Ü�� = ÑFℓÑ�Ñ� = £����(� ln(£�))(1 − £����) + (¢ − W) �£∘��� ln(£∘)1 − £∘���n
�*�
and
Ü�� = ÑFℓÑ�Ñ� = � ���� ln&�(�)(£� +n�*� (� − 1)
× {∑ &��§ßRUV(°(�� §ßR(UVHT))@ßRS ÒÓ(@(ß))(� ÒÓ(§ß))��§ßRUVµüßRS ýþ(ü(ß))�ß ¶·
_��§ßRUVa}n�*�
+ � (�� §ßR(UVHT)2@ßRS ÒÓ(@(ß))(§ßRUV)(� ÒÓ(§ß))}_��§ßRUVa} .
+�(¢ − W)-&��§∘RUV({�}� §∘R(UVHT)ÒÓ(§∘)&@{RS ÒÓ&@({)((��§∘RUVµü{RS ýþ(ü({))�∘ ¶}
&��§∘RUV(}
+ �}� §∘R(}UVHT)ÒÓ(§∘)&@{RS ÒÓ&@({)((&��§∘RUV(} .. _______________________________________________________________________________________ © 2016 Behairy et al.; This is an Open Access article distributed under the terms of the Creative Commons Attribution License (http://creativecommons.org/licenses/by/4.0), which permits unrestricted use, distribution, and reproduction in any medium, provided the original work is properly cited.
Peer-review history: The peer review history for this paper can be accessed here (Please copy paste the total link in your browser address bar) http://sciencedomain.org/review-history/13092


![Lecture 5 1 Continuous distributions Five important continuous distributions: 1.uniform distribution (contiuous) 2.Normal distribution 2 –distribution[“ki-square”]](https://img.pdfslide.net/doc/110x75/56649c735503460f9492621f/lecture-5-1-continuous-distributions-five-important-continuous-distributions.jpg)