Embed Size (px)
Citation preview
FEDERAL RESERVE BANK OF SAN FRANCISCO
WORKING PAPER SERIES
The Labor Market in the Great Recession: an Update
Michael W.L. Elsby
University of Edinburgh
Bart Hobijn Federal Reserve Bank of San Francisco
VU University Amsterdam and Tinbergen Institute
Aysegul Sahin Federal Reserve Bank of New York
Robert G. Valletta
Federal Reserve Bank of San Francisco
October 2011
The views in this paper are solely the responsibility of the authors and should not be interpreted as reflecting the views of the Federal Reserve Banks of San Francisco and Atlanta or the Board of Governors of the Federal Reserve System.
Working Paper 2011-29 http://www.frbsf.org/publications/economics/papers/2011/wp11-29bk.pdf
MICHAEL W. L. ELSBY University of Edinburgh
BART HOBIJN Federal Reserve Bank of San Francisco,
VU University Amsterdam, and Tinbergen Institute
AYŞEGÜL ŞAHİN Federal Reserve Bank of New York
ROBERT G. VALLETTA Federal Reserve Bank of San Francisco*
The Labor Market in the Great Recession:
An Update
Prepared for Brookings Panel on Economic Activity, September 16th, 2011.
This version: October 24, 2011
ABSTRACT: Since the end of the Great Recession in mid-2009, the unemployment rate has recovered
slowly, falling by only one percentage point from its peak. We find that the lackluster labor market
recovery can be traced in large part to weakness in aggregate demand; only a small part seems
attributable to increases in labor market frictions. This continued labor market weakness has led to the
highest level of long-term unemployment in the U.S. in the postwar period, and a blurring of the
distinction between unemployment and nonparticipation. We show that flows from nonparticipation to
unemployment are important for understanding the recent evolution of the duration distribution of
unemployment. Simulations that account for these flows suggest that the U.S. labor market is unlikely to
be subject to high levels of structural long-term unemployment after aggregate demand recovers.
Keywords: Labor market dynamics, long-term unemployment, unemployment duration.
JEL codes: E24, J2
* The views expressed in this paper solely reflect those of the authors and not necessarily those of the Federal Reserve Bank of New
York, Federal Reserve Bank of San Francisco, nor those of the Federal Reserve System as a whole. We thank Katherine Kuang,
Joyce Kwok, and Brian Lucking for their outstanding research assistance. We are especially grateful to Mary Daly, Chris Nekarda,
Betsey Stevenson, and Kei-Mu Yi for their helpful suggestions and comments. This version is based on data through September
15th 2011.
2 The Labor Market in the Great Recession: An Update
In the Spring 2010 volume of BPEA, we provided an analysis of U.S. labor market developments in
the most recent recession (Elsby, Hobijn, and Şahin, 2011). We documented that, from the
perspective of a wide range of labor market outcomes, the 2007-2009 recession caused the deepest
labor market downturn in the postwar era. In the present paper, we update that earlier work and also
provide new analyses and results regarding the extent and persistence of long-term unemployment
in the aftermath of the recession.
Section 1 provides a summary update of our original work, focusing on indicators of labor
market adjustment such as Okun’s Law and the Beveridge Curve. We also discuss recent research
regarding the implications of these indicators for the extent of structural unemployment and
conclude that it appears to be limited. Section 2 extends our earlier analyses by describing a set of
new facts about unemployment inflows and outflows, which determine the evolution of the
unemployment rate and its duration distribution. We document a sharp increase since the recession
in the incidence of measured monthly inflows to unemployment at reported durations that
substantially exceed one month, which appears to reflect a rising incidence of reporting error in
regard to labor force status and the continuity of periods spent unemployed. Based on this more
complete characterization of net flows, in Section 3 we update the simulation of unemployment
dynamics presented in Elsby, Hobijn, and Şahin (2010). The results of this simulation indicate that
long-term unemployment will largely dissipate if exit rates for the short-term unemployed recover,
reinforcing our conclusion that the current extent of structural unemployment is quite limited.
1. Update on labor market adjustment
The labor market downturn that accompanied the 2007-2009 recession was the most severe
experienced in the postwar era, and the subsequent recovery has been tentative and uneven. The
most adversely affected groups include men in general as well as younger, less educated workers
and individuals from ethnic minorities. Starting in early 2010, labor market conditions have begun
to recover slowly. The unemployment rate, which peaked at 10.1%, fell to 9.1%, still 4.6 percentage
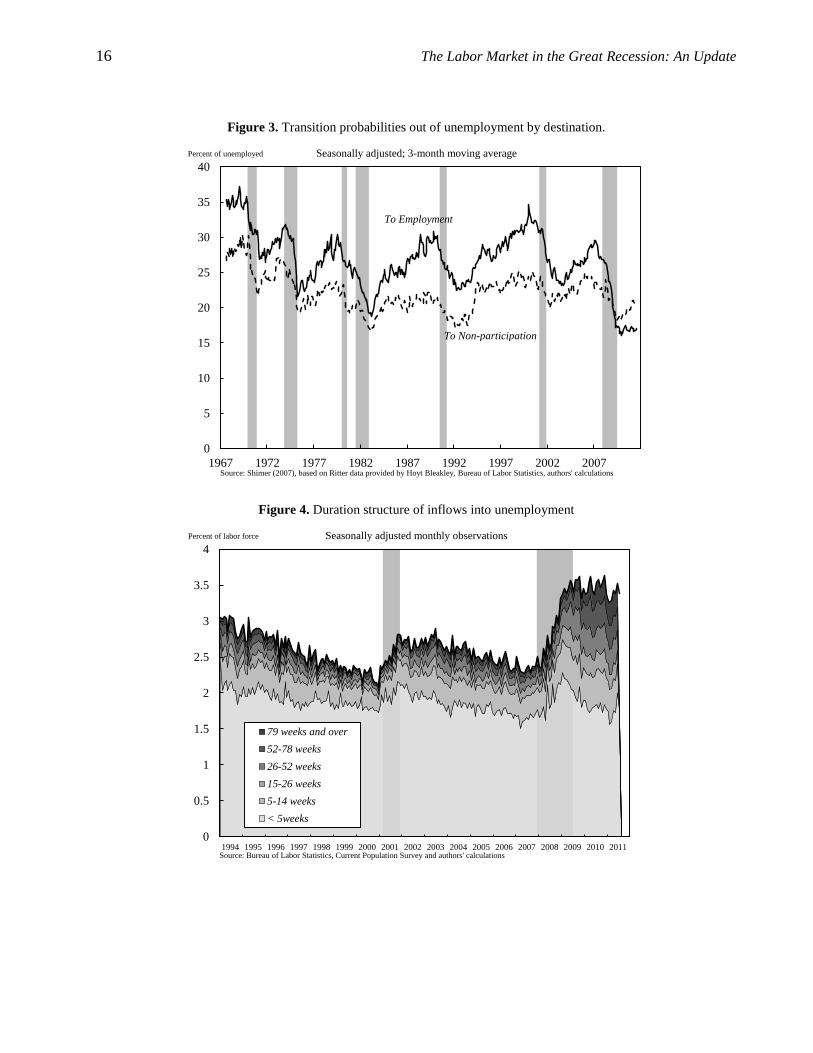
points above pre-recession levels. Of the groups that experienced larger increases in their
Elsby, Hobijn, Șahin, and Valletta 3
unemployment rates during the recession, most have subsequently seen relatively larger declines in
their unemployment rates, i.e. men, younger workers, and Hispanic workers (Table 1).1
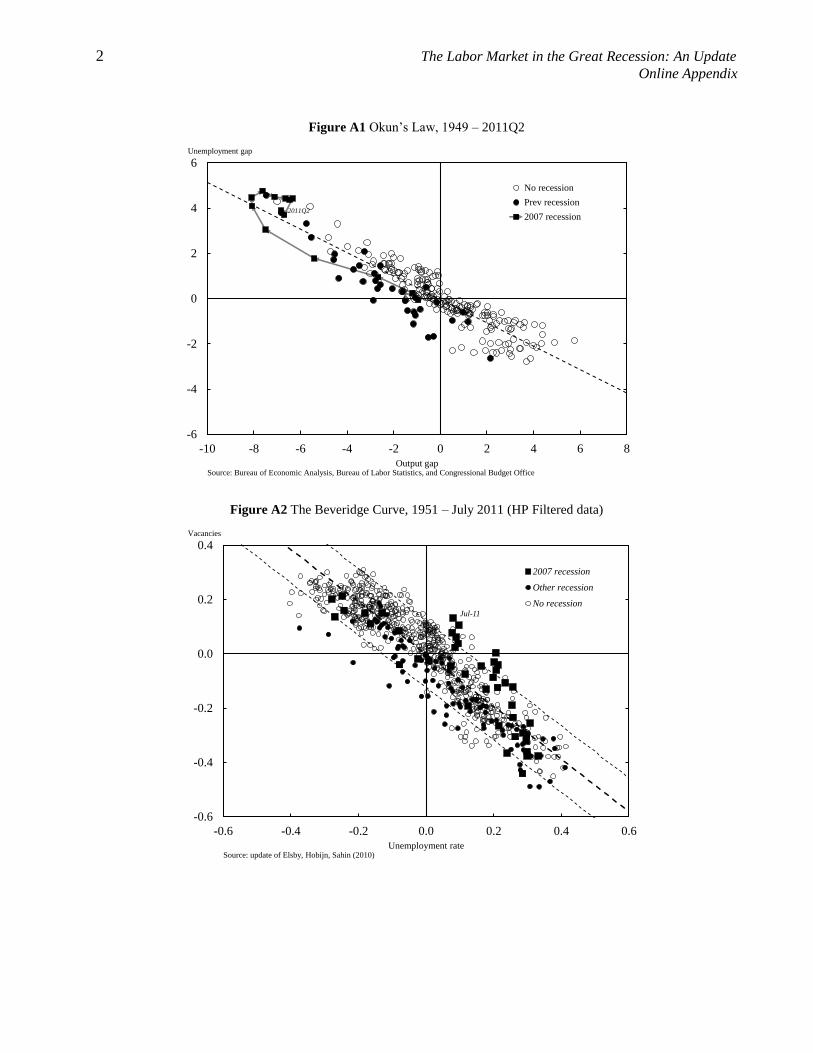
In our earlier paper, we showed that the nature of labor market adjustment until mid-2009 had
displayed a notable resemblance to that observed in past severe downturns. However, the evolution
of indicators of real activity and the labor market began to diverge from past patterns starting in
2009. We summarized this divergence in the context of Okun’s Law and the Beveridge Curve, and
concluded that labor market conditions were weaker than implied by historical relationships
between real activity and the labor market. Since then, there have been downward revisions to both
GDP and the job-openings rate. In addition, the recovery in GDP and job openings slowed
considerably in the first half of 2011 while the unemployment rate fell by about a percentage point.
These developments brought the Okun’s Law relationship in line with historical observations and
narrowed the divergence in the Beveridge Curve relationship.2
Even though measures of real activity and the labor market are now better aligned compared
with late 2009, recent observations on unemployment and job vacancies imply a rightward shift in
the Beveridge Curve of around 2.7 percentage points.3 Based on a search and matching model that
incorporates incentives for vacancy creation, this rightward shift is consistent with an increase in the
natural rate of unemployment of about 0.5 to 1.5 percentage points (see Barnichon, Elsby, Hobijn,
and Şahin, 2011, and Daly, Hobijn, Şahin, and Valletta, 2011). This shift and the implied increase in
the natural rate have been interpreted by us and others as evidence of the growing importance of
structural factors in the persistently high unemployment rate (see for example Kocherlakota, 2010).
In our earlier paper, we identified potential causes of this deviation and evaluated three factors: 1.
skill mismatch; 2. geographic mismatch arising from house-lock; and 3. emergency unemployment
compensation.
There has been a substantial amount of research done to address the quantitative importance of
these channels since early 2010. Our view, which is informed by reviewing the recent literature, as
well as some of our own work, can be summarized as follows:
1 Two important exceptions to this pattern were workers with less than high-school education and black workers. Workers with less
than a high-school diploma saw only a 0.6 percentage point decline in their unemployment rate after a huge 8.3 percentage-point
rise during the recession. And following its initial surge, the unemployment rate of black workers has increased further, by 0.3
percentage points. 2 See Figures A1 and A2 in the accompanying web appendix. 3 See Figure A3 in the web appendix.
4 The Labor Market in the Great Recession: An Update
1. Skill mismatch likely has contributed about 1 percentage point to the increase in the
unemployment rate, with the range of estimates varying from about 0.25 to 1.75 percentage
points (Barnichon and Figura, 2011; Estevão and Tsounta, 2011; Daly, Hobijn, Şahin, and
Valletta, 2011; Şahin, Song, Topa, and Violante, 2011). However, available evidence suggests
that the increase in unemployment that can be attributed to skill mismatch is not structural.
Şahin et al. study a range of measures of mismatch, reflected by the imbalance of vacancy and
unemployment shares across sectors and occupations. While these measures began rising from
2007 until the end of the recession in mid-2009, they have declined significantly since then,
suggesting that the impact of mismatch will largely disappear as the recovery proceeds. This
pattern is consistent with dispersion in the sensitivity of sectoral activity to aggregate demand
fluctuations (e.g. Abraham and Katz, 1986), but further research is needed to study the deep
causes of mismatch.
2. The role of geographic mismatch and the house-lock mechanism has been quantitatively
negligible (Daly, Hobijn, Şahin, Valletta, 2011; Molloy, Smith, and Wozniak, 2010; Şahin,
Song, Topa, and Violante, 2011; Valletta 2010). The observation that the interstate migration
rate declined during the recession was cited by some as motivating evidence for the importance
of geographic mismatch. However, Kaplan and Schulhofer‐Wohl (2010) have shown that the
significant drop reported in the annual interstate migration rate between 2005 and 2006 in the
Current Population Survey was a statistical artifact arising from the procedure the Census
Bureau used to handle missing data. The corrected data show that interstate migration has been
trending downward for many years. Relative to that trend, there was no additional decrease in
interstate migration during the December 2007 to June 2009 period.
3. Recent research on the effect of Emergency Unemployment Compensation (EUC) has shown
that EUC has likely had an impact on the evolution of the natural rate of unemployment. While
estimates range from 0.3-3 percentage points, most studies find an effect of around 1 percentage
point or less. (See Aaronson, Mazumder, and Schecter, 2010; Farber and Valletta, 2011; Fujita,
2010; Nakajima, 2010; Rothstein, 2011; Valletta and Kuang, 2010; and Valletta, 2010).
To summarize, recent research indicates that skill mismatch and EUC have contributed to the
deviation in the Beveridge Curve. However, because this deviation of the Beveridge Curve has
occurred at very low levels of vacancies, it is difficult to separate shifts in the curve that reflect an

Elsby, Hobijn, Șahin, and Valletta 5
increase in matching frictions from short-term cyclical adjustments back toward the curve’s initial
position; at low vacancies, along the flat portion of the curve, small increases in vacancies imply a
large deviation from the prior position of the curve. The existing evidence that we cite above
suggests that the cyclical component has been much more important than the increase in frictions,
and that the latter will dissipate as the labor market recovery progresses and the EUC extensions are
eliminated.
The continued weakness of the labor market thus appears mainly to be due to the continued
shortfall in aggregate demand. The modest recovery in labor demand has been too weak to generate
a substantial decline in the unemployment rate.
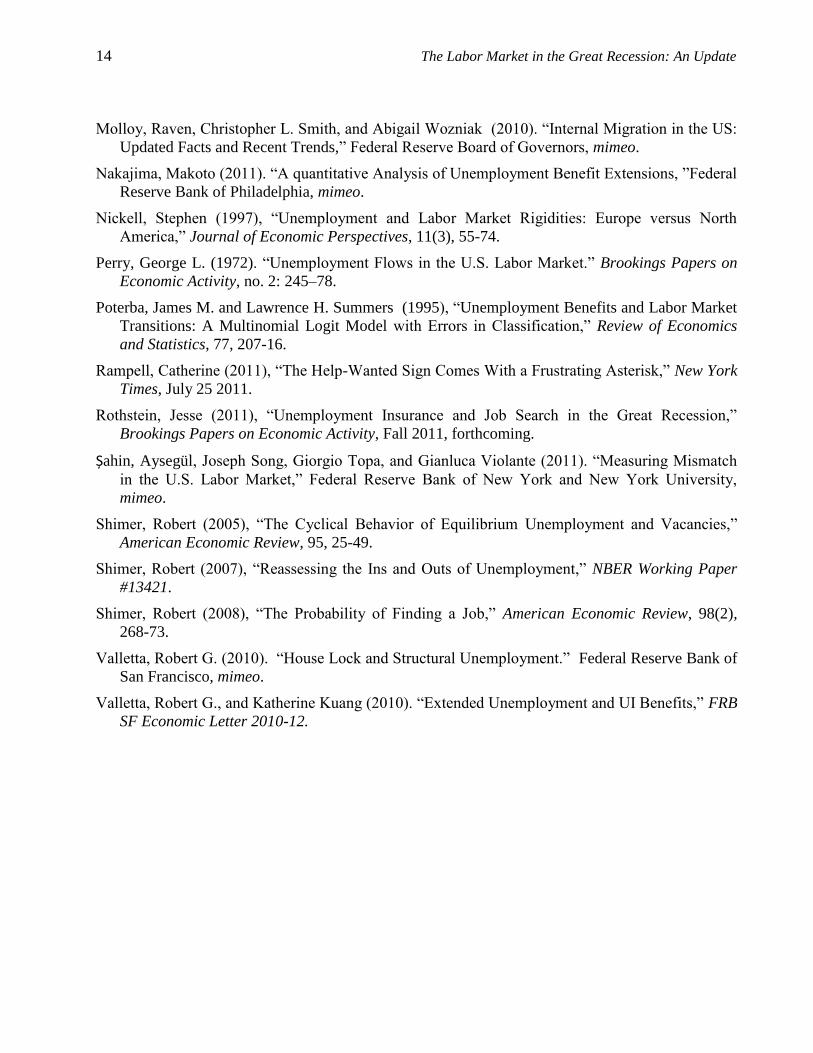
An ongoing development that appears at odds with our claim of limited matching frictions is the
observation that the U.S. is experiencing a record level of long-term unemployment, which has
intensified rather than improved during the two years since the recession ended. This can be seen
from Figure 1, which plots the unemployment rate decomposed into six duration groups. As of July
2011, 4 percent of the labor force reported that they had been unemployed for more than six
months, with three quarters of those unemployed for more than a year. The extent and persistence of
long-term unemployment raises the concern that the U.S. might develop a long-term unemployment
problem of the type that many European countries experienced after the severe recessions of the
1970s and 1980s (referred to as ―Eurosclerosis‖). However, in the next two sections we provide new
evidence indicating that the risk of the U.S. developing its own version of Euroslerosis—which we
term ―Amerisclerosis‖—is not likely, based on our updated and extended analysis of net
unemployment flows and simulations of the resulting unemployment dynamics.
2. Unemployment inflows and outflows reconsidered
In Elsby, Hobijn, and Şahin (2010) we used a labor market flows framework to discuss the
evolution of the U.S. labor market during the Great Recession. A first clue to the potential sources
of recent developments in the unemployment rate can be gleaned from an anomaly that has emerged
in the behavior of two leading measures of these unemployment flows.
The first measure constructs flow transition probabilities from the longitudinally-matched
individual-level data in the Current Population Survey (CPS). For example, the unemployment-to-
employment transition probability can be estimated using these data by computing the fraction of
6 The Labor Market in the Great Recession: An Update
the unemployed in a month who subsequently report they are employed in the following month’s
survey. Estimates of these aggregate transition probabilities for 1990 onwards are available from the
Bureau of Labor Statistics (BLS, 2008), while pre-1990 estimates have been made available by
Shimer (2007). A drawback of these estimated flows is that they appear to contain a large number
of spurious transitions, especially between unemployment and non-participation.4
A second measure of labor market flows can be inferred from the reported duration structure of
unemployment (Perry, 1972; Shimer, 2007). This measure estimates the outflow rate from
unemployment using cross-sectional data on the stock of unemployed workers, , and the number
unemployed for less than 5 weeks, , rather than longitudinal microdata data on the flows.
Using these data, Shimer (2007) computes the unemployment outflow hazard according to
[ ( ) ( )]. (1)
Shimer’s outflow hazard can be interpreted as follows. First, one calculates the fraction of those
unemployed this month who are still unemployed next month. If all inflows into unemployment
consist of persons who report a duration of unemployment shorter than 5 weeks, then this fraction
equals the number of persons unemployed next month, , minus those unemployed next month
with a duration of unemployment shorter than 5 weeks, , expressed as a fraction of the number
of currently unemployed, . Second, one transforms this one-month unemployment ―survival‖ rate
into a continuous-time outflow hazard. This is the unemployment outflow measure that we used for
the majority of the analysis in Elsby, Hobijn, and Şahin (2010).
Figure 2 displays Shimer’s estimate of the outflow hazard together with the unemployment-to-
employment transition rate, where each is plotted as a logarithmic deviation from its respective
historical mean. As we noted in our original paper, historically these two measures have moved
very closely together over the business cycle. Towards the end of the recession in mid-2009,
however, a discrepancy emerged between the two series: Shimer’s measure exhibited a much larger
cyclical downturn than the unemployment-to-employment transition rate.
What might account for this anomaly? A natural candidate is suggested by the observation that
the outflow rate not only captures flows from unemployment to employment due to people
4 See Poterba and Summers (1995) and references therein for a discussion of these spurious flows.
Elsby, Hobijn, Șahin, and Valletta 7
finding jobs, but also flows from unemployment into non-participation. Thus, one might think that
the recent deviation in Figure 2 reflects a decline in the number of unemployed dropping out of the
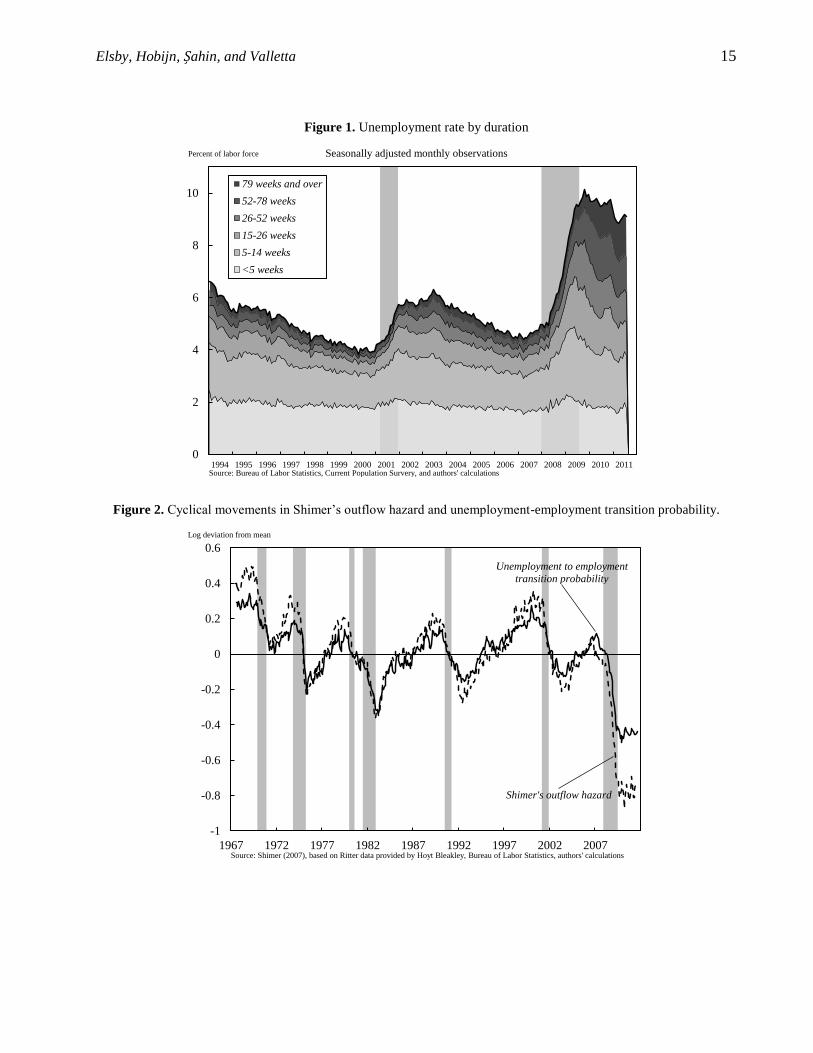
labor force relative to those finding jobs. In fact, the opposite turns out to be the case. Figure 3
reveals that the flow transition rate from unemployment to non-participation has actually increased
since the end of the recession, while that to employment has basically been flat. Far from raising the
observed cyclical downturn in the estimated outflow hazard, this would tend to attenuate its cyclical
amplitude relative to the unemployment-to-employment transition rate.
What turns out to be driving the discrepancy is that the outflow hazard is calculated under the
natural assumption that everyone who flows into unemployment in a month reports a duration of
unemployment of 5 weeks or less. This assumption is not borne out by the data.
To see this, consider Figure 4. It shows inflows into unemployment by reported duration as a
share of the labor force. Historically, there have always been some inflows into unemployment at
durations of 5 weeks or higher. Since the start of 2010, however, these inflows have increased in
size and now comprise about half of the flows into unemployment. A quarter of the total inflows
now reports durations of at least 6 months. Although in principle these flows should not exist, the
reason they appear in the CPS can be traced to the way the survey records unemployment duration.
In particular, nothing in the survey ensures that those who report that they are unemployed, but who
were not classified as unemployed in the previous month’s survey, report a duration of
unemployment of less than 5 weeks. As a result of these high-duration inflows, total inflows into
unemployment exceed in the longitudinally-matched data, particularly since 2010.
Consequently, Shimer’s estimate of the outflow hazard has shown more of a cyclical decline than
the outflow probabilities calculated based on the BLS (2008).5
There are a number of potential interpretations of this phenomenon. A natural candidate is that it
reflects random measurement errors, either in labor force status, unemployment duration, or both
(Poterba and Summers, 1995). Applying this interpretation, however, requires ignoring the clear
cyclical pattern reflected in the recent sharp increase in these flows. The cyclical pattern suggests
that these inflows may reflect something economically more meaningful about the labor market
5 By the same token, the measure of the inflow rate into unemployment proposed by Shimer (2007), and used by us in our original
paper, also misses these high duration inflows into unemployment, since it also is based on the number unemployed for less than 5
weeks. Consistent with this, Figure A4 in the accompanying web appendix shows that this measure of the inflow rate has reverted
completely to its pre-recession level.
8 The Labor Market in the Great Recession: An Update
decisions of CPS respondents than just measurement error. Though a detailed analysis of who
makes up these inflows at high durations is beyond the scope of this update, a couple of points are
worth noting.
First, although approximately 60 percent of the inflows into unemployment at reported durations
higher than one month originate from non-participation, only 25 percent of the inflows with
duration less than one month originate from non-participation. These figures suggest that the
majority of the high-duration inflows into unemployment are driven by individuals who stopped
looking for work for some months and then started looking again in the survey month.6 When asked
how long they have been looking for a job, it is quite plausible that they would report how long it is
since they initially started looking, rather than when they resumed their search. Likewise,
employment-to-unemployment flows at high durations are possible for individuals who took on a
temporary or part-time job and continued looking for a better job while working.
Thus, one interpretation of these high-duration inflows is that they signal individuals who would
like to work more but are not able to find jobs to their liking. Under this interpretation, for those
flowing in from employment the lack of jobs has led them to commit to a temporary solution while
continuing to seek better opportunities, while for those flowing in from non-participation the lack of
jobs has reduced their search effort. The latter group could be reasonably considered as behaving as
marginally attached to the labor force.
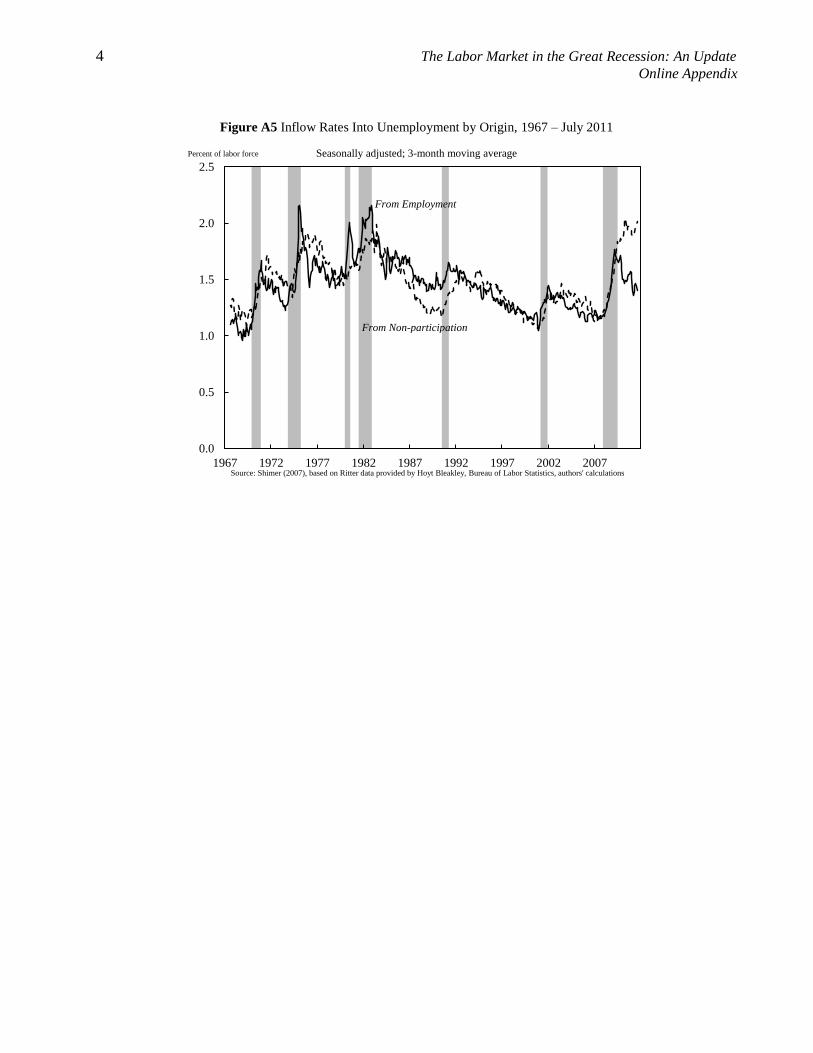
This brings us to the second aspect of these high duration inflows that is worth noting. The vast
majority of those flowing in from non-participation and reporting durations in excess of one month
were not classified as marginally attached when they were out of the labor force. As noted above,
the increased incidence of these high-duration inflows since the recession ended suggests that this
pattern does not solely reflect random measurement, but instead reflects periodic re-entry by
individuals who are loosely attached to the labor market. If this interpretation is correct, it suggests
that alternate measures of unemployment that include the marginally attached, like U5 and U6, have
been understating the actual amount of labor underutilization since the recession ended.
The pattern of inflows into unemployment at reported durations exceeding one month that we
uncovered is important not only for understanding anomalies that have recently emerged in
6 This is also consistent with the observation that non-participants have continued to flow into unemployment at an increasing rate
since the end of the recession. See Figure A5 in the accompanying web appendix.

Elsby, Hobijn, Șahin, and Valletta 9
estimates of unemployment flows, it is essential for understanding the dynamics of the duration
distribution of unemployment and thus the dynamics of the long-term unemployment rate. We turn
to this issue in the next section.
3. Long-Term Unemployment: Amerisclerosis?
In Elsby, Hobijn, and Şahin (2010) we presented a simulation of the future evolution of the
aggregate outflow rate that accounted for outflow rates out of unemployment that vary substantially
by duration. That simulation did not account for the inflows at high durations that have become
increasingly prominent since we wrote our original paper.7 Because these inflows raise measured
unemployment durations, ignoring them makes it very difficult to match the right tail of the
unemployment duration distribution. Although the emphasis in the simulation in Elsby, Hobijn, and
Şahin (2010) was not on the duration distribution, it substantially underpredicts the number
unemployed at durations of 6 months or longer in the data.
In order to simulate accurately the dynamics of the measured duration structure of
unemployment, then, one needs to take into account both inflows and outflows into unemployment
at all durations. Figure 4 has already summarized the duration structure of inflows into
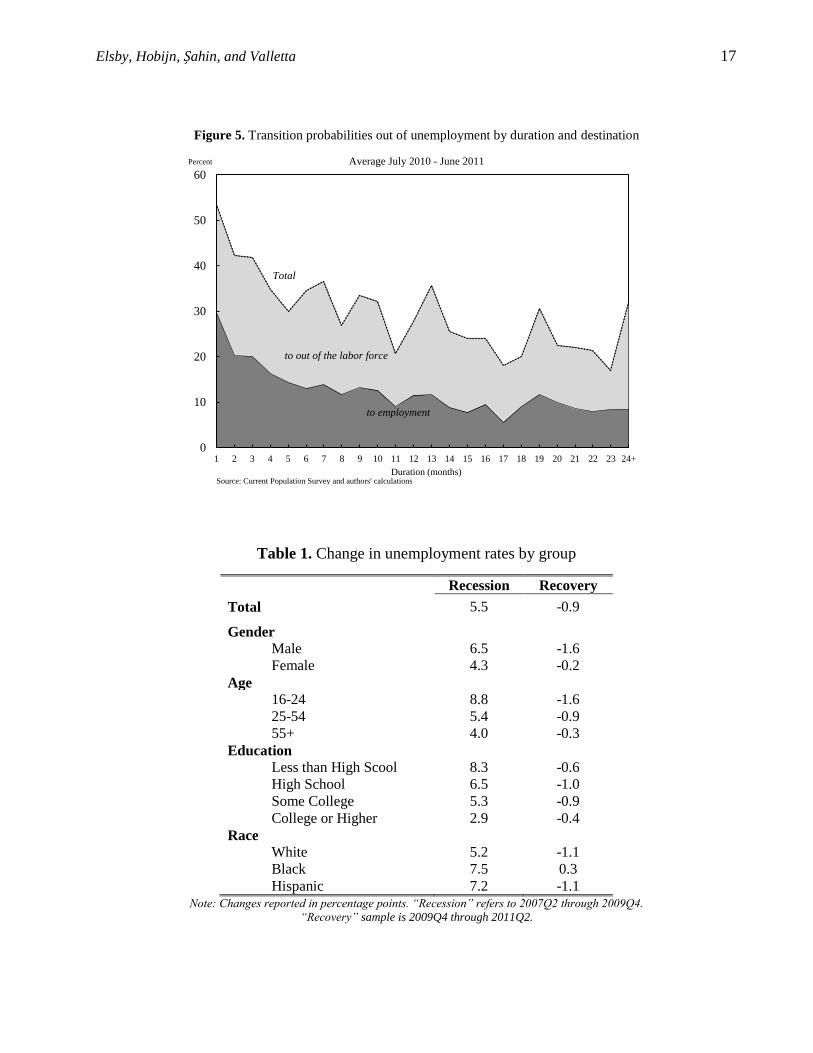
unemployment. Figure 5 plots analogous estimates of outflow rates from unemployment by duration
and destination based on CPS microdata for the recent 12-month period of July 2010 through June
2011.
Despite the recent severity of long-term unemployment, job-finding rates among the long-term
unemployed (defined as durations exceeding six months) remain sufficiently high that most will
find work within a medium-term timeframe. The figure shows that each month an average of nearly
11 percent of the long-term unemployed find a job. While this job-finding rate is at a historical low
in the U.S., it is nonetheless slightly higher than the outflow rate of the French unemployed,
averaged across the complete duration distribution as well as expansions and recessions (Hobijn and
Şahin, 2009). At this rate, about half of the long-term unemployed in the U.S. will find a job within
six months, and three-fourths will find a job within one year.
7 Other recent analyses that examine the duration distribution of unemployment and duration dependence in exit rates also do not
account for the duration structure for inflows (e.g., Hornstein, 2011, and Rothstein, 2011),.
10 The Labor Market in the Great Recession: An Update
Recent anecdotal evidence suggests that it is very difficult for the long-term unemployed to find
a job.8 However, Figure 5 reveals that though job-finding rates for the long-term unemployed are
much lower than for the short-term unemployed, they change little as duration lengthens beyond six
months. The job-finding rate for the very long-term unemployed, with durations of 18 months and
higher, is not much lower than for those with durations of 6 to 18 months.
The dynamics of the unemployment duration distribution are determined by the net outflow
rates from unemployment at different duration bins (outflows, Figure 5, minus inflows, Figure 4).
For example, the net outflow rate at durations of 1-3 months during a quarter is given by the share
of those unemployed for 1 to 3 months who have not exited unemployment by the next quarter.9
(
). (2)
The calculation of these net outflows is quite simple since it only involves counting unemployed
individuals by duration bins and thus does not require the use of longitudinally-matched CPS data.
This approach assumes that the reported durations are correct, which is appropriate for an exercise
aimed at reproducing the duration distribution.10
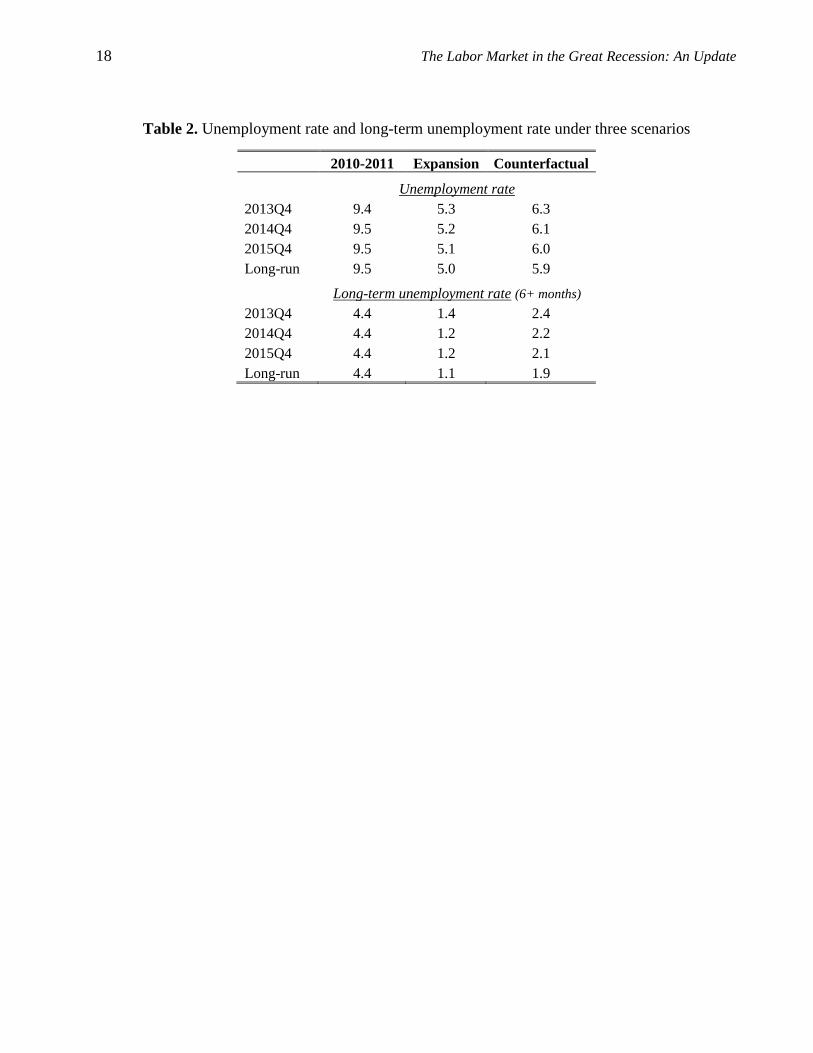
To consider how persistent the long-term unemployment problem in the U.S. might be, in Table
2 we use these flow rates to construct three simulated paths of the unemployment rate. All three
paths start with the average duration structure of unemployment and unemployment rate observed in
the most recent data for 2011Q2. The first path, ―2010-2011,‖ is simulated under the assumption
that the net outflow rates will remain at the levels that prevailed in the most recent four quarters of
data. The second path, ―Expansion,‖ is simulated under the assumption that net outflow rates return
immediately to the levels that prevailed during the preceding expansion, covering 2004Q1-2007Q1.
Our main focus of interest is in the final path in Table 2, labeled ―Counterfactual.‖ This
performs a counterfactual experiment that provides some perspective on the possible effects of a
recovery in labor demand for the short-term unemployed only. Specifically, it assumes that inflows
8 Rampell (2011), for example, discusses the phenomenon of job ads that explicitly require candidates to be ―currently employed‖ or
―recently unemployed.‖ This anecdotal evidence provides support for theories of unemployment dynamics in which applicants are
ranked based on unemployment durations (e.g., Blanchard and Diamond 1994). 9 For the rest of our analysis we use quarterly data because some of the monthly data turn out to be very noisy. The duration bins we
consider are 1-3, 4-6, …, and 18+. 10 All net outflow rates, except that for durations of 16 to 18 months, are lower in the recent four quarters than before the recession.
For some duration bins, net outflow rates are negative, indicating that inflows exceed outflows.
Elsby, Hobijn, Șahin, and Valletta 11
into unemployment, as well as the net outflow rates of the short-term unemployed (with duration
less than 6 months) return to their expansion-period average. The demand for long-term
unemployed is assumed not to recover—their net outflow rates remain at their ―2010-2011‖ levels.
This counterfactual simulation corresponds to a scenario in which the long-term unemployed are
essentially stuck at their existing, depressed rates of exit from unemployment, consistent with the
notion that their current status reflects structural unemployment that will not dissipate as aggregate
labor demand recovers.
Table 2 reports the three paths for the unemployment rate and long-term unemployment rate
obtained from these simulations. The ―long-run‖ values correspond to the implied flow-steady-state
outcomes; the unemployment rates listed for prior years converge quickly to the steady-state values.
As can be seen from the table, the net outflow rates observed over the past four quarters imply a
steady-state unemployment rate of 9.5 percent, slightly above that in 2011Q2. Since the ―2010-
2011‖ scenario suggests the labor market is approximately in its flow steady state, it implies that the
long-term unemployment rate will barely budge going forward.
If instead the inflow and net outflow rates instantaneously return to their expansionary levels,
then the unemployment rate will drop rapidly to below 6 percent in mid-2012, 5.1 percent at the end
of 2015, and converge to 5.0 percent. Interestingly, the latter corresponds to a leading current
estimate of the pre-recession natural rate (CBO, 2011). Under this scenario, the long-term
unemployment rate will drop rapidly, and will approximately return to its pre-recession level of 1.2
percent as well.
It is the counterfactual exercise, however, that is most informative regarding the factors that are
likely to shape the recovery of the labor market. Under this scenario, in which net outflow rates
remain unchanged for the long-term unemployed, the unemployment rate falls steeply to 6.0 percent
by the end of 2015, and ultimately converges to 5.9 percent. The latter coincides with the latest
estimate of the natural rate reported in Daly, Hobijn, Şahin, and Valletta (2011). The relatively
modest increase in the steady-state unemployment rate relative to its expansionary values
emphasizes the critical role of improvement in outflow rates for the short-term unemployed for
lowering the overall unemployment rate. Strikingly, even though the counterfactual scenario
assumed no improvement in the demand for the long-term unemployed, their unemployment rate
falls to 1.9 percent, less than half of its value implied by current unemployment flows.
12 The Labor Market in the Great Recession: An Update
This exercise highlights two important lessons for the recovery of the U.S. labor market. First, a
very effective way to prevent a long-term unemployment problem is to improve the likelihood that
individuals find a job before they become long-term unemployed. Second, even in the context of the
very depressed labor market conditions of recent years, the long-term unemployed are nonetheless
finding jobs at a sufficient rate that a stimulus to the prospects of the short-term unemployed will
fuel a rapid and near-complete recovery in the labor market as a whole.11
4. Conclusion
Since our original paper, Elsby, Hobijn, and Şahin (2010), many other studies have confirmed that
there is little evidence that increases in labor market frictions due to mismatch or the effects of the
temporary extensions of unemployment compensation can account for a large part of the continued
elevated level of unemployment. Instead, downward data revisions on economic activity released
since our original analysis suggest that the labor market weakness is more in line with overall
economic slack than we initially thought.
Because of this continued weakness a record number of people now report to have been looking
for a job for 6 months or longer. Recently measured unemployment durations have been propped up
to an unusual degree by inflows to unemployment at reported durations exceeding one month.
These inflows are typically ignored in the existing literature on unemployment duration dynamics
but are essential to understanding the current environment. In addition, we found that during the
last year, over 10 percent of the long-term unemployed have found jobs each month, but this pace
has not been rapid enough to reduce reported durations in the presence of the high-duration inflows.
We used this information on the inflow and outflow rates at different durations to simulate the
path of the unemployment rate under alternative scenarios for net outflow rates. We found that
even if exit rates for the long-term unemployed do not rise above their recent depressed values, an
increase in exit rates for the short-term unemployed to their pre-recession levels will substantially
reduce the long-term unemployment rate. Hence, we interpret the current flow dynamics of the U.S.
labor market as indicating a low risk that the U.S. labor market will suffer from a bout of
11 This insight regarding the overwhelming importance of exit rates for the short-term unemployed is not new. For example, Nickell
(1997) emphasizes this point when he discusses the importance of active labor market policies to aid the unemployed in European
countries that did not suffer much from Eurosclerosis. Of course, active labor market policies are only one particular policy option
to improve labor market outcomes of the short-term unemployed. Other types of stimulus might have a similar effect.
Elsby, Hobijn, Șahin, and Valletta 13
persistently elevated long-term unemployment (―Amerisclerosis‖), even after the most severe
recession in postwar U.S. history.
References
Aaronson, Daniel, Bhashkar Mazumder, and Shani Schechter (2010). ―What is behind the rise in
long-term unemployment?‖ Federal Reserve Bank of Chicago Economic Perspectives 2Q/2010:
28-51.
Abraham, Katharine G., and Lawrence F. Katz (1986), ―Cyclical Unemployment: Sectoral Shifts or
Aggregate Disturbances?‖ Journal of Political Economy, 94(3), 507-522.
Barnichon, Regis, Michael Elsby, Bart Hobijn and Ayșegül Șahin (2010). ―Which Industries are
Shifting the Beveridge Curve?" FRB SF Working Paper 2010-32.
Blanchard, Olivier J. and Peter Diamond (1994), "Ranking, unemployment duration and wages",
Review of Economic Studies, 61(3), 417-434.
Bureau of Labor Statistics (2008), ―Research series on labor force status flows from the Current
Population Survey,‖ URL: http://www.bls.gov/cps/cps_flows.htm [Last Accessed: 09/29/11]
Congressional Budget Office (2011), ―Budget and Economic Outlook: An Update,‖ August 2011.
Daly, Mary, Bart Hobijn, Ayşegül Şahin, and Rob Valletta (2011). ―A Rising Natural Rate of
Unemployment: Transitory or Permanent?‖ Journal of Economic Perspectives, forthcoming.
Elsby, Michael, Bart Hobijn and Ayşegül Şahin (2010) ―The Labor Market in the Great Recession,"
Brookings Papers on Economic Activity, Spring 2010, 1-48.
Estevão, Marcello, and Evridiki Tsounta (2011). ―Has the Great Recession raised U.S. Structural
Unemployment? ‖ IMF Working Paper 11/105.
Farber, Henry S., and Robert G. Valletta (2011), ―Extended Unemployment Insurance and
Unemployment Duration in The Great Recession: The U.S. Experience.‖ Mimeo, Federal
Reserve Bank of San Francisco and Princeton University, June.
Fujita, Shigeru (2010). ―Effects of the UI Benefit Extensions: Evidence from the Monthly CPS.‖
Working Paper No. 10-35, Federal Reserve Bank of Philadelphia, November.
Hobijn, Bart, and Ayşegül Şahin (2009), ―Job Finding and Separation Rates in the OECD,‖
Economics Letters, 104, 107–111.
Hornstein, Andreas (2011), ―Accounting for Unemployment: The Long and Short of It,‖ mimeo,
Federal Reserve Bank of Richmond.
Kaplan, Greg, and Sam Schulhofer-Wohl (2010). ―Interstate Migration has Fallen Less than You
Think: Consequences of Hot Deck Imputation in the Current Population Survey, ‖ Federal
Reserve Bank of Minneapolis, mimeo.
Kocherlakota, Narayana (2010). ―Inside the FOMC,‖ Speech at Marquette, Michigan, August 17,
2010.
14 The Labor Market in the Great Recession: An Update
Molloy, Raven, Christopher L. Smith, and Abigail Wozniak (2010). ―Internal Migration in the US:
Updated Facts and Recent Trends,‖ Federal Reserve Board of Governors, mimeo.
Nakajima, Makoto (2011). ―A quantitative Analysis of Unemployment Benefit Extensions, ‖Federal
Reserve Bank of Philadelphia, mimeo.
Nickell, Stephen (1997), ―Unemployment and Labor Market Rigidities: Europe versus North
America,‖ Journal of Economic Perspectives, 11(3), 55-74.
Perry, George L. (1972). ―Unemployment Flows in the U.S. Labor Market.‖ Brookings Papers on
Economic Activity, no. 2: 245–78.
Poterba, James M. and Lawrence H. Summers (1995), ―Unemployment Benefits and Labor Market
Transitions: A Multinomial Logit Model with Errors in Classification,‖ Review of Economics
and Statistics, 77, 207-16.
Rampell, Catherine (2011), ―The Help-Wanted Sign Comes With a Frustrating Asterisk,‖ New York
Times, July 25 2011.
Rothstein, Jesse (2011), ―Unemployment Insurance and Job Search in the Great Recession,‖
Brookings Papers on Economic Activity, Fall 2011, forthcoming.
Șahin, Aysegül, Joseph Song, Giorgio Topa, and Gianluca Violante (2011). ―Measuring Mismatch
in the U.S. Labor Market,‖ Federal Reserve Bank of New York and New York University,
mimeo.
Shimer, Robert (2005), ―The Cyclical Behavior of Equilibrium Unemployment and Vacancies,‖
American Economic Review, 95, 25-49.
Shimer, Robert (2007), ―Reassessing the Ins and Outs of Unemployment,‖ NBER Working Paper
#13421.
Shimer, Robert (2008), ―The Probability of Finding a Job,‖ American Economic Review, 98(2),
268-73.
Valletta, Robert G. (2010). ―House Lock and Structural Unemployment.‖ Federal Reserve Bank of
San Francisco, mimeo.
Valletta, Robert G., and Katherine Kuang (2010). ―Extended Unemployment and UI Benefits,‖ FRB
SF Economic Letter 2010-12.
Elsby, Hobijn, Șahin, and Valletta 15
Figure 1. Unemployment rate by duration
Figure 2. Cyclical movements in Shimer’s outflow hazard and unemployment-employment transition probability.
0
2
4
6
8
10
1994 1995 1996 1997 1998 1999 2000 2001 2002 2003 2004 2005 2006 2007 2008 2009 2010 2011
79 weeks and over
52-78 weeks
26-52 weeks
15-26 weeks
5-14 weeks
<5 weeks
Source: Bureau of Labor Statistics, Current Population Survery, and authors' calculations
Seasonally adjusted monthly observationsPercent of labor force
-1
-0.8
-0.6
-0.4
-0.2
0
0.2
0.4
0.6
1967 1972 1977 1982 1987 1992 1997 2002 2007Source: Shimer (2007), based on Ritter data provided by Hoyt Bleakley, Bureau of Labor Statistics, authors' calculations
Log deviation from mean
Unemployment to employment
transition probability
Shimer's outflow hazard
16 The Labor Market in the Great Recession: An Update
Figure 3. Transition probabilities out of unemployment by destination.
Figure 4. Duration structure of inflows into unemployment
0
5
10
15
20
25
30
35
40
1967 1972 1977 1982 1987 1992 1997 2002 2007Source: Shimer (2007), based on Ritter data provided by Hoyt Bleakley, Bureau of Labor Statistics, authors' calculations
Seasonally adjusted; 3-month moving averagePercent of unemployed
To Employment
To Non-participation
0
0.5
1
1.5
2
2.5
3
3.5
4
1994 1995 1996 1997 1998 1999 2000 2001 2002 2003 2004 2005 2006 2007 2008 2009 2010 2011
79 weeks and over
52-78 weeks
26-52 weeks
15-26 weeks
5-14 weeks
< 5weeks
Source: Bureau of Labor Statistics, Current Population Survey and authors' calculations
Seasonally adjusted monthly observationsPercent of labor force
Elsby, Hobijn, Șahin, and Valletta 17
Figure 5. Transition probabilities out of unemployment by duration and destination
Table 1. Change in unemployment rates by group
Recession Recovery
Total 5.5 -0.9
Gender
Male 6.5 -1.6
Female 4.3 -0.2
Age
16-24 8.8 -1.6
25-54 5.4 -0.9
55+ 4.0 -0.3
Education
Less than High Scool 8.3 -0.6
High School 6.5 -1.0
Some College 5.3 -0.9
College or Higher 2.9 -0.4
Race
White 5.2 -1.1
Black 7.5 0.3
Hispanic 7.2 -1.1 Note: Changes reported in percentage points. “Recession” refers to 2007Q2 through 2009Q4.
“Recovery” sample is 2009Q4 through 2011Q2.
0
10
20
30
40
50
60
1 2 3 4 5 6 7 8 9 10 11 12 13 14 15 16 17 18 19 20 21 22 23 24+
Source: Current Population Survey and authors' calculations
Average July 2010 - June 2011
Duration (months)
Percent
Total
to out of the labor force
to employment
18 The Labor Market in the Great Recession: An Update
Table 2. Unemployment rate and long-term unemployment rate under three scenarios
2010-2011 Expansion Counterfactual
Unemployment rate
2013Q4 9.4 5.3 6.3
2014Q4 9.5 5.2 6.1
2015Q4 9.5 5.1 6.0
Long-run 9.5 5.0 5.9
Long-term unemployment rate (6+ months)
2013Q4 4.4 1.4 2.4
2014Q4 4.4 1.2 2.2
2015Q4 4.4 1.2 2.1
Long-run 4.4 1.1 1.9
MICHAEL W. L. ELSBY University of Edinburgh
BART HOBIJN Federal Reserve Bank of San Francisco,
VU University Amsterdam, and Tinbergen Institute
AYŞEGÜL ŞAHİN Federal Reserve Bank of New York
ROBERT G. VALLETTA Federal Reserve Bank of San Francisco*
Online appendix of
The Labor Market in the Great Recession:
An Update
Prepared for Brookings Panel on Economic Activity, September 16th, 2011.
This version: October 21, 2011 (Preliminary)
ABSTRACT:
This appendix contains a set of background figures referred to, but not included, in the main text.
* The views expressed in this paper solely reflect those of the authors and not necessarily those of the Federal Reserve Bank of New
York, Federal Reserve Bank of San Francisco, nor those of the Federal Reserve System as a whole. We thank Katherine Kuang,
Joyce Kwok, and Brian Lucking for their outstanding research assistance. We are especially grateful to Mary Daly, Chris Nekarda,
Betsey Stevenson, and Kei-Mu Yi for their helpful suggestions and comments. This version is based on data through September
15th 2011.
2 The Labor Market in the Great Recession: An Update
Online Appendix
Figure A1 Okun’s Law, 1949 – 2011Q2
Figure A2 The Beveridge Curve, 1951 – July 2011 (HP Filtered data)
2011Q2
-6
-4
-2
0
2
4
6
-10 -8 -6 -4 -2 0 2 4 6 8
No recession
Prev recession
2007 recession
Source: Bureau of Economic Analysis, Bureau of Labor Statistics, and Congressional Budget OfficeOutput gap
Unemployment gap
Jul-11
-0.6
-0.4
-0.2
0.0
0.2
0.4
-0.6 -0.4 -0.2 0.0 0.2 0.4 0.6
2007 recession
Other recession
No recession
Source: update of Elsby, Hobijn, Sahin (2010)Unemployment rate
Vacancies

Elsby, Hobijn, Șahin, and Valletta 3
Figure A3 The Beveridge Curve, December 2000 – July 2011 (JOLTS-data)
Figure A4 Unemployment Inflow and Outflow Rates, 1948 – July 2011
Jul-11
1%
2%
3%
4%
5%
2% 3% 4% 5% 6% 7% 8% 9% 10% 11%
Source: JOLTS, CPS, fitted and shifted BC based on methodology in Barnichon, Elsby, Hobijn, Sahin (2011)
Monthly observations; pre-2007-recession fit
Unemployment rate
Job openings rate
before 2007
recession
since 2007 recession
Fitted
Gap: 2.7%
Shifted
0%
1%
2%
3%
4%
5%
6%
0%
20%
40%
60%
80%
100%
120%
1948 1953 1958 1963 1968 1973 1978 1983 1988 1993 1998 2003 2008Source: Bureau of Labor Statistics and authors' calculations
Monthly hazard based on Shimer (2005); 3-month moving averagesOutflow hazard Inflow hazard
Outflow hazard, f(t)(left axis)
Inflow hazard, s(t)(right axis)
4 The Labor Market in the Great Recession: An Update
Online Appendix
Figure A5 Inflow Rates Into Unemployment by Origin, 1967 – July 2011
0.0
0.5
1.0
1.5
2.0
2.5
1967 1972 1977 1982 1987 1992 1997 2002 2007Source: Shimer (2007), based on Ritter data provided by Hoyt Bleakley, Bureau of Labor Statistics, authors' calculations
Seasonally adjusted; 3-month moving averagePercent of labor force
From Employment
From Non-participation