Embed Size (px)
Citation preview
1
What is a Labor Surplus Area? D
epar
tmen
t of
Lab
or a
nd W
orkf
orce
Dev
elop
men
t
Bill Haslam, Governor
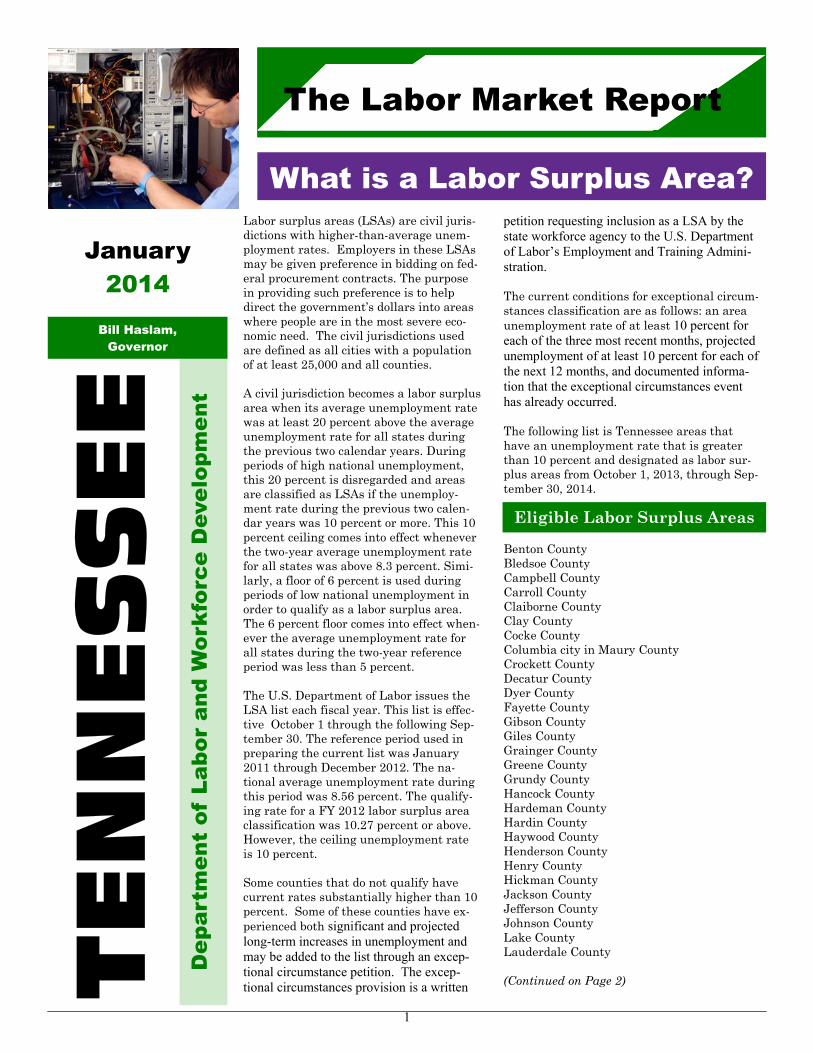
Labor surplus areas (LSAs) are civil juris-dictions with higher-than-average unem-ployment rates. Employers in these LSAs may be given preference in bidding on fed-eral procurement contracts. The purpose in providing such preference is to help direct the government’s dollars into areas where people are in the most severe eco-nomic need. The civil jurisdictions used are defined as all cities with a population of at least 25,000 and all counties. A civil jurisdiction becomes a labor surplus area when its average unemployment rate was at least 20 percent above the average unemployment rate for all states during the previous two calendar years. During periods of high national unemployment, this 20 percent is disregarded and areas are classified as LSAs if the unemploy-ment rate during the previous two calen-dar years was 10 percent or more. This 10 percent ceiling comes into effect whenever the two-year average unemployment rate for all states was above 8.3 percent. Simi-larly, a floor of 6 percent is used during periods of low national unemployment in order to qualify as a labor surplus area. The 6 percent floor comes into effect when-ever the average unemployment rate for all states during the two-year reference period was less than 5 percent. The U.S. Department of Labor issues the LSA list each fiscal year. This list is effec-tive October 1 through the following Sep-tember 30. The reference period used in preparing the current list was January 2011 through December 2012. The na-tional average unemployment rate during this period was 8.56 percent. The qualify-ing rate for a FY 2012 labor surplus area classification was 10.27 percent or above. However, the ceiling unemployment rate is 10 percent. Some counties that do not qualify have current rates substantially higher than 10 percent. Some of these counties have ex-perienced both significant and projected long-term increases in unemployment and may be added to the list through an excep-tional circumstance petition. The excep-tional circumstances provision is a written
petition requesting inclusion as a LSA by the state workforce agency to the U.S. Department of Labor’s Employment and Training Admini-stration. The current conditions for exceptional circum-stances classification are as follows: an area unemployment rate of at least 10 percent for each of the three most recent months, projected unemployment of at least 10 percent for each of the next 12 months, and documented informa-tion that the exceptional circumstances event has already occurred. The following list is Tennessee areas that have an unemployment rate that is greater than 10 percent and designated as labor sur-plus areas from October 1, 2013, through Sep-tember 30, 2014.
Benton County Bledsoe County Campbell County Carroll County Claiborne County Clay County Cocke County Columbia city in Maury County Crockett County Decatur County Dyer County Fayette County Gibson County Giles County Grainger County Greene County Grundy County Hancock County Hardeman County Hardin County Haywood County Henderson County Henry County Hickman County Jackson County Jefferson County Johnson County Lake County Lauderdale County (Continued on Page 2) T
EN
NE
SS
EE
January
2014
The Labor Market Report
Eligible Labor Surplus Areas
2
2013 Labor Market Report Directory
Eligible Labor Surplus Areas in Tennessee (Continued)
Lawrence County Lewis County Marshall County Balance of Maury County McMinn County McNairy County
Van Buren County Warren County Wayne County Weakley County White County
Meigs County Memphis City in Shelby County Monroe County Morgan County Morristown City in Hamblen County Obion County
Perry County Pickett County Polk County Rhea County Scott County Stewart County
Monthly articles of interest that were published in the 2013 issues of The Labor Market Report are listed below. The back issues of The Labor Market Report are available on our department’s Web site at http://www.tn.gov/labor-wfd/lmr. You may also request a print copy or PDF file by e-mail at [email protected]. JANUARY • The 2012 LMR Directory. Articles published in the 2012 issues of The Labor Market
Report. • Fun Facts About the Super Bowl XLVII Cities. A look at interesting non-sports
information about Baltimore and San Francisco. FEBRUARY • What is a Labor Surplus Area? A list of the Tennessee counties that are eligible labor
surplus areas in 2013. MARCH • Fun Facts About Mother’s Day and Father’s Day. Adapted from two Census Bureau
articles that presents information about the history of the days and numbers of Mom’s and Dad’s and the gifts they receive.
APRIL • State Government Tax Collection. Information about the taxes collected in 2012 by
category (income, property, sales, license) by the U.S. and ten southeastern states. MAY • Defined Benefit Plans for Public Employees in 2011. The information, by state, is from
an annual survey of public pensions with numbers of recipients, expenditures, investments, and revenues.
JUNE • County Population estimates. This shows population growth and births minus/deaths
for Tennessee counties in 2010, 2011, and 2012. JULY • Occupational Projections in Tennessee for 2012 to 2014. This article shows base and
projected employment growth and the job openings by major occupational groups. AUGUST • Hispanic Heritage Month. This Census information is about the language, culture,
country of origin, and income of Americans from Spanish speaking countries. SEPTEMBER • NO PUBLICATION. This was a result of the federal government furlough in October
that effected collection of September data. OCTOBER • Per Capita Personal Income from 1969-2011. This article shows changes in income for
the U.S. and selected Metropolitan Statistical Areas over a forty-two year period. NOVEMBER • Fun Facts About St. Patrick’s Day. Who was St. Patrick? Why do we celebrate a day for
him and all things Irish? The article gives information about Irish ancestry in the U.S., current Irish population centers, and famous Irish-Americans.
DECEMBER • Union Membership in the U.S. This article gives information, by state, of the numbers of
union members and non-union members who receive the benefits of union contracts in their workplace during 2012 and 2013.
3
(NUMBERS IN THOUSANDS) MONTHLY DATA NOT SEASONALLY ADJUSTED
Civilian Labor ForceEmployed Unemployed
Year Nonfarm Employmentand Employ- **Manu- Rate
Month Total ment Total facturing **Trade **Services Number (%)1983 2,188.2 1,932.4 1,719.0 468.6 389.9 323.4 255.8 11.7 %1984 2,233.5 2,026.4 1,812.0 497.1 413.3 344.3 207.1 9.31985 2,255.7 2,070.0 1,867.8 492.4 435.3 360.2 185.7 8.21986 2,291.3 2,110.7 1,929.8 490.5 452.1 384.7 180.6 7.91987 2,324.1 2,166.5 2,011.6 497.4 477.2 408.9 157.6 6.81988 2,333.6 2,197.2 2,092.1 511.9 495.6 440.3 136.4 5.81989 2,364.9 2,241.3 2,167.2 524.5 508.4 467.2 123.6 5.21990 2,401.1 2,269.0 2,193.2 493.4 379.1 611.0 132.1 5.51991 2,425.4 2,266.0 2,183.6 480.3 373.0 626.7 159.4 6.61992 2,479.5 2,316.7 2,245.0 492.8 374.1 664.8 162.8 6.61993 2,543.3 2,391.6 2,328.5 502.8 382.5 709.8 151.7 6.01994 2,645.7 2,511.1 2,423.0 513.8 398.4 751.4 134.6 5.11995 2,718.0 2,574.0 2,498.9 518.0 412.6 795.0 144.0 5.31996 2,758.4 2,611.0 2,533.3 501.5 420.9 814.3 147.4 5.3 1997 2,788.3 2,640.0 2,584.0 498.0 430.5 849.7 148.3 5.31998 2,811.7 2,685.2 2,638.4 498.6 437.1 875.7 126.5 4.51999 2,838.7 2,722.1 2,685.3 494.7 443.6 900.8 116.6 4.12000 2,871.5 2,756.5 2,728.9 488.1 447.5 930.9 115.0 4.02001 2,863.5 2,728.5 2,688.3 454.2 446.6 921.5 135.0 4.72002 2,867.1 2,715.0 2,664.4 428.5 438.7 938.0 152.1 5.32003 2,896.1 2,731.4 2,667.5 414.1 440.8 950.3 164.8 5.72004 2,904.4 2,746.2 2,706.1 411.8 447.5 978.7 158.1 5.42005 2,942.3 2,778.5 2,743.1 408.8 454.6 1,005.6 163.8 5.62006 3,008.9 2,852.5 2,783.1 400.1 460.6 1,030.4 156.4 5.22007 3,047.9 2,901.8 2,797.4 380.0 463.5 1,052.8 146.2 4.82008 3,056.9 2,854.0 2,774.8 361.0 457.0 1,058.2 202.9 6.62009 3,032.5 2,713.1 2,619.8 309.2 427.8 1,025.3 319.4 10.52010 3,079.7 2,777.2 2,615.4 298.9 423.5 1,041.2 302.4 9.82011 3,116.9 2,828.6 2,661.4 304.4 427.1 1,076.8 288.3 9.32012 3,113.6 2,864.2 2,714.0 313.4 433.3 1,112.2 249.4 8.02013
December (r) 3,020.5 2,800.7 2,798.2 321.2 452.2 1,159.5 219.7 7.3 %2014
January 3,019.4 2,801.3 2,703.3 316.7 438.4 1,132.0 218.1 7.2 % February March April May June July August September October November (r) December (p)(r)=revised **These industries not comparable to industry employment data before (p)=preliminary 1990 because of changes to NAICS coding system.
Trade = Wholesale and Retail Trade Services = Professional/Business Services, Educational/Health Services,
Jan Jan Jan Jan County 2013 2014 County 2013 2014Anderson 8.1 6.8 Lauderdale 15.1 12.3Bedford 9.6 6.7 Lawrence 13.4 10.5Benton 11.8 10.1 Lewis 12.6 9.5Bledsoe 11.8 9.1 Lincoln 6.6 4.9Blount 7.9 6.6 Loudon 7.5 6.6Bradley 8.0 6.2 Macon 8.8 6.6Campbell 11.8 10.1 Madison 8.9 7.3Cannon 7.6 5.1 Marion 10.1 9.5Carroll 13.8 11.3 Marshall 11.9 8.1Carter 9.9 7.3 Maury 9.7 7.3Cheatham 7.3 5.5 McMinn 10.0 7.9Chester 10.7 8.3 McNairy 11.6 11.6Claiborne 12.5 10.5 Meigs 11.3 9.3Clay 12.7 10.5 Monroe 11.8 9.5Cocke 13.7 10.8 Montgomery 8.5 7.1Coffee 8.0 6.2 Moore 7.6 5.5Crockett 12.6 10.0 Morgan 11.7 9.5Cumberland 11.6 9.2 Obion 13.2 10.8Davidson 6.9 5.3 Overton 11.5 9.3Decatur 11.7 10.0 Perry 14.1 10.4DeKalb 9.1 6.9 Pickett 15.0 13.2Dickson 8.6 6.4 Polk 10.6 9.7Dyer 13.2 10.1 Putnam 8.4 6.4Fayette 11.3 10.2 Rhea 12.7 9.9Fentress 10.5 8.0 Roane 8.6 7.2Franklin 7.9 6.5 Robertson 7.9 5.8Gibson 14.4 11.6 Rutherford 6.9 5.3Giles 10.5 7.5 Scott 19.0 15.9Grainger 12.1 9.6 Sequatchie 10.5 8.3Greene 12.1 9.7 Sevier 12.4 10.4Grundy 10.7 7.7 Shelby 10.1 8.6Hamblen 9.3 7.2 Smith 9.7 7.5Hamilton 8.4 7.1 Stewart 12.6 12.0Hancock 12.9 10.7 Sullivan 8.0 6.6Hardeman 12.1 10.4 Sumner 6.9 5.3Hardin 11.3 10.0 Tipton 12.1 9.9Hawkins 8.8 6.7 Trousdale 10.7 8.7Haywood 13.1 10.9 Unicoi 10.7 9.6Henderson 13.8 10.6 Union 10.2 7.2Henry 12.2 10.3 Van Buren 13.6 11.5Hickman 10.4 7.5 Warren 10.4 7.9Houston 10.9 9.5 Washington 7.6 6.2Humphreys 10.2 8.2 Wayne 13.1 11.2Jackson 11.7 9.3 Weakley 12.0 9.8Jefferson 12.2 9.8 White 12.8 9.4Johnson 11.8 8.6 Williamson 5.6 4.5Knox 6.9 5.5 Wilson 7.4 5.3Lake 12.0 10.4 *Data Not Seasonally Adjusted
TENNESSEE CIVILIAN LABOR FORCE 1983 to present COUNTY UNEMPLOYMENT RATES
3 . 0
4 . 0
5 . 0
6 . 0
7 . 0
8 . 0
9 . 0
1 0 . 0
1 1 . 0
1 2 . 0
Unemployment Rate
U n e m p l o y m e n t R a t e s 1 9 8 3 - 2 0 1 2
4
Statewide
UNEMPLOYMENT INSURANCE ACTIVITIES (MOST RECENT AVAILABLE)
STATE BENEFIT PROGRAM
CLAIMS Oct. 2012 Sept. 2013 Oct. 2013
Initial Claims 25,513 18,652 30,874Continued Weeks Claimed 189,152 168,517 135,227Nonmonetary Determinations 7,876 5,434 8,361Appeals Decisions 2,406 2,179 2,015 Lower Authority 1,923 1,880 1,725 Higher Authority 483 299 290BENEFITS
Amount Paid $36,244,719 $29,109,096 $32,306,560Benefit Weeks Paid 178,954 132,072 136,256Average Weekly Benefit Amount $238 $241 $239First Payments 11,452 7,250 8,642Final Payments 6,138 4,784 4,307Average Weeks Duration 16 15 15Trust Fund Balance $602,383,379 $782,760,071 $793,523,764
FEDERAL BENEFIT PROGRAMS
FORMER FEDERAL EMPLOYEES Oct. 2012 Sept. 2013 Oct. 2013
Benefits Paid $237,731 $314,992 $387,037Benefit Weeks Claimed 827 979 1,208Initial Claims 88 91 937Continued Weeks Claimed 784 1,110 1,008Appeals Decisions 14 9 9
FORMER MILITARY PERSONNEL
Benefits Paid $653,116 $465,743 $473,494Benefit Weeks Claimed 2,101 1,480 1,524Initial Claims 210 146 232Continued Weeks Claimed 1,905 1,622 1,391Appeals Decisions 10 7 8
BENEFIT PROGRAMS - OCTOBER 2013
CONTINUED WEEKS CLAIMED - OCTOBER 2013
9 0
1 4 0
1 9 0
2 4 0
2 9 0
3 4 0
3 9 0
J A N F E B M A R A P R M A Y J U N J U L A U G S E P O C T N O V D E C
C O N T I N U E D C L A I M S
T h o u s a n d s
M O N T H
M O N T H L Y C O N T I N U E D W E E K S C L A I M E D
2 0 1 0 2 0 1 1 2 0 1 2 2 0 1 3
1 5
2 5
3 5
4 5
5 5
6 5
J A N F E B M A R A P R M A Y J U N J U L A U G S E P O C T N O V D E C
I n I t I a l C l a I m s
T h o u s a n d s
M O N T H
M O N T H L Y I N I T I A LC L A I M S
2 0 1 0 2 0 1 1 2 0 1 2 2 0 1 3
5
Statewide Industry January December
Revised
2013 2013
PreliminaryJan. Dec.
Net ChangeJanuary
2014 Jan. 20132014
20132014Jan.
NONFARM EMPLOYMENT & LABOR FORCE NARRATIVE
ESTIMATED NONFARM EMPLOYMENT (in thousands)
Total Nonfarm 2,688.8 2,798.2 2,734.7 45.9 -63.5 Total Private 2,268.4 2,371.9 2,317.5 49.1 -54.4 Goods Producing 417.1 429.7 420.1 3.0 -9.6 Mining, Logging, & Construction 102.2 108.5 103.4 1.2 -5.1 Manufacturing 314.9 321.2 316.7 1.8 -4.5 Durable Goods Manufacturing 196.2 203.1 199.8 3.6 -3.3 Wood Product Manufacturing 10.7 10.8 10.5 -0.2 -0.3 Nonmetallic Mineral Product Manufacturing 12.4 12.0 11.7 -0.7 -0.3 Primary Metal Manufacturing 9.9 10.1 10.0 0.1 -0.1 Fabricated Metal Product Manufacturing 33.7 33.7 32.9 -0.8 -0.8 Machinery Manufacturing 25.5 26.5 26.4 0.9 -0.1 Computer & Electronic Product Manufacturing 5.3 5.2 5.1 -0.2 -0.1 Electrical Equipment & Appliance Manufacturing 17.9 19.0 18.9 1.0 -0.1 Transportation Equipment Manufacturing 57.7 62.7 61.7 4.0 -1.0 Furniture & Related Product Manufacturing 8.5 8.7 8.6 0.1 -0.1 Miscellaneous Manufacturing Durable Goods 14.6 14.4 14.0 -0.6 -0.4 Nondurable Goods Manufacturing 118.7 118.1 116.9 -1.8 -1.2 Textile Mills, Products, & Apparel 10.4 10.4 10.1 -0.3 -0.3 Food Manufacturing 32.1 32.3 31.8 -0.3 -0.5 Beverage & Tobacco Product Manufacturing 5.3 5.2 5.2 -0.1 0.0 Paper Manufacturing 14.6 14.2 14.2 -0.4 0.0 Printing & Related Support Activities 9.5 9.5 9.3 -0.2 -0.2 Chemical Manufacturing 24.5 25.1 24.9 0.4 -0.2 Plastics & Rubber Products Manufacturing 20.3 20.1 20.1 -0.2 0.0 Plastics Product Manufacturing 11.7 12.0 12.1 0.4 0.1 Rubber Product Manufacturing 8.6 8.1 8.0 -0.6 -0.1 Service Providing 2,271.7 2,368.5 2,314.6 42.9 -53.9 Trade, Transportation, & Utilities 573.1 600.6 583.8 10.7 -16.8 Wholesale Trade 120.0 124.2 123.8 3.8 -0.4 Merchant Wholesalers, Durable Goods 61.0 62.3 62.2 1.2 -0.1 Merchant Wholesalers, Nondurable Goods 41.2 42.5 42.5 1.3 0.0 Wholesale Electronic Markets 17.8 19.4 19.1 1.3 -0.3 Retail Trade 309.7 328.0 314.6 4.9 -13.4 Motor Vehicle & Parts Dealers 39.6 41.4 41.9 2.3 0.5 Furniture & Home Furnishings Stores 8.5 9.0 8.5 0.0 -0.5 Building Material, Garden Equipment, & Supplies 24.7 25.8 25.6 0.9 -0.2 Food & Beverage Stores 50.7 53.0 52.4 1.7 -0.6 Health & Personal Care Stores 22.7 23.0 22.4 -0.3 -0.6 Gasoline Stations 20.3 20.3 21.0 0.7 0.7 Clothing & Clothing Accessories Stores 24.9 28.6 25.4 0.5 -3.2 Sporting Goods, Hobby, Book, & Music Stores 10.9 12.6 11.2 0.3 -1.4 General Merchandise Stores 70.1 75.7 69.5 -0.6 -6.2 Miscellaneous Store Retailers 16.1 17.2 16.4 0.3 -0.8 Nonstore Retailers 9.0 9.1 8.7 -0.3 -0.4 Transportation, Warehousing, & Utilities 143.4 148.4 145.4 2.0 -3.0 Utilities 3.4 3.4 3.3 -0.1 -0.1 Transportation & Warehousing 140.0 145.0 142.1 2.1 -2.9 Truck Transportation 53.7 57.4 56.8 3.1 -0.6 Information 43.5 44.0 43.9 0.4 -0.1 Financial Activities 136.0 138.1 137.7 1.7 -0.4 Finance & Insurance 104.3 106.7 106.1 1.8 -0.6 Real Estate, Rental, & Leasing 31.7 31.4 31.6 -0.1 0.2 Professional & Business Services 337.3 366.4 354.4 17.1 -12.0 Professional, Scientific, & Technical Services 111.8 117.5 118.4 6.6 0.9 Management of Companies & Enterprises 35.3 36.8 36.8 1.5 0.0 Administrative, Support, & Waste Management 190.2 212.1 199.2 9.0 -12.9 Educational & Health Services 392.2 401.1 395.9 3.7 -5.2 Educational Services 49.4 52.5 49.3 -0.1 -3.2 Health Care & Social Assistance 342.8 348.6 346.6 3.8 -2.0 Ambulatory Health Care Services 132.9 138.6 137.6 4.7 -1.0 Hospitals 104.3 101.7 101.4 -2.9 -0.3 Nursing & Residential Care Facilities 59.6 61.1 60.8 1.2 -0.3 Social Assistance 46.0 47.2 46.8 0.8 -0.4 Leisure & Hospitality 266.2 286.7 277.9 11.7 -8.8 Arts, Entertainment, & Recreation 25.7 27.4 24.7 -1.0 -2.7 Accommodation & Food Services 240.5 259.3 253.2 12.7 -6.1 Accommodation 30.1 32.5 31.9 1.8 -0.6 Food Services & Drinking Places 210.4 226.8 221.3 10.9 -5.5 Other Services 103.0 105.3 103.8 0.8 -1.5 Government 420.4 426.3 417.2 -3.2 -9.1 Federal Government 49.6 49.4 49.0 -0.6 -0.4 State Government 88.1 94.5 89.7 1.6 -4.8 State Government Educational Services 45.6 53.0 49.1 3.5 -3.9 Local Government 282.7 282.4 278.5 -4.2 -3.9 Local Government Educational Services 145.4 143.8 140.8 -4.6 -3.0
The data from all the nonfarm employment estimates tables in-clude all full- and part-time nonfarm wage and salary employees who worked during or received pay for any part of the pay period that includes the 12th of the month. This is a count of jobs by place of work. Agricultural workers, proprietors, self-employed persons, workers in private households, and unpaid family workers are excluded. These numbers may not add due to rounding. Data are based on the 2013 benchmark.
Total nonfarm employment increased by 45,900 jobs from January 2013 to January 2014. There were large increases in professional/business services (up 17,100 jobs), which included increases of 9,000 jobs in administrative/ support/waste management; and 6,600 jobs in professional/scientific/technical services); and accommodation/food services (up 12,700 jobs), which included an increase of 10,900 jobs in food services/drinking places. Other significant increases were in retail trade (up 4,900 jobs), which included increases of 2,300 jobs in motor vehicle/parts dealers and 1,700 jobs in food/ beverage stores; transportation equipment manufacturing (up 4,000 jobs); health care/social assistance (up 3,800 jobs), which included increases of 4,700 jobs in ambulatory health care services and 1,200 jobs in nursing/residential care facilities combined with a decline of 2,900 jobs in hospitals; wholesale trade (up 3,800 jobs); and state government educational services (up 3,500 jobs).
These increases were partially offset by declines in local government educational services (down 4,600 jobs), and arts/ entertainment/recreation (down 1,000 jobs).
During January 2014 nonfarm employment decreased by 63,500 jobs. The declines were in all major industries. There were significant decreases were in retail trade (down 13,400 jobs), which includes decreases of 6,200 jobs in general merchandise stores and 3,200 jobs in clothing/clothing accessories stores; and administrative/support/waste management (down 12,900 jobs). Other declines were in accommodation/food services (down 6,100 jobs), which included a drop of 5,500 jobs in food services/drinking places; education/health services (down 5,200 jobs), which included declines of 3,200 jobs in educational services and 2,000 jobs in health care/social assistance; mining/logging/construction (down 5,100 jobs); state government (down 4,800 jobs); and local government (down 3,900 jobs).
Tennessee's seasonally adjusted estimated unemployment rate for January 2014 was 7.2 percent, down 0.5 percentage point from the revised December 2013 rate. The United States unemployment rate was 6.6 percent in January 2014. These are the lowest unemployment rates since September 2008, for Tennessee, and October 2008 for the U.S.. In January 2013, the national rate was 7.9 percent while the state unemployment rate was 8.1 percent. Across Tennessee, the unemployment rate decreased in 34 counties, increased in 51 counties and remained the same in 12 counties. In January 2014, the lowest rate was in Williamson County at 4.5 percent, down 0.3 percentage point from the previous month, while the highest rate was in Scott County at 15.9 percent, up from 15.8 percent in December.
6
CIVILIAN LABOR FORCE CIVILIAN LABOR FORCE SUMMARY
Not Seasonally Adjusted
Metropolitan Statistical Areas
Micropolitan Statistical Areas
Seasonally Adjusted U.S. TENNESSEE
U.S. TENNESSEE
Labor Force Employment Unemployed Rate Labor Force Employment Unemployed Rate Labor Force Employment Unemployed Rate
Bartlett Brentwood Bristol Chattanooga Clarksville Cleveland Collierville Columbia Cookeville Franklin Gallatin Germantown Hendersonville Jackson Johnson City Kingsport Knoxville LaVergne Lebanon Maryville Memphis Morristown Murfreesboro Nashville Oak Ridge Smyrna Spring Hill
Cities
Chattanooga Clarksville Cleveland Jackson Johnson City Kingsport Knoxville Memphis Morristown Nashville
Athens Brownsville Columbia Cookeville Crossville Dyersburg Greeneville Harriman Humboldt LaFollette Lawrenceburg Lewisburg Martin McMinnville Newport Paris Sevierville Shelbyville Tullahoma Union City
24,040 21,630 2,410 10.0 23,350 21,460 1,900 8.1 23,480 21,630 1,850 7.9 8,700 7,560 1,140 13.1 8,430 7,510 920 11.0 8,460 7,540 920 10.9
36,960 33,390 3,570 9.7 37,180 34,470 2,720 7.3 36,750 34,070 2,680 7.3 50,180 45,490 4,680 9.3 49,890 46,370 3,520 7.0 49,710 46,080 3,630 7.3 23,960 21,190 2,770 11.6 23,300 21,220 2,080 8.9 23,290 21,160 2,140 9.2 16,920 14,690 2,230 13.2 16,620 14,960 1,660 10.0 16,650 14,970 1,690 10.1 29,670 26,080 3,590 12.1 28,820 26,050 2,780 9.6 29,060 26,250 2,810 9.7 27,040 24,720 2,330 8.6 26,010 24,120 1,890 7.3 25,960 24,080 1,880 7.2 20,950 17,940 3,010 14.4 19,630 17,370 2,250 11.5 19,520 17,260 2,260 11.6 16,800 14,810 1,990 11.8 16,260 14,620 1,640 10.1 16,380 14,720 1,660 10.1 16,230 14,050 2,180 13.4 15,700 14,050 1,650 10.5 15,820 14,160 1,660 10.5 12,430 10,960 1,480 11.9 12,280 11,250 1,030 8.4 12,260 11,270 990 8.1 16,480 14,490 1,980 12.0 14,830 13,360 1,470 9.9 15,090 13,610 1,480 9.8 17,400 15,600 1,810 10.4 17,730 16,400 1,340 7.5 17,050 15,710 1,340 7.9 16,010 13,810 2,190 13.7 15,450 13,960 1,490 9.6 15,760 14,060 1,700 10.8 14,160 12,430 1,740 12.2 13,460 12,160 1,300 9.7 13,660 12,250 1,410 10.3 49,200 43,100 6,110 12.4 48,100 44,490 3,610 7.5 49,280 44,180 5,100 10.4 22,210 20,080 2,130 9.6 22,180 20,630 1,550 7.0 22,480 20,970 1,500 6.7 49,980 46,020 3,960 7.9 49,150 46,050 3,100 6.3 49,150 46,080 3,070 6.3 16,880 14,580 2,300 13.6 15,420 13,780 1,640 10.6 15,540 13,850 1,690 10.9
28,750 26,650 2,100 7.3 28,100 26,200 1,900 6.8 27,940 26,160 1,770 6.3 18,530 17,570 950 5.1 18,670 17,790 890 4.7 18,620 17,820 800 4.3 12,770 11,850 920 7.2 12,580 11,700 870 6.9 12,500 11,700 800 6.4 77,790 70,500 7,290 9.4 75,270 69,320 5,950 7.9 75,260 69,250 6,010 8.0 57,950 52,910 5,040 8.7 57,160 52,810 4,350 7.6 56,300 52,230 4,070 7.2 20,060 18,410 1,650 8.2 19,850 18,570 1,290 6.5 19,630 18,430 1,210 6.2 22,500 20,910 1,590 7.1 21,920 20,550 1,370 6.2 21,780 20,520 1,260 5.8 15,240 13,610 1,630 10.7 15,190 14,050 1,150 7.5 15,070 13,890 1,180 7.9 14,990 13,820 1,170 7.8 15,020 14,090 930 6.2 14,850 14,000 850 5.7 35,010 33,020 1,980 5.7 35,240 33,430 1,810 5.1 35,130 33,490 1,650 4.7 14,250 13,140 1,110 7.8 14,210 13,300 910 6.4 14,170 13,330 850 6.0 19,330 18,140 1,180 6.1 18,910 17,830 1,080 5.7 18,740 17,810 930 5.0 28,130 26,350 1,780 6.3 28,200 26,670 1,530 5.4 28,190 26,720 1,470 5.2 31,680 28,710 2,980 9.4 31,060 28,600 2,460 7.9 30,580 28,230 2,350 7.7 31,630 29,240 2,390 7.5 30,990 29,110 1,880 6.1 30,750 28,910 1,840 6.0 21,710 19,840 1,870 8.6 21,020 19,590 1,430 6.8 21,010 19,580 1,430 6.8 89,860 82,490 7,370 8.2 87,520 81,590 5,930 6.8 87,750 82,020 5,730 6.5 18,850 17,630 1,220 6.4 18,830 17,850 980 5.2 18,880 17,880 1,000 5.3 13,670 12,490 1,180 8.7 13,410 12,640 770 5.7 13,460 12,660 800 5.9 12,960 11,990 970 7.5 12,720 11,860 870 6.8 12,780 11,920 860 6.7
288,480 255,850 32,630 11.3 279,870 251,460 28,410 10.2 277,780 251,140 26,640 9.6 12,610 11,300 1,310 10.4 12,420 11,420 1,000 8.1 12,320 11,320 990 8.1 59,900 55,560 4,340 7.2 59,620 56,240 3,390 5.7 59,650 56,340 3,310 5.6
332,280 309,350 22,930 6.9 331,830 313,130 18,700 5.6 331,120 313,680 17,440 5.3 13,890 12,790 1,100 7.9 13,530 12,630 900 6.6 13,560 12,690 870 6.4 22,610 20,940 1,670 7.4 22,460 21,190 1,270 5.6 22,480 21,230 1,250 5.6 15,970 14,960 1,010 6.3 16,090 15,210 880 5.5 16,010 15,190 820 5.1
259,340 237,970 21,370 8.2 252,940 236,000 16,940 6.7 253,590 236,220 17,360 6.8 116,340 105,220 11,120 9.6 114,760 105,660 9,100 7.9 113,690 104,570 9,120 8.0 57,080 52,320 4,760 8.3 56,460 52,760 3,700 6.6 56,100 52,360 3,740 6.7 56,960 51,720 5,240 9.2 55,660 51,520 4,140 7.4 54,930 50,860 4,070 7.4 97,160 88,910 8,250 8.5 95,030 88,530 6,500 6.8 94,280 87,910 6,370 6.8
145,150 133,260 11,890 8.2 142,200 133,000 9,200 6.5 142,570 133,060 9,500 6.7 360,100 333,770 26,330 7.3 351,330 330,120 21,210 6.0 352,750 331,880 20,870 5.9 609,320 548,570 60,750 10.0 594,220 543,520 50,700 8.5 590,720 540,860 49,860 8.4 61,880 55,150 6,730 10.9 60,770 55,770 5,000 8.2 60,460 55,290 5,170 8.6
842,790 783,770 59,020 7.0 839,610 793,350 46,260 5.5 839,640 794,750 44,900 5.3
155,699,000 143,384,000 12,315,000 7.9 3,102,600 2,850,700 251,900 8.1
154,937,000 144,586,000 10,351,000 6.7 3,031,200 2,796,400 234,800 7.7
155,460,000 145,224,000 10,236,000 6.6 3,034,400 2,815,500 218,900 7.2
154,794,000 141,614,000 13,181,000 8.5 3,081,200 2,804,300 276,800 9.0
154,408,000 144,423,000 9,984,000 6.5 3,020,500 2,800,700 219,700 7.3
154,381,000 143,526,000 10,855,000 7.0 3,019,400 2,801,300 218,100 7.2
January 2013 December 2013 January 2014
7
— TN-Hamilton, Marion, Sequatchie. GA-Catoosa, Dade, Walker
5.5
6.0
6.5
7.0
7.5
8.0
8.5
9.0
9.5
JAN FEB MAR APR MAY JUN JUL AUG SEP OCT NOV DEC
RATE
MONTH
C H A T T A N O O G A M S AU N E M P L O Y M E N T R A T E S
(NOT SEASONALLY ADJUSTED)
2011 2012 2013 2014
Chattanooga MSA
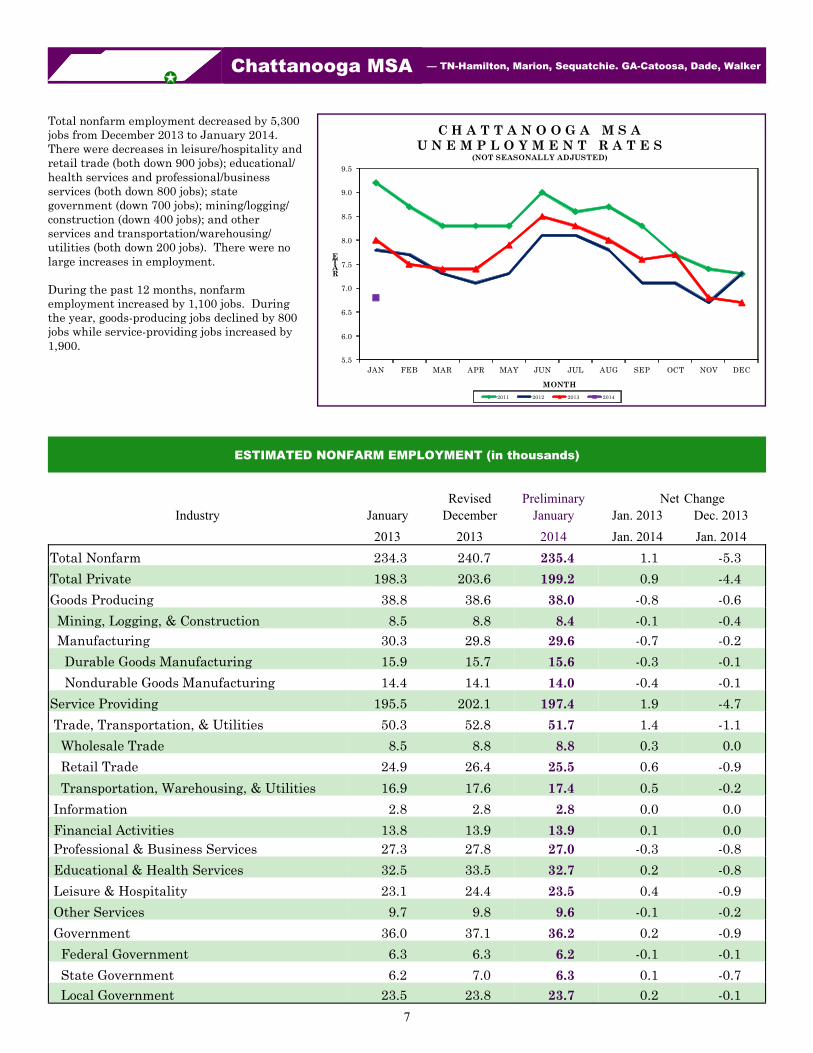
Total nonfarm employment decreased by 5,300 jobs from December 2013 to January 2014. There were decreases in leisure/hospitality and retail trade (both down 900 jobs); educational/ health services and professional/business services (both down 800 jobs); state government (down 700 jobs); mining/logging/ construction (down 400 jobs); and other services and transportation/warehousing/ utilities (both down 200 jobs). There were no large increases in employment. During the past 12 months, nonfarm employment increased by 1,100 jobs. During the year, goods-producing jobs declined by 800 jobs while service-providing jobs increased by 1,900.
Revised Preliminary Net Change Industry January December January Jan. 2013 Dec. 2013
2013 2013 2014 Jan. 2014 Jan. 2014
ESTIMATED NONFARM EMPLOYMENT (in thousands)
Total Nonfarm 234.3 240.7 235.4 1.1 -5.3 Total Private 198.3 203.6 199.2 0.9 -4.4 Goods Producing 38.8 38.6 38.0 -0.8 -0.6 Mining, Logging, & Construction 8.5 8.8 8.4 -0.1 -0.4 Manufacturing 30.3 29.8 29.6 -0.7 -0.2 Durable Goods Manufacturing 15.9 15.7 15.6 -0.3 -0.1 Nondurable Goods Manufacturing 14.4 14.1 14.0 -0.4 -0.1 Service Providing 195.5 202.1 197.4 1.9 -4.7 Trade, Transportation, & Utilities 50.3 52.8 51.7 1.4 -1.1 Wholesale Trade 8.5 8.8 8.8 0.3 0.0 Retail Trade 24.9 26.4 25.5 0.6 -0.9 Transportation, Warehousing, & Utilities 16.9 17.6 17.4 0.5 -0.2 Information 2.8 2.8 2.8 0.0 0.0 Financial Activities 13.8 13.9 13.9 0.1 0.0 Professional & Business Services 27.3 27.8 27.0 -0.3 -0.8 Educational & Health Services 32.5 33.5 32.7 0.2 -0.8 Leisure & Hospitality 23.1 24.4 23.5 0.4 -0.9 Other Services 9.7 9.8 9.6 -0.1 -0.2 Government 36.0 37.1 36.2 0.2 -0.9 Federal Government 6.3 6.3 6.2 -0.1 -0.1 State Government 6.2 7.0 6.3 0.1 -0.7 Local Government 23.5 23.8 23.7 0.2 -0.1
8
Knoxville MSA -Anderson, Blount, Knox, Loudon, Union
ESTIMATED NONFARM EMPLOYMENT (in thousands)
5.0
6.0
7.0
8.0
9.0
JAN FEB MAR APR MAY JUN JUL AUG SEP OCT NOV DEC
RAT
E
MONTH
K N O X V I L L E M S A U N E M P L O Y M E N T R A T E S
(NOT SEASONALLY ADJUSTED)
2011 2012 2013 2014
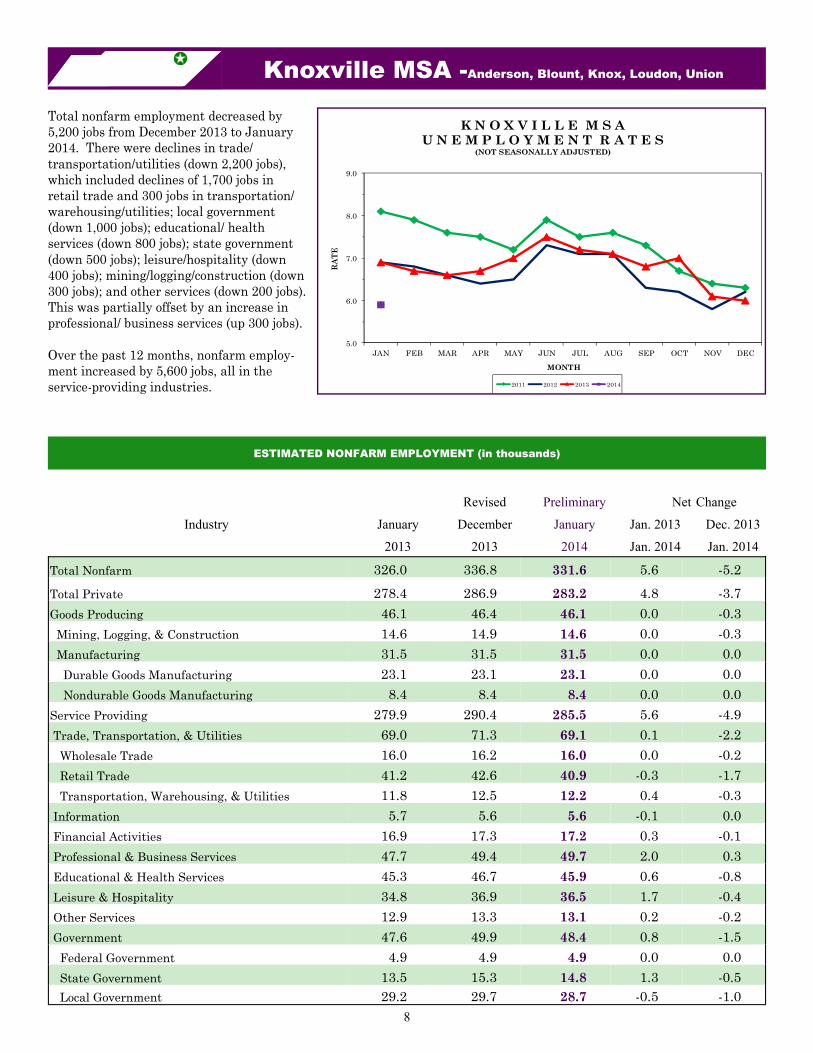
Total nonfarm employment decreased by 5,200 jobs from December 2013 to January 2014. There were declines in trade/ transportation/utilities (down 2,200 jobs), which included declines of 1,700 jobs in retail trade and 300 jobs in transportation/ warehousing/utilities; local government (down 1,000 jobs); educational/ health services (down 800 jobs); state government (down 500 jobs); leisure/hospitality (down 400 jobs); mining/logging/construction (down 300 jobs); and other services (down 200 jobs).This was partially offset by an increase in professional/ business services (up 300 jobs). Over the past 12 months, nonfarm employ- ment increased by 5,600 jobs, all in the service-providing industries.
Revised Preliminary Net Change
Industry January December January Jan. 2013 Dec. 2013
2013 2013 2014 Jan. 2014 Jan. 2014
Total Nonfarm 326.0 336.8 331.6 5.6 -5.2 Total Private 278.4 286.9 283.2 4.8 -3.7 Goods Producing 46.1 46.4 46.1 0.0 -0.3 Mining, Logging, & Construction 14.6 14.9 14.6 0.0 -0.3 Manufacturing 31.5 31.5 31.5 0.0 0.0 Durable Goods Manufacturing 23.1 23.1 23.1 0.0 0.0 Nondurable Goods Manufacturing 8.4 8.4 8.4 0.0 0.0 Service Providing 279.9 290.4 285.5 5.6 -4.9 Trade, Transportation, & Utilities 69.0 71.3 69.1 0.1 -2.2 Wholesale Trade 16.0 16.2 16.0 0.0 -0.2 Retail Trade 41.2 42.6 40.9 -0.3 -1.7 Transportation, Warehousing, & Utilities 11.8 12.5 12.2 0.4 -0.3 Information 5.7 5.6 5.6 -0.1 0.0 Financial Activities 16.9 17.3 17.2 0.3 -0.1 Professional & Business Services 47.7 49.4 49.7 2.0 0.3 Educational & Health Services 45.3 46.7 45.9 0.6 -0.8 Leisure & Hospitality 34.8 36.9 36.5 1.7 -0.4 Other Services 12.9 13.3 13.1 0.2 -0.2 Government 47.6 49.9 48.4 0.8 -1.5 Federal Government 4.9 4.9 4.9 0.0 0.0 State Government 13.5 15.3 14.8 1.3 -0.5 Local Government 29.2 29.7 28.7 -0.5 -1.0
9
Memphis MSA - TN - Fayette, Shelby, Tipton. AR - Crittenden. MS - DeSoto, Marshall, Tate, Tunica
ESTIMATED NONFARM EMPLOYMENT (in thousands)
7.5
8.0
8.5
9.0
9.5
10.0
10.5
11.0
JAN FEB MAR APR MAY JUN JUL AUG SEP OCT NOV DECRA
TEMONTH
M E M P H I S M S A U N E M P L O Y M E N T R A T E S
(NOT SEASONALLY ADJUSTED)
2011 2012 2013 2014
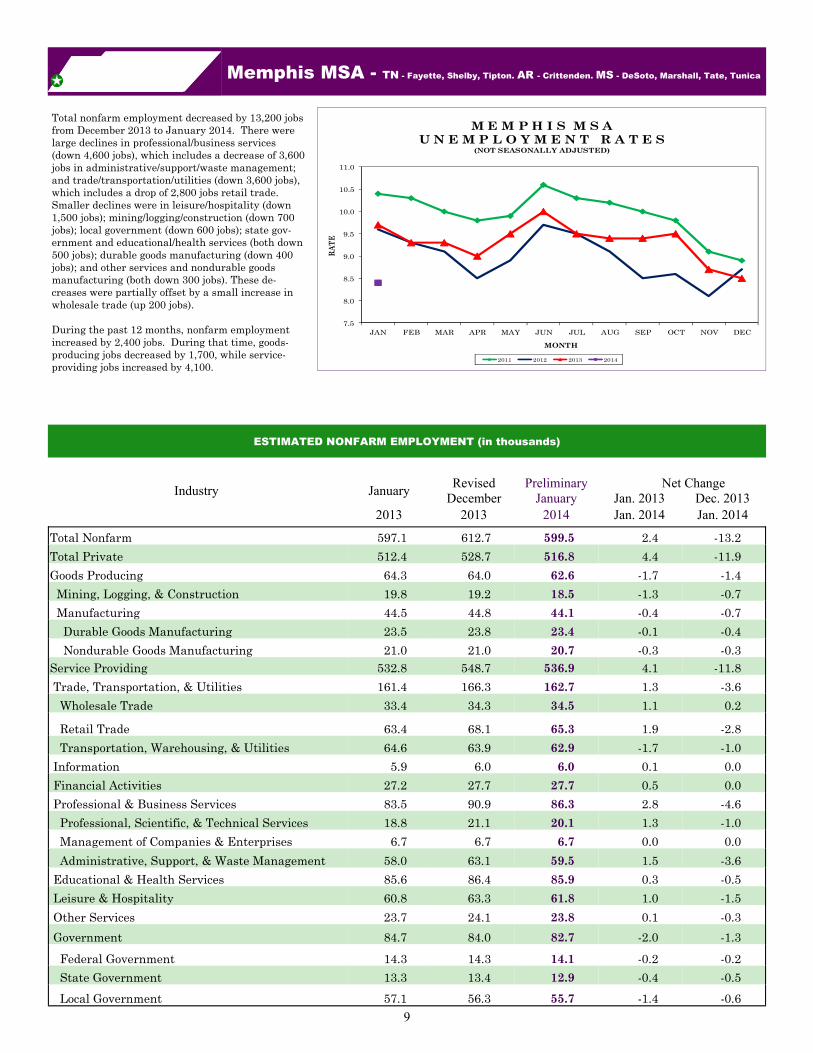
Total nonfarm employment decreased by 13,200 jobs from December 2013 to January 2014. There were large declines in professional/business services (down 4,600 jobs), which includes a decrease of 3,600 jobs in administrative/support/waste management; and trade/transportation/utilities (down 3,600 jobs), which includes a drop of 2,800 jobs retail trade. Smaller declines were in leisure/hospitality (down 1,500 jobs); mining/logging/construction (down 700 jobs); local government (down 600 jobs); state gov-ernment and educational/health services (both down 500 jobs); durable goods manufacturing (down 400 jobs); and other services and nondurable goods manufacturing (both down 300 jobs). These de-creases were partially offset by a small increase in wholesale trade (up 200 jobs). During the past 12 months, nonfarm employment increased by 2,400 jobs. During that time, goods-producing jobs decreased by 1,700, while service-providing jobs increased by 4,100.
Industry January Revised
December Preliminary
January Net
Jan. 2013 Change
Dec. 2013 2013 2013 2014 Jan. 2014 Jan. 2014
Total Nonfarm 597.1 612.7 599.5 2.4 -13.2 Total Private 512.4 528.7 516.8 4.4 -11.9 Goods Producing 64.3 64.0 62.6 -1.7 -1.4 Mining, Logging, & Construction 19.8 19.2 18.5 -1.3 -0.7 Manufacturing 44.5 44.8 44.1 -0.4 -0.7 Durable Goods Manufacturing 23.5 23.8 23.4 -0.1 -0.4 Nondurable Goods Manufacturing 21.0 21.0 20.7 -0.3 -0.3 Service Providing 532.8 548.7 536.9 4.1 -11.8 Trade, Transportation, & Utilities 161.4 166.3 162.7 1.3 -3.6 Wholesale Trade 33.4 34.3 34.5 1.1 0.2
Retail Trade 63.4 68.1 65.3 1.9 -2.8 Transportation, Warehousing, & Utilities 64.6 63.9 62.9 -1.7 -1.0 Information 5.9 6.0 6.0 0.1 0.0 Financial Activities 27.2 27.7 27.7 0.5 0.0 Professional & Business Services 83.5 90.9 86.3 2.8 -4.6 Professional, Scientific, & Technical Services 18.8 21.1 20.1 1.3 -1.0 Management of Companies & Enterprises 6.7 6.7 6.7 0.0 0.0 Administrative, Support, & Waste Management 58.0 63.1 59.5 1.5 -3.6 Educational & Health Services 85.6 86.4 85.9 0.3 -0.5 Leisure & Hospitality 60.8 63.3 61.8 1.0 -1.5 Other Services 23.7 24.1 23.8 0.1 -0.3 Government 84.7 84.0 82.7 -2.0 -1.3
Federal Government 14.3 14.3 14.1 -0.2 -0.2 State Government 13.3 13.4 12.9 -0.4 -0.5 Local Government 57.1 56.3 55.7 -1.4 -0.6
10
Nashville MSA — Cannon, Cheatham, Davidson, Dickson, Hickman, Macon, Robertson, Rutherford, Smith, Sumner, Trousdale, Williamson, Wilson
4.5
5.0
5.5
6.0
6.5
7.0
7.5
8.0
8.5
9.0
JAN FEB MAR APR MAY JUN JUL AUG SEP OCT NOV DEC
RATE
MONTH
N A S H V I L L E M S A U N E M P L O Y M E N T R A T E S
(NOT SEASONALLY ADJUSTED)
2011 2012 2013 2014
ESTIMATED NONFARM EMPLOYMENT (in thousands)
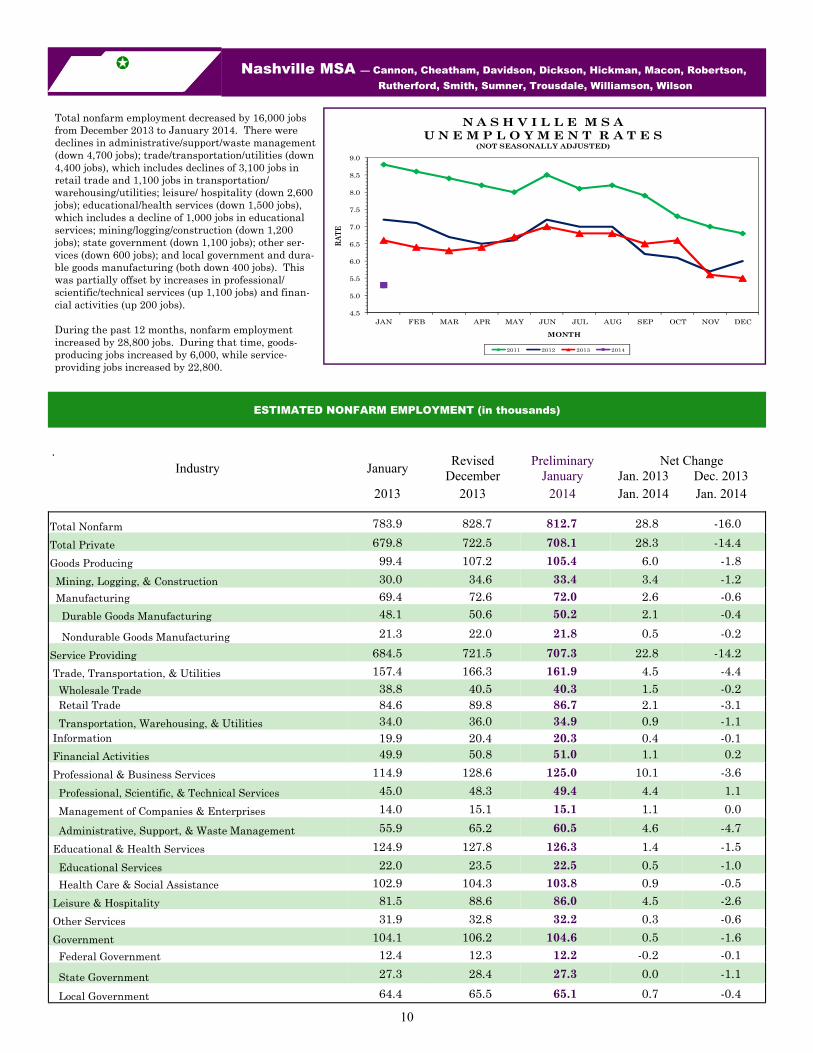
Total nonfarm employment decreased by 16,000 jobs from December 2013 to January 2014. There were declines in administrative/support/waste management (down 4,700 jobs); trade/transportation/utilities (down 4,400 jobs), which includes declines of 3,100 jobs in retail trade and 1,100 jobs in transportation/warehousing/utilities; leisure/ hospitality (down 2,600 jobs); educational/health services (down 1,500 jobs), which includes a decline of 1,000 jobs in educational services; mining/logging/construction (down 1,200 jobs); state government (down 1,100 jobs); other ser-vices (down 600 jobs); and local government and dura-ble goods manufacturing (both down 400 jobs). This was partially offset by increases in professional/scientific/technical services (up 1,100 jobs) and finan-cial activities (up 200 jobs). During the past 12 months, nonfarm employment increased by 28,800 jobs. During that time, goods-producing jobs increased by 6,000, while service-providing jobs increased by 22,800.
. Industry January Revised
December Preliminary
January Net
Jan. 2013 Change
Dec. 2013 2013 2013 2014 Jan. 2014 Jan. 2014
Total Nonfarm 783.9 828.7 812.7 28.8 -16.0 Total Private 679.8 722.5 708.1 28.3 -14.4 Goods Producing 99.4 107.2 105.4 6.0 -1.8 Mining, Logging, & Construction 30.0 34.6 33.4 3.4 -1.2 Manufacturing 69.4 72.6 72.0 2.6 -0.6 Durable Goods Manufacturing 48.1 50.6 50.2 2.1 -0.4
Nondurable Goods Manufacturing 21.3 22.0 21.8 0.5 -0.2 Service Providing 684.5 721.5 707.3 22.8 -14.2 Trade, Transportation, & Utilities 157.4 166.3 161.9 4.5 -4.4 Wholesale Trade 38.8 40.5 40.3 1.5 -0.2 Retail Trade 84.6 89.8 86.7 2.1 -3.1 Transportation, Warehousing, & Utilities 34.0 36.0 34.9 0.9 -1.1 Information 19.9 20.4 20.3 0.4 -0.1 Financial Activities 49.9 50.8 51.0 1.1 0.2 Professional & Business Services 114.9 128.6 125.0 10.1 -3.6 Professional, Scientific, & Technical Services 45.0 48.3 49.4 4.4 1.1 Management of Companies & Enterprises 14.0 15.1 15.1 1.1 0.0 Administrative, Support, & Waste Management 55.9 65.2 60.5 4.6 -4.7 Educational & Health Services 124.9 127.8 126.3 1.4 -1.5 Educational Services 22.0 23.5 22.5 0.5 -1.0 Health Care & Social Assistance 102.9 104.3 103.8 0.9 -0.5 Leisure & Hospitality 81.5 88.6 86.0 4.5 -2.6 Other Services 31.9 32.8 32.2 0.3 -0.6 Government 104.1 106.2 104.6 0.5 -1.6 Federal Government 12.4 12.3 12.2 -0.2 -0.1
State Government 27.3 28.4 27.3 0.0 -1.1
Local Government 64.4 65.5 65.1 0.7 -0.4
11
Clarksville MSA is Montgomery County, Stewart County, Christian County, KY, & Trigg County, KY. Cleveland MSA is Bradley & Polk counties. Jackson MSA is Chester & Madison counties. Johnson City MSA is Carter, Unicoi, & Washington counties. Kingsport-Bristol MSA is Hawkins County, Sullivan County, Scott County, VA, Washington County, VA, & Bristol City, VA. Morristown MSA is Grainger, Hamblen, & Jefferson counties.
Nonfarm Employment (Smaller MSAs)
Clarksville, TN-KY MSA Cleveland, TN MSA Jackson, TN MSA Dec. 2013 Jan. 2014 Dec. 2013 Jan. 2014 Dec. 2013 Jan. 2014 Revised Prelim. Revised Prelim. Revised Prelim.
Johnson City, TN MSA Kingsport-Bristol, TN-VA MSA Morristown, TN MSA Dec. 2013 Jan. 2014 Dec. 2013 Jan. 2014 Dec. 2013 Jan. 2014 Revised Prelim. Revised Prelim. Revised Prelim.
Total Nonfarm 89,400 87,000 45,200 43,700 62,300 60,400 Total Private 68,300 66,600 39,400 38,100 49,700 48,000 Goods Producing 13,300 13,100 10,200 10,000 10,900 10,700 Mining, Logging, & Construction 3,400 3,300 1,600 1,400 2,500 2,300 Manufacturing 9,900 9,800 8,600 8,600 8,400 8,400 Service Providing 76,100 73,900 35,000 33,700 51,400 49,700 Trade, Transportation, & Utilities 17,000 16,100 8,900 8,500 13,000 12,400 Wholesale Trade N.A. N.A. 900 900 3,100 3,100 Retail Trade 12,200 11,400 5,300 5,000 8,100 7,600 Transportation, Warehousing, & Utilities 2,300 2,300 2,700 2,600 1,800 1,700 Information 1,100 1,100 300 300 500 500 Financial Activities 3,000 3,000 1,400 1,300 1,800 1,800
Professional & Business Services 8,700 8,300 5,300 5,300 6,000 5,600
Educational & Health Services 11,400 11,400 6,200 5,800 9,800 9,500
Leisure & Hospitality 10,800 10,600 4,600 4,500 5,500 5,300
Other Services 3,000 3,000 2,500 2,400 2,200 2,200
Government 21,100 20,400 5,800 5,600 12,600 12,400 Federal Government 6,400 6,300 300 300 400 400 State Government 4,400 3,900 700 600 1,800 1,600 Local Government 10,300 10,200 4,800 4,700 10,400 10,400
Total Nonfarm 79,300 77,100 120,700 118,500 47,000 45,600
Total Private 62,600 61,200 104,000 102,400 39,200 38,000 Goods Producing 10,000 9,800 28,100 27,500 12,900 12,600 Mining, Logging, & Construction 2,700 2,500 6,600 6,300 2,000 1,900 Manufacturing 7,300 7,300 21,500 21,200 10,900 10,700 Service Providing 69,300 67,300 92,600 91,000 34,100 33,000 Trade, Transportation, & Utilities 13,800 13,300 25,400 24,800 10,600 10,100 Wholesale Trade 2,100 2,100 5,000 5,000 2,000 2,000 Retail Trade 10,700 10,200 15,500 15,100 6,100 5,800 Transportation, Warehousing, & Utilities 1,000 1,000 4,900 4,700 2,500 2,300 Information 1,400 1,300 2,100 2,100 400 400 Financial Activities 3,800 3,800 3,800 3,800 1,200 1,200 Professional & Business Services 8,700 8,400 9,500 9,400 3,600 3,500 Educational & Health Services 13,500 13,400 18,800 18,900 5,500 5,200 Leisure & Hospitality 9,000 8,800 11,800 11,400 3,800 3,800 Other Services 2,400 2,400 4,500 4,500 1,200 1,200 Government 16,700 15,900 16,700 16,100 7,800 7,600 Federal Government 2,700 2,700 900 900 300 300 State Government 5,800 5,300 2,500 2,200 1,600 1,400 Local Government 8,200 7,900 13,300 13,000 5,900 5,900
12
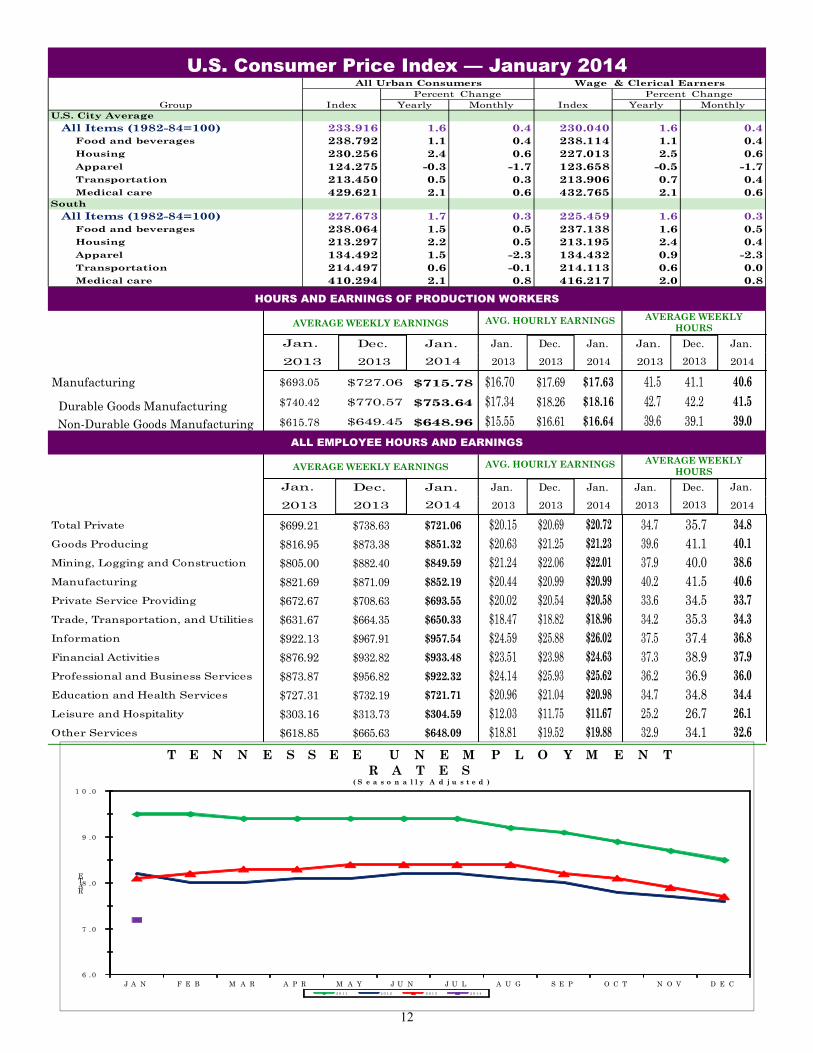
U.S. Consumer Price Index — January 2014
Group Index Yearly Monthly Index Yearly MonthlyU.S. City Average All Items (1982-84=100) 233.916 1.6 0.4 230.040 1.6 0.4 Food and beverages 238.792 1.1 0.4 238.114 1.1 0.4 Housing 230.256 2.4 0.6 227.013 2.5 0.6 Apparel 124.275 -0.3 -1.7 123.658 -0.5 -1.7 Transportation 213.450 0.5 0.3 213.906 0.7 0.4 Medical care 429.621 2.1 0.6 432.765 2.1 0.6South All Items (1982-84=100) 227.673 1.7 0.3 225.459 1.6 0.3 Food and beverages 238.064 1.5 0.5 237.138 1.6 0.5 Housing 213.297 2.2 0.5 213.195 2.4 0.4 Apparel 134.492 1.5 -2.3 134.432 0.9 -2.3 Transportation 214.497 0.6 -0.1 214.113 0.6 0.0 Medical care 410.294 2.1 0.8 416.217 2.0 0.8
Percent Change Percent ChangeAll Urban Consumers Wage & Clerical Earners
HOURS AND EARNINGS OF PRODUCTION WORKERS
AVERAGE WEEKLY EARNINGS AVERAGE WEEKLY HOURS
AVG. HOURLY EARNINGS
Manufacturing
Durable Goods Manufacturing Non-Durable Goods Manufacturing
ALL EMPLOYEE HOURS AND EARNINGS
AVERAGE WEEKLY EARNINGS AVG. HOURLY EARNINGS AVERAGE WEEKLY HOURS
6 . 0
7 . 0
8 . 0
9 . 0
1 0 . 0
J A N F E B M A R A P R M A Y J U N J U L A U G S E P O C T N O V D E C
RATE
T E N N E S S E E U N E M P L O Y M E N T R A T E S
( S e a s o n a l l y A d j u s t e d )
2 0 1 1 2 0 1 2 2 0 1 3 2 0 1 4
Jan. Dec. Jan. 2013 2013 2013
Dec. 2013 2013 2013 20142014 2014
Dec. Jan. Jan. Jan. Jan.
Jan. Dec. Jan. 2013 2013 2013
Dec. 2013 2013 2013 20142014 2014
Dec. Jan. Jan. Jan. Jan.
$693.05
$740.42
$615.78
$727.06
$770.57
$649.45
$715.78
$753.64
$648.96
$16.70$17.34$15.55
$17.69$18.26$16.61
$17.63$18.16$16.64
41.542.739.6
41.142.239.1
40.641.539.0
$738.63$873.38$882.40$871.09$708.63$664.35$967.91$932.82$956.82$732.19$313.73$665.63
$721.06$851.32$849.59$852.19$693.55$650.33$957.54$933.48$922.32$721.71$304.59$648.09
$20.15$20.63$21.24$20.44$20.02$18.47$24.59$23.51$24.14$20.96$12.03$18.81
$20.69$21.25$22.06$20.99$20.54$18.82$25.88$23.98$25.93$21.04$11.75$19.52
34.739.637.940.233.634.237.537.336.234.725.232.9
$20.72$21.23$22.01$20.99$20.58$18.96$26.02$24.63$25.62$20.98$11.67$19.88
35.741.140.041.534.535.337.438.936.934.826.734.1
34.840.138.640.633.734.336.837.936.034.426.132.6
$699.21$816.95$805.00$821.69$672.67$631.67$922.13$876.92$873.87$727.31$303.16$618.85
Total Private
Goods Producing
Mining, Logging and Construction
Manufacturing
Private Service Providing
Trade, Transportation, and Utilities
Information
Financial Activities
Professional and Business Services
Education and Health Services
Leisure and Hospitality
Other Services