Embed Size (px)
Citation preview
The LAMOST 1d Spectroscopic Pipeline
A-Li LUO
LAMOST team, NAOC
2008/12/3
The KIAA-Cambridge Joint Workshop on Near-Field Cosmology and Galactic Archeology
Lessons from SDSS
• Three 1d pipelines of SDSS (template based )
Princeton 1d; Fermi 1d; SEGUE: SSPP
• Have been improving from DR1->DR7
Task of 1D pipeline
• Classification and Identification
• Measurement (z of galaxies and QSOs, rv of stars)
• Stellar parameter estimation
• Special Candidate searching (Supernovae, Metal-poor stars, HII …) – according to requirements of astronomers
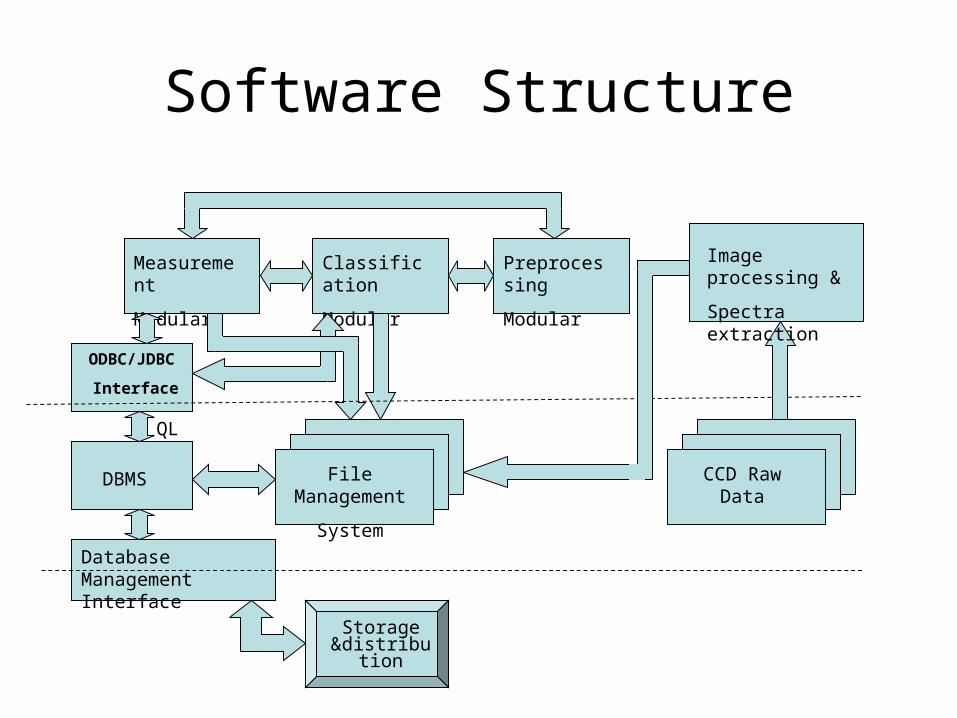
Software Structure
Measurement
Modular
Classification
Modular
Preprocessing
Modular
File Management
System
ODBC/JDBC
Interface
DBMS CCD Raw Data
Database Management Interface
QL
Storage &distribution
Image processing &
Spectra extraction
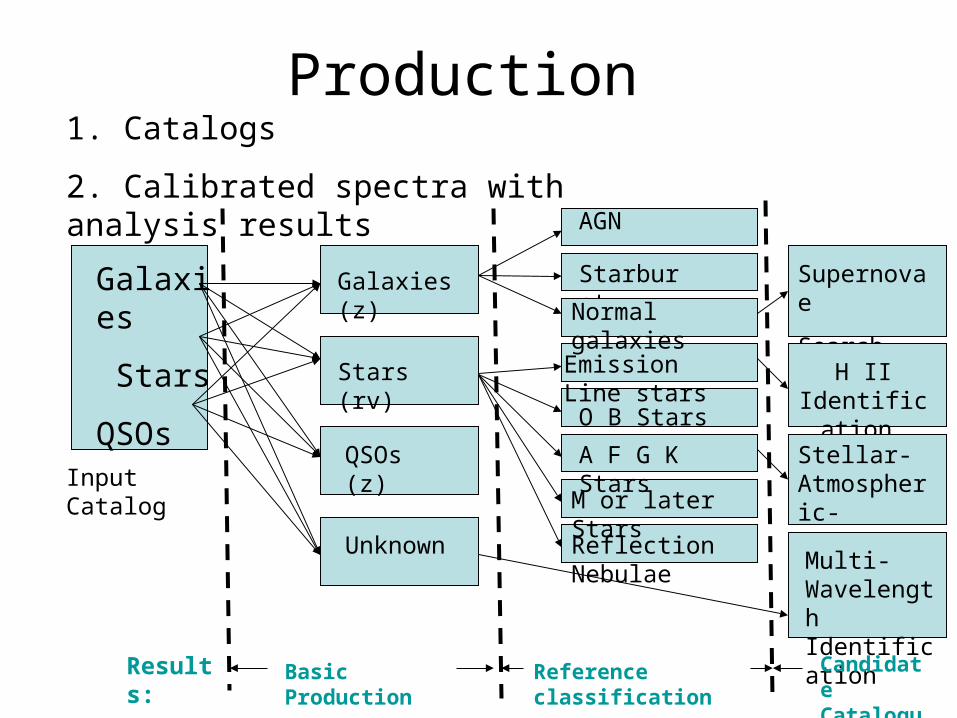
Production
Galaxies
Stars
QSOsInput Catalog
Galaxies (z)
Stars (rv)
QSOs (z)
Unknown
Basic Production
AGN
Starburst
Supernovae
SearchEmission Line stars
H II Identificat
ion O B Stars
M or later Stars
A F G K Stars
Reflection Nebulae
Reference classification
Stellar-Atmospheric- Parameters
Normal galaxies
Multi-Wavelength IdentificationCandidat
e Catalogue
1. Catalogs
2. Calibrated spectra with analysis results
Results:
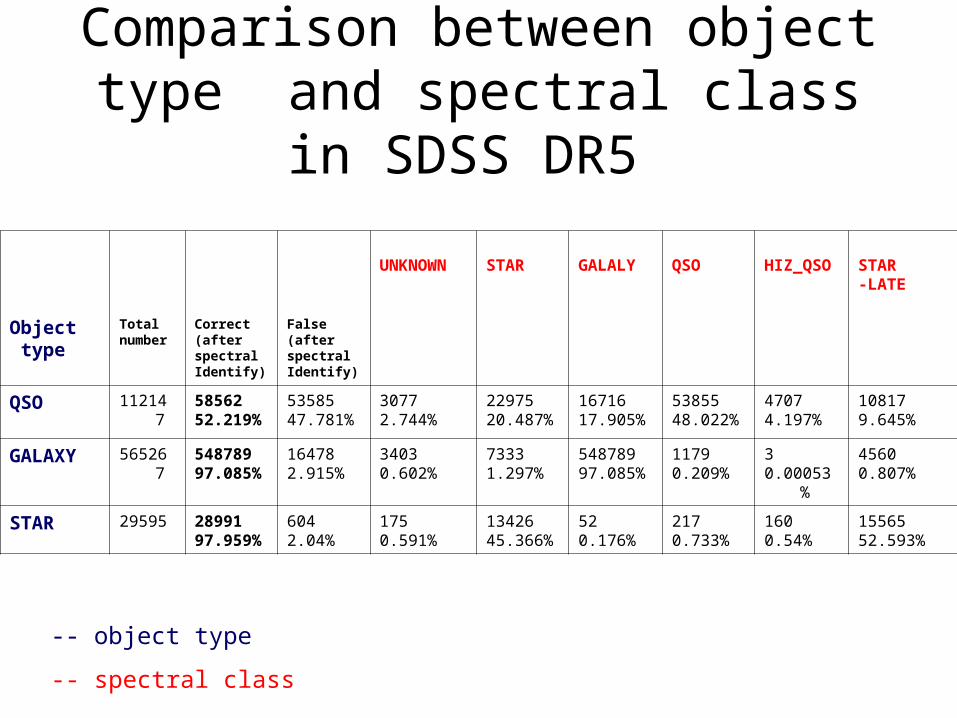
Comparison between object type and spectral class in SDSS DR5
Object type
Totalnumber
Correct(after spectralIdentify)
False(after spectralIdentify)
UNKNOWN STAR GALALY QSO HIZ_QSO STAR-LATE
QSO 112147 5856252.219%
5358547.781%
30772.744%
2297520.487%
1671617.905%
5385548.022%
47074.197%
108179.645%
GALAXY 565267 54878997.085%
164782.915%
34030.602%
73331.297%
54878997.085%
11790.209%
30.00053%
45600.807%
STAR 29595 2899197.959%
6042.04%
1750.591%
1342645.366%
520.176%
2170.733%
1600.54%
1556552.593%
-- object type
-- spectral class
Classification algorithm
• Automated Classification by objective methods (training by templates, predicting by distance or density ), collaborators: IA(CAS), BNU,SDU, etc.
• Identified by line measurement
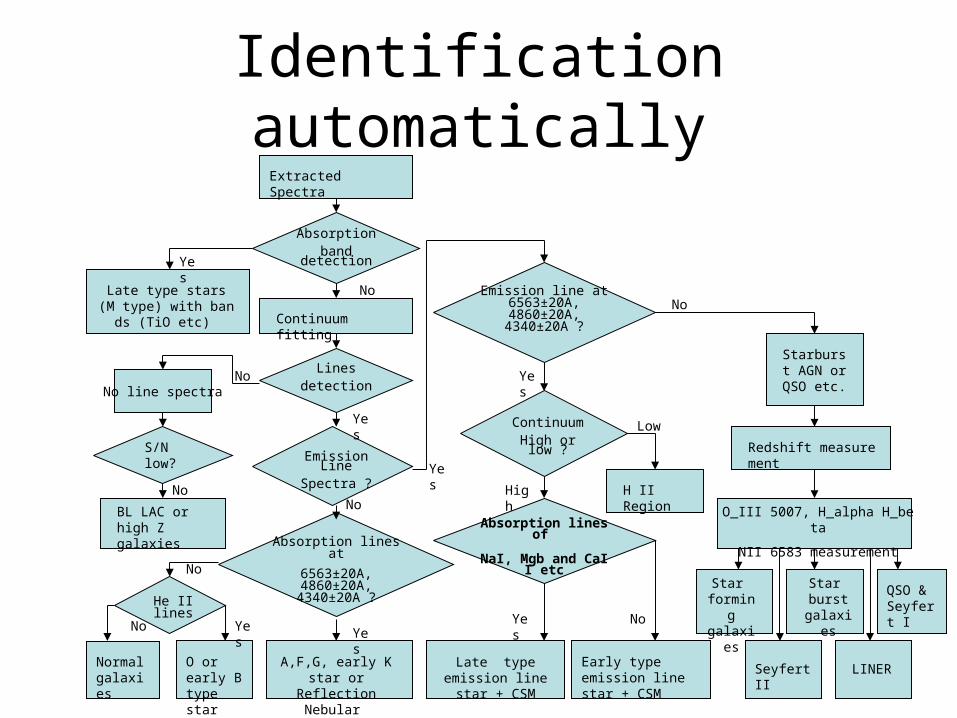
Identification automaticallyExtracted Spectra
Late type stars (M type) with bands (TiO etc)
Normal galaxies
Absorptionband detection
Linesdetection
Emission LineSpectra ?
Absorption lines at
6563±20A, 4860±20A, 4340±20A ?
He II lines
Continuum fitting
Emission line at 6563±20A, 4860±20A,
4340±20A ?
ContinuumHigh or low ?
Absorption lines of
NaI, Mgb and CaII etc
O_III 5007, H_alpha H_beta
NII 6583 measurement
Star forming galaxies
Star burst
galaxies
QSO & Seyfert I
Seyfert II LINEREarly type emission line star + CSM
O or early B type star
A,F,G, early K star or Reflection Nebular
Late type emission line star + CSM
Redshift measurement
Starburst AGN or QSO etc.
NoYes
H II Region
No
Low
High
Yes
Yes
No
No Yes Yes
No line spectraNo
Yes
S/N low?
No
BL LAC or high Z galaxies
No
No
Yes
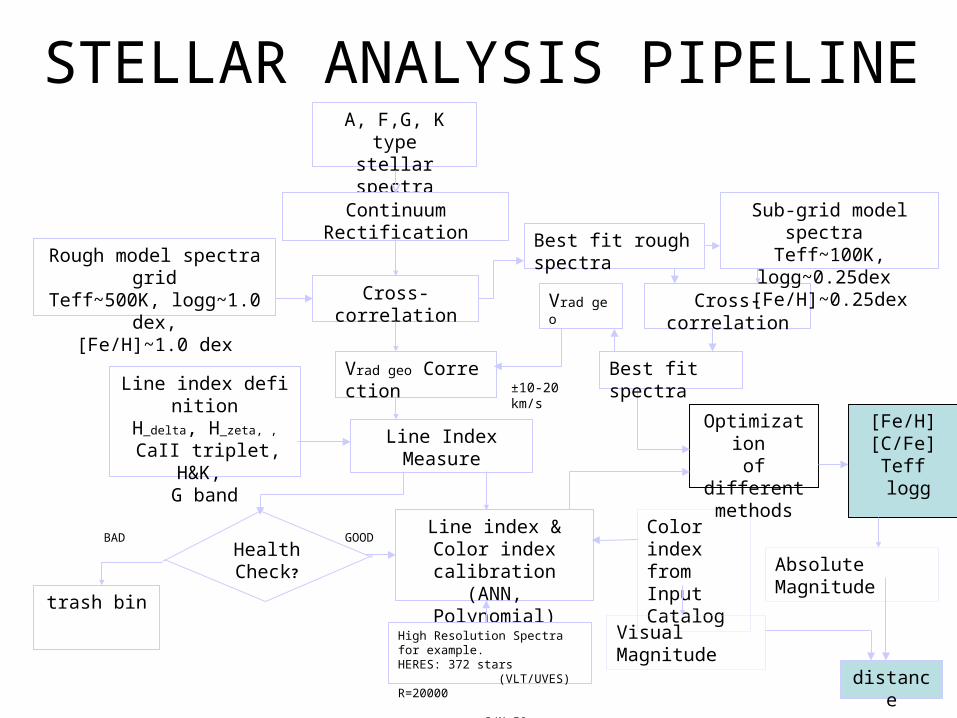
STELLAR ANALYSIS PIPELINE
GOODBAD
A, F,G, K typestellar spectra
Continuum Rectification
Cross-correlation
Vrad geo Correction
Vrad geo
Line Index Measure
Line index definitionH_delta, H_zeta, ,
CaII triplet, H&K, G band
trash bin
Health Check?
Line index & Color index calibration
(ANN, Polynomial)
High Resolution Spectra for example.HERES: 372 stars (VLT/UVES) R=20000 S/N=50
±10-20 km/s
Color index from Input Catalog
Rough model spectra gridTeff~500K, logg~1.0dex,
[Fe/H]~1.0 dex
Best fit rough spectra
[Fe/H][C/Fe]Teff logg
distance
Optimization of different
methods
Cross-correlation
Best fit spectra
Visual Magnitude
Absolute Magnitude
Sub-grid model spectra Teff~100K, logg~0.25dex
[Fe/H]~0.25dex
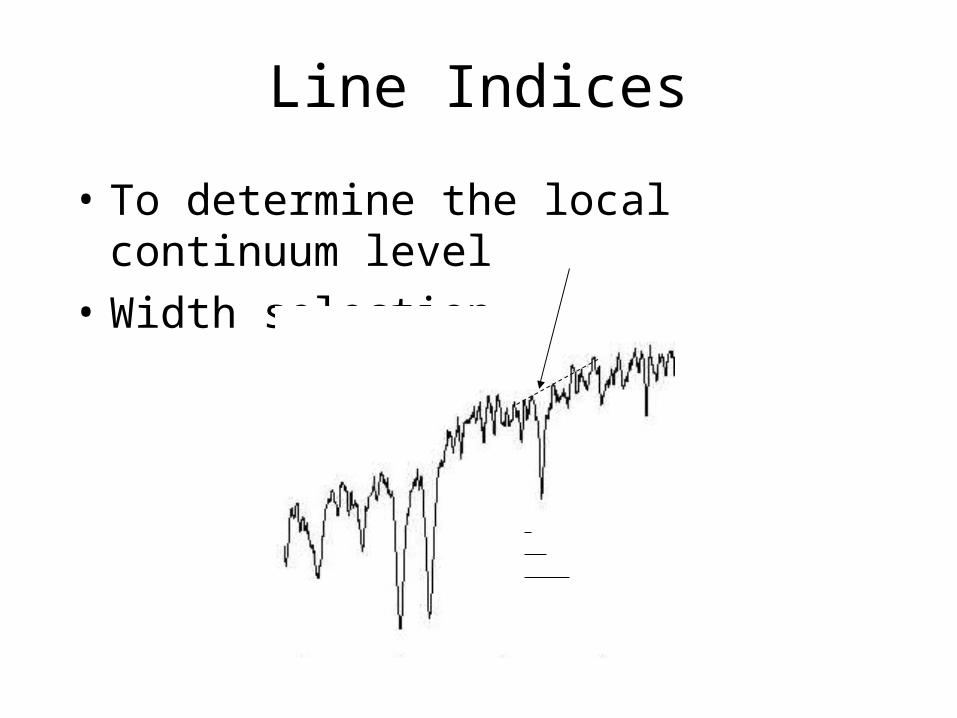
Line Indices
• To determine the local continuum level
• Width selection
Some lines used in the pipeline
• CaII K line (3933A)
• Balmer lines
• CaII triplet
• Mg I b
• G band and [C/Fe]
• Colors
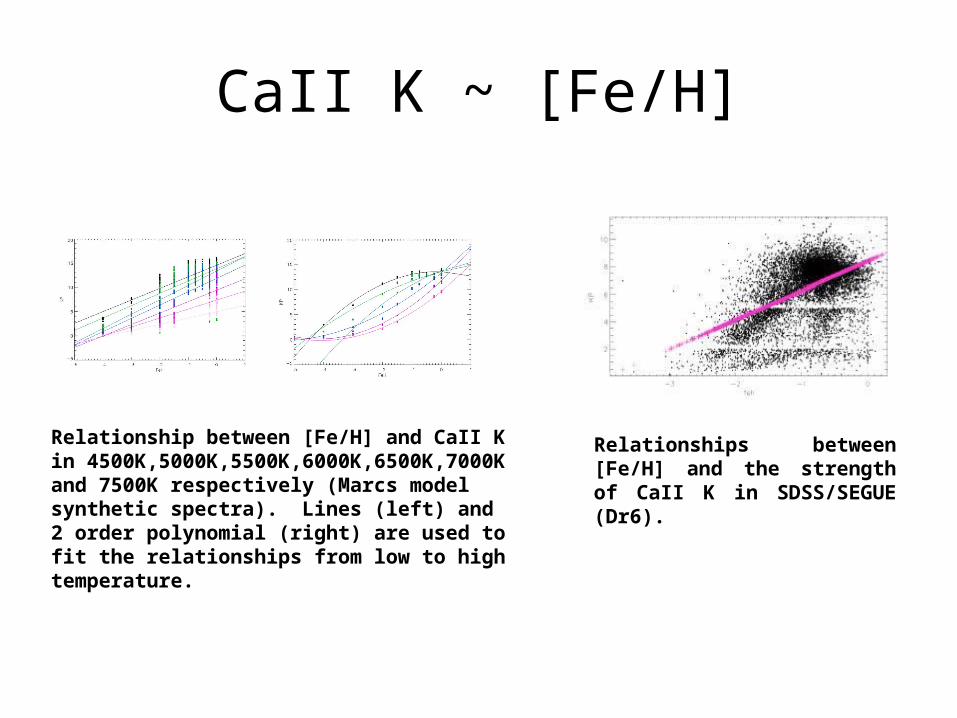
CaII K ~ [Fe/H]
Relationship between [Fe/H] and CaII K in 4500K,5000K,5500K,6000K,6500K,7000K and 7500K respectively (Marcs model synthetic spectra). Lines (left) and 2 order polynomial (right) are used to fit the relationships from low to high temperature.
Relationships between [Fe/H] and the strength of CaII K in SDSS/SEGUE (Dr6).
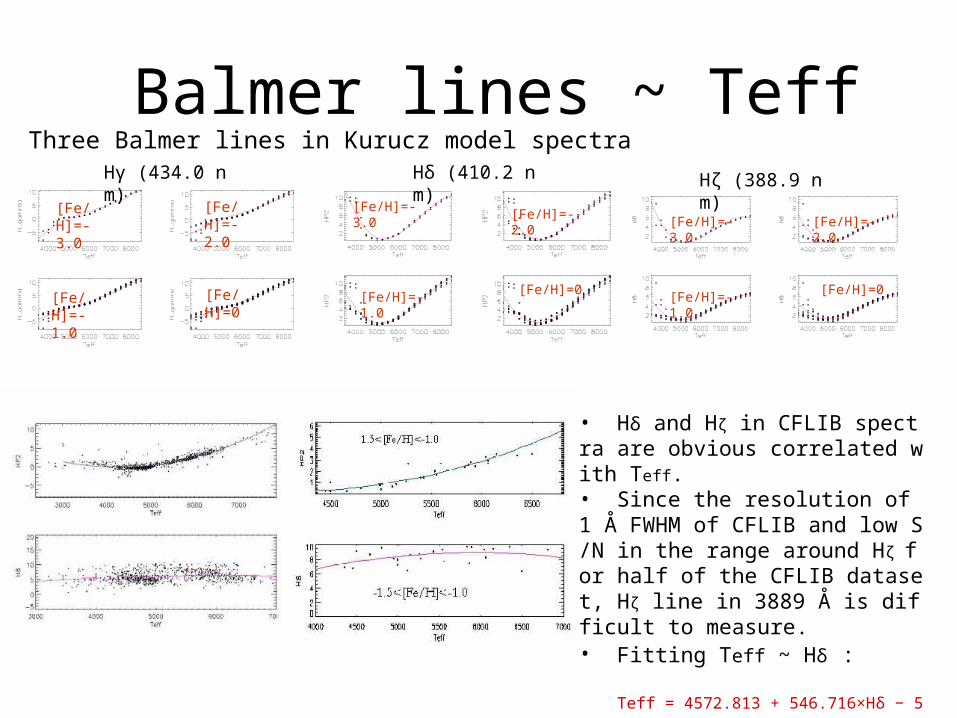
Balmer lines ~ Teff
[Fe/H]=-3.0
[Fe/H]=-2.0
[Fe/H]=-1.0
[Fe/H]=0
[Fe/H]=-2.0[Fe/H]=-3.0
[Fe/H]=-1.0[Fe/H]=0
Hγ (434.0 nm) Hδ (410.2 nm) Hζ (388.9 nm)[Fe/H]=-3.0
[Fe/H]=-2.0
[Fe/H]=0[Fe/H]=-1.0
Three Balmer lines in Kurucz model spectra
• Hδ and Hζ in CFLIB spectra are obvious correlated with Teff. • Since the resolution of 1 Å FWHM of CFLIB and low S/N in the range around Hζ for half of the CFLIB dataset, Hζ line in 3889 Å is difficult to measure. • Fitting Teff ~ Hδ : Teff = 4572.813 + 546.716×Hδ − 53.773×Hδ2
error:100-200K
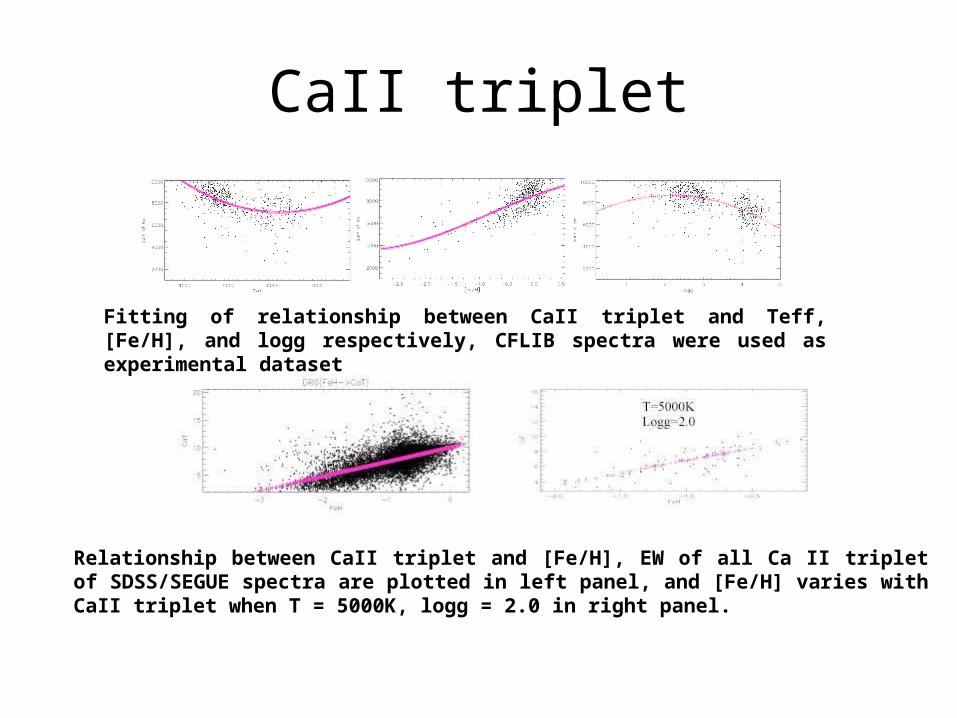
CaII triplet
Fitting of relationship between CaII triplet and Teff, [Fe/H], and logg respectively, CFLIB spectra were used as experimental dataset
Relationship between CaII triplet and [Fe/H], EW of all Ca II triplet of SDSS/SEGUE spectra are plotted in left panel, and [Fe/H] varies with CaII triplet when T = 5000K, logg = 2.0 in right panel.
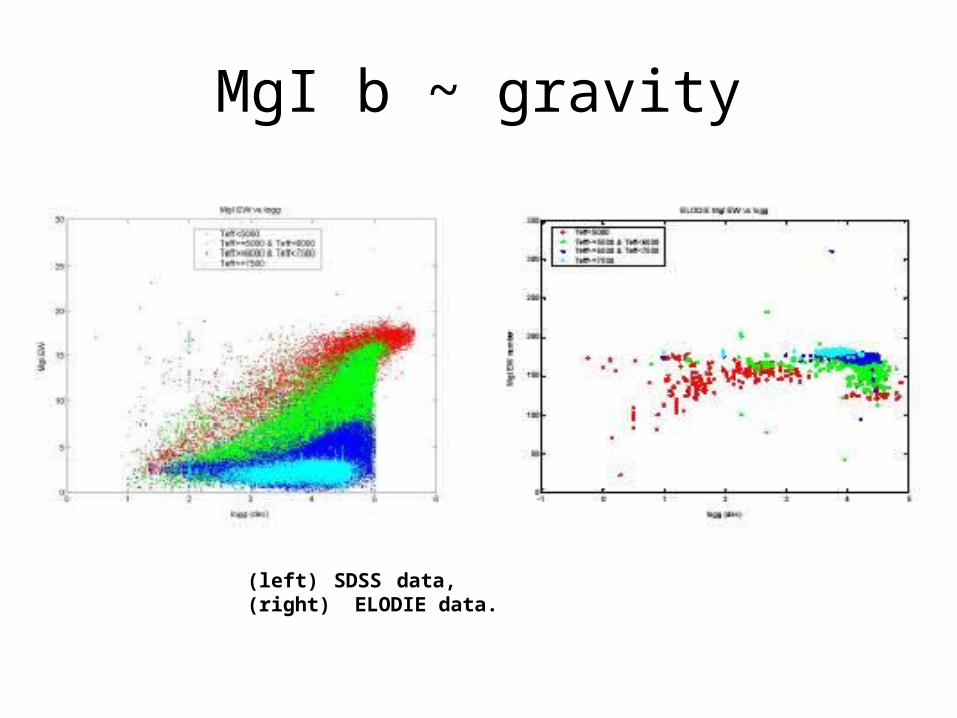
MgI b ~ gravity
(left) SDSS data, (right) ELODIE data.
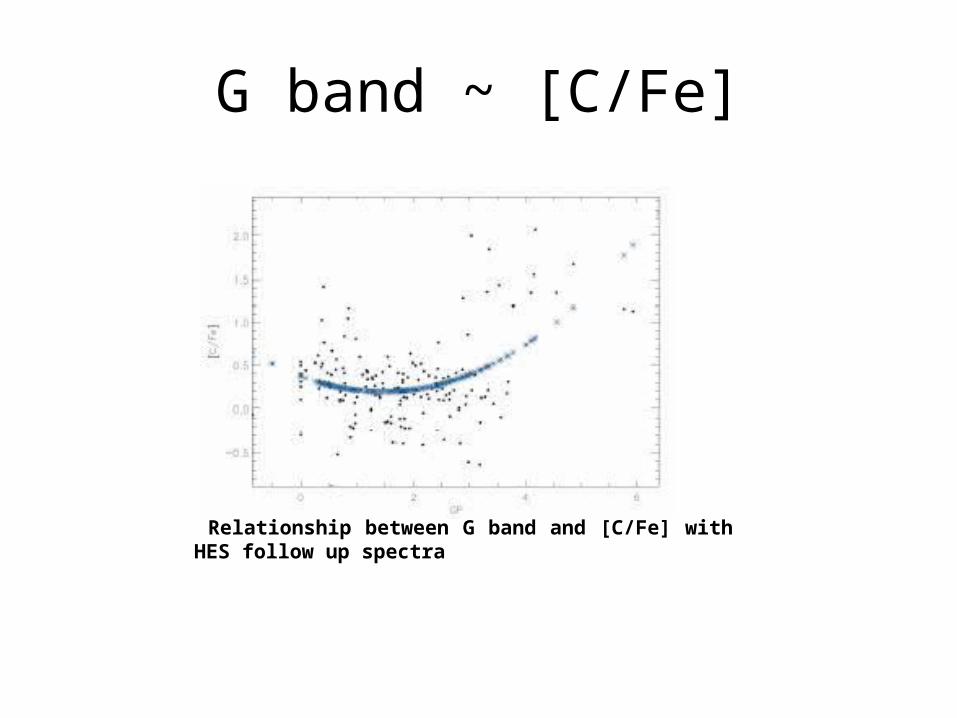
G band ~ [C/Fe]
Relationship between G band and [C/Fe] with HES follow up spectra
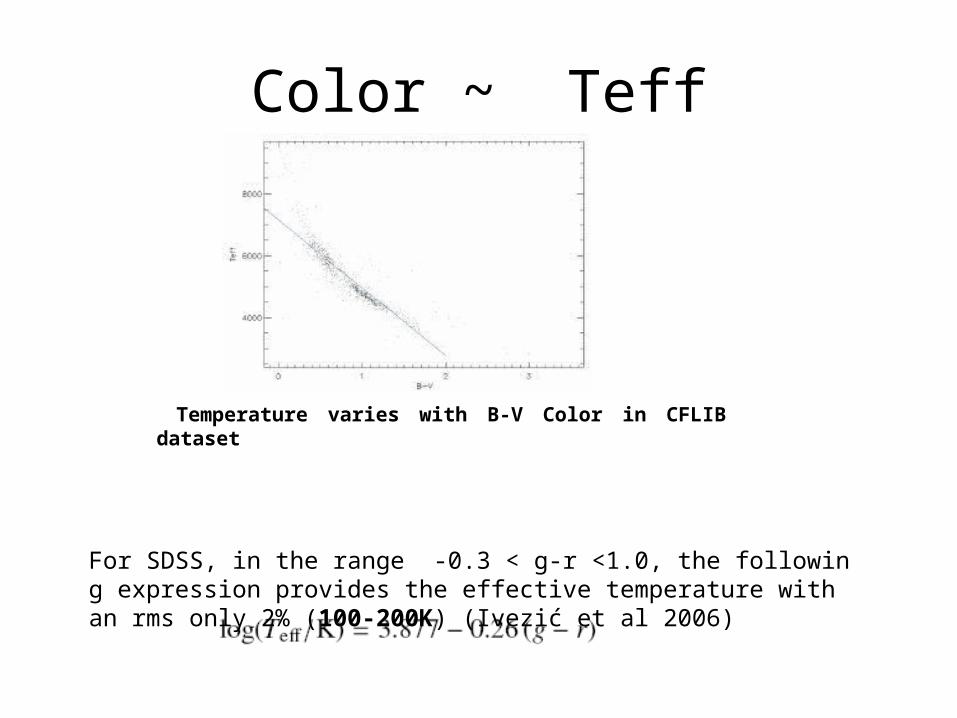
Color ~ Teff
Temperature varies with B-V Color in CFLIB dataset
For SDSS, in the range -0.3 < g-r <1.0, the following expression provides the effective temperature with an rms only 2% (100-200K) (Ivezić et al 2006)
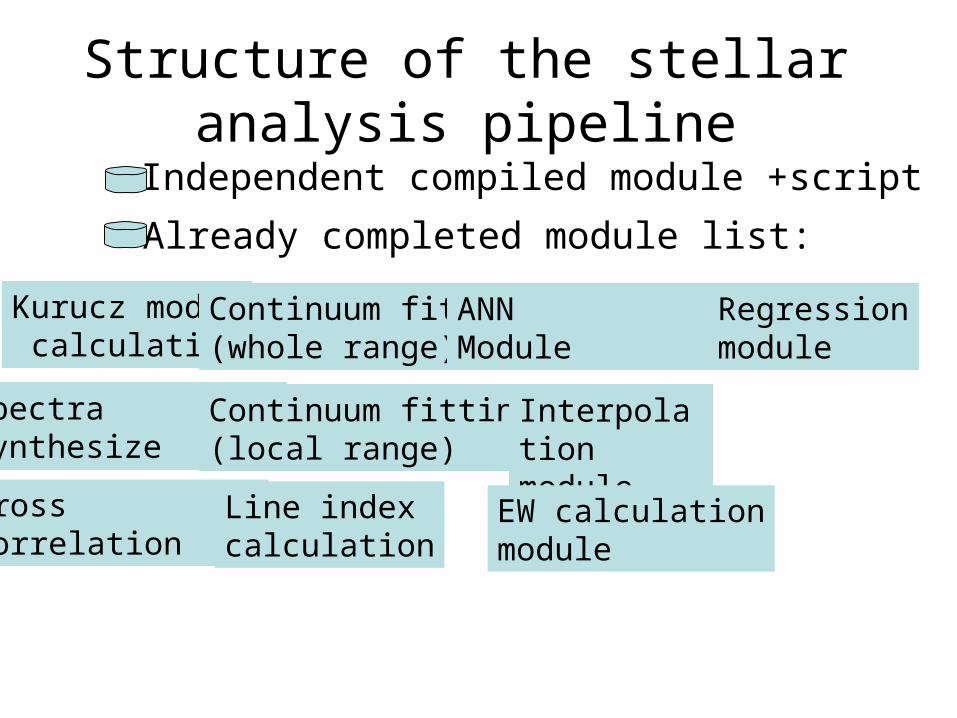
Structure of the stellar analysis pipeline
Independent compiled module +script
Already completed module list:
Kurucz model calculation
Continuum fitting(whole range)
ANN Module
Regressionmodule
Spectra synthesize
Continuum fitting(local range)
Interpolationmodule
Cross correlation
Line indexcalculation
EW calculationmodule
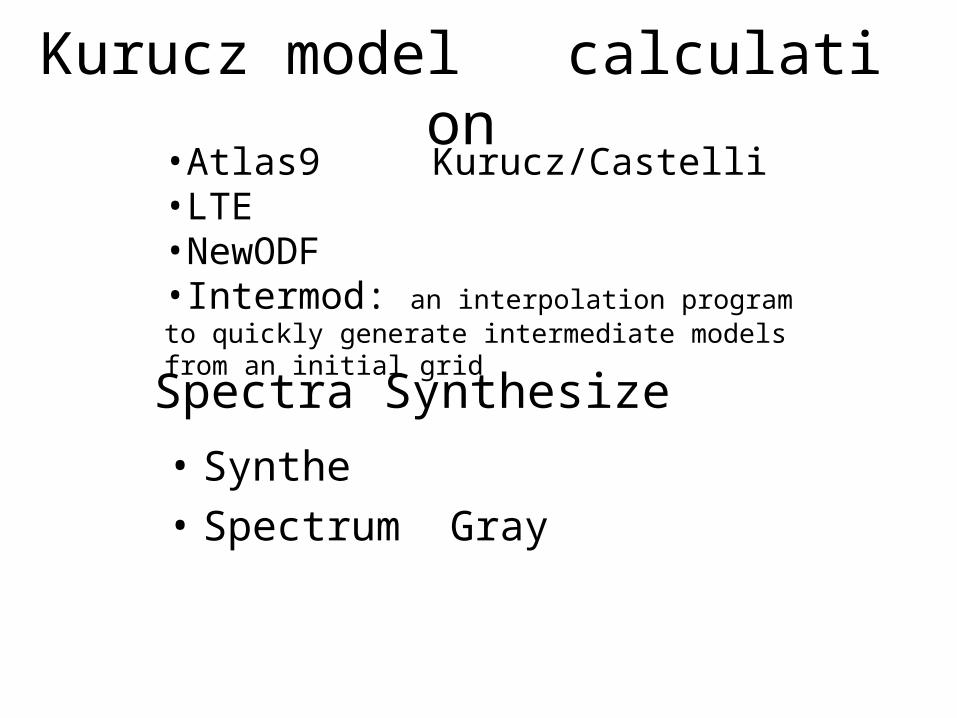
Kurucz model calculation•Atlas9 Kurucz/Castelli •LTE •NewODF•Intermod: an interpolation program to quickly generate intermediate models from an initial grid
Spectra Synthesize
• Synthe
• Spectrum Gray
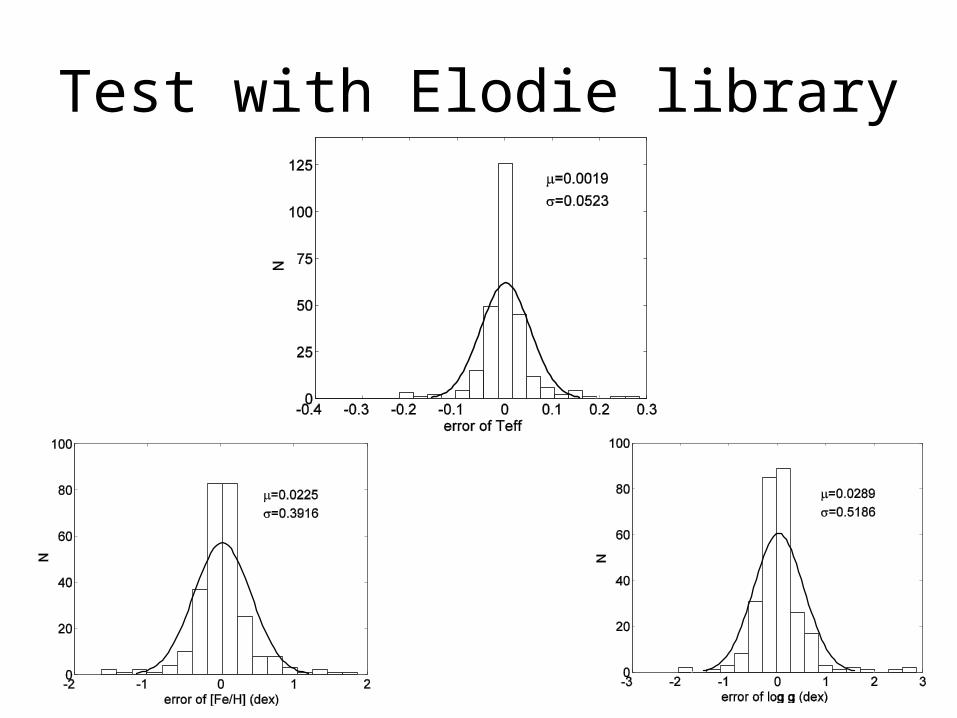
Test with Elodie library
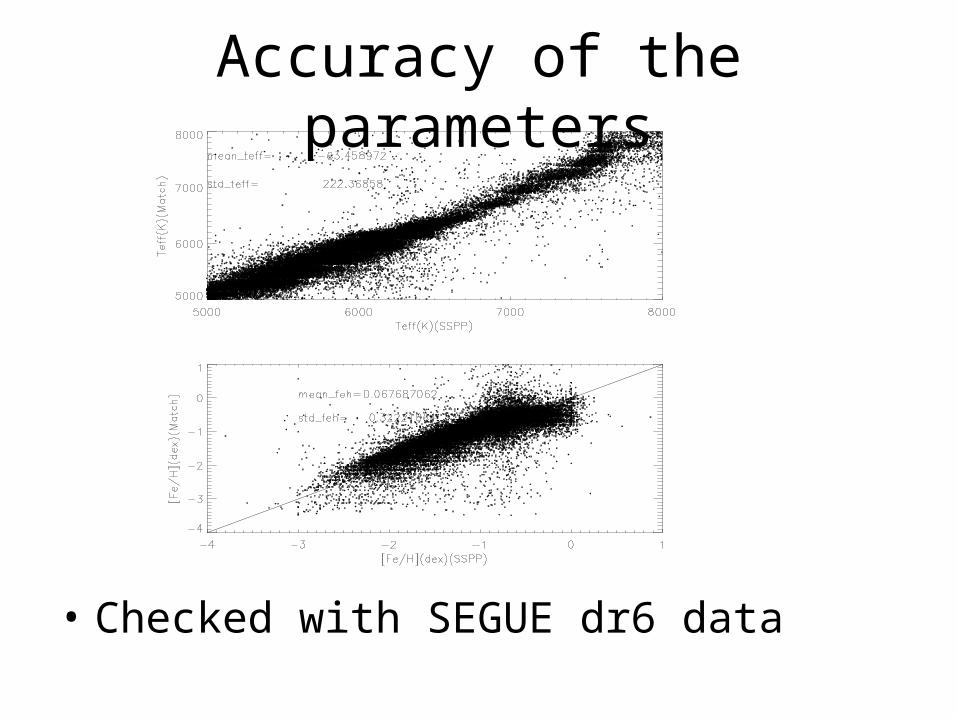
Accuracy of the parameters
• Checked with SEGUE dr6 data
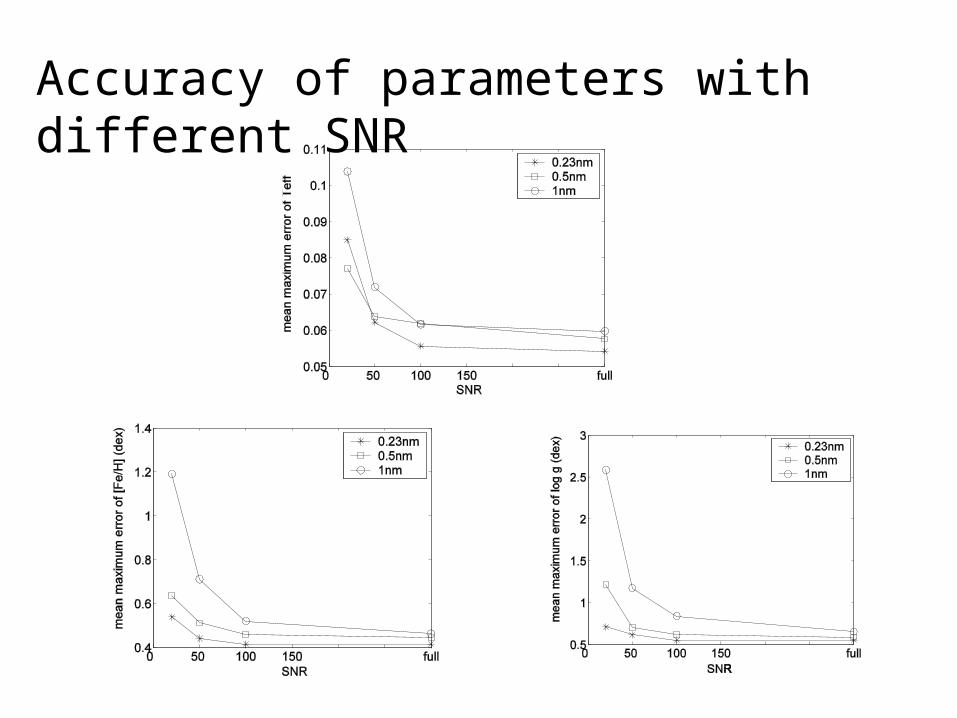
Accuracy of parameters with different SNR

Thanks !