Embed Size (px)
Citation preview
CPD9, 2059–2094, 2013
The last 7 millenniaof vegetation andclimate changes
L. Sadori et al.
Title Page
Abstract Introduction
Conclusions References
Tables Figures
J I
J I
Back Close
Full Screen / Esc
Printer-friendly Version
Interactive Discussion
Discussion
Paper
|D
iscussionP
aper|
Discussion
Paper
|D
iscussionP
aper|
Clim. Past Discuss., 9, 2059–2094, 2013www.clim-past-discuss.net/9/2059/2013/doi:10.5194/cpd-9-2059-2013© Author(s) 2013. CC Attribution 3.0 License.
EGU Journal Logos (RGB)
Advances in Geosciences
Open A
ccess
Natural Hazards and Earth System
Sciences
Open A
ccess
Annales Geophysicae
Open A
ccess
Nonlinear Processes in Geophysics
Open A
ccess
Atmospheric Chemistry
and Physics
Open A
ccess
Atmospheric Chemistry
and Physics
Open A
ccess
Discussions
Atmospheric Measurement
Techniques
Open A
ccess
Atmospheric Measurement
Techniques
Open A
ccess
Discussions
Biogeosciences
Open A
ccess
Open A
ccess
BiogeosciencesDiscussions
Climate of the Past
Open A
ccess
Open A
ccess
Climate of the Past
Discussions
Earth System Dynamics
Open A
ccess
Open A
ccess
Earth System Dynamics
Discussions
GeoscientificInstrumentation
Methods andData Systems
Open A
ccess
GeoscientificInstrumentation
Methods andData Systems
Open A
ccess
Discussions
GeoscientificModel Development
Open A
ccess
Open A
ccessGeoscientific
Model DevelopmentDiscussions
Hydrology and Earth System
Sciences
Open A
ccess
Hydrology and Earth System
Sciences
Open A
ccess
Discussions
Ocean Science
Open A
ccess
Open A
ccess
Ocean ScienceDiscussions
Solid EarthO
pen Access
Open A
ccess
Solid EarthDiscussions
The Cryosphere
Open A
ccess
Open A
ccess
The CryosphereDiscussions
Natural Hazards and Earth System
Sciences
Open A
ccess
Discussions
This discussion paper is/has been under review for the journal Climate of the Past (CP).Please refer to the corresponding final paper in CP if available.
The last 7 millennia of vegetation andclimate changes at Lago di Pergusa(central Sicily, Italy)L. Sadori1, E. Ortu2, O. Peyron2,3, G. Zanchetta4, B. Vanniere2, M. Desmet5, andM. Magny2
1Dipartimento di Biologia Ambientale, Universita di Roma “La Sapienza”,Piazzale Aldo Moro 5, 00185 Roma, Italy2UMR CNRS 6249 Laboratoire Chrono-Environnement, 16 route de Gray,25030 Besancon cedex, France3CBAE, UMR 5059 CNRS, Univ. Montpellier 2, Montpellier, France4Dipartimento di Scienze della Terra, Via S. Maria 53, 56126 Pisa, Italy5EA 6293 GeHCO, Universite de Tours, 37000 Tours, France
Received: 23 March 2013 – Accepted: 26 March 2013 – Published: 8 April 2013
Correspondence to: L. Sadori ([email protected])
Published by Copernicus Publications on behalf of the European Geosciences Union.
2059
CPD9, 2059–2094, 2013
The last 7 millenniaof vegetation andclimate changes
L. Sadori et al.
Title Page
Abstract Introduction
Conclusions References
Tables Figures
J I
J I
Back Close
Full Screen / Esc
Printer-friendly Version
Interactive Discussion
Discussion
Paper
|D
iscussionP
aper|
Discussion
Paper
|D
iscussionP
aper|
Abstract
The aim of this study is to investigate climate changes and human activities under thelens of palynology. Based on a new high-resolution pollen sequence (PG2) from Lagodi Pergusa (667 m a.s.l., central Sicily, Italy) covering the last 6700 yr, we propose areconstruction of climate and landscape changes over the recent past in central Sicily.5
Compared to former studies from Lago di Pergusa (Sadori and Narcisi, 2001), thiswork provides a reconstruction of the evolution of vegetation and climate over the lastmillennia in central Sicily, indeed completing previous results with new data which isparticularly detailed on the last 3000 yr.
Joint actions of increasing dryness, climate oscillations, and human impact shaped10
the landscape of this privileged site. Lago di Pergusa, in fact, besides being the maininland lake of Sicily, is very sensitive to climate change and its territory was inhabitedand exploited continuously since the prehistory. The lake sediments turned out to be agood observatory for the natural phenomena occurred in the last thousands of years.
Results of the pollen-based study are integrated with changes in magnetic suscepti-15
bility and a tephra layer characterization. The tephra layer was shown to be related tothe Sicanians’ event, radiocarbon dated at 3055±75 yr BP (Sadori and Narcisi, 2001).
We performed palaeoclimate reconstructions by MAT and WA-PLS. Palaeoclimatereconstructions based on the core show important climate fluctuations throughout theHolocene. Climate reconstruction points out four phases of cooling and enhanced wet-20
ness in the last three millennia (2600–2000, 1650–1100, 850–550, 400–200 cal BP).This appears to be the evidence of local responses to global climate oscillations duringthe recent past.
1 Introduction
In the present-day debate, concerning possible effects of the on-going climate change,25
the understanding of biological responses to past climate variations assumes a great
2060
CPD9, 2059–2094, 2013
The last 7 millenniaof vegetation andclimate changes
L. Sadori et al.
Title Page
Abstract Introduction
Conclusions References
Tables Figures
J I
J I
Back Close
Full Screen / Esc
Printer-friendly Version
Interactive Discussion
Discussion
Paper
|D
iscussionP
aper|
Discussion
Paper
|D
iscussionP
aper|
interest. Open questions remain on local responses to global climate changes duringthe recent past and possible evolution under future climate forcing (IPCC, 2007; Giorgiand Lionello, 2008). Palaeoclimate reconstruction gives a basis for predicting and lim-iting the effects of global warming on local vegetation and climate in highly sensitiveareas.5
Although the high interest for the understanding of climatic and environmental evo-lution under Mediterranean conditions, due to the scarcity of sites suitable for palaeoe-cological analyses there are only a few works that retrace the vegetation and climatehistory of south-central Mediterranean. Besides, they underline an important spatialvariability of landscapes and local responses to climate changes (de Beaulieu et al.,10
2005; Carrion et al., 2010a, b; Magny et al., 2012). In this context, understanding re-sponses to climate changes in Sicily, the largest Mediterranean island, is particularlyinteresting, as its central geographic position in the Mediterranean Basin makes it akey region for the understanding of Holocene climates and environments. Importantand expected differences are found in Sicily itself, in particular, between the inland and15
the coast (Noti et al., 2009; Sadori and Narcisi, 2001; Tinner et al., 2009). Sicily wasinhabited since the Palaeolithic and interactions between climate changes and humanactivities have to be expected. It is clear that in such sites a close relationship betweenhumans and their environment exists, but the way individuals or groups adapt to orimpact on their environment (or do both) must be considered on a different scientific20
base, case by case (Mercuri et al., 2011; Sadori et al., 2010).In particular, Lago di Pergusa is, both for geographic location and human history, in
a crucial and privileged position to study the landscape changes occurred since pre-history.
This peculiarity is mainly due to the strong seasonality and the heterogeneity of its25
climate (Zampino et al., 1997), the high rate of biodiversity and endemism (Brullo etal., 1995, 1996; Di Pasquale et al., 1992; Quezel et al., 1993), the long human history(Bernabo Brea, 1961) and the progressive aridification of last millenaries recorded in
2061
CPD9, 2059–2094, 2013
The last 7 millenniaof vegetation andclimate changes
L. Sadori et al.
Title Page
Abstract Introduction
Conclusions References
Tables Figures
J I
J I
Back Close
Full Screen / Esc
Printer-friendly Version
Interactive Discussion
Discussion
Paper
|D
iscussionP
aper|
Discussion
Paper
|D
iscussionP
aper|
former studies (e.g. Frisia et al., 2006; Magny et al., 2011, 2012; Perez-Obiol andSadori, 2007; Sadori and Narcisi, 2001).
2 Study area
Lago di Pergusa is located in central Sicily, Southern Italy (37◦31′ N, 14◦18′ E), at667 m a.s.l. (Fig. 1a). The study site features were already described (Sadori and Nar-5
cisi, 2001 and therein references) and are hereafter summarized. The lake (surfacearea 0.5 km2, catchment ca. 7.5 km2) occupies an endorheic basin with catchmentcomposed by Pliocene marine (sandstone, claystone) deposits, solely fed by rainfalland groundwaters and has experienced strong lake-level variations imputed to evap-otranspiration. This phenomenon made it very sensitive to seasonal and long-term10
climatic variations. At present the lake level surface is controlled.Climate in the area of Pergusa is cooler and moister than along the coasts, with
annual precipitation between 500–700 mm and mean annual temperature of 13.4 ◦C(Enna weather station). Archive data from three meteorological stations show that pre-cipitation decreased during the second half of last century. The lake is particularly15
vulnerable to climate changes, lying at present at the border of three areas with dif-ferent aridity indices (Fig. 1b, Duro et al., 1997). The lacustrine vegetation (Fig. 1c,Calvo et al., 1995) before the water body regulation of last years, consisted in severalconcentric belts: an external belt (Fig. 1c, a), some meters wide, of almost only Phrag-mites australis (Cav.) Trin., an inner discontinuous belt (Fig. 1c, b) of halophilous plants20
characterized by Juncus maritimus Lam., and an internal ephemeral zone directly de-pending on the lake-level fluctuations and constituted by halophilous and seasonalplant communities (c, d, and e belts), mainly characterized by chenopods as Atriplexlatifolia Wahlenb. (belt c), Suaeda maritima (L.) Dumort. (belt d) and Salicornia pat-ula Duval-Jouve and many nytrophilous Asteraceae, both Asteroideae and Cichori-25
oideae (belt e).The lake is at present surrounded by open landscapes dominated byxerophytic grasslands (Pignatti, 1994) and crop cultures, often abandoned. The only
2062
CPD9, 2059–2094, 2013
The last 7 millenniaof vegetation andclimate changes
L. Sadori et al.
Title Page
Abstract Introduction
Conclusions References
Tables Figures
J I
J I
Back Close
Full Screen / Esc
Printer-friendly Version
Interactive Discussion
Discussion
Paper
|D
iscussionP
aper|
Discussion
Paper
|D
iscussionP
aper|
traces of natural vegetation are represented by rare trees of Quercus virgiliana (Ten.)Ten., Quercus ilex L., Quercus pubescens Willd., Quercus suber L. and Rhamnusalaternus L.
Human activity is documented in central Sicily since the Palaeolithic Age (Tusa,1992). Traces from the Eneolithic Age, besides others, are found in the nearby site5
of Cozzo Matrice, located on a hill at the edge of the catchment of the lake and activealso during Greek times (Touring Club Italiano, 1989). In the close surroundings of thelake (Fig. 1d) the Bronze and Iron Age periods are well documented (Bernabo Brea,1961; Giannitrapani and Pluciennik, 1999; Tusa, 1992). Diodorus Siculus (Library ofHistory, V, 6, 2–4) reported that the area of Pergusa around 3000 yr ago was first set-10
tled by Sicanians, then by Siculis. Greeks, Siracusans and Carthaginians alternated inthe territory. Under the Romans, Enna (Castrum Hennae) became a rich and importantcentre for wheat trade and remained so also under the Byzantines and the Arabs.
3 Methods
3.1 The sediment core15
A 6.26 m long sediment record (composed core PG2) was retrieved from Lago di Per-gusa (Fig. 1a) in 2006 with a UWITEC coring platform with a percussion piston coringtechnique. Particular care was paid to recover and store the top decimetres with a grav-ity corer. Twin cores were retrieved, and segments were extracted and stored at 4 ◦C atthe University of Franche-Comte (France).20
Magnetic susceptibility (MS) was measured in the cores at 5 mm resolution witha Geotek multi-sensor core logger (Gunn and Best, 1998). MS was measured onsplit cores with the MS2E1 surface-scanning sensor from Bartington Instruments,which was adapted for fine-resolution volume magnetic-susceptibility measurements(Vanniere et al., 2004). These analyses allow us to establish stratigraphic correlations25
2063
CPD9, 2059–2094, 2013
The last 7 millenniaof vegetation andclimate changes
L. Sadori et al.
Title Page
Abstract Introduction
Conclusions References
Tables Figures
J I
J I
Back Close
Full Screen / Esc
Printer-friendly Version
Interactive Discussion
Discussion
Paper
|D
iscussionP
aper|
Discussion
Paper
|D
iscussionP
aper|
useful for constructing the master sequences (PG2), guaranteeing complete recordswithout any gaps or redundancies.
3.2 Dating
Plant macrofossils were not visible to the naked eye, so several sediment sampleswere processed to find plant macroremains suitable to be radiocarbon dated. Four5
plant samples (two seed samples ascribed to Scirpus sp. and two wood fragments)have been selected for AMS radiocarbon analysis.
A tephra layer, highlighted by magnetic susceptibility, was morphologically and geo-chemically analyzed. The sediment was washed, filtered, dried and then embeddedin epoxy resin and screened for glass shards fragments using scanning electron mi-10
croscopy (SEM). Energy-dispersive-spectrometry (EDS) analyses of glass shards andscoriae fragments were performed using an EDAX-DX micro-analyser mounted on aPhilips SEM 515 at the Dipartimento di Scienze della Terra, University of Pisa, em-ploying a 20 kV acceleration voltage, 100 s live time counting, 2100–2400 shots persecond, and ZAF correction. To avoid alkali loss, especially Na, a window spot was15
used (usually with side ca. 10 µm). Performance of the instrument is extensively dis-cussed elsewhere, especially in comparison with wave dispersion spectroscopy (Caronet al., 2010; Cioni et al., 1997; Marianelli and Sbrana, 1998; Sulpizio et al., 2010; Vogelet al., 2009), indicating comparable performances on major elements, and will not bediscussed further. To perfectly compare our data with those obtained by Sadori and20
Narcisi (2001), the tephra layer found in core PRG1 was re-sampled and re-analyzed.
3.3 Pollen analysis
Pollen extraction from the sediment samples followed Goeury and de Beaulieu (1979).300 terrestrial pollen grains were counted on average under a transmitted light mi-croscope at a magnification of 400X. Pollen grain identification was based on pho-25
tographs (Reille, 1992, 1995, 1998) and on the reference collection of Laboratoire
2064
CPD9, 2059–2094, 2013
The last 7 millenniaof vegetation andclimate changes
L. Sadori et al.
Title Page
Abstract Introduction
Conclusions References
Tables Figures
J I
J I
Back Close
Full Screen / Esc
Printer-friendly Version
Interactive Discussion
Discussion
Paper
|D
iscussionP
aper|
Discussion
Paper
|D
iscussionP
aper|
Chrono-Environnement (Franche-Comte University, France). Pollen percentages werecalculated on the basis of total arboreal and non-arboreal terrestrial pollen grains.
3.4 Climate reconstruction
Climate reconstructions inferred from pollen data are based on two different ap-proaches: the modern analogue technique “MAT” (Guiot, 1990), based on a compari-5
son of past assemblages to modern pollen assemblages, and the weighted average-partial least square method “WA-PLS” developed by ter Braak and Juggins (1993)which requires a real statistical calibration. The MAT has been used in a number ofstudies focusing Mediterranean regions (e.g. Desprat et al., 2013; Peyron et al., 2011,2012; Pross et al., 2009) and the WA-PLS has recently been successfully tested in10
Mediterranean regions (Finsinger et al., 2010; Peyron et al., 2012), showing its reliabil-ity in linking modern pollen data to climate in the Italian area (Finsinger et al., 2007).More details on these two methods are given in Peyron et al. (2012). For the MATand the WAPLS, we use the modern pollen dataset developed by Dormoy et al. (2009)restricted to the Mediterranean area (longitude: −10 to 40◦, latitude: 30 to 45◦) and con-15
taining 1146 samples. The number of selected analogues was 8 (MAT) and the numberof components taken was 2 (WA-PLS), based on the results of the cross-validations(leave-one-out and bootstrap). As another validation test, we have distinguished twodistinct subsets in the modern pollen database by applying a random samples selec-tion. This step produced two modern datasets, each containing 573 samples that were20
used respectively for the training and the validation of transfer functions based on WA-PLS and MAT methods. Statistical processing and transfer functions were performedusing R, especially packages “rioja” (http://www.r-project.org/) and “bioindic” (CEREGEWebsite).
2065
CPD9, 2059–2094, 2013
The last 7 millenniaof vegetation andclimate changes
L. Sadori et al.
Title Page
Abstract Introduction
Conclusions References
Tables Figures
J I
J I
Back Close
Full Screen / Esc
Printer-friendly Version
Interactive Discussion
Discussion
Paper
|D
iscussionP
aper|
Discussion
Paper
|D
iscussionP
aper|
4 Results
4.1 The core and its chronology
Visual core description was carried out. From bottom core to 310 cm the sedimentconsists of olive grey to brownish mottled silty clay. The upper part of the core is com-posed of greyish silty clay and dark to very dark silty clay alternating with silty and5
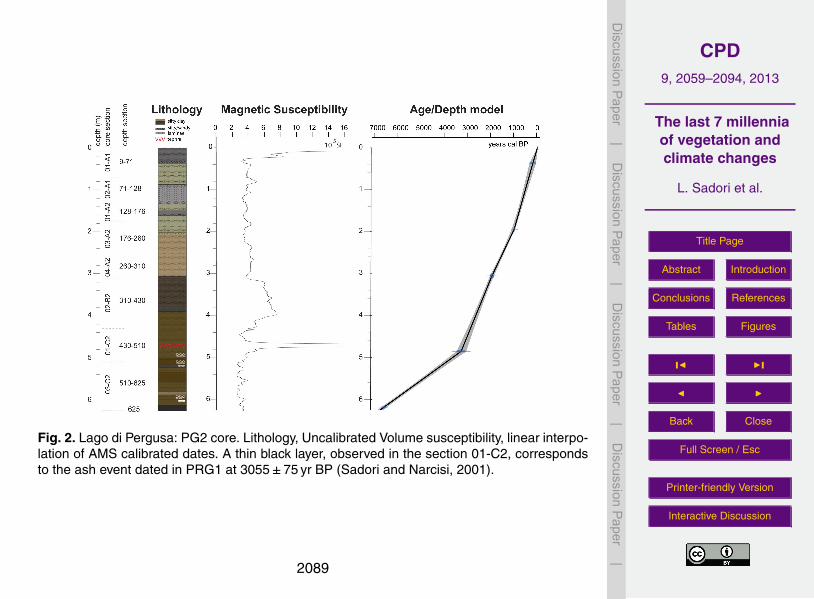
sandy laminae. Some gradational contacts have been identified. Oxydised spots andvery dark levels are present. Bioturbation and shell fragments occur at the bottom ofthe core. Variations in the sediment density were also highlighted by magnetic sus-ceptibility analyses (Fig. 2). The magnetic susceptibility trend shows the presence ofashes dispersed in less than 10 cm of sediment of the composite core (between 46510
and 475 cm), corresponding to the tephra between 47–53 cm in the core section 01-C2.In correspondence with the ashes, magnetic susceptibility peaks at 53 (the mean SI ofthe record is 2.9). The tephra comprises principally dark, brown, blocky fragments. Twotypes of fragments can be distinguished: the rarest, is characterized by a few spheri-cal or ovoid vesicles and a prevailing glassy matrix, whereas the most common type15
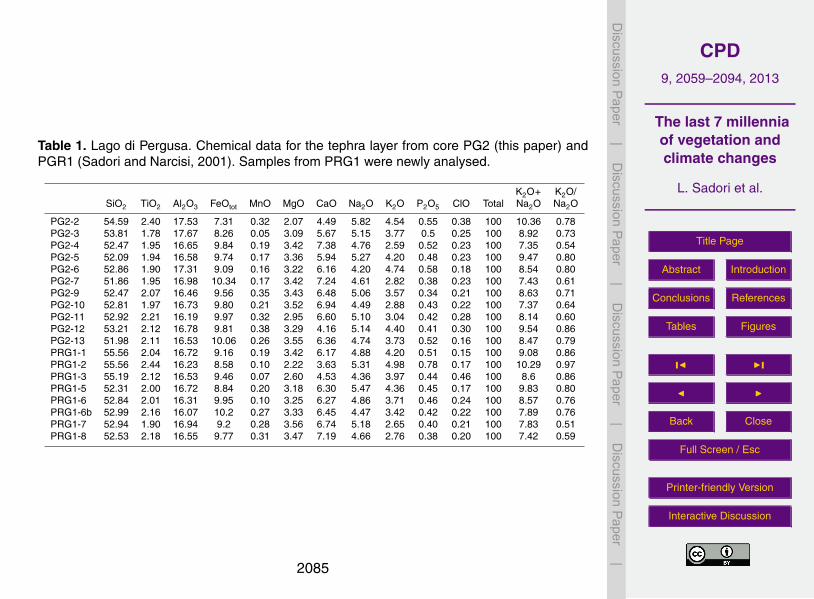
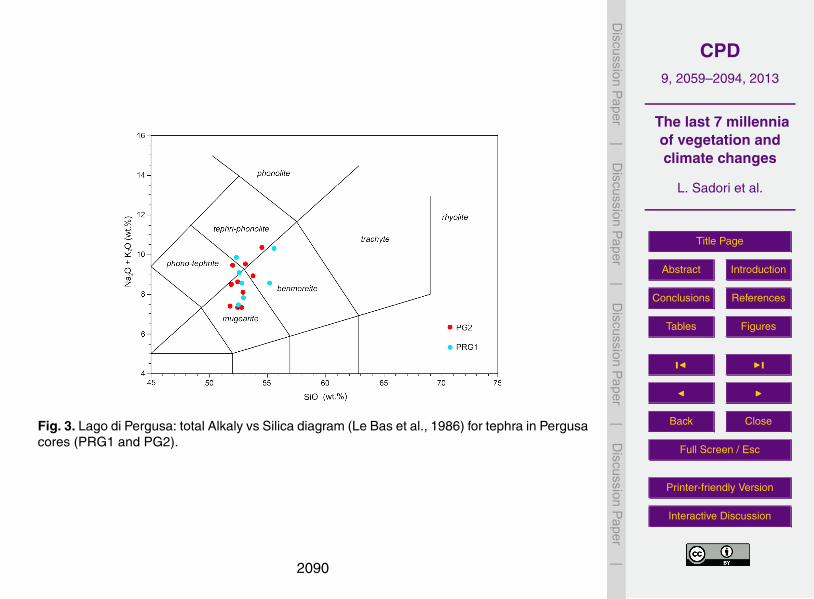
is characterized by a crystalline groundmass mostly composed by plagioclase, and toa lesser extent by pyroxene and rarely by olivine. Ti-Fe oxides are also present. Inthis second type, glass is usually interstitial or can be absent. This makes the analy-ses particularly complex, producing a dispersion of chemical data of the glassy matrix(Table 1). Compositionally, a single-shard ranges principally from mugeritic and ben-20
moreitic field, partially straddling the photephritic compositions.The tephra characteristics and its chemical composition perfectly match with those
determined by Sadori and Narcisi (2001), and particularly with the new set of dataproduced for comparison (Fig. 3, Table 1). As extensively discussed by Sadori andNarcisi (2001) the features of the tephra at Lago di Pergusa are similar to that from25
the Etna Volcano eruption, which was strong enough to make ashes reach the Balkans(Sulpizio et al., 2010; Wagner et al., 2008), and which was dated to 3150±60 yr BP byradiocarbon on charred material from the top of the eruption (Coltelli et al., 2000). In
2066
CPD9, 2059–2094, 2013
The last 7 millenniaof vegetation andclimate changes
L. Sadori et al.
Title Page
Abstract Introduction
Conclusions References
Tables Figures
J I
J I
Back Close
Full Screen / Esc
Printer-friendly Version
Interactive Discussion
Discussion
Paper
|D
iscussionP
aper|
Discussion
Paper
|D
iscussionP
aper|
core PRG1 Sadori and Narcisi (2001) obtained an age of 3055±75 yr BP just belowthe tephra layer.
The four radiocarbon ages obtained from macroremains are consistent with the ra-diocarbon age available for the tephra (Sadori and Narcisi, 2001) and were used toelaborate an age/depth model based on linear interpolation (Fig. 2, Table 2).5
Calculations were done using the program Clam (Blaauw, 2010), which calibratedthe 14C and tephra-inferred dates following IntCal09 (Reimer et al., 2009). The newcore PG2 covers the last 6700 calendar years. Figure 2 shows that the sedimentationrate of core PG2 was lower in the deeper part of the core and that it increased since3000 cal. BP appearing “constant” until present-day. Ages are expressed as calendar10
years BP (cal BP) unless differently stated.
4.2 Pollen results
A total of 123 pollen and spore types (including 35 tree and shrub taxa and 75 herbs)were identified. Due to the high sedimentation rate of the last 3000 yr, a quite gooddetail is obtained for the period, with an average of a sample every 6 cm (i.e. a temporal15
resolution of ca. 50 yr). Data from core PG2 are shown in Figs. 4 (arboreal and nonarboreal taxa) and 5 (“ecological groups” and total concentration).
Pollen Zone 1 (PZ1): 6.26–5.7 m (ca. 6730–5375 cal BP). The bottom of the se-quence is radiocarbon dated to 5780±40 yr BP. AP % are between 60 and 80 %, pollenconcentration ranges from 19 000 to 135 000, and the number of taxa from 27 to 37. De-20
ciduous and evergreen oak (Quercus) pollen (both peaking at 40 %), olive-tree (Olea)and elm (Ulmus) between 5 to 10 %, beech (Fagus) and hazel (Corylus) at less than5 % are the main taxa. Arboreal pollen is dominant in this pollen zone and Poaceaedo not represent more than 20 % of the total pollen. Among herbaceous taxa, cerealia,Ranunculaceae, Chenopodiaceae, Plantago, Rumex, m Artemisia, Cichorioideae un-25
diff., Apiaceae, Asteroideae undiff. and Labiatae are recorded as a continuous signal,with percentages higher than 1 %, since the bottom of the core.
2067
CPD9, 2059–2094, 2013
The last 7 millenniaof vegetation andclimate changes
L. Sadori et al.
Title Page
Abstract Introduction
Conclusions References
Tables Figures
J I
J I
Back Close
Full Screen / Esc
Printer-friendly Version
Interactive Discussion
Discussion
Paper
|D
iscussionP
aper|
Discussion
Paper
|D
iscussionP
aper|
Pollen Zone 2 (PZ2): 5.7–4.7 m (ca. 5375–3150 cal BP). The Sicanian’s tephra layer,radiocarbon dated at 3055±75 yr BP in core PRG1 was detected between ca. 465and 475 cm. AP % are between 30 and 65 %, pollen concentration ranges from 12 000to 110 000, and the number of taxa from 28 to 45. The transition to this pollen zone ismarked by an abrupt decrease of AP % from 80 to 50 %, involving both oak pollen types5
(from >30 % to <5 %) and a relative increase of Poaceae (ca. 10 to 30–40 %), becom-ing dominant from this zone to the top of the sequence; several herbs (in particularChenopodiaceae, Plantago, Ranunculaceae, Apiaceae, Asteroideae undiff., Artemisia)show a slight increase. Undifferentiated cereals and Secale are currently recorded fromthis zone up to top core. Papaver and Centaurea cyanus pollen grains are recorded10
at the end of the zone. The zone is also characterized by the continuous presence ofCyperaceae (more than 1 %). Pollen percentages of dominant taxa (Quercus decid-uous and evergreen types and Poaceae) show important and rapid variations withinthis zone; Olea and Ulmus show low percentages but also slight variations. Fagus andQuercus cf.suber are recorded continuously.15
Pollen Zone 3 (PZ3) is split into two subzones. AP % are between 45 and 65 %,pollen concentration ranges from 16 000 to 85 000, and the number of taxa from 26 to52. Pollen subzone 3a (PZ3a: 4.7–4.5 m; ca. 3150–3000 cal BP). AP % are between 50and 65 %. This short zone is characterized by the sudden increase of Olea to ca. 20 %,while both Quercus dominant pollen types decrease as well as Ulmus. Poaceae and20
Chenopodiaceae decrease,while other herbs do not show significant changes. Pollensubzone 3b (PZ3b: 4.5–4 m; ca. 3000–2600 cal BP). AP % are between 45 and 60 %.Olea, dominating the previous subzone, shows a strong decrease. It seems first re-placed by Quercus ilex type and Pistacia, then by Quercus pubescens type. Ephedrafragilis is continuously present from this zone to the top of the diagram. Poaceae also25
tend to increase despite many rapid variations. Among other herbs, Chenopodiaceaedo not show significant changes.
Pollen zone 4 (PZ4): 4–3 m (ca. 2600–1885 cal BP). AP % are between 20 and 45 %,pollen concentration ranges from 9200 to 76000, and the number of taxa from 32 to
2068
CPD9, 2059–2094, 2013
The last 7 millenniaof vegetation andclimate changes
L. Sadori et al.
Title Page
Abstract Introduction
Conclusions References
Tables Figures
J I
J I
Back Close
Full Screen / Esc
Printer-friendly Version
Interactive Discussion
Discussion
Paper
|D
iscussionP
aper|
Discussion
Paper
|D
iscussionP
aper|
46. The top of this zone is radiocarbon dated to 1961±33 BP. An important furtheropening of the wood is found, tree pollen suddenly drops from 50 to 25 %, showinga decrease in both mesophilous (deciduous oaks and elm) and Mediterranean taxa(evergreen oaks, olive). Two shrub taxa show increase, namely Pistacia and Ephedrafragilis. A strong increase in anthropogenic pollen is worthy of mention. Poaceae are5
mainly between 25 and 35 %, showing many rapid variations. It is important to notethe increase of Chenopodiaceae, first matching the one of Cichorioideae, and Aster-oideae undiff. A consistent peak of Cichorioideae (20 %) just preceeds a slight expan-sion of Cyperaceae, becoming more important towards the top of the diagram. The endof the zone is marked by an abrupt peak of Chenopodiaceae (40 %).10
Pollen Zone 5 (PZ5): 3–2 m. It is split into two subzones. AP % are between 20and 45 %, pollen concentration ranges from 10 000 to 45 000, and the number of taxafrom 33 to 48. Pollen subzone 5a (PZ5a): 3–2.7 m; ca. 1885–1620 cal BP): A slightrecover of AP (>45 %), mainly due to evergreen Quercus (5 to 20 %), and followed bya slight expansion of Quercus pubescens type, marks the transition to this new zone.15
Poaceae show a decrease at the beginning of this zone together with other herbs. An-thropogenic taxa show a decrease too. Pollen subzone 5b (PZ5b: 2.7–2 m; ca. 1620–1000 cal BP): it is mainly characterized by a lowering of arboreal taxa to 20 %, Pistaciaincluded, and the correspondent increase of Poaceae and anthropogenic taxa. Theslight but meaningful expansion of Secale is worthy of mention. Urticaceae show the20
start of a continuous curve. The zone ends with a peak of Chenopodiaceae.Pollen Zone 6 (PZ6): 2–0.4 m (ca. 1000–170 cal BP). The bottom of this zone is
radiocarbon dated to 1032±30 yr BP. AP % are between 25 and 50 %, pollen con-centration ranges from 3700 to 23 000, and the number of taxa from 34 to 53. Thiszone is characterized at its bottom by a phase of increase for both oak-types, followed25
by an increase of Poaceae, the dominant taxon. The zone ends with an expansionof evergreen Quercus (5 to 30 %) following an increase of deciduous Quercus and ofChenopodiaceae. Anthropogenic taxa seem to be less important than in the previoustwo zones.
2069
CPD9, 2059–2094, 2013
The last 7 millenniaof vegetation andclimate changes
L. Sadori et al.
Title Page
Abstract Introduction
Conclusions References
Tables Figures
J I
J I
Back Close
Full Screen / Esc
Printer-friendly Version
Interactive Discussion
Discussion
Paper
|D
iscussionP
aper|
Discussion
Paper
|D
iscussionP
aper|
Pollen Zone 7 (PZ7): 0.4 m to surface (ca. 170 cal BP to present). AP % are around40 %, pollen concentration ranges from 3400 to 5300, and the number of taxa from 40to 43. The recovery of Olea (<5 to 20 %), continuous percentages of cultivated trees(Juglans, Castanea) and percentages of 5 % of Juniperus characterize this last zone.It is also to note an increase in cerealia, Plantago, and anthropogenic taxa as a whole.5
5 Discussion
5.1 Comparison between PG2 and PRG1 cores
The PRG1 core records the last 12 000 yr in 456 cm, while the new core, PG2, spansca. 6700 yr in 626 cm. Comparison of the two cores (Fig. 6) shows that they record simi-lar vegetation dynamics, but also important differences in the temporal resolution of the10
last 3 millennia, confirming that a hiatus/es or a strong reduction in the sedimentationrates must be present in the upper part of core PRG1, as supposed by Sadori and Nar-cisi (2001). The fall of Quercus ilex and Olea (at ca. 425 cm in PG2 and at ca. 100 cmin PRG1), followed by a peak of Quercus pubescens and a slight expansion of Pistaciacan be easily found in both cores, while the peaks of Quercus ilex and of Chenopodi-15
aceae recorded in PG2 are not detected in PRG1. Considering the chenopods vege-tation belts that formed in case of lake level lowering (Calvo et al., 1997, Fig. 1c) thepossibility that PRG1 was taken in a periodically emerged part of the lake is advanced.Repeated lake body reductions can explain why the last 2500 yr are recorded in 4 m ofsediment in PG2, while this same period was entirely recorded in the upper 70 cm of20
the PRG1 core.
5.2 Vegetation history: climate versus human forcing
The pollen diagrams (Figs. 4 and 5) show, from bottom to top, a tendency to forestopening. Changes in forest canopy such as opening can be interpreted either as due toaridification and/or temperature decrease or to (human) forest clearance. It is clear that25
2070
CPD9, 2059–2094, 2013
The last 7 millenniaof vegetation andclimate changes
L. Sadori et al.
Title Page
Abstract Introduction
Conclusions References
Tables Figures
J I
J I
Back Close
Full Screen / Esc
Printer-friendly Version
Interactive Discussion
Discussion
Paper
|D
iscussionP
aper|
Discussion
Paper
|D
iscussionP
aper|
environments such as the Pergusa one are highly vulnerable and that minor climatic orhuman changes can provide the ignition of a never-ending drying process.
Except for the bottom of the PG2 pollen sequence (PZ1), which records a forestedlandscape around the site, the upper zones (PZ 2 to 7) show the evolution of an openlandscape dominated by Poaceae and characterized also by many other herbs. In this5
environment, two possibilities for understanding the Poaceae expansions have to beconsidered. Poaceace could have either formed vast grasslands or a hydrophylousvegetation belt around the lake itself, or both. In the first case there is a clear indicationof forest opening (either human or climate induced), in the second only a climatic clue.The position of the PG2 core, neither marginal nor central in the lake like the previ-10
ous PRG1 core (Sadori and Narcisi, 2001) would in fact register water body reductions(a Phragmites belt closer to the lake centre would mean increasing Poaceae percent-ages in the diagram) and expansions. We also have to consider that a reduction ofprecipitation would cause both a forest opening and the lowering of the lake level andthat this climate change could have been enhanced by a strong land-use (forest clear-15
ance, cultivation, pasture). A clear human impact can be seen in the diagrams (Figs. 4and 5) only since 2600 cal BP (zone 4), while before, since around 3700 yr BP, there isevidence of human presence.
As a matter of fact prehistoric populations did not change the landscape on a broadscale and a widespread human impact is found only since the Roman period in Mediter-20
ranean environments (Mercuri et al., 2012; Roberts et al., 2011; Sadori, 2013; Sadori etal., 2004, 2011) and hardly detectable before the Bronze Age, when a number of peri-lacustrine settlements in the Italian peninsula were present, and the Terramare culturebloomed in the Po plain (Cremaschi et al., 2006; Mercuri et al., 2006, 2012) prob-ably because water in that period became a less available resource (Sadori et al.,25
2004; Magny et al., 2009, 2011; Zanchetta et al., 2012a).Two arguments (Sadori and Giardini, 2008) are used to explain this lack of evidence
and delay in proofs coming from pollen records of the Mediterranean basin: naturalvulnerability to climate change (forest clearance is not just produced by humans) and
2071
CPD9, 2059–2094, 2013
The last 7 millenniaof vegetation andclimate changes
L. Sadori et al.
Title Page
Abstract Introduction
Conclusions References
Tables Figures
J I
J I
Back Close
Full Screen / Esc
Printer-friendly Version
Interactive Discussion
Discussion
Paper
|D
iscussionP
aper|
Discussion
Paper
|D
iscussionP
aper|
botanical issues (many anthropogenic indicators are indigenous and some others areoften hard to distinguish from other plants).
Many edible plants such as cereals, pulses and fruit trees are in fact native toMediterranean regions and their pollen grains, often not identifiable at a satisfying tax-onomic level, are found during the whole Holocene and even before in the pollen dia-5
grams. An exemplification can be made with cereal pollen type, which includes pollenof both cultivated and spontaneous cereals as well as of other grasses (Andersen,1978). Secale (rye) is a cereal with a distinct pollen grain, distinguishable from that ofother cereals. At present two species are found in the Italian flora (Pignatti, 1982): oneis the cultivated S. cereale, the other is S. stricta, a Mediterranean mountain species10
native to Sicily (and of some central and southern Italian regions), named mountain orwild rye and growing from 600 to 1700 m a.s.l. Pollen grains of the two species cannotbe distinguished. Plantago lanceolata, a synanthropic herb whose finding is attentivelytaken into account as evidence of human presence in central Europe, has pollen grainsthat cannot be distinguished from those of other Plantago species indigenous in Italy15
(Reille, 1992).Under this light it is not certain at all that the increase of herbs recorded at 5400 cal
BP is due to forest clearance. Also the presence of Secale since 4900 cal BP cannot betaken as an evidence of cultivation, even if the presence of a Copper age site, CozzoMatrice, is documented at the edge of Lago di Pergusa catchment (Fig. 1d). A differ-20
ent scenario is found since ca. 3700 cal BP, when Secale and companion species ofcrops, like Papaver and Centaurea cyanus, as well as Linum and Vitis are found. Since3200 cal BP an important and abrupt spread of Olea is of note. Wild olive-tree (Oleaeuropea var. oleaster ) is regarded as autochthonous in Sicily and requires a typicalMediterranean climate characterized by summer aridity with an average annual tem-25
perature of 14–20 ◦C and precipitation varying between 300 and 1000 mm yr−1 (Pignattiand Nimis, 1995). The cultivated olive tree (Olea europea) is now found in the wholearea colonized by the evergreen oak-forests, but the wild natural olive-tree is typicalof the warmest areas of Mediterranean. It is then difficult to consider as natural the
2072
CPD9, 2059–2094, 2013
The last 7 millenniaof vegetation andclimate changes
L. Sadori et al.
Title Page
Abstract Introduction
Conclusions References
Tables Figures
J I
J I
Back Close
Full Screen / Esc
Printer-friendly Version
Interactive Discussion
Discussion
Paper
|D
iscussionP
aper|
Discussion
Paper
|D
iscussionP
aper|
findings of more than 20 % of Olea pollen at Pergusa, knowing that these percentagesare comparable to the ones that were found at Gorgo Basso (Tinner et al., 2009), on thewestern coasts of Sicily, during the phases of wild olive-tree maximum development.
Even if the more obvious interpretation of pollen data points to human action as themain cause of olive expansion occurring at Pergusa between 3200 and 2800 cal BP, we5
have to consider that increased temperature and decreased precipitation might havefavoured (or allowed) the spread of thermophilous and less moisture-demanding taxa.Cichorioideae and Asteroideae, strongly increasing since 3200 cal BP with abundantChenopodiaceae and overwhelming Poaceae could in fact have formed the ephemeralvegetation belts occurring when the lake level decreased (Sect. 2, Fig. 1c) for a water10
shortage and a change towards drier climate conditions. In this case Cichorioideae andAsteroideae should not be considered as anthropic indicators (Figs. 4 and 5), but asdryness ones. Also mesophilous arboreal taxa like elm and deciduous oaks decrease incorrespondence with the spread of olive. Olea decline is followed by a rapid successionof short increase in oaks, but it also coincides with the spread of Pistacia trees/shrubs15
and an increase of Ephedra fragilis (ca. 2800 cal BP), in parallel with the definitivedecline of deciduous Quercus. These elements support the hypothesis of a transitionat 3200 cal BP from mixed oak-forests to Mediterranean inland-forests infiltrated bytypical scrub or “macchia” taxa, a sort of pioneer vegetation. The fact that Pistacia isfound in both Pergusa sequences but it is never more than 5 % supports the hypothesis20
of more thermophilous and drier conditions around the site, or of intense grazing, butnot the onset of the Mediterranean “macchia”.
Based on the order of these events, the record suggests a successional dynam-ics following a human-induced perturbation of the local vegetation, whose effect mighthave amplified the aridification phase reconstructed in Sicily over the last three millen-25
nia by lake level oscillations (Magny et al., 2011, 2012). Stable isotope curves fromprevious cores from Lago di Pergusa (Sadori et al., 2008; Zanchetta et al., 2007)clearly show that the more arid period of the Holocene is found after 3000 cal. BP.The speleotheme portion from ca. 3600 to ca. 2800 cal BP from Grotta Carburangeli,
2073
CPD9, 2059–2094, 2013
The last 7 millenniaof vegetation andclimate changes
L. Sadori et al.
Title Page
Abstract Introduction
Conclusions References
Tables Figures
J I
J I
Back Close
Full Screen / Esc
Printer-friendly Version
Interactive Discussion
Discussion
Paper
|D
iscussionP
aper|
Discussion
Paper
|D
iscussionP
aper|
a cave in northern Sicily (Frisia et al., 2006), shows lower oxygen and carbon isotopevalues than in the early Holocene and a small peak centered at ca. 3100 yr BP. Thestalagmite stopped to grow after 2800 cal BP, suggesting enhanced dryness. An in-crease of Olea pollen soon before 3000 cal BP is found in Adriatic cores and in Italiancontinental ones (Combourieu-Nebout et al., 2013; Di Rita and Magri, 2009; Mercuri5
et al., 2012, 2013), indicating that this was a rather general change in the Mediter-ranean landscape. The exploitation of olive in Greece during the Bronze Age has beendocumented by both macroremains and pollen (Kouli, 2012). Presence of olive stonesis documented at the early Iron Age archaeological site of Selinunte, southwesternSicily (Stika et al., 2008), some centuries later than the pollen spread of Pergusa. No10
evidence of this step was found at Gorgo Basso (Tinner et al., 2009), inside the natu-ral area of distribution of Olea europea, but we have to consider that Lago di Pergusalies in a privileged position to observe past land-use, in a zone widely and stronglyexploited in the Bronze Age (Fig. 1d).
At Lago di Pergusa the deterioration of climate conditions accompanies the evolution15
of human activities that become stronger over the last 2.5 millennia. Pollen indicators ofcultures (Secale, Linum, Vitis) are found as a continuous signal over the last millennia.Moreover, herbaceous taxa found nowadays in the lacustrine vegetation belts in thecase of water decrease, are quite important.
5.3 Climate reconstruction20
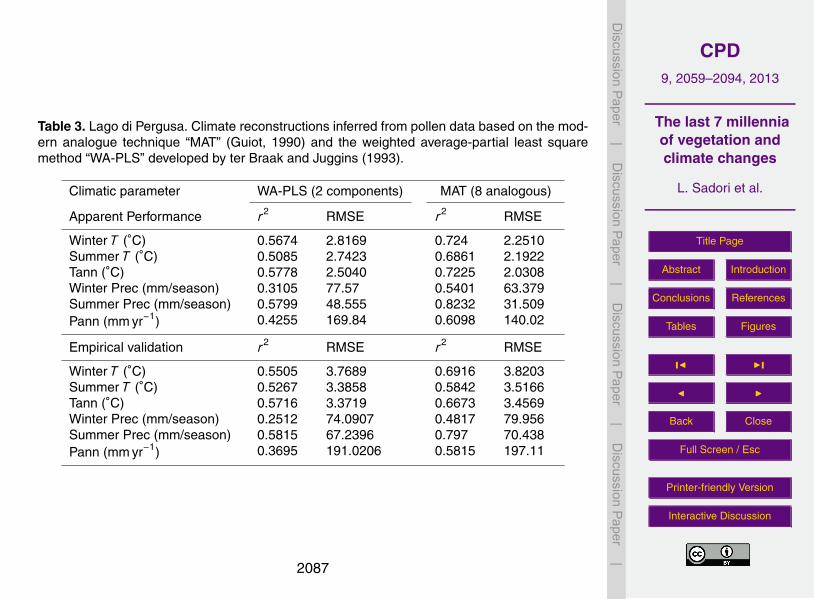
Table 3 shows that the reliability of both methods is good, in particular for the recon-struction of summer precipitation and winter temperature. Quantitative climate recon-structions for PG2 were performed for annual temperature and precipitation, and sum-mer/winter temperature and precipitation (Fig. 7). Values of the seasonal temperatureand precipitation parameters are expressed as anomalies and thus can be compared25
with the results obtained from PG1 core (Peyron et al., 2012) and with the reconstruc-tion of temperatures of the warmest/coldest month for South-Western Europe (Daviset al., 2003). It is clear that although similarities exist, there are distinct differences
2074
CPD9, 2059–2094, 2013
The last 7 millenniaof vegetation andclimate changes
L. Sadori et al.
Title Page
Abstract Introduction
Conclusions References
Tables Figures
J I
J I
Back Close
Full Screen / Esc
Printer-friendly Version
Interactive Discussion
Discussion
Paper
|D
iscussionP
aper|
Discussion
Paper
|D
iscussionP
aper|
between methods. The most important difference between methods occurs over thelast 3000 yr (Fig. 7) with more marked changes using the MAT. These strong oscilla-tions can be due to human impact and to the fact that MAT is more sensitive than WA-PLS, particularly when the variability of modern pollen spectra is highly due to humanimpact. For the last 3000 yr, the amplitude of the changes reconstructed with the MAT5
needs to be interpreted with caution. However, if high criticism was often addressedto the reliability of modern pollen data for the reconstruction of climate, given that hu-man impacts may influence these modern pollen samples, our pollen-based climatereconstructions appears to show solid results and a consistent trend through time.
Despite differences in the reconstruction of the amplitude of changes, both meth-10
ods underline a clear climate trend towards aridification and warming over the last 3millennia. This trend was interrupted by several phases characterized by cooling andmoisture. A first cooling phase is reconstructed between 2600 and 2000 cal BP, whichcorresponds to a maximum of precipitation. Other phases of cooling and moisture arefound at 1650–1100, 850–550, 400–200 cal BP.15
Enough precipitation should have been available in the ancient Greek site of Mor-gantina, nearby Pergusa, as a public fountain was fed only by rainy water in the 4thcent. BC (Malcolm Bell, personal communication, 31 January 2013). It is interesting tonote what happened in other Mediterranean sites: the lake level at lake Malik (Alba-nia) is medium/high between 2600 and 2000 cal BP (Fouache et al., 2010) and at lake20
Accesa (central Italy) between ca. 2800 and 2000 cal BP (Magny et al., 2007). Mostimportantly this period roughly coincides with the highest phase of the lake level andthe amount of precipitation (2500–2140 cal BP) in southern Spain as reconstructedin Zonar Lake (Martın-Puertas et al., 2009). Stable isotope records from lake Shkodra(Albania) show the wettest period of the last 4500 cal BP at ca. 2500–2000 cal BP25
(Zanchetta et al., 2012b). The first two phases of cooling (2600–2000, 1650–1100 calBP) chronologically comprehend the last two periods of the Calderone glacier expan-sion (Giraudi et al., 2011). A general correlation is found with climate trends recon-structed in Morocco (Cheddadi et al., 1998) and with the phases of more important
2075
CPD9, 2059–2094, 2013
The last 7 millenniaof vegetation andclimate changes
L. Sadori et al.
Title Page
Abstract Introduction
Conclusions References
Tables Figures
J I
J I
Back Close
Full Screen / Esc
Printer-friendly Version
Interactive Discussion
Discussion
Paper
|D
iscussionP
aper|
Discussion
Paper
|D
iscussionP
aper|
erosional activity in Tunisia (Marquer et al., 2008), which seems well correlated withphases of precipitation increase that we reconstruct in Sicily.
These arguments support the hypothesis that landscape changes recorded at Per-gusa over the recent past were mainly related to climate stress more than to humanimpact on vegetation.5
6 Conclusions
In order to assess the degree of human-environment interactions there is the urgentand unavoidable need to carry out scientific investigations on natural archives linkedto human history like Lago di Pergusa. Lago di Pergusa turned out to be a privilegedobservatory for climate changes and human activity, even if the two signals cannot be10
easily distinguished only by pollen. This is not a negative issue at all, but a positiveone. Failure to consider the complex interactions between humans and their environ-ment could have lead either to an environmentally deterministic view of socio-culturalchange or to a complete neglect of possible environmental impact on human actionand history.15
Our data show that the first phase of opening of forests recorded in the core lastedfor more than two millennia, from ca. 5400 to ca. 3200 cal BP, a period characterizedby frequent though slight vegetation changes. A strong change of the environmentoccurred around 3200 cal BP, when an expansion of Olea is found. After 2700 cal BPhuman impact is uncontested and overlapped a natural change. We were in fact able20
to get two different, mixed and hard to disentangle, clues from pollen, signalling both aclimatic and a human impact.
A solution to come over from this impasse was to use present-day lacustrine veg-etation studies, climate reconstructions from pollen using different methods and otherproxies from the same site and from nearby sites. Preliminary data from isotope anal-25
yses of the sediments (Zanchetta et al., 2013) show several anomalies between δ18O
2076
CPD9, 2059–2094, 2013
The last 7 millenniaof vegetation andclimate changes
L. Sadori et al.
Title Page
Abstract Introduction
Conclusions References
Tables Figures
J I
J I
Back Close
Full Screen / Esc
Printer-friendly Version
Interactive Discussion
Discussion
Paper
|D
iscussionP
aper|
Discussion
Paper
|D
iscussionP
aper|
and δ13C curves and the vegetation changes, probably to correlate with periods ofintense land exploitation.
The important fluctuations of vegetation around Lago di Pergusa seem to be mostlydependent from climate variations even over the recent past, but cannot be regardedas totally independent from human activities.5
Our climate reconstruction is inevitably influenced by human-induced changes of thelandscape and the amplitude of the reconstructed changes might be overestimated inour work. However, our results are consistent with former works from various sites allaround the Mediterranean basin, which were based on independent proxies.
Our data underlines a synergy between human activities and climate in shaping the10
landscape in Sicily in the recent past. We also propose that climate had an effect onhuman activities, which could have been oriented towards the culture of olive-trees inthe Sicilian inlands, during a period of climate conditions favorable to its spread.
Climate reconstruction points out four phases of cooling and enhanced wetness inthe last three millennia (2600–2000, 1650–1100, 850–550, 400–200 cal BP). They15
are consistent with other climate proxies from the Mediterranean area, once more indi-cating that a close relation existed between climate and human history.
Acknowledgements. This work was funded by the French CNRS through the ANR Program“LAMA”. The authors are in debt with Rosa Termine, Universita degli Studi di Enna “Kore”,for her help in the logistic during the drilling campaign. The coring operations have been autho-20
rized by Ente Gestore della Riserva of Provincia Regionale di Enna.
References
Andersen, S. T.: Identification of wild grass and cereal pollen. Danmarks Geologiske Underso-gelse Arbog 1978, 69–92, 1978.
Bernabo Brea, L.: La Sicilia prima dei Greci. Milano, Il Saggiatore, 1st Edn., 1961.25
Blaauw, M.: Methods and code for “classical” age-modelling of radiocarbon sequences, Quat.Geochronol., 5, 512–518, 2010.
2077
CPD9, 2059–2094, 2013
The last 7 millenniaof vegetation andclimate changes
L. Sadori et al.
Title Page
Abstract Introduction
Conclusions References
Tables Figures
J I
J I
Back Close
Full Screen / Esc
Printer-friendly Version
Interactive Discussion
Discussion
Paper
|D
iscussionP
aper|
Discussion
Paper
|D
iscussionP
aper|
Brullo, S., Minissale, P., and Spampinato, G.: Considerazioni fitogeografiche sulla flora dellaSicilia, Ecologia Mediterranea, 21, 99–107, 1995.
Brullo, S., Scelsi, F., Siracusa, G., and Spampinato, G.: Caratteristiche bioclimatiche della Si-cilia, Giornale Botanico Italiano, 130, 177–185, 1996.
Calvo, S., Marceno, C., Ottonello, D., Frada Orestano, C., Romano, S., and Longo, A.: Osser-5
vazioni naturalistiche ed ecologiche intorno al lago Pergusa, Naturalista siciliano S.IV, 19,63–84, 1995.
Caron, B., Sulpizio, R., Zanchetta, G., Siani, G., and Santacroce, R.: The Late Holocene toPleistocene tephrostratigraphic record of lake Orhid (Albania), C. R. Geosci., 342, 453–466,2010.10
Carrion, J. S., Fernandez, S., Gonzalez-Samperiz, P., Gil-Romera, G., Badal, E., Carrion-Marco, Y., Lopez-Merino, L., Lopez-Saez, J. A., Fierro, E., and Burjachs, F.: Expected trendsand surprises in the Lateglacial and Holocene vegetation history of the Iberian Peninsulaand Balearic Islands, Review of Paleobotany and Palynology, 162, 458–475, 2010a.
Carrion, J. S., Fernandez, S., Jimenez-Moreno, Fauquette, S., Gil-Romera, G., Gonzalez-15
Samperiz, P., and Finlayson, C.: The historical origins of aridity and vegetation degradationin southeastern Spain, J. Arid Environ., 74, 731–736, 2010b.
Cheddadi, R., Lamb, H. F., Guiot, J., and van der Kaars, S.: Holocene climatic change in Mo-rocco: a quantitative reconstruction from pollen data, Clim. Dynam., 14, 883–890, 1998.
Cioni, R., Marianelli, P., and Santacroce, R.: Thermal and compositional evolution of the shallow20
magma chambers of Vesuvius: evidence from pyroxene phenocrysts and melt inclusions, J.Geophys. Res., 103, 18277–18294, 1997.
Coltelli, M., Del Carlo, P., and Vezzoli, L.: Stratigraphic constraints for explosive activity in thepast 100 ka at Etna Volcano, Italy, Int. J. Earth Sci., 89, 665–677, 2000.
Combourieu-Nebout, N., Peyron, O., Bout-Roumazeilles, V., Goring, S., Dormoy, I., Joannin,25
S., Sadori, L., Siani, G., and Magny, M.: Holocene vegetation and climate changes in centralMediterranean inferred from a high-resolution marine pollen record (Adriatic Sea), Clim. PastDiscuss., 9, 1969–2014, doi:10.5194/cpd-9-1969-2013, 2013.
Cremaschi, M., Pizzi, C., and Valsecchi, V.: Water management and land use in the terramareand a possible climatic co-factor in their abandonment: The case study of the terramara of30
Poviglio Santa Rosa (northern Italy), Quaternary Int., 151, 87–98, 2006.Davis, B. A. S., Brewer, S, Stevenson, A. C., and Guiot, J.: The temperature of Europe during
the Holocene reconstructed from pollen data, Quaternary Sci. Rev., 22, 1701–1716, 2003.
2078
CPD9, 2059–2094, 2013
The last 7 millenniaof vegetation andclimate changes
L. Sadori et al.
Title Page
Abstract Introduction
Conclusions References
Tables Figures
J I
J I
Back Close
Full Screen / Esc
Printer-friendly Version
Interactive Discussion
Discussion
Paper
|D
iscussionP
aper|
Discussion
Paper
|D
iscussionP
aper|
de Beaulieu, J. L., Miras, Y., Andrieu-Ponel, V., and Guiter, F.: Vegetation dynamics in north-western Mediterranean regions: Instability of the Mediterranean bioclimate, Plant Biosystems– An International Journal Dealing with all Aspects of Plant Biology, 139, 114–126, 2005.
Desprat, S., Combourieu-Nebout, N., Essallami, L., Sicre, M. A., Dormoy, I., Peyron, O., Siani,G., Bout Roumazeilles, V., and Turon, J. L.: Deglacial and Holocene vegetation and climatic5
changes at the southernmost tip of the Central Mediterranean from a direct land-sea corre-lation, Clim. Past Discuss., 8, 5687–5741, doi:10.5194/cpd-8-5687-2012, 2012.
Di Pasquale, G., Garfi, G., and Quezel, P.: Sur Ia presence d’un Zelkova nouveau en Sicilesud-orientale (Ulmaceae), Biocosme Mesogeen Nice, 8–9, 401–409, 1992.
Di Rita, F. and Magri, D.: Holocene drought, deforestation and evergreen vegetation develop-10
ment in the central Mediterranean: A 5500 year record from Lago Alimini Piccolo, Apulia,southeast Italy, Holocene, 19, 295–306, 2009.
Dormoy, I., Peyron, O., Combourieu Nebout, N., Goring, S., Kotthoff, U., Magny, M., and Pross,J.: Terrestrial climate variability and seasonality changes in the Mediterranean region be-tween 15 000 and 4000 years BP deduced from marine pollen records, Clim. Past, 5, 615–15
632, doi:10.5194/cp-5-615-2009, 2009.Duro, A., Piccione, V., Scalia, C., and Zampino, D.: Fitoclima della Sicilia. Contributo alla carat-
terizzazione del fattore aridita Atti del 5◦ Workshop “Progetto Strategico Clima Ambiente eTerritorio nel Mezzogiorno”, 2, 133–150, 1997.
Finsinger, W., Heiri, O., Valsecchi, V., Tinner, W., and Lotter, A. F.: Modern pollen assemblages20
as climate indicators in southern Europe, Global Ecol. Biogeogr., 16, 567–582, 2007.Finsinger, W., Colombaroli, D., De Beaulieu, J.-L., Valsecchi, V., Vanniere, B., Vescovi, E.,
Chapron, E., Lotter, A. F., Magny, M., and Tinner, W.: Early to mid-Holocene climate changeat Lago dell’Accesa (central Italy): climate signal or anthropogenic bias?, J. Quaternary Sci.,25, 1239–1247, 2010.25
Frisia, S., Borsato, A., Mangini, A., Spotl, Ch., Madonia, G., and Sauro, U.: Holocene climatevariability in Sicily from a discontinuous stalagmite record and the Mesolithic to Neolithictransition, Quaternary Res., 66, 388–400, 2006.
Giannitrapani, E. and Pluciennik, M.: La seconda campagna di ricognizione (settembre 1997)del progetto “Archeologia nella valle del Torcicoda”, Sicilia Archeologica, 96, 59–69, 1998.30
Giorgi, F. and Lionello, P.: Climate change projections for the Mediterranean region, GlobalPlanet. Change, 63, 90–104, 2008.
2079
CPD9, 2059–2094, 2013
The last 7 millenniaof vegetation andclimate changes
L. Sadori et al.
Title Page
Abstract Introduction
Conclusions References
Tables Figures
J I
J I
Back Close
Full Screen / Esc
Printer-friendly Version
Interactive Discussion
Discussion
Paper
|D
iscussionP
aper|
Discussion
Paper
|D
iscussionP
aper|
Giraudi, C., Magny, M., Zanchetta, G., and Drysdale, R. N.: The Holocene climate evolu- tionof the Mediterranean Italy: a review of the continental geological data, The Holocene, 21,105–115, 2011.
Goeury, C. and de Beaulieu, J.-L.: A propos de la concentration du pollen a l’aide de la liqueurde Thoulet dans les sediments mineraux, Pollen et Spores, 21, 239–251, 1979.5
Guiot, J.: Methodology of the last climatic cycle reconstruction in France from pollen data,Palaeogeogr. Palaeocli., 80, 49–69, 1990.
Gunn, D. E. and Best, A. I.: A new automated non-destructive system for high resolution multi-sensor core logging of open sediment cores, Geo-Mar. Lett., 18, 70–77, 1998.
IPCC: Climate change 2007: The Physical Science Basis, Contribution of Working Group I to10
the Fourth Assessment, 2007.Kouli, K.: Vegetation development and human activities in Attiki (SE Greece) during the last
5,000 years, Veg. Hist. Archaeobot., 21, 267–278, 2012.Le Bas, M. J., Le Maitre, R. W., Streckheisen, A., and Zanettin, B.: Chemical classification of
volcanic rocks based on the total alkali-silica diagram, J. Petrol., 27, 745–750, 1986.15
Magny, M., Vanniere, B., de Beaulieu, J.-L., Begeot, C., Heiri, O., Millet, O. Bossuet, G., Peyron,O., Brugiapaglia, E., and Leroux, A.: Holocene climate changes in the central Mediterraneanas recorded by lake-level fluctuations at Lake Accesa (Tuscany, Italy), Quaternary Sci. Rev.,26, 1951–1964, 2007.
Magny, M., Vanniere, B., Zanchetta, G., Fouache, E., Touchais, G., Petrika, L., Coussot, C.,20
Walter-Simonnet, A.-V., and Arnaud, F.: Possible complexity of the climatic event around4300–3800 cal. BP in the central and western Mediterranean, The Holocene, 19, 823–833,2009.
Magny, M., Vanniere, B., Calo, C., Millet, L., Leroux, A., Peyron, O., Zanchetta, G., La Mantia, T.,and Tinner, W.: Holocene hydrological changes in south-western Mediterranean as recorded25
by lake-level fluctuations at Lago Preola, a coastal lake in southern Sicily, Italy, QuaternarySci. Rev., 30, 2459–2475, 2011.
Magny, M., Peyron, O., Sadori, L., Ortu, E., Zanchetta, G., Vanniere, B., and Tinner, W.: Con-trasting patterns of precipitation seasonality during the Holocene in the south- and north-central Mediterranean, J. Quaternary Sci., 27, 290–296, 2012.30
Marianelli, P. and Sbrana, A.: Risultati di misure di standard di minerali e di vetri naturali inmicroanalisi a dispersione di energia, Atti Societa Toscana di Scienze Naturali Memorie,105, 57–63, 1998.
2080
CPD9, 2059–2094, 2013
The last 7 millenniaof vegetation andclimate changes
L. Sadori et al.
Title Page
Abstract Introduction
Conclusions References
Tables Figures
J I
J I
Back Close
Full Screen / Esc
Printer-friendly Version
Interactive Discussion
Discussion
Paper
|D
iscussionP
aper|
Discussion
Paper
|D
iscussionP
aper|
Marquer, L., Pomel, S., Abichou, A., Schulz, E., Kaniewski, D., and Van Campo, E.: LateHolocene high resolution palaeoclimatic reconstruction inferred from Sebkha Mhabeul,southeast Tunisia, Quaternary Res., 70, 240–250, 2008.
Martın-Puertas, C., Valero-Garces, B. L., Brauer, A., Mata, M. P., Delgado-Huertas, A., andDulski, P.: The Iberian-Roman Humid Period (2600–1600 cal yr BP) in the Zonar Lake varve5
record (Andalucıa, southern Spain), Quaternary Res., 71, 108–120, 2009.Mercuri, A. M. and Sadori, L.: 30. Mediterranean culture and climatic change: past patterns and
future trends. PART IV: Mediterranean Man and Sea: Myths, origins, challenges and oppor-tunities, in: The Mediterranean Sea: its history and present challenges, edited by: Goffredo,S. and Dubinsky, Z., Springer, Dordrecht, 2013.10
Mercuri, A. M., Accorsi, C. A., Bandini Mazzanti, M., Bosi, G., Cardarelli, A., Labate, D., March-esini, M., and Trevisan Grandi, G.: Economy and environment of Bronze Age settlements –Terramare – in the Po Plain (Northern Italy): first results of the archaeobotanical research atthe Terramara di Montale, Veg. Hist. Archaeobot. 16, 3–60, 2006.
Mercuri, A. M., Sadori, L., and Uzquiano Ollero, P.: Mediterranean and north-African cultural15
adaptations to mid-Holocene environmental and climatic change, Holocene, 21, 189–206,2011.
Mercuri, A. M., Bandini Mazzanti, M., Torri, P., Vigliotti, L., Bosi, G., Florenzano, A., Olmi, L., andMassamba N’siala, I.: marine/terrestrial integration for mid-late Holocene vegetation historyand the development of the cultural landscape in the Po Valley as a result of human impact20
and climate change, Veg. Hist. Archaeobot., 21, 353–372, 2012.Mercuri, A. M., Bandini Mazzanti, M., Florenzano, A., Montecchi, M. C., and Rattighieri,
E.: Olea, Juglans and Castanea: the OJC group as pollen evidence of the de-velopment of human-induced environments in the Italian peninsula, Quaternary Int.,doi:10.1016/j.quaint.2013.01.005, in press, 2013.25
Noti, R., van Leeuwen, J., Colombaroli, D., Vescovi, E., Pasta, S., La Mantia, T., and Tinner,W.: Mid- and late-Holocene vegetation and fire history at Biviere di Gela, a coastal lake insouthern Sicily, Italy, Veg. Hist. Archaeobot., 18, 371–387, doi:10.1007/s00334-009-0211-0,2009.
Perez-Obiol, R. and Sadori, L.: Similarities and dissimilarities, synchronisms and diachronisms30
in the Holocene vegetation history of the Balearic Islands and Sicily, Veg. Hist. Archaeobot.,16, 259–265, 2007.
2081
CPD9, 2059–2094, 2013
The last 7 millenniaof vegetation andclimate changes
L. Sadori et al.
Title Page
Abstract Introduction
Conclusions References
Tables Figures
J I
J I
Back Close
Full Screen / Esc
Printer-friendly Version
Interactive Discussion
Discussion
Paper
|D
iscussionP
aper|
Discussion
Paper
|D
iscussionP
aper|
Peyron, O., Goring, S., Dormoy, I., Kotthoff, U., Pross, J., de Beaulieu, J.-L., Drescher-Schneider, R., Vanniere, B., and Magny, M.: Holocene seasonality changes in the centralMediterranean region reconstructed from the pollen sequences of Lake Accesa (Italy) andTenaghi Philippon (Greece), Holocene, 21, 131–146, 2011.
Peyron, O., Magny, M., Goring, S., Joannin, S., de Beaulieu, J.-L., Brugiapaglia, E., Sadori, L.,5
Garfi, G., Kouli, K., Ioakim, C., and Combourieu-Nebout, N.: Contrasting patterns of climaticchanges during the Holocene in the Central Mediterranean (Italy) reconstructed from pollendata, Clim. Past Discuss., 8, 5817–5866, doi:10.5194/cpd-8-5817-2012, 2012
Pignatti, S.: Flora d’Italia (three volumes), EDAGRICOLE, Bologna, 1982.Pignatti, S.: Ecologia del Paesaggio, UTET, Torino, 1994.10
Pignatti, S. and Nimis, P. L.: Biomi, in: Ecologia Vegetale, edited by: Pignatti, S., UTET, Torino,319–355, 1995.
Pross, J., Kotthoff, U., Muller, U. C., Peyron, O., Dormoy, I., Schmiedl, G., Kalaitzidis, S., andSmith, A. M.: Massive perturbation in terrestrial ecosystems of the Eastern Mediterraneanregion associated with the 8.2 kyr climatic event, Geology, 37, 887–890, 2009.15
Quezel, P., Di Pasquale, G., and Garfi, G.: Decouverte d’un Zelkova en Sicile sud-orientale.Incidences biogeographiques et historiques, Comptes Rendus Hebdomadaires des Seancesde l’Academie des Sciences de Paris, 316, 21–26, 1993.
Reille, M.: Pollen et spores d’Europe et d’Afrique du Nord, Laboratoire de Botanique Historiqueet Palynologie, Universite d’Aix-Marseille III, 1992.20
Reille, M.: Pollen et spores d’Europe et d’Afrique du Nord - Supplement 1, Laboratoire deBotanique Historique et Palynologie, Universite d’Aix-Marseille III, 1995.
Reille, M.: Pollen et spores d’Europe et d’Afrique du Nord – Supplement 2, Laboratoire deBotanique Historique et Palynologie, Universite d’Aix-Marseille III, 1998.
Reimer, P. J., Baillie, M. G. L., Bard, E., Bayliss, A., Beck, J. W., Blackwell, P. G., Bronk Ramsey,25
C., Buck, C. E., Burr, G. S., Edwards, R. L., Friedrich, M., Grootes, P. M., Guilderson, T. P.,Hajdas, I., Heaton, T. J., Hogg, A. G., Hughen, K. A., Kaiser, K. F., Kromer, B., McCormac,F. G., Manning, S. W., Reimer, R. W., Richards, D. A., Southon, J. R., Talamo, S., Turney, C.S. M., van der Plicht, J., and Weyhenmeyer, C. E.: IntCal09 and Marine09 radiocarbon agecalibration curves, 0–50,000 years cal BP, Radiocarbon, 51, 1111–1150, 2009.30
Roberts, N., Brayshaw, D., Kuzucuoglu, C., Perez, R., and Sadori, L.: The mid-Holoceneclimatic transition in the Mediterranean: Causes and consequences, Holocene, 21, 3–13,2011.
2082
CPD9, 2059–2094, 2013
The last 7 millenniaof vegetation andclimate changes
L. Sadori et al.
Title Page
Abstract Introduction
Conclusions References
Tables Figures
J I
J I
Back Close
Full Screen / Esc
Printer-friendly Version
Interactive Discussion
Discussion
Paper
|D
iscussionP
aper|
Discussion
Paper
|D
iscussionP
aper|
Sadori, L.: Postglacial Pollen Records of Southern Europe, in: Encyclopedia of QuaternaryScience, edited by: Elias S., Elsevier, in press, 2013.
Sadori, L. and Giardini, M.: Charcoal analysis, a method to study veg- etation and climate ofthe Holocene: The case of Lago di Pergusa, Sicily (Italy), Geobios, 40, 173–180, 2007.
Sadori, L. and Giardini, M.: Environmental history in the Mediterranean basin: microcharcoal5
as a tool to disentangle human impact and climate change, in: Charcoals from the Past:Cultural and Palaeoenvironmental Implications, edited by: Fiorentino, G. and Magri. D., BARInternational Series, 1807, 229–236, 2008.
Sadori, L. and Mercuri, A. M.: Mediterranean culture and climatic change: past patterns andfuture trends, in: The Mediterranean Sea: its history and present challenges, edited by: Gof-10
fredo, S., and Dubinsky, Z., Springer, Dordrecht, 2013.Sadori, L. and Narcisi, B.: The Postglacial record of environmental history from Lago di Pergusa,
Sicily, Holocene, 11, 655–671, 2001.Sadori, L., Giraudi, C., Petitti, P., and Ramrath, A.: Human impact at Lago di Mezzano (central
Italy) during the Bronze Age: A multidisciplinary approach, Quaternary Int., 113, 5–17, 2004.15
Sadori, L., Zanchetta, G., and Giardini, M.: Last Glacial to Holocene palaeoenvironmental evo-lution at Lago di Pergusa (Sicily, Southern Italy) as inferred by pollen, microcharcoal, andstable isotopes, Quaternary Int., 181, 4–14, 2008.
Sadori, L., Mercuri, A. M., and Mariotti Lippi, M.: Reconstructing past cultural landscape andhuman impact using pollen and plant macroremains, Plant Biosyst., 144, 940–951, 2010.20
Sadori, L., Jahns, S., and Peyron, O.: Mid-Holocene vegetation history of the central Mediter-ranean, Holocene, 21, 117–129, 2011.
Stika, H.-P., Heiss, A., and Zach, B.: Plant remains from the early Iron Age in western Sicily:differences in subsistence strategies of Greek and Elymian sites, Veg. Hist. Archaeobot., 17,139–148, 2008.25
Sulpizio, R., Van Welden, A., Caron, B., and Zanchetta, G.: The Holocene tephrostratigraphicrecord of Lake Shkodra (Albania and Montenegro), J. Quaternary Sci., 25, 633–650, 2010.
ter Braak, C. J. F. and Juggins, S.: Weighted averaging partial least squares regression (WA-PLS): an improved method for reconstructing environmental variables from species assem-blages, Hydrobiologia, 269/270, 485–502, 1993.30
Tinner, W., van Leeuwen, J. F. N., Colombaroli, D., Vescovi, E., van der Knaap, W. O., Henne, P.D., Pasta, S., D’Angelo, S., and La Mantia, T.: Holocene environmental and climatic changes
2083
CPD9, 2059–2094, 2013
The last 7 millenniaof vegetation andclimate changes
L. Sadori et al.
Title Page
Abstract Introduction
Conclusions References
Tables Figures
J I
J I
Back Close
Full Screen / Esc
Printer-friendly Version
Interactive Discussion
Discussion
Paper
|D
iscussionP
aper|
Discussion
Paper
|D
iscussionP
aper|
at Gorgo Basso, a coastal lake in southern Sicily, Italy, Quaternary Sci. Rev., 28, 15–16,2009.
Touring Club Italiano: Guida d’Italia: Sicilia. Milano, 6th Ed., 1989.Tusa, S.: La Sicilia e la preistoria, Palermo, Sellerio, II Ed., 1992.Vanniere, B., Bossuet G., Walter-Simonnet, A.-V., Ruffaldi, P., Adatte, T., Rossy, M., and Magny,5
M.: High resolution record of environnemental changes and tephrochronological markers ofthe Last Glacial-Holocene Transition at Lake Lautrey (Jura, France), J. Quaternary Sci., 18,797–808, 2004.
Vogel, H., Zanchetta, G., Sulpizio, R., Wagner, B., and Nowaczyk, N.: A tephrostratigraphicrecord for the last glacial-interglacial cycle from Lake Ohrid, Albania and Macedonia, J. Qua-10
ternary Sci., 25, 320–338, 2009.Wagner, B., Sulpizio, R., Zanchetta, G., Wulf, S., Wessels, M., Daut, G., and Nowaczyk, N.:
The last 40 ka tephrostratigraphic record of Lake Ohrid, Albania and Macedonia: a verydistal archive for ash dispersal from Italian volcanoes, J. Volcanol. Geotherm. Res., 1, 71–80, 2008.15
Zampino, D., Duro, A., Piccione, V., and Scala, C.: Fitoclima della Sicilia – Termoidrogrammisecondo Walter e Lieth, Atti del 5◦ Workshop “Progetto Strategico Clima Ambiente e Territorionel Mezzogiorno”, 2, 7–121, 1997.
Zanchetta, G., Borghini, A., Fallick, A.E., Bonadonna, F. P., and Leone, G.: Late Quaternarypalaeohydrology of Lake Pergusa (Sicily, southern Italy) as inferred by stable isotopes of20
lacustrine carbonates, J. Paleolimnol., 38, 227–239, 2007.Zanchetta, G., Giraudi, C., Sulpizio, R., Magny, M., Drysdale, R. N., and Sadori, L.: Constraining
the onset of the Holocene “Neoglacial” over the central Italy using tephra layers, QuaternaryRes., 78, 236–247, 2012a.
Zanchetta, G., Van Welden, A., Baneschi, I., Drysdale, R., Sadori, L., Roberts, N., Giardini, M.,25
Beck, C., Pascucci, V., and Sulpizio, R.: Multiproxy record for the last 4500 years from LakeShkodra (Albania/Montenegro), J. Quaternary Sci., 27, 780–789, 2012b.
Zanchetta, G., Baneschi, I., Magny, M., Sadori, L., and Ortu, E.: Stable isotope geochemistryof the last 7 cal ka BP from Lago di Pergusa (Sicily), in preparation, 2013.
2084
CPD9, 2059–2094, 2013
The last 7 millenniaof vegetation andclimate changes
L. Sadori et al.
Title Page
Abstract Introduction
Conclusions References
Tables Figures
J I
J I
Back Close
Full Screen / Esc
Printer-friendly Version
Interactive Discussion
Discussion
Paper
|D
iscussionP
aper|
Discussion
Paper
|D
iscussionP
aper|
Table 1. Lago di Pergusa. Chemical data for the tephra layer from core PG2 (this paper) andPGR1 (Sadori and Narcisi, 2001). Samples from PRG1 were newly analysed.
K2O+ K2O/SiO2 TiO2 Al2O3 FeOtot MnO MgO CaO Na2O K2O P2O5 ClO Total Na2O Na2O
PG2-2 54.59 2.40 17.53 7.31 0.32 2.07 4.49 5.82 4.54 0.55 0.38 100 10.36 0.78PG2-3 53.81 1.78 17.67 8.26 0.05 3.09 5.67 5.15 3.77 0.5 0.25 100 8.92 0.73PG2-4 52.47 1.95 16.65 9.84 0.19 3.42 7.38 4.76 2.59 0.52 0.23 100 7.35 0.54PG2-5 52.09 1.94 16.58 9.74 0.17 3.36 5.94 5.27 4.20 0.48 0.23 100 9.47 0.80PG2-6 52.86 1.90 17.31 9.09 0.16 3.22 6.16 4.20 4.74 0.58 0.18 100 8.54 0.80PG2-7 51.86 1.95 16.98 10.34 0.17 3.42 7.24 4.61 2.82 0.38 0.23 100 7.43 0.61PG2-9 52.47 2.07 16.46 9.56 0.35 3.43 6.48 5.06 3.57 0.34 0.21 100 8.63 0.71PG2-10 52.81 1.97 16.73 9.80 0.21 3.52 6.94 4.49 2.88 0.43 0.22 100 7.37 0.64PG2-11 52.92 2.21 16.19 9.97 0.32 2.95 6.60 5.10 3.04 0.42 0.28 100 8.14 0.60PG2-12 53.21 2.12 16.78 9.81 0.38 3.29 4.16 5.14 4.40 0.41 0.30 100 9.54 0.86PG2-13 51.98 2.11 16.53 10.06 0.26 3.55 6.36 4.74 3.73 0.52 0.16 100 8.47 0.79PRG1-1 55.56 2.04 16.72 9.16 0.19 3.42 6.17 4.88 4.20 0.51 0.15 100 9.08 0.86PRG1-2 55.56 2.44 16.23 8.58 0.10 2.22 3.63 5.31 4.98 0.78 0.17 100 10.29 0.97PRG1-3 55.19 2.12 16.53 9.46 0.07 2.60 4.53 4.36 3.97 0.44 0.46 100 8.6 0.86PRG1-5 52.31 2.00 16.72 8.84 0.20 3.18 6.30 5.47 4.36 0.45 0.17 100 9.83 0.80PRG1-6 52.84 2.01 16.31 9.95 0.10 3.25 6.27 4.86 3.71 0.46 0.24 100 8.57 0.76PRG1-6b 52.99 2.16 16.07 10.2 0.27 3.33 6.45 4.47 3.42 0.42 0.22 100 7.89 0.76PRG1-7 52.94 1.90 16.94 9.2 0.28 3.56 6.74 5.18 2.65 0.40 0.21 100 7.83 0.51PRG1-8 52.53 2.18 16.55 9.77 0.31 3.47 7.19 4.66 2.76 0.38 0.20 100 7.42 0.59
2085
CPD9, 2059–2094, 2013
The last 7 millenniaof vegetation andclimate changes
L. Sadori et al.
Title Page
Abstract Introduction
Conclusions References
Tables Figures
J I
J I
Back Close
Full Screen / Esc
Printer-friendly Version
Interactive Discussion
Discussion
Paper
|D
iscussionP
aper|
Discussion
Paper
|D
iscussionP
aper|
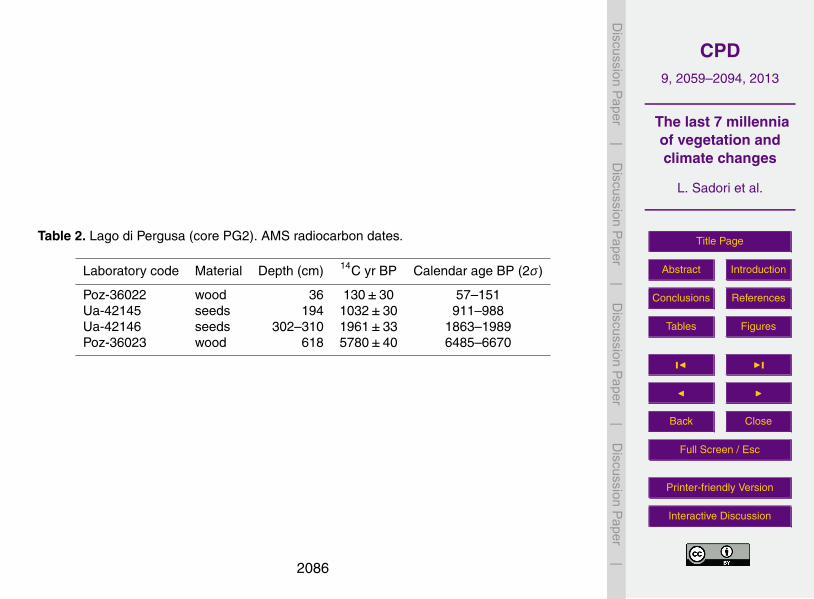
Table 2. Lago di Pergusa (core PG2). AMS radiocarbon dates.
Laboratory code Material Depth (cm) 14C yr BP Calendar age BP (2σ)
Poz-36022 wood 36 130±30 57–151Ua-42145 seeds 194 1032±30 911–988Ua-42146 seeds 302–310 1961±33 1863–1989Poz-36023 wood 618 5780±40 6485–6670
2086
CPD9, 2059–2094, 2013
The last 7 millenniaof vegetation andclimate changes
L. Sadori et al.
Title Page
Abstract Introduction
Conclusions References
Tables Figures
J I
J I
Back Close
Full Screen / Esc
Printer-friendly Version
Interactive Discussion
Discussion
Paper
|D
iscussionP
aper|
Discussion
Paper
|D
iscussionP
aper|
Table 3. Lago di Pergusa. Climate reconstructions inferred from pollen data based on the mod-ern analogue technique “MAT” (Guiot, 1990) and the weighted average-partial least squaremethod “WA-PLS” developed by ter Braak and Juggins (1993).
Climatic parameter WA-PLS (2 components) MAT (8 analogous)
Apparent Performance r2 RMSE r2 RMSE
Winter T (◦C)Summer T (◦C)Tann (◦C)Winter Prec (mm/season)Summer Prec (mm/season)Pann (mm yr−1)
0.56740.50850.57780.31050.57990.4255
2.81692.74232.504077.5748.555169.84
0.7240.68610.72250.54010.82320.6098
2.25102.19222.030863.37931.509140.02
Empirical validation r2 RMSE r2 RMSE
Winter T (◦C)Summer T (◦C)Tann (◦C)Winter Prec (mm/season)Summer Prec (mm/season)Pann (mm yr−1)
0.55050.52670.57160.25120.58150.3695
3.76893.38583.371974.090767.2396191.0206
0.69160.58420.66730.48170.7970.5815
3.82033.51663.456979.95670.438197.11
2087
CPD9, 2059–2094, 2013
The last 7 millenniaof vegetation andclimate changes
L. Sadori et al.
Title Page
Abstract Introduction
Conclusions References
Tables Figures
J I
J I
Back Close
Full Screen / Esc
Printer-friendly Version
Interactive Discussion
Discussion
Paper
|D
iscussionP
aper|
Discussion
Paper
|D
iscussionP
aper|
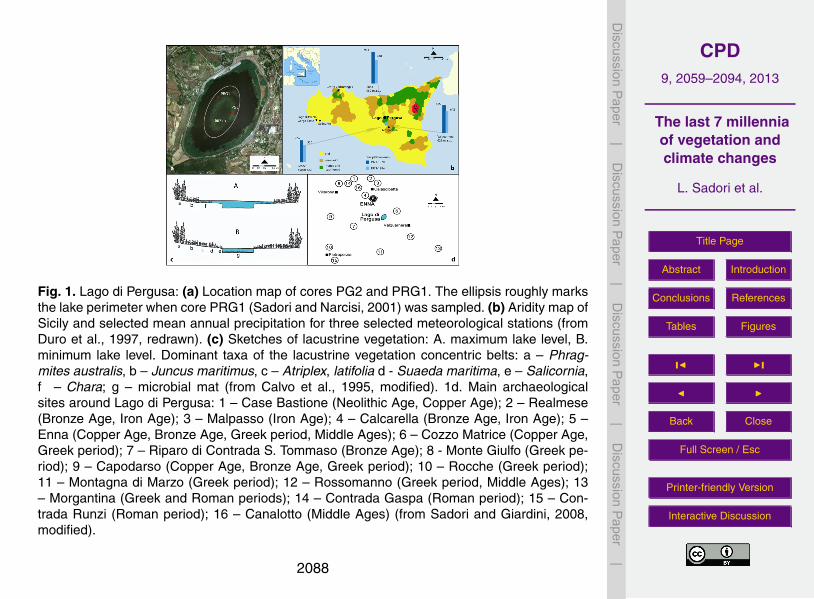
Fig. 1. Lago di Pergusa: (a) Location map of cores PG2 and PRG1. The ellipsis roughly marksthe lake perimeter when core PRG1 (Sadori and Narcisi, 2001) was sampled. (b) Aridity map ofSicily and selected mean annual precipitation for three selected meteorological stations (fromDuro et al., 1997, redrawn). (c) Sketches of lacustrine vegetation: A. maximum lake level, B.minimum lake level. Dominant taxa of the lacustrine vegetation concentric belts: a – Phrag-mites australis, b – Juncus maritimus, c – Atriplex, latifolia d - Suaeda maritima, e – Salicornia,f – Chara; g – microbial mat (from Calvo et al., 1995, modified). 1d. Main archaeologicalsites around Lago di Pergusa: 1 – Case Bastione (Neolithic Age, Copper Age); 2 – Realmese(Bronze Age, Iron Age); 3 – Malpasso (Iron Age); 4 – Calcarella (Bronze Age, Iron Age); 5 –Enna (Copper Age, Bronze Age, Greek period, Middle Ages); 6 – Cozzo Matrice (Copper Age,Greek period); 7 – Riparo di Contrada S. Tommaso (Bronze Age); 8 - Monte Giulfo (Greek pe-riod); 9 – Capodarso (Copper Age, Bronze Age, Greek period); 10 – Rocche (Greek period);11 – Montagna di Marzo (Greek period); 12 – Rossomanno (Greek period, Middle Ages); 13– Morgantina (Greek and Roman periods); 14 – Contrada Gaspa (Roman period); 15 – Con-trada Runzi (Roman period); 16 – Canalotto (Middle Ages) (from Sadori and Giardini, 2008,modified).
2088
CPD9, 2059–2094, 2013
The last 7 millenniaof vegetation andclimate changes
L. Sadori et al.
Title Page
Abstract Introduction
Conclusions References
Tables Figures
J I
J I
Back Close
Full Screen / Esc
Printer-friendly Version
Interactive Discussion
Discussion
Paper
|D
iscussionP
aper|
Discussion
Paper
|D
iscussionP
aper|
Fig. 2. Lago di Pergusa: PG2 core. Lithology, Uncalibrated Volume susceptibility, linear interpo-lation of AMS calibrated dates. A thin black layer, observed in the section 01-C2, correspondsto the ash event dated in PRG1 at 3055±75 yr BP (Sadori and Narcisi, 2001).
2089
CPD9, 2059–2094, 2013
The last 7 millenniaof vegetation andclimate changes
L. Sadori et al.
Title Page
Abstract Introduction
Conclusions References
Tables Figures
J I
J I
Back Close
Full Screen / Esc
Printer-friendly Version
Interactive Discussion
Discussion
Paper
|D
iscussionP
aper|
Discussion
Paper
|D
iscussionP
aper|
Fig. 3. Lago di Pergusa: total Alkaly vs Silica diagram (Le Bas et al., 1986) for tephra in Pergusacores (PRG1 and PG2).
2090
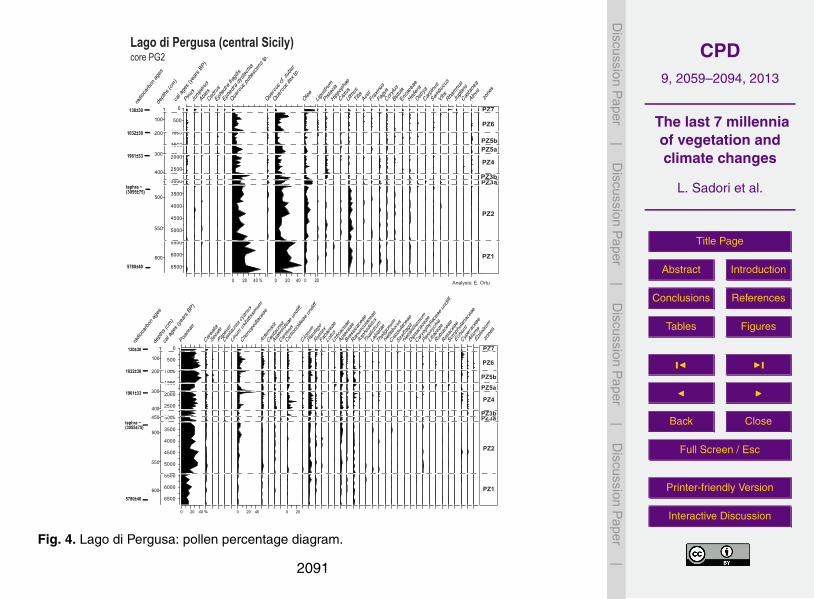
CPD9, 2059–2094, 2013
The last 7 millenniaof vegetation andclimate changes
L. Sadori et al.
Title Page
Abstract Introduction
Conclusions References
Tables Figures
J I
J I
Back Close
Full Screen / Esc
Printer-friendly Version
Interactive Discussion
Discussion
Paper
|D
iscussionP
aper|
Discussion
Paper
|D
iscussionP
aper|
130±30
1032±30
1961±33
tephra ~(3055±75)
5780±40
0
500
1000
1500
2000
2500
3000
3500
4000
4500
5000
5500
6000
6500
PinusJu
niperus
AbiesCed
rus
Ephed
ra fr
agilis
Ephed
ra dys
tachia
0 20 40 %
Quercus
pub
esce
ns tp
.
Quercus
cf. s
uber
0 20 40
Quercus
ilex t
p.
0
Olea
20
Ligus
trum
Pistac
ia
Hippop
hae
Cistus
Ulmus
Tilia
AcerFr
axinu
s
Fagu
s
Corylu
s
Betula
Ericac
eae
Heder
a
Ostrya
Carpin
us
Sambu
cus
Vitis Rhamnu
s
Jugla
ns
Castane
a
Alnus
200
300
550
100
400
500
600
cal a
ges (
year
s BP)
depth
s (cm
)
Lago di Pergusa (central Sicily)core PG2
PZ1
PZ3a
PZ2
PZ4
PZ5b
PZ6
PZ7
PZ3b
PZ5a
radio
carbon
ages
0
500
1000
1500
2000
2500
3000
3500
4000
4500
5000
5500
6000
6500
Poace
ae
Cerea
lia
Secale
Papav
er
Centaurea
cyan
us
Linum
usita
tissim
um
Cheno
podia
ceae
Artemisi
a
Centaurea
Asteroide
ae un
diff.
Cardu
us
Cichorioi
deae
undif
f.
Cirsium
Plantag
o
Rumex
Faba
ceae
LotusUrtic
acea
e
Apiace
ae
Brass
icace
ae
Ranun
culac
eae
Aspho
delus
Thali
ctrum
Labia
tae
Theli
gonu
m
Helleb
orus
Crass
ulace
ae
Saxifra
ga
Helian
them
um
Dipsac
acea
e
Caryo
phyll
acea
e und
iff.
Paron
ychia
Liliac
eae
Rubiac
eae
Rosac
eae
Scroph
ularia
ceae
Echium
Cyper
acea
e
Alisma
Epilob
ium
130±30
1032±30
1961±33
tephra ~(3055±75)
5780±40
200
300
450
550
100
400
500
600
cal a
ges (
years B
P)
depth
s (cm
)
PZ1
PZ3a
PZ2
PZ4
PZ5a
PZ6
PZ7
PZ3b
PZ5b
radio
carbon
ages
0 20 40 0 20 40 0 20%
zone
s
zone
s
Analysis: E. Ortu
Fig. 4. Lago di Pergusa: pollen percentage diagram.
2091
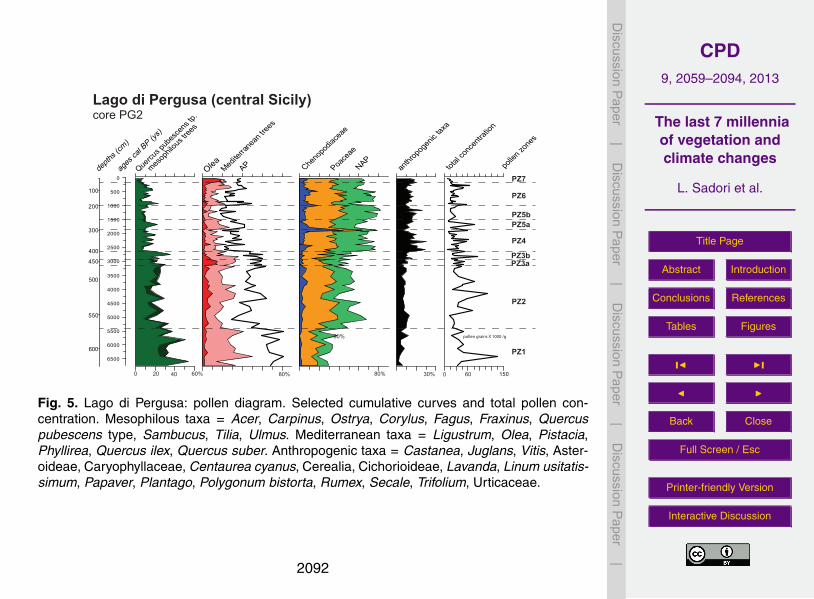
CPD9, 2059–2094, 2013
The last 7 millenniaof vegetation andclimate changes
L. Sadori et al.
Title Page
Abstract Introduction
Conclusions References
Tables Figures
J I
J I
Back Close
Full Screen / Esc
Printer-friendly Version
Interactive Discussion
Discussion
Paper
|D
iscussionP
aper|
Discussion
Paper
|D
iscussionP
aper|
0
500
1000
1500
2000
2500
3000
3500
4000
4500
5000
5500
6000
6500
150
mesop
hilou
s tree
s
Medite
rrane
an tre
es
NAPan
throp
ogen
ic tax
a
OleaQuercu
s pub
esce
ns tp
.
AP Poace
ae
Cheno
podia
ceae
Lago di Pergusa (central Sicily)core PG2
PZ1
PZ2
PZ4
PZ5b
PZ6
PZ7
PZ3bPZ3a
PZ5a
200
300
450
550
100
400
500
600
depth
s (cm
)
total
conc
entra
tion
ages
cal B
P (ys)
pollen grains X 1000 /g
0 20 40 60% 80%
80%
80% 30% 0 60
polle
n zon
es
Fig. 5. Lago di Pergusa: pollen diagram. Selected cumulative curves and total pollen con-centration. Mesophilous taxa = Acer, Carpinus, Ostrya, Corylus, Fagus, Fraxinus, Quercuspubescens type, Sambucus, Tilia, Ulmus. Mediterranean taxa = Ligustrum, Olea, Pistacia,Phyllirea, Quercus ilex, Quercus suber. Anthropogenic taxa = Castanea, Juglans, Vitis, Aster-oideae, Caryophyllaceae, Centaurea cyanus, Cerealia, Cichorioideae, Lavanda, Linum usitatis-simum, Papaver, Plantago, Polygonum bistorta, Rumex, Secale, Trifolium, Urticaceae.
2092
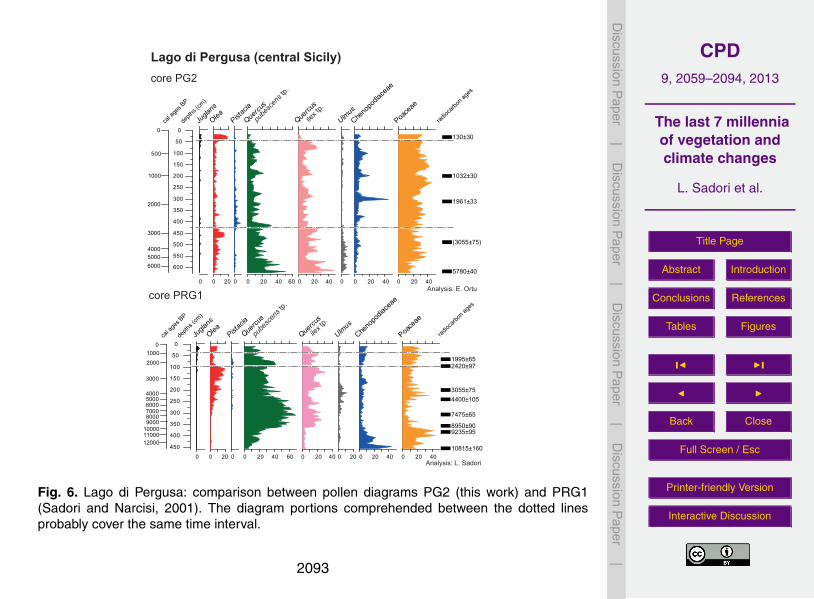
CPD9, 2059–2094, 2013
The last 7 millenniaof vegetation andclimate changes
L. Sadori et al.
Title Page
Abstract Introduction
Conclusions References
Tables Figures
J I
J I
Back Close
Full Screen / Esc
Printer-friendly Version
Interactive Discussion
Discussion
Paper
|D
iscussionP
aper|
Discussion
Paper
|D
iscussionP
aper|
0
50
100
150
200
250
300
350
400
450
0
Jugla
ns
0 20
Olea
0
Pistac
ia
0 20 40 60
Quercu
s
0 20 40
Quercu
s
0 20
Ulmus
0 20 40
Cheno
podia
ceae
0 20 40
Poace
ae
0
Jugla
ns
0 20
Olea
0
Pistac
ia
0 20 40 60
Quercu
s
0 20 40
Quercu
s
0
Ulmus
0 20 40
Cheno
podia
ceae
0 20 40
Poace
ae
0
50
100
150
200
250
300
350
400
450
500
550
600
130±30
1032±30
1961±33
(3055±75)
5780±40
10815±160
9235±95 8950±90
7475±65
4400±105 3055±75
2420±97 1995±65
Analysis: E. Ortu
Analysis: L. Sadori
core PRG1
cal a
ges B
P
depth
s (cm
)
500
1000
0
3000
6000 5000 4000
2000
cal a
ges B
P
1000 0
3000
6000 5000 4000
2000
depth
s (cm
)
7000 8000 9000
10000 11000 12000
pube
scen
s tp.
pube
scen
s tp.
ilex t
p.
ilex t
p.
Lago di Pergusa (central Sicily)core PG2
radioc
arbon
ages
radioc
arbon
ages
Fig. 6. Lago di Pergusa: comparison between pollen diagrams PG2 (this work) and PRG1(Sadori and Narcisi, 2001). The diagram portions comprehended between the dotted linesprobably cover the same time interval.
2093
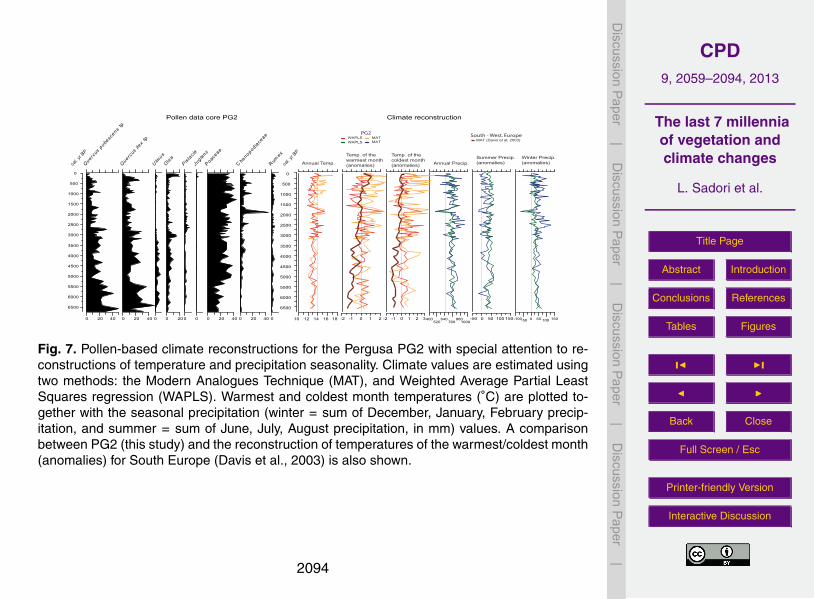
CPD9, 2059–2094, 2013
The last 7 millenniaof vegetation andclimate changes
L. Sadori et al.
Title Page
Abstract Introduction
Conclusions References
Tables Figures
J I
J I
Back Close
Full Screen / Esc
Printer-friendly Version
Interactive Discussion
Discussion
Paper
|D
iscussionP
aper|
Discussion
Paper
|D
iscussionP
aper|
0
500
1000
1500
2000
2500
3000
3500
4000
4500
5000
5500
6000
6500
0 20 40
Quercus
pubesc
ens tp.
0 20 40
Quercus
ilex
tp.
0
U lmus
0 20
O lea
0
P istacia
0
Juglans
0 20 40
Poaceae
0 20 40
C henopodiace
ae
0
Rumex
Pollen data core PG2 Climate reconstruction
0
500
1000
1500
2000
2500
3000
3500
4000
4500
5000
5500
6000
6500
10 12 14 16 18 -2 -1 0 1 2 400520
640760
8801000
0 50 100 150-50 0 50 100 150-50-100
Winter Precip. (anomalies)
WAPLS MAT
Summer Precip. (anomalies)Annual Precip.
Temp. of the coldest month (anomalies)Annual Temp.
Temp. of the warmest month (anomalies)
WAPLS MATPG2
MAT (Davis et al, 2003) South - West. Europe
-2 -1 0 1 2 3
cal. y
r BP
cal. y
r BP
Fig. 7. Pollen-based climate reconstructions for the Pergusa PG2 with special attention to re-constructions of temperature and precipitation seasonality. Climate values are estimated usingtwo methods: the Modern Analogues Technique (MAT), and Weighted Average Partial LeastSquares regression (WAPLS). Warmest and coldest month temperatures (◦C) are plotted to-gether with the seasonal precipitation (winter = sum of December, January, February precip-itation, and summer = sum of June, July, August precipitation, in mm) values. A comparisonbetween PG2 (this study) and the reconstruction of temperatures of the warmest/coldest month(anomalies) for South Europe (Davis et al., 2003) is also shown.
2094