Embed Size (px)
Citation preview
HAL Id: insu-01165120https://hal-insu.archives-ouvertes.fr/insu-01165120
Submitted on 19 Jan 2017
HAL is a multi-disciplinary open accessarchive for the deposit and dissemination of sci-entific research documents, whether they are pub-lished or not. The documents may come fromteaching and research institutions in France orabroad, or from public or private research centers.
L’archive ouverte pluridisciplinaire HAL, estdestinée au dépôt et à la diffusion de documentsscientifiques de niveau recherche, publiés ou non,émanant des établissements d’enseignement et derecherche français ou étrangers, des laboratoirespublics ou privés.
The Last Termination in the South Indian Ocean: Aunique terrestrial record from Kerguelen Islands (49°S)situated within the Southern Hemisphere westerly belt
Nathalie van der Putten, Cyriel Verbruggen, Svante Björck, Elisabeth Michel,Jean-Robert Disnar, Emmanuel Chapron, Bertrand N. Moine, Jacques-Louis
de Beaulieu
To cite this version:Nathalie van der Putten, Cyriel Verbruggen, Svante Björck, Elisabeth Michel, Jean-Robert Disnar,et al.. The Last Termination in the South Indian Ocean: A unique terrestrial record from KerguelenIslands (49°S) situated within the Southern Hemisphere westerly belt. Quaternary Science Reviews,Elsevier, 2015, 122, pp.142-157. �10.1016/j.quascirev.2015.05.010�. �insu-01165120�
lable at ScienceDirect
Quaternary Science Reviews 122 (2015) 142e157
Contents lists avai
Quaternary Science Reviews
journal homepage: www.elsevier .com/locate/quascirev
The Last Termination in the South Indian Ocean: A unique terrestrialrecord from Kerguelen Islands (49�S) situated within the SouthernHemisphere westerly belt
Nathalie Van der Putten a, *, Cyriel Verbruggen b, Svante Bj€orck a, Elisabeth Michel c,Jean-Robert Disnar d, Emmanuel Chapron d, 1, Bertrand N. Moine e,Jacques-Louis de Beaulieu f
a Department of Geology, Quaternary Sciences, Lund University, S€olvegatan 12, 223 64 Lund, Swedenb Department of Geology and Soil Science, Ghent University, Krijgslaan 281 (S8), 9000 Gent, Belgiumc Laboratoire des Sciences du Climat et de l'Environnement (LSCE), Laboratoire mixte CNRS-CEA-UVSQ, Avenue de la Terrasse, 91198 Gif-sur-Yvette Cedex,Franced Institut des Sciences des la Terre d'Orl�eans, ISTO, UMR 7327, CNRS, Univ Orl�eans, BRGM, 1A rue de la F�erollerie, 45071 Orl�eans Cedex 2, Francee Universit�es de Lyon, Universit�e Jean Monnet, Laboratoire Magmas et Volcans UMR-CNRS 6524, 42023 Saint-Etienne, Francef IMBEeUMR CNRS 7263/IRD/Aix-Marseille Universit�e 237, Europole M�editerran�een de l'Arbois, BP 80, 13545 Aix-en-Provence Cedex 04, France
a r t i c l e i n f o
Article history:Received 23 September 2014Received in revised form6 May 2015Accepted 12 May 2015Available online 10 June 2015
Keywords:PalaeoclimatologyLast TerminationPeat recordKerguelen IslandsSouthern OceanIndian OceanOceanic Cold ReversalSouthern Hemisphere westerly belt
* Corresponding author.E-mail address: [email protected]
1 Present address: GEODE, UMR5602, Universit�e Tode la recherche, 5 all�ee Antonio Machado, 31058 Tou
http://dx.doi.org/10.1016/j.quascirev.2015.05.0100277-3791/© 2015 Elsevier Ltd. All rights reserved.
a b s t r a c t
The awareness of the significance of the Southern Ocean in the Earth's climate system has becomeincreasingly obvious. The deglacial atmospheric CO2 rise during warming periods in Antarctica has beenattributed to CO2 ventilation from the deep ocean caused by enhanced upwelling around the AntarcticDivergence. It has been hypothesized that, more intense Southern Hemisphere westerly winds alignedwith the Antarctic Circumpolar Current due to a southward shift of the wind belt from its Last GlacialMaximum equator-ward position, are the main drivers. Reconstructions of past changes in atmosphericcirculation in the Southern Hemisphere are still scarce and the overall picture is patchy with sometimescontradictory results. For obvious reasons, most terrestrial records originate from southern SouthAmerica and New Zealand. Here we present a terrestrial record from the Indian sector of the SouthernOcean, from Kerguelen Islands located at 49�S. A peat record is investigated using a multi-proxyapproach (pollen and plant macrofossils, magnetic susceptibility, XRF analyses, biogenic silica content,Rock-Eval6 analysis and humification degree). Peat accumulation starts at about 16,000 cal yr BP withrelatively warm and dry conditions. The most prominent change in our proxy data occurs at 13,600 cal yrBP, when peat ponds were established on the peat surface, resulting in lacustrine-type deposits, as aresult of very high humidity, and with proxies implying very windy conditions. Within chronologicaluncertainties, this onset coincides with the onset of the so-called Oceanic Cold Reversal, based on thedeuterium excess data in the EPICA Dome C ice core record. Kerguelen Islands are located in the moisturesource area of Dome C and a change in atmospheric circulation at that time could explain both records.Around 12,900 cal yr BP, at the end of the Antarctic Cold Reversal, pond/lake sediments give way to morepeaty deposits, with proxies suggesting slightly drier, less windy and probably warmer conditions.Kerguelen Islands became less influenced by the Southern Hemisphere westerly winds and these con-ditions were amplified during the early Holocene climate optimum as found in Antarctic ice core records.
© 2015 Elsevier Ltd. All rights reserved.
e (N. Van der Putten).ulouse 2 Jean Jaures, Maisonlouse Cedex 1, France.
1. Introduction
It is known fromGreenland ice core records that, during the LastTermination (c. 22,000e11,500 cal yr BP after Lowe et al., 2008), theNorth Atlantic region was characterized by a sudden return to coldconditions, a period/event called the Younger Dryas (YD)/GS 1
N. Van der Putten et al. / Quaternary Science Reviews 122 (2015) 142e157 143
(12,900e11,700 cal yr BP), after an initial abrupt warming duringthe BøllingeAllerød/GI-1 period/events (14,700e12,900 cal yr BP)(Lowe et al., 2008). In comparison, temperature changes inAntarctica are more gradual. Cold events in Greenland correlatewith periods of warming in Antarctica and vice versa, related to the‘bipolar seesaw’ mechanism (Broecker, 1998; Stenni et al., 2011). InAntarctica, deglacial warming starts at about 18,350 cal yr BP,culminating in the Antarctic Isotopic Maximum 1 (AIM 1, Stenniet al., 2011; Veres et al., 2013), and was interrupted by a return tocolder conditions, or a pause in the warming, during the AntarcticCold Reversal (ACR, 14,650e12,900 cal yr BP) after which a secondwarming occurred and continued into the Holocene. Based ondeuterium-excess data from the EPICA Dome C ice record (EDC),Stenni et al. (2001) report an Oceanic Cold Reversal (OCR) in themoisture-source area for precipitation of EDC, which is the SouthIndian Ocean, with an onset about 1000 years later then the ACR.Whether the OCR is related to a change in sea surface temperaturein the source area or a shift in the moisture source itself, due to achange in atmospheric circulation at basin scale is not yet clear(Stenni et al., 2011).
Outside the Antarctic continent, in the mid latitudes of theSouthern Hemisphere (SH), palaeoclimatic records in general andterrestrial ones in particular, are still sparse in comparisonwith thesame latitudes in the Northern Hemisphere. However, during thelast decades, there has been a reinforced effort to reconstruct pastenvironmental and climatic changes in the SHmid latitudes. One ofthe questions that has received considerable attention is whetherSH mid latitudes show an Antarctic or a Northern Hemispherepalaeoclimatic signature: for example, was the YD a global orNorthern Hemisphere (NH) climate event (e.g. Bennett et al., 2000;Andres et al., 2003; Williams et al., 2005; Barrows et al., 2007).Some SH records reveal cooling events which are synchronous withthe NH YD cooling such as in the Taylor Dome ice core record (Steiget al., 1998) and a marine record south (34�S) of Australia (Andreset al., 2003) challenging the bipolar seesaw hypothesis. In thecase of the Taylor Dome ice core, the integrity of the time scale hasbeen questioned (Stenni et al., 2011) and in a marine setting, onehas to take into account the marine reservoir age, especially duringthe Last Termination when changes in ocean circulation resulted inpossibly fluctuating reservoir ages (Siani et al., 2013). Lately, agrowing consensus is that the southern mid-latitudes show anAntarctic palaeoclimatic signature (e.g. Denton et al., 2010),although its northern limit is uncertain. A second research topicthat has received extensive attention is the role of the SouthernOcean (SO) and related to this, shifts of the Southern Hemispherewesterly belt (SHW), in releasing CO2 from the deep ocean duringwarming phases in Antarctica (Toggweiler et al., 2006; Andersonet al., 2009; Denton et al., 2010; Lamy et al., 2010; Siani et al.,2013). A conceptual model has been presented by Toggweileret al. (2006) suggesting a pole-ward shift of the SHW from itsequator-ward Last Glacial Maximum (LGM) position, aligning theSHW with the Antarctic Circumpolar Current (ACR), favouringventilation of CO2 to the atmosphere around Antarctica at theAntarctic divergence. Anderson et al. (2009), hypothesize thatduring cold periods in the North Atlantic, the Inter-tropicalConvergence Zone (ITCZ) has a more southward location, pushingthe SHW southward resulting in increased CO2 ventilation andwarming in Antarctica. Denton et al. (2010) invoke a reducedAtlantic Meridional Overturning Circulation (AMOC) followed byexpanded sea ice in the North Atlantic, and in consequence a higherseasonality, as the way to spread cold events throughout the NorthAtlantic and the tropics, with a southward shift of the ITCZ(weakening of the Asian Monsoon) and the SHW as a result.
In relation to the LGM equator-ward location of the SHW, arecent proxy data comparison, highlighted that an equator-ward
shift or strengthening of the SHW could explain much of theproxy records, but that other processes could also be involved(Kohfeld et al., 2013). In a follow-up study, a modelling approachwas used together with a model-data comparison (Sime et al.,2013). None of the models that reproduce realistic LGM moisture/precipitation data e the most common used proxy for recon-structing changes in SHW e show a large equator-ward shift in theSHW.
We therefore think that more proxy data based evidence isneeded to test the different hypotheses on mechanisms and inter-nal feedbacks of the climate system in relation to latitudinal shiftsand/or strengthening of the SHW, changing ocean circulation, CO2out-gassing and changing temperature in Antarctica and the SHmid latitudes.
The SH mid latitudes constitute the SO, with southern SouthAmerica, and to a lesser extent New Zealand, as themain land areas.In consequence the vast majority of the terrestrial proxy recordsoriginate from these areas. However, dispersed in the SO, islandsand island groups occur, which can be targeted as a potential sourcefor terrestrial palaeoclimatic archives. Here we present the resultsof a multi-proxy study of a 16 000 year old peat sequence fromKerguelen Islands, a sub-Antarctic archipelago located at 49�S inthe Indian Ocean, situated in the moisture-source area of the EDCice core record. In this paper we will concentrate on the LastTermination focussing on the following questions: (i) how didclimate evolve during the Last Termination in the Indian sector ofthe SO, (ii) did any cold reversal occur at Kerguelen Islands and if so,what is its timing, (iii) how does the climate history relate to theclimate reconstructions from the EDC ice core, and (iv) can werelate our results to changes (latitudinal shifts and/or strength-ening/weakening) of the SHW?
2. Study area
The Kerguelen archipelago (49�Se69�E, Fig.1A and B) is a Frenchisland group in the South Indian Ocean. The main island, with anarea of c. 7200 km2, is by far the largest of the sub-Antarctic islands(sensu Lewis-Smith, 1984) and is surrounded by numerous smallerislands. The archipelago is an emerged part of the vast Kerguelen-Gaussberg oceanic plateau and is of volcanic origin, dominated bybasaltic lava flows. The western part of the main island is moun-tainous (with a mean elevation around 800 m), while the easternpart (P�eninsule Courbet) is flat and characterized by glacial andglaciofluvial deposits and landforms (Hall, 1984). The highest pointis the Mont Ross volcano with an altitude of 1850 m asl. The min-imum age of the first volcanic formations on Kerguelen Islands isabout 40 Myr (Giret et al., 2003) and the volcanic activity stillpersists today in the Rallier du Baty Peninsula. A small ice cap withoutlet glaciers occurs in the western part of the archipelago (Cookice cap, Fig. 1B) covering c. 12% of the island (Giret et al., 2003; Vander Putten et al., 2010). However, based on the presence of U-shaped valleys, moraines and fjords, it is clear that ice-cover wasmuch larger in the past, but the exact extent and timing of previousglaciations is poorly constrained. Some studies suggest that theseglacial landforms are not of LGM age and that the ice extent at thattime was rather restricted (e.g. Nougier, 1970). In contrast, Hall(1984) suggested a more extensive ice-cover during the LGM withan equilibrium line altitude of c. 200 m. The timing of the lastdeglaciation is also not well known and is mainly based on a fewbasal radiocarbon dates of peat deposits (Hodgson et al., 2014; Vander Putten et al., 2010).
Nowadays, the Kerguelen archipelago is situated in the core ofthe SHW, within the Antarctic Circumpolar Current (ACC), at thePolar Front (PF) (Fig. 1A). This makes it a valuable site for recon-structing past changes in atmospheric and oceanic circulation
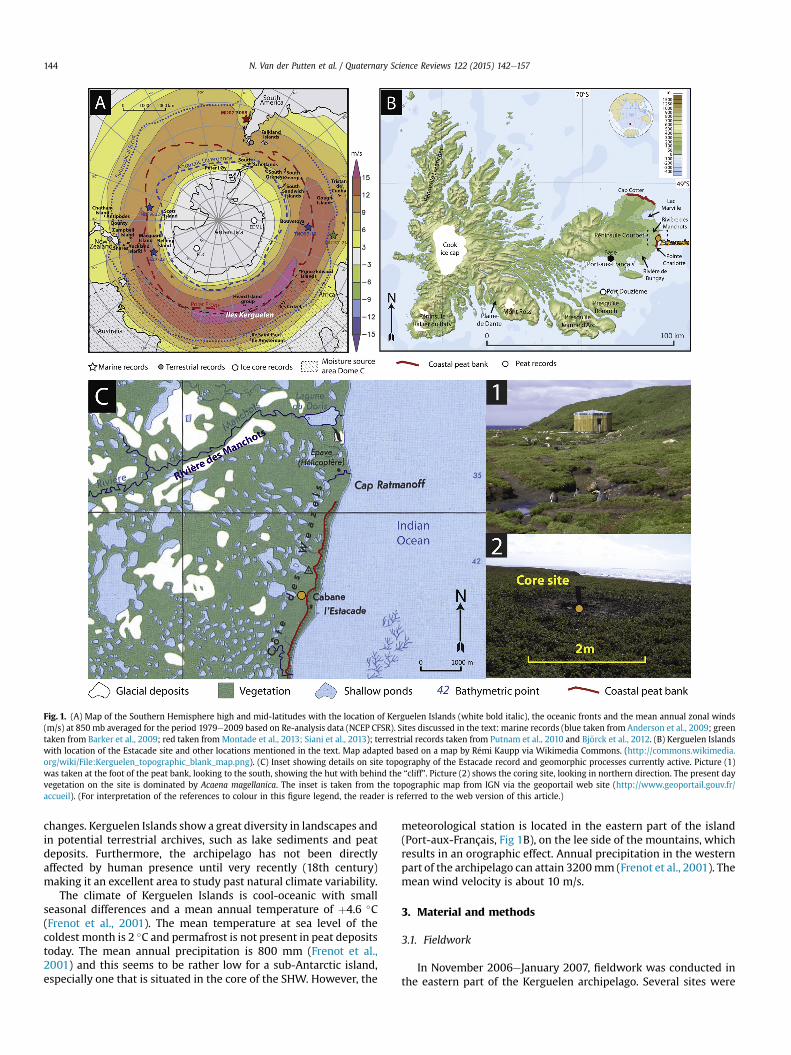
Fig. 1. (A) Map of the Southern Hemisphere high and mid-latitudes with the location of Kerguelen Islands (white bold italic), the oceanic fronts and the mean annual zonal winds(m/s) at 850 mb averaged for the period 1979e2009 based on Re-analysis data (NCEP CFSR). Sites discussed in the text: marine records (blue taken from Anderson et al., 2009; greentaken from Barker et al., 2009; red taken from Montade et al., 2013; Siani et al., 2013); terrestrial records taken from Putnam et al., 2010 and Bj€orck et al., 2012. (B) Kerguelen Islandswith location of the Estacade site and other locations mentioned in the text. Map adapted based on a map by R�emi Kaupp via Wikimedia Commons. (http://commons.wikimedia.org/wiki/File:Kerguelen_topographic_blank_map.png). (C) Inset showing details on site topography of the Estacade record and geomorphic processes currently active. Picture (1)was taken at the foot of the peat bank, looking to the south, showing the hut with behind the “cliff”. Picture (2) shows the coring site, looking in northern direction. The present dayvegetation on the site is dominated by Acaena magellanica. The inset is taken from the topographic map from IGN via the geoportail web site (http://www.geoportail.gouv.fr/accueil). (For interpretation of the references to colour in this figure legend, the reader is referred to the web version of this article.)
N. Van der Putten et al. / Quaternary Science Reviews 122 (2015) 142e157144
changes. Kerguelen Islands showa great diversity in landscapes andin potential terrestrial archives, such as lake sediments and peatdeposits. Furthermore, the archipelago has not been directlyaffected by human presence until very recently (18th century)making it an excellent area to study past natural climate variability.
The climate of Kerguelen Islands is cool-oceanic with smallseasonal differences and a mean annual temperature of þ4.6 �C(Frenot et al., 2001). The mean temperature at sea level of thecoldest month is 2 �C and permafrost is not present in peat depositstoday. The mean annual precipitation is 800 mm (Frenot et al.,2001) and this seems to be rather low for a sub-Antarctic island,especially one that is situated in the core of the SHW. However, the
meteorological station is located in the eastern part of the island(Port-aux-Français, Fig 1B), on the lee side of the mountains, whichresults in an orographic effect. Annual precipitation in the westernpart of the archipelago can attain 3200mm (Frenot et al., 2001). Themean wind velocity is about 10 m/s.
3. Material and methods
3.1. Fieldwork
In November 2006eJanuary 2007, fieldwork was conducted inthe eastern part of the Kerguelen archipelago. Several sites were
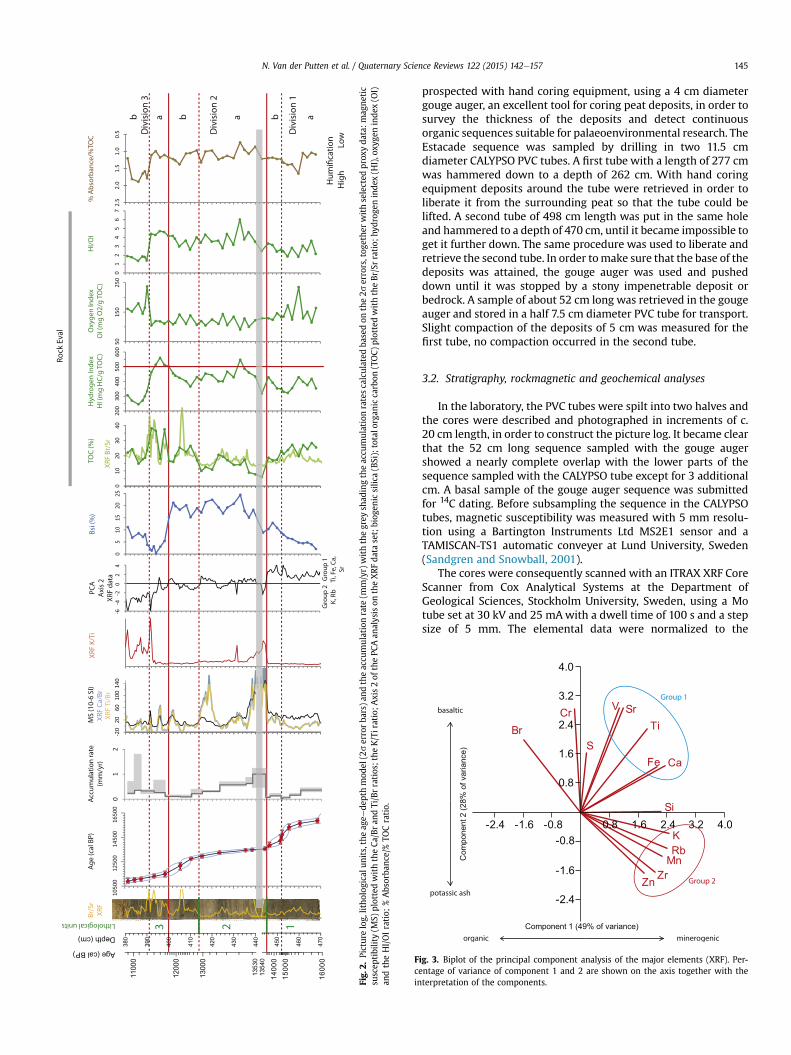
Fig.
2.Picturelog,
litho
logicalu
nits,the
agee
depthmod
el(2serrorba
rs)a
ndtheaccu
mulationrate
(mm/yr)
withthegrey
shad
ingtheaccu
mulationratescalculated
basedon
the2s
errors,tog
ethe
rwithselected
prox
yda
ta:m
agne
tic
suscep
tibility(M
S)plottedwiththeCa
/Bran
dTi/Brratios;the
K/Tiratio;A
xis2of
thePC
Aan
alysison
theXRF
data
set;biog
enic
silic
a(BSi);totalo
rgan
iccarbon
(TOC)
plottedwiththeBr/Srratio;
hydrog
eninde
x(H
I),o
xyge
ninde
x(O
I)an
dtheHI/OIratio;
%Abs
orba
nce/%TO
Cratio.
Fcin
N. Van der Putten et al. / Quaternary Science Reviews 122 (2015) 142e157 145
prospected with hand coring equipment, using a 4 cm diametergouge auger, an excellent tool for coring peat deposits, in order tosurvey the thickness of the deposits and detect continuousorganic sequences suitable for palaeoenvironmental research. TheEstacade sequence was sampled by drilling in two 11.5 cmdiameter CALYPSO PVC tubes. A first tube with a length of 277 cmwas hammered down to a depth of 262 cm. With hand coringequipment deposits around the tube were retrieved in order toliberate it from the surrounding peat so that the tube could belifted. A second tube of 498 cm length was put in the same holeand hammered to a depth of 470 cm, until it became impossible toget it further down. The same procedure was used to liberate andretrieve the second tube. In order tomake sure that the base of thedeposits was attained, the gouge auger was used and pusheddown until it was stopped by a stony impenetrable deposit orbedrock. A sample of about 52 cm long was retrieved in the gougeauger and stored in a half 7.5 cm diameter PVC tube for transport.Slight compaction of the deposits of 5 cm was measured for thefirst tube, no compaction occurred in the second tube.
3.2. Stratigraphy, rockmagnetic and geochemical analyses
In the laboratory, the PVC tubes were spilt into two halves andthe cores were described and photographed in increments of c.20 cm length, in order to construct the picture log. It became clearthat the 52 cm long sequence sampled with the gouge augershowed a nearly complete overlap with the lower parts of thesequence sampled with the CALYPSO tube except for 3 additionalcm. A basal sample of the gouge auger sequence was submittedfor 14C dating. Before subsampling the sequence in the CALYPSOtubes, magnetic susceptibility was measured with 5 mm resolu-tion using a Bartington Instruments Ltd MS2E1 sensor and aTAMISCAN-TS1 automatic conveyer at Lund University, Sweden(Sandgren and Snowball, 2001).
The cores were consequently scanned with an ITRAX XRF CoreScanner from Cox Analytical Systems at the Department ofGeological Sciences, Stockholm University, Sweden, using a Motube set at 30 kV and 25 mAwith a dwell time of 100 s and a stepsize of 5 mm. The elemental data were normalized to the
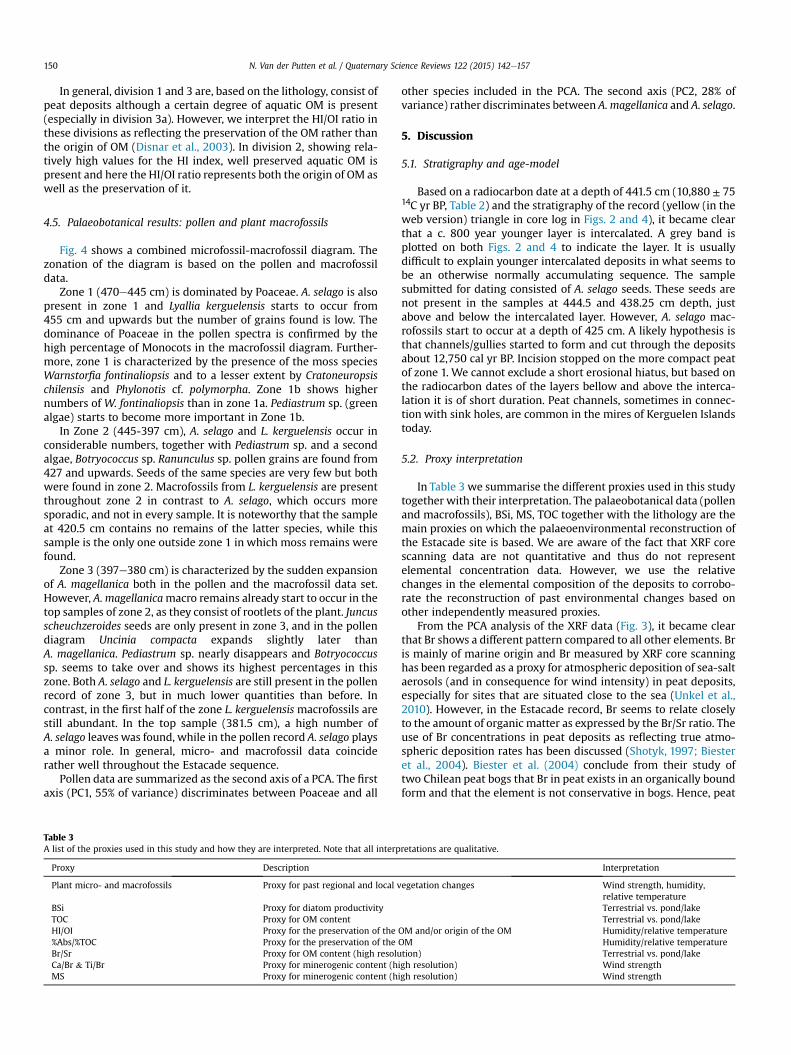
ig. 3. Biplot of the principal component analysis of the major elements (XRF). Per-entage of variance of component 1 and 2 are shown on the axis together with theterpretation of the components.
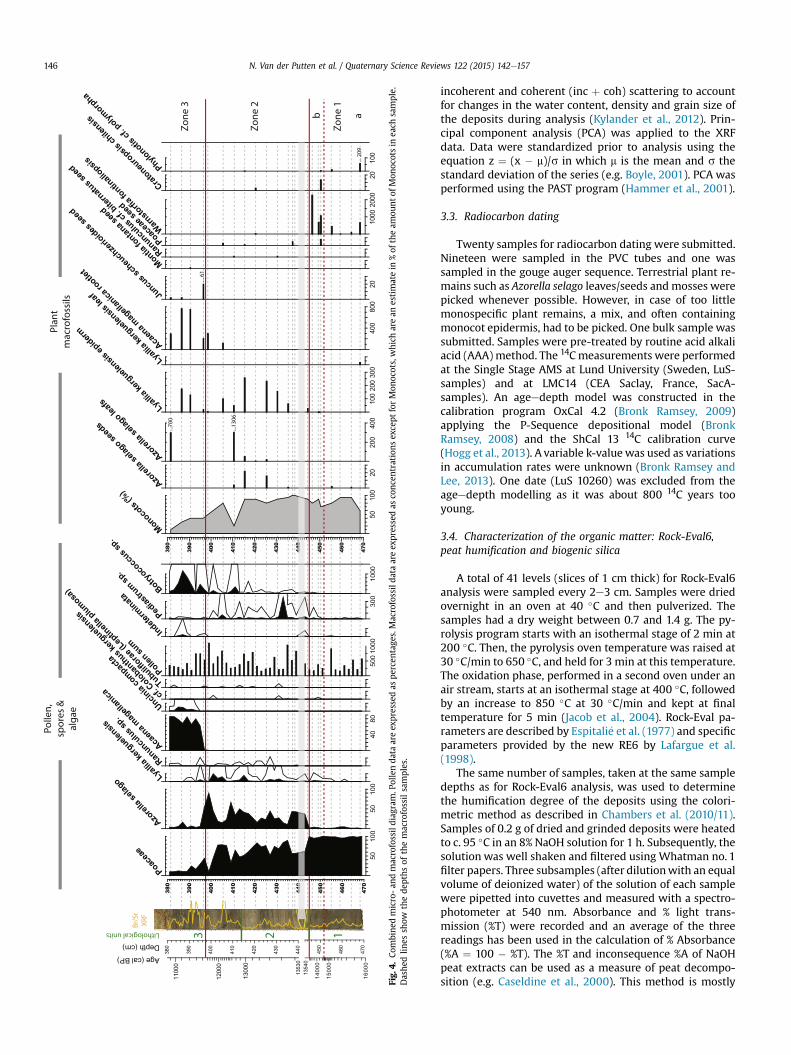
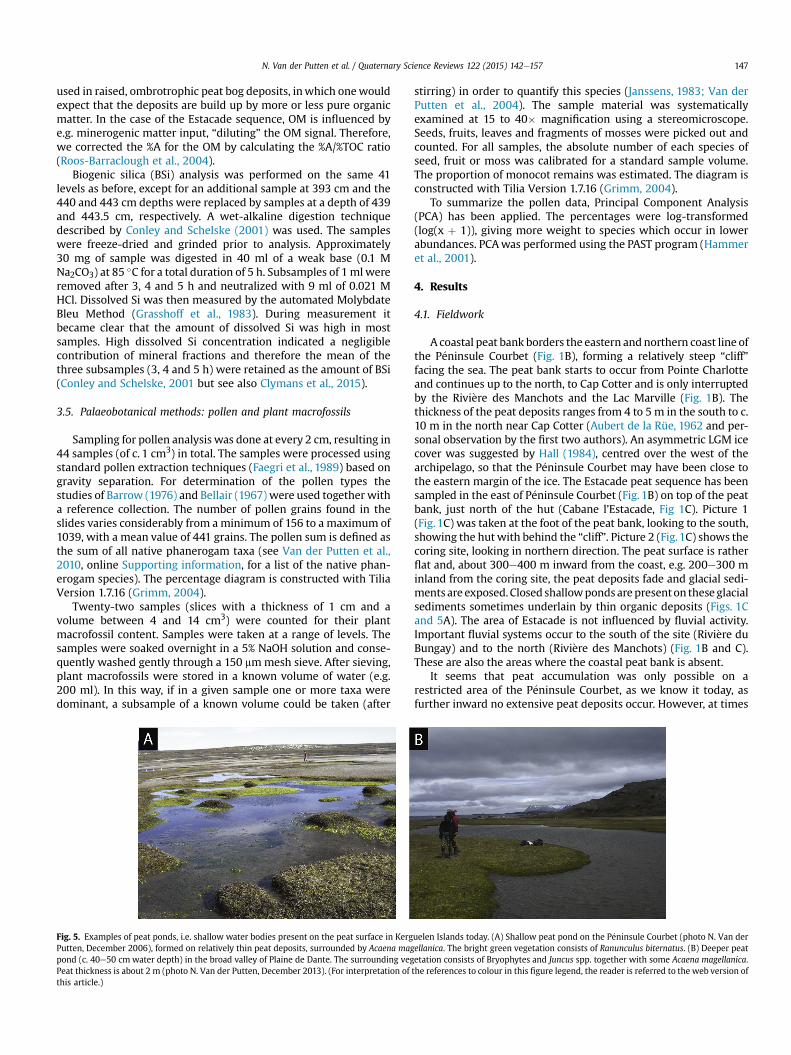
Fig.
4.Co
mbine
dmicro-an
dmacrofossildiag
ram.P
ollenda
taareex
pressedas
percen
tage
s.Macrofossilda
taareex
pressedas
conc
entrations
except
forMon
ocots,which
arean
estimatein
%of
theam
ount
ofMon
ocotsin
each
sample.
Dashe
dlin
essh
owthede
pths
ofthemacrofossilsamples.
N. Van der Putten et al. / Quaternary Science Reviews 122 (2015) 142e157146
incoherent and coherent (inc þ coh) scattering to accountfor changes in the water content, density and grain size ofthe deposits during analysis (Kylander et al., 2012). Prin-cipal component analysis (PCA) was applied to the XRFdata. Data were standardized prior to analysis using theequation z ¼ (x � m)/s in which m is the mean and s thestandard deviation of the series (e.g. Boyle, 2001). PCA wasperformed using the PAST program (Hammer et al., 2001).
3.3. Radiocarbon dating
Twenty samples for radiocarbon dating were submitted.Nineteen were sampled in the PVC tubes and one wassampled in the gouge auger sequence. Terrestrial plant re-mains such as Azorella selago leaves/seeds andmosses werepicked whenever possible. However, in case of too littlemonospecific plant remains, a mix, and often containingmonocot epidermis, had to be picked. One bulk sample wassubmitted. Samples were pre-treated by routine acid alkaliacid (AAA)method. The 14Cmeasurements were performedat the Single Stage AMS at Lund University (Sweden, LuS-samples) and at LMC14 (CEA Saclay, France, SacA-samples). An ageedepth model was constructed in thecalibration program OxCal 4.2 (Bronk Ramsey, 2009)applying the P-Sequence depositional model (BronkRamsey, 2008) and the ShCal 13 14C calibration curve(Hogg et al., 2013). A variable k-value was used as variationsin accumulation rates were unknown (Bronk Ramsey andLee, 2013). One date (LuS 10260) was excluded from theageedepth modelling as it was about 800 14C years tooyoung.
3.4. Characterization of the organic matter: Rock-Eval6,peat humification and biogenic silica
A total of 41 levels (slices of 1 cm thick) for Rock-Eval6analysis were sampled every 2e3 cm. Samples were driedovernight in an oven at 40 �C and then pulverized. Thesamples had a dry weight between 0.7 and 1.4 g. The py-rolysis program starts with an isothermal stage of 2 min at200 �C. Then, the pyrolysis oven temperature was raised at30 �C/min to 650 �C, and held for 3 min at this temperature.The oxidation phase, performed in a second oven under anair stream, starts at an isothermal stage at 400 �C, followedby an increase to 850 �C at 30 �C/min and kept at finaltemperature for 5 min (Jacob et al., 2004). Rock-Eval pa-rameters are described by Espitali�e et al. (1977) and specificparameters provided by the new RE6 by Lafargue et al.(1998).
The same number of samples, taken at the same sampledepths as for Rock-Eval6 analysis, was used to determinethe humification degree of the deposits using the colori-metric method as described in Chambers et al. (2010/11).Samples of 0.2 g of dried and grinded deposits were heatedto c. 95 �C in an 8% NaOH solution for 1 h. Subsequently, thesolution was well shaken and filtered using Whatman no. 1filter papers. Three subsamples (after dilutionwith an equalvolume of deionized water) of the solution of each samplewere pipetted into cuvettes and measured with a spectro-photometer at 540 nm. Absorbance and % light trans-mission (%T) were recorded and an average of the threereadings has been used in the calculation of % Absorbance(%A ¼ 100 � %T). The %T and inconsequence %A of NaOHpeat extracts can be used as a measure of peat decompo-sition (e.g. Caseldine et al., 2000). This method is mostly
N. Van der Putten et al. / Quaternary Science Reviews 122 (2015) 142e157 147
used in raised, ombrotrophic peat bog deposits, inwhich onewouldexpect that the deposits are build up by more or less pure organicmatter. In the case of the Estacade sequence, OM is influenced bye.g. minerogenic matter input, “diluting” the OM signal. Therefore,we corrected the %A for the OM by calculating the %A/%TOC ratio(Roos-Barraclough et al., 2004).
Biogenic silica (BSi) analysis was performed on the same 41levels as before, except for an additional sample at 393 cm and the440 and 443 cm depths were replaced by samples at a depth of 439and 443.5 cm, respectively. A wet-alkaline digestion techniquedescribed by Conley and Schelske (2001) was used. The sampleswere freeze-dried and grinded prior to analysis. Approximately30 mg of sample was digested in 40 ml of a weak base (0.1 MNa2CO3) at 85 �C for a total duration of 5 h. Subsamples of 1mlwereremoved after 3, 4 and 5 h and neutralized with 9 ml of 0.021 MHCl. Dissolved Si was then measured by the automated MolybdateBleu Method (Grasshoff et al., 1983). During measurement itbecame clear that the amount of dissolved Si was high in mostsamples. High dissolved Si concentration indicated a negligiblecontribution of mineral fractions and therefore the mean of thethree subsamples (3, 4 and 5 h) were retained as the amount of BSi(Conley and Schelske, 2001 but see also Clymans et al., 2015).
3.5. Palaeobotanical methods: pollen and plant macrofossils
Sampling for pollen analysis was done at every 2 cm, resulting in44 samples (of c. 1 cm3) in total. The samples were processed usingstandard pollen extraction techniques (Faegri et al., 1989) based ongravity separation. For determination of the pollen types thestudies of Barrow (1976) and Bellair (1967) were used together witha reference collection. The number of pollen grains found in theslides varies considerably from aminimum of 156 to a maximum of1039, with a mean value of 441 grains. The pollen sum is defined asthe sum of all native phanerogam taxa (see Van der Putten et al.,2010, online Supporting information, for a list of the native phan-erogam species). The percentage diagram is constructed with TiliaVersion 1.7.16 (Grimm, 2004).
Twenty-two samples (slices with a thickness of 1 cm and avolume between 4 and 14 cm3) were counted for their plantmacrofossil content. Samples were taken at a range of levels. Thesamples were soaked overnight in a 5% NaOH solution and conse-quently washed gently through a 150 mmmesh sieve. After sieving,plant macrofossils were stored in a known volume of water (e.g.200 ml). In this way, if in a given sample one or more taxa weredominant, a subsample of a known volume could be taken (after
Fig. 5. Examples of peat ponds, i.e. shallow water bodies present on the peat surface in KergPutten, December 2006), formed on relatively thin peat deposits, surrounded by Acaena magpond (c. 40e50 cm water depth) in the broad valley of Plaine de Dante. The surrounding vegPeat thickness is about 2 m (photo N. Van der Putten, December 2013). (For interpretation ofthis article.)
stirring) in order to quantify this species (Janssens, 1983; Van derPutten et al., 2004). The sample material was systematicallyexamined at 15 to 40� magnification using a stereomicroscope.Seeds, fruits, leaves and fragments of mosses were picked out andcounted. For all samples, the absolute number of each species ofseed, fruit or moss was calibrated for a standard sample volume.The proportion of monocot remains was estimated. The diagram isconstructed with Tilia Version 1.7.16 (Grimm, 2004).
To summarize the pollen data, Principal Component Analysis(PCA) has been applied. The percentages were log-transformed(log(x þ 1)), giving more weight to species which occur in lowerabundances. PCAwas performed using the PAST program (Hammeret al., 2001).
4. Results
4.1. Fieldwork
A coastal peat bank borders the eastern andnorthern coast line ofthe P�eninsule Courbet (Fig. 1B), forming a relatively steep “cliff”facing the sea. The peat bank starts to occur from Pointe Charlotteand continues up to the north, to Cap Cotter and is only interruptedby the Rivi�ere des Manchots and the Lac Marville (Fig. 1B). Thethickness of the peat deposits ranges from 4 to 5 m in the south to c.10 m in the north near Cap Cotter (Aubert de la Rüe, 1962 and per-sonal observation by the first two authors). An asymmetric LGM icecover was suggested by Hall (1984), centred over the west of thearchipelago, so that the P�eninsule Courbet may have been close tothe eastern margin of the ice. The Estacade peat sequence has beensampled in the east of P�eninsule Courbet (Fig. 1B) on top of the peatbank, just north of the hut (Cabane l’Estacade, Fig 1C). Picture 1(Fig. 1C) was taken at the foot of the peat bank, looking to the south,showing the hutwith behind the “cliff”. Picture 2 (Fig. 1C) shows thecoring site, looking in northern direction. The peat surface is ratherflat and, about 300e400 m inward from the coast, e.g. 200e300 minland from the coring site, the peat deposits fade and glacial sedi-ments are exposed.Closed shallowpondsarepresenton these glacialsediments sometimes underlain by thin organic deposits (Figs. 1Cand 5A). The area of Estacade is not influenced by fluvial activity.Important fluvial systems occur to the south of the site (Rivi�ere duBungay) and to the north (Rivi�ere des Manchots) (Fig. 1B and C).These are also the areas where the coastal peat bank is absent.
It seems that peat accumulation was only possible on arestricted area of the P�eninsule Courbet, as we know it today, asfurther inward no extensive peat deposits occur. However, at times
uelen Islands today. (A) Shallow peat pond on the P�eninsule Courbet (photo N. Van derellanica. The bright green vegetation consists of Ranunculus biternatus. (B) Deeper peatetation consists of Bryophytes and Juncus spp. together with some Acaena magellanica.the references to colour in this figure legend, the reader is referred to the web version of
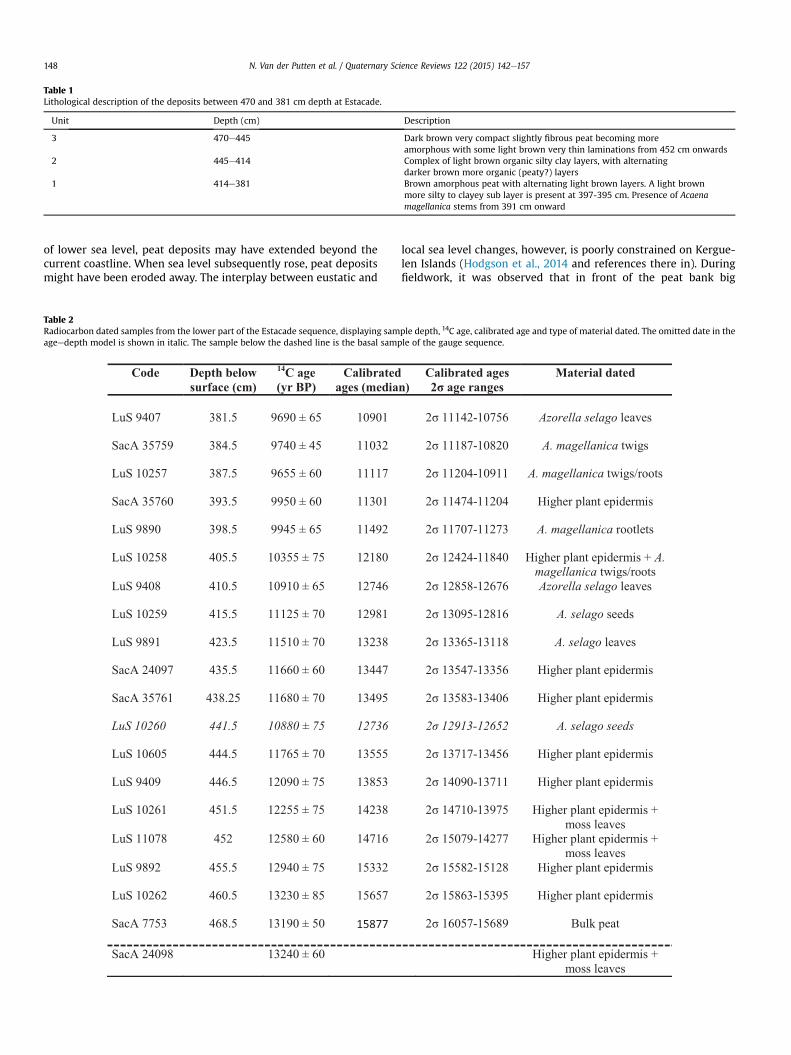
Table 1Lithological description of the deposits between 470 and 381 cm depth at Estacade.
Unit Depth (cm) Description
3 470e445 Dark brown very compact slightly fibrous peat becoming moreamorphous with some light brown very thin laminations from 452 cm onwards
2 445e414 Complex of light brown organic silty clay layers, with alternatingdarker brown more organic (peaty?) layers
1 414e381 Brown amorphous peat with alternating light brown layers. A light brownmore silty to clayey sub layer is present at 397-395 cm. Presence of Acaenamagellanica stems from 391 cm onward
N. Van der Putten et al. / Quaternary Science Reviews 122 (2015) 142e157148
of lower sea level, peat deposits may have extended beyond thecurrent coastline. When sea level subsequently rose, peat depositsmight have been eroded away. The interplay between eustatic and
Table 2Radiocarbon dated samples from the lower part of the Estacade sequence, displaying samageedepth model is shown in italic. The sample below the dashed line is the basal samp
local sea level changes, however, is poorly constrained on Kergue-len Islands (Hodgson et al., 2014 and references there in). Duringfieldwork, it was observed that in front of the peat bank big
ple depth, 14C age, calibrated age and type of material dated. The omitted date in thele of the gauge sequence.
N. Van der Putten et al. / Quaternary Science Reviews 122 (2015) 142e157 149
rounded pebbles were present, probably representing an ancientbeach level. The altitude of this ancient beach is about 2e3 m asl,suggesting a restricted post-glacial isostatic rebound. One couldimagine that at least part of the peat deposits was cut by sea erosionduring the time that this beach was active. Interesting is that thepeat bank kept on accumulating and still accumulates today. Wewant to stress that the term “peat bank” here only refers to itsmorphological aspect (a “cliff”) and should not be confused withmoss peat banks as known from the Antarctic Peninsula and SouthGeorgia (Van der Putten et al., 2009), a semi-ombrotrophic peat bogdominated by two moss species (Polytrichum strictum and Chori-sondontium aciphyllum). Such moss peat banks do not occur onKerguelen Islands. The vegetation on the Estacade site today islargely dominated by Acaena magellanica (Fig. 1C, picture 2).However, the peat bank bordering the coast line of the P�eninsuleCourbet is considered to have been fed chiefly by atmosphericdeposition right after its formation, with limited contribution ofseepage water.
4.2. Stratigraphy
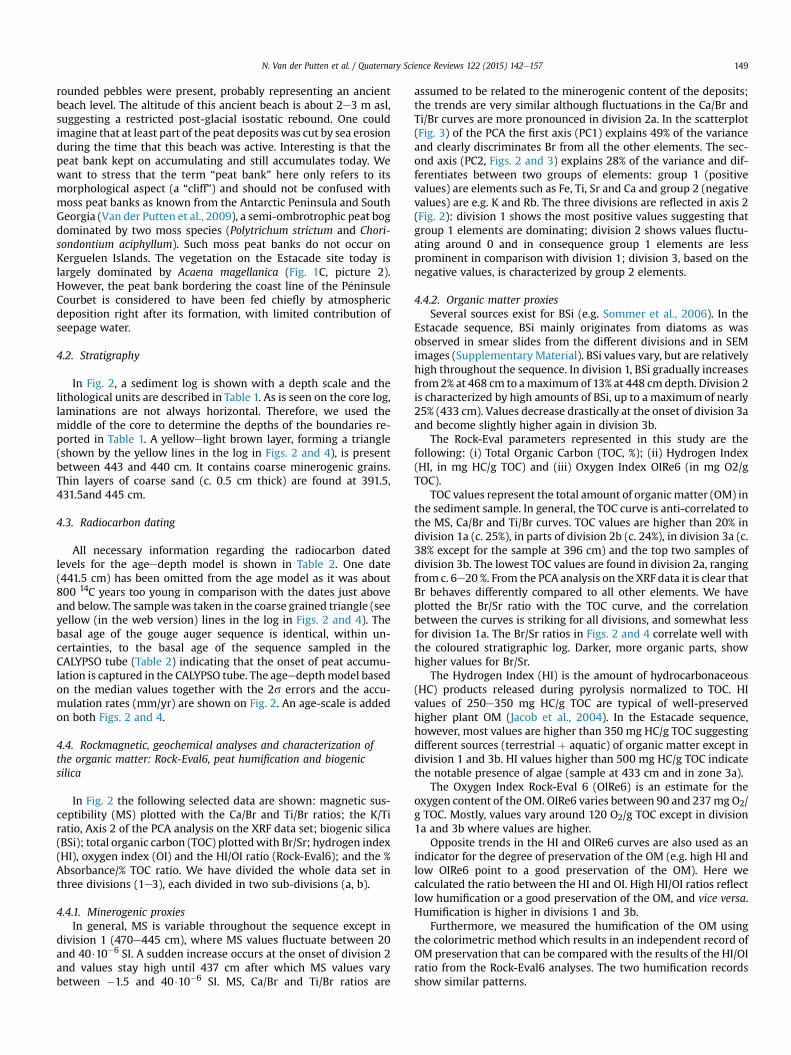
In Fig. 2, a sediment log is shown with a depth scale and thelithological units are described in Table 1. As is seen on the core log,laminations are not always horizontal. Therefore, we used themiddle of the core to determine the depths of the boundaries re-ported in Table 1. A yellowelight brown layer, forming a triangle(shown by the yellow lines in the log in Figs. 2 and 4), is presentbetween 443 and 440 cm. It contains coarse minerogenic grains.Thin layers of coarse sand (c. 0.5 cm thick) are found at 391.5,431.5and 445 cm.
4.3. Radiocarbon dating
All necessary information regarding the radiocarbon datedlevels for the ageedepth model is shown in Table 2. One date(441.5 cm) has been omitted from the age model as it was about800 14C years too young in comparison with the dates just aboveand below. The samplewas taken in the coarse grained triangle (seeyellow (in the web version) lines in the log in Figs. 2 and 4). Thebasal age of the gouge auger sequence is identical, within un-certainties, to the basal age of the sequence sampled in theCALYPSO tube (Table 2) indicating that the onset of peat accumu-lation is captured in the CALYPSO tube. The ageedepthmodel basedon the median values together with the 2s errors and the accu-mulation rates (mm/yr) are shown on Fig. 2. An age-scale is addedon both Figs. 2 and 4.
4.4. Rockmagnetic, geochemical analyses and characterization ofthe organic matter: Rock-Eval6, peat humification and biogenicsilica
In Fig. 2 the following selected data are shown: magnetic sus-ceptibility (MS) plotted with the Ca/Br and Ti/Br ratios; the K/Tiratio, Axis 2 of the PCA analysis on the XRF data set; biogenic silica(BSi); total organic carbon (TOC) plottedwith Br/Sr; hydrogen index(HI), oxygen index (OI) and the HI/OI ratio (Rock-Eval6); and the %Absorbance/% TOC ratio. We have divided the whole data set inthree divisions (1e3), each divided in two sub-divisions (a, b).
4.4.1. Minerogenic proxiesIn general, MS is variable throughout the sequence except in
division 1 (470e445 cm), where MS values fluctuate between 20and 40$10�6 SI. A sudden increase occurs at the onset of division 2and values stay high until 437 cm after which MS values varybetween �1.5 and 40$10�6 SI. MS, Ca/Br and Ti/Br ratios are
assumed to be related to the minerogenic content of the deposits;the trends are very similar although fluctuations in the Ca/Br andTi/Br curves are more pronounced in division 2a. In the scatterplot(Fig. 3) of the PCA the first axis (PC1) explains 49% of the varianceand clearly discriminates Br from all the other elements. The sec-ond axis (PC2, Figs. 2 and 3) explains 28% of the variance and dif-ferentiates between two groups of elements: group 1 (positivevalues) are elements such as Fe, Ti, Sr and Ca and group 2 (negativevalues) are e.g. K and Rb. The three divisions are reflected in axis 2(Fig. 2): division 1 shows the most positive values suggesting thatgroup 1 elements are dominating; division 2 shows values fluctu-ating around 0 and in consequence group 1 elements are lessprominent in comparison with division 1; division 3, based on thenegative values, is characterized by group 2 elements.
4.4.2. Organic matter proxiesSeveral sources exist for BSi (e.g. Sommer et al., 2006). In the
Estacade sequence, BSi mainly originates from diatoms as wasobserved in smear slides from the different divisions and in SEMimages (Supplementary Material). BSi values vary, but are relativelyhigh throughout the sequence. In division 1, BSi gradually increasesfrom2% at 468 cm to amaximumof 13% at 448 cm depth. Division 2is characterized by high amounts of BSi, up to a maximum of nearly25% (433 cm). Values decrease drastically at the onset of division 3aand become slightly higher again in division 3b.
The Rock-Eval parameters represented in this study are thefollowing: (i) Total Organic Carbon (TOC, %); (ii) Hydrogen Index(HI, in mg HC/g TOC) and (iii) Oxygen Index OIRe6 (in mg O2/gTOC).
TOC values represent the total amount of organic matter (OM) inthe sediment sample. In general, the TOC curve is anti-correlated tothe MS, Ca/Br and Ti/Br curves. TOC values are higher than 20% indivision 1a (c. 25%), in parts of division 2b (c. 24%), in division 3a (c.38% except for the sample at 396 cm) and the top two samples ofdivision 3b. The lowest TOC values are found in division 2a, rangingfrom c. 6e20 %. From the PCA analysis on the XRF data it is clear thatBr behaves differently compared to all other elements. We haveplotted the Br/Sr ratio with the TOC curve, and the correlationbetween the curves is striking for all divisions, and somewhat lessfor division 1a. The Br/Sr ratios in Figs. 2 and 4 correlate well withthe coloured stratigraphic log. Darker, more organic parts, showhigher values for Br/Sr.
The Hydrogen Index (HI) is the amount of hydrocarbonaceous(HC) products released during pyrolysis normalized to TOC. HIvalues of 250e350 mg HC/g TOC are typical of well-preservedhigher plant OM (Jacob et al., 2004). In the Estacade sequence,however, most values are higher than 350 mg HC/g TOC suggestingdifferent sources (terrestrial þ aquatic) of organic matter except indivision 1 and 3b. HI values higher than 500 mg HC/g TOC indicatethe notable presence of algae (sample at 433 cm and in zone 3a).
The Oxygen Index Rock-Eval 6 (OIRe6) is an estimate for theoxygen content of the OM. OIRe6 varies between 90 and 237mg O2/g TOC. Mostly, values vary around 120 O2/g TOC except in division1a and 3b where values are higher.
Opposite trends in the HI and OIRe6 curves are also used as anindicator for the degree of preservation of the OM (e.g. high HI andlow OIRe6 point to a good preservation of the OM). Here wecalculated the ratio between the HI and OI. High HI/OI ratios reflectlow humification or a good preservation of the OM, and vice versa.Humification is higher in divisions 1 and 3b.
Furthermore, we measured the humification of the OM usingthe colorimetric method which results in an independent record ofOM preservation that can be compared with the results of the HI/OIratio from the Rock-Eval6 analyses. The two humification recordsshow similar patterns.
N. Van der Putten et al. / Quaternary Science Reviews 122 (2015) 142e157150
In general, division 1 and 3 are, based on the lithology, consist ofpeat deposits although a certain degree of aquatic OM is present(especially in division 3a). However, we interpret the HI/OI ratio inthese divisions as reflecting the preservation of the OM rather thanthe origin of OM (Disnar et al., 2003). In division 2, showing rela-tively high values for the HI index, well preserved aquatic OM ispresent and here the HI/OI ratio represents both the origin of OM aswell as the preservation of it.
4.5. Palaeobotanical results: pollen and plant macrofossils
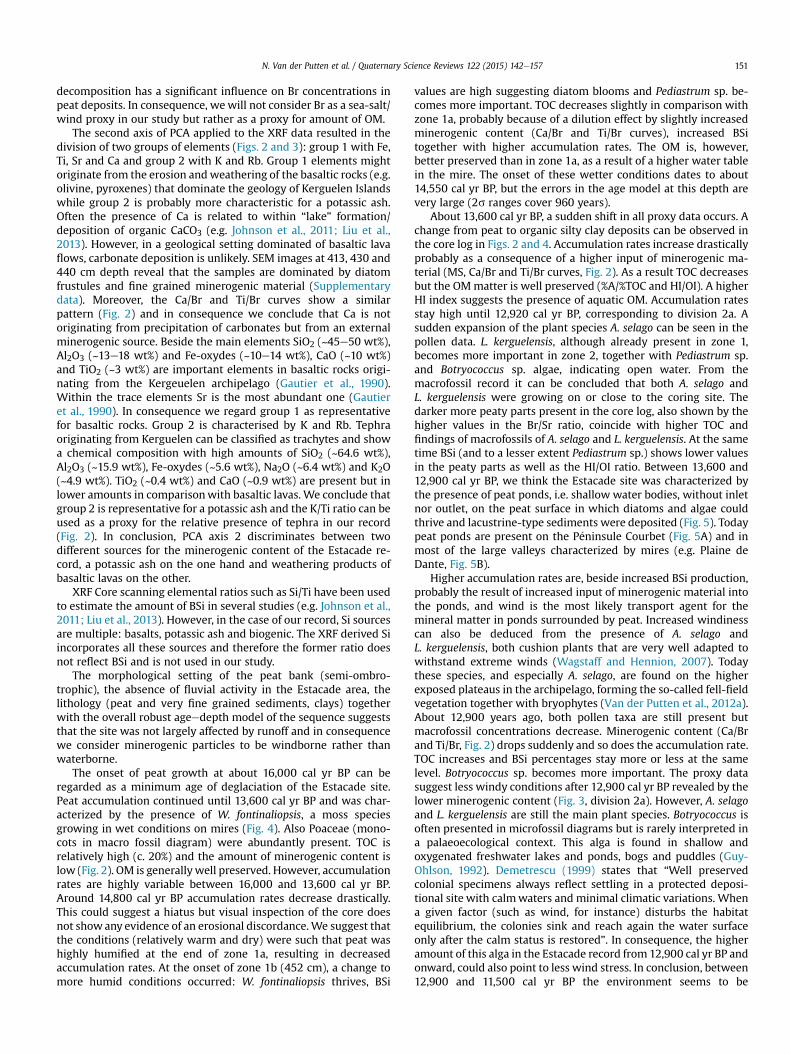
Fig. 4 shows a combined microfossil-macrofossil diagram. Thezonation of the diagram is based on the pollen and macrofossildata.
Zone 1 (470e445 cm) is dominated by Poaceae. A. selago is alsopresent in zone 1 and Lyallia kerguelensis starts to occur from455 cm and upwards but the number of grains found is low. Thedominance of Poaceae in the pollen spectra is confirmed by thehigh percentage of Monocots in the macrofossil diagram. Further-more, zone 1 is characterized by the presence of the moss speciesWarnstorfia fontinaliopsis and to a lesser extent by Cratoneuropsischilensis and Phylonotis cf. polymorpha. Zone 1b shows highernumbers of W. fontinaliopsis than in zone 1a. Pediastrum sp. (greenalgae) starts to become more important in Zone 1b.
In Zone 2 (445-397 cm), A. selago and L. kerguelensis occur inconsiderable numbers, together with Pediastrum sp. and a secondalgae, Botryococcus sp. Ranunculus sp. pollen grains are found from427 and upwards. Seeds of the same species are very few but bothwere found in zone 2. Macrofossils from L. kerguelensis are presentthroughout zone 2 in contrast to A. selago, which occurs moresporadic, and not in every sample. It is noteworthy that the sampleat 420.5 cm contains no remains of the latter species, while thissample is the only one outside zone 1 in which moss remains werefound.
Zone 3 (397e380 cm) is characterized by the sudden expansionof A. magellanica both in the pollen and the macrofossil data set.However, A. magellanicamacro remains already start to occur in thetop samples of zone 2, as they consist of rootlets of the plant. Juncusscheuchzeroides seeds are only present in zone 3, and in the pollendiagram Uncinia compacta expands slightly later thanA. magellanica. Pediastrum sp. nearly disappears and Botryococcussp. seems to take over and shows its highest percentages in thiszone. Both A. selago and L. kerguelensis are still present in the pollenrecord of zone 3, but in much lower quantities than before. Incontrast, in the first half of the zone L. kerguelensismacrofossils arestill abundant. In the top sample (381.5 cm), a high number ofA. selago leaves was found, while in the pollen record A. selago playsa minor role. In general, micro- and macrofossil data coinciderather well throughout the Estacade sequence.
Pollen data are summarized as the second axis of a PCA. The firstaxis (PC1, 55% of variance) discriminates between Poaceae and all
Table 3A list of the proxies used in this study and how they are interpreted. Note that all interp
Proxy Description
Plant micro- and macrofossils Proxy for past regional and local v
BSi Proxy for diatom productivityTOC Proxy for OM contentHI/OI Proxy for the preservation of the%Abs/%TOC Proxy for the preservation of theBr/Sr Proxy for OM content (high resoluCa/Br & Ti/Br Proxy for minerogenic content (hMS Proxy for minerogenic content (h
other species included in the PCA. The second axis (PC2, 28% ofvariance) rather discriminates between A. magellanica and A. selago.
5. Discussion
5.1. Stratigraphy and age-model
Based on a radiocarbon date at a depth of 441.5 cm (10,880 ± 7514C yr BP, Table 2) and the stratigraphy of the record (yellow (in theweb version) triangle in core log in Figs. 2 and 4), it became clearthat a c. 800 year younger layer is intercalated. A grey band isplotted on both Figs. 2 and 4 to indicate the layer. It is usuallydifficult to explain younger intercalated deposits in what seems tobe an otherwise normally accumulating sequence. The samplesubmitted for dating consisted of A. selago seeds. These seeds arenot present in the samples at 444.5 and 438.25 cm depth, justabove and below the intercalated layer. However, A. selago mac-rofossils start to occur at a depth of 425 cm. A likely hypothesis isthat channels/gullies started to form and cut through the depositsabout 12,750 cal yr BP. Incision stopped on the more compact peatof zone 1. We cannot exclude a short erosional hiatus, but based onthe radiocarbon dates of the layers bellow and above the interca-lation it is of short duration. Peat channels, sometimes in connec-tion with sink holes, are common in the mires of Kerguelen Islandstoday.
5.2. Proxy interpretation
In Table 3 we summarise the different proxies used in this studytogether with their interpretation. The palaeobotanical data (pollenand macrofossils), BSi, MS, TOC together with the lithology are themain proxies on which the palaeoenvironmental reconstruction ofthe Estacade site is based. We are aware of the fact that XRF corescanning data are not quantitative and thus do not representelemental concentration data. However, we use the relativechanges in the elemental composition of the deposits to corrobo-rate the reconstruction of past environmental changes based onother independently measured proxies.
From the PCA analysis of the XRF data (Fig. 3), it became clearthat Br shows a different pattern compared to all other elements. Bris mainly of marine origin and Br measured by XRF core scanninghas been regarded as a proxy for atmospheric deposition of sea-saltaerosols (and in consequence for wind intensity) in peat deposits,especially for sites that are situated close to the sea (Unkel et al.,2010). However, in the Estacade record, Br seems to relate closelyto the amount of organic matter as expressed by the Br/Sr ratio. Theuse of Br concentrations in peat deposits as reflecting true atmo-spheric deposition rates has been discussed (Shotyk, 1997; Biesteret al., 2004). Biester et al. (2004) conclude from their study oftwo Chilean peat bogs that Br in peat exists in an organically boundform and that the element is not conservative in bogs. Hence, peat
retations are qualitative.
Interpretation
egetation changes Wind strength, humidity,relative temperatureTerrestrial vs. pond/lakeTerrestrial vs. pond/lake
OM and/or origin of the OM Humidity/relative temperatureOM Humidity/relative temperaturetion) Terrestrial vs. pond/lakeigh resolution) Wind strengthigh resolution) Wind strength
N. Van der Putten et al. / Quaternary Science Reviews 122 (2015) 142e157 151
decomposition has a significant influence on Br concentrations inpeat deposits. In consequence, wewill not consider Br as a sea-salt/wind proxy in our study but rather as a proxy for amount of OM.
The second axis of PCA applied to the XRF data resulted in thedivision of two groups of elements (Figs. 2 and 3): group 1 with Fe,Ti, Sr and Ca and group 2 with K and Rb. Group 1 elements mightoriginate from the erosion andweathering of the basaltic rocks (e.g.olivine, pyroxenes) that dominate the geology of Kerguelen Islandswhile group 2 is probably more characteristic for a potassic ash.Often the presence of Ca is related to within “lake” formation/deposition of organic CaCO3 (e.g. Johnson et al., 2011; Liu et al.,2013). However, in a geological setting dominated of basaltic lavaflows, carbonate deposition is unlikely. SEM images at 413, 430 and440 cm depth reveal that the samples are dominated by diatomfrustules and fine grained minerogenic material (Supplementarydata). Moreover, the Ca/Br and Ti/Br curves show a similarpattern (Fig. 2) and in consequence we conclude that Ca is notoriginating from precipitation of carbonates but from an externalminerogenic source. Beside the main elements SiO2 (~45e50 wt%),Al2O3 (~13e18 wt%) and Fe-oxydes (~10e14 wt%), CaO (~10 wt%)and TiO2 (~3 wt%) are important elements in basaltic rocks origi-nating from the Kergeuelen archipelago (Gautier et al., 1990).Within the trace elements Sr is the most abundant one (Gautieret al., 1990). In consequence we regard group 1 as representativefor basaltic rocks. Group 2 is characterised by K and Rb. Tephraoriginating from Kerguelen can be classified as trachytes and showa chemical composition with high amounts of SiO2 (~64.6 wt%),Al2O3 (~15.9 wt%), Fe-oxydes (~5.6 wt%), Na2O (~6.4 wt%) and K2O(~4.9 wt%). TiO2 (~0.4 wt%) and CaO (~0.9 wt%) are present but inlower amounts in comparisonwith basaltic lavas. We conclude thatgroup 2 is representative for a potassic ash and the K/Ti ratio can beused as a proxy for the relative presence of tephra in our record(Fig. 2). In conclusion, PCA axis 2 discriminates between twodifferent sources for the minerogenic content of the Estacade re-cord, a potassic ash on the one hand and weathering products ofbasaltic lavas on the other.
XRF Core scanning elemental ratios such as Si/Ti have been usedto estimate the amount of BSi in several studies (e.g. Johnson et al.,2011; Liu et al., 2013). However, in the case of our record, Si sourcesare multiple: basalts, potassic ash and biogenic. The XRF derived Siincorporates all these sources and therefore the former ratio doesnot reflect BSi and is not used in our study.
The morphological setting of the peat bank (semi-ombro-trophic), the absence of fluvial activity in the Estacade area, thelithology (peat and very fine grained sediments, clays) togetherwith the overall robust ageedepth model of the sequence suggeststhat the site was not largely affected by runoff and in consequencewe consider minerogenic particles to be windborne rather thanwaterborne.
The onset of peat growth at about 16,000 cal yr BP can beregarded as a minimum age of deglaciation of the Estacade site.Peat accumulation continued until 13,600 cal yr BP and was char-acterized by the presence of W. fontinaliopsis, a moss speciesgrowing in wet conditions on mires (Fig. 4). Also Poaceae (mono-cots in macro fossil diagram) were abundantly present. TOC isrelatively high (c. 20%) and the amount of minerogenic content islow (Fig. 2). OM is generallywell preserved. However, accumulationrates are highly variable between 16,000 and 13,600 cal yr BP.Around 14,800 cal yr BP accumulation rates decrease drastically.This could suggest a hiatus but visual inspection of the core doesnot showany evidence of an erosional discordance.We suggest thatthe conditions (relatively warm and dry) were such that peat washighly humified at the end of zone 1a, resulting in decreasedaccumulation rates. At the onset of zone 1b (452 cm), a change tomore humid conditions occurred: W. fontinaliopsis thrives, BSi
values are high suggesting diatom blooms and Pediastrum sp. be-comes more important. TOC decreases slightly in comparison withzone 1a, probably because of a dilution effect by slightly increasedminerogenic content (Ca/Br and Ti/Br curves), increased BSitogether with higher accumulation rates. The OM is, however,better preserved than in zone 1a, as a result of a higher water tablein the mire. The onset of these wetter conditions dates to about14,550 cal yr BP, but the errors in the age model at this depth arevery large (2s ranges cover 960 years).
About 13,600 cal yr BP, a sudden shift in all proxy data occurs. Achange from peat to organic silty clay deposits can be observed inthe core log in Figs. 2 and 4. Accumulation rates increase drasticallyprobably as a consequence of a higher input of minerogenic ma-terial (MS, Ca/Br and Ti/Br curves, Fig. 2). As a result TOC decreasesbut the OMmatter is well preserved (%A/%TOC and HI/OI). A higherHI index suggests the presence of aquatic OM. Accumulation ratesstay high until 12,920 cal yr BP, corresponding to division 2a. Asudden expansion of the plant species A. selago can be seen in thepollen data. L. kerguelensis, although already present in zone 1,becomes more important in zone 2, together with Pediastrum sp.and Botryococcus sp. algae, indicating open water. From themacrofossil record it can be concluded that both A. selago andL. kerguelensis were growing on or close to the coring site. Thedarker more peaty parts present in the core log, also shown by thehigher values in the Br/Sr ratio, coincide with higher TOC andfindings of macrofossils of A. selago and L. kerguelensis. At the sametime BSi (and to a lesser extent Pediastrum sp.) shows lower valuesin the peaty parts as well as the HI/OI ratio. Between 13,600 and12,900 cal yr BP, we think the Estacade site was characterized bythe presence of peat ponds, i.e. shallow water bodies, without inletnor outlet, on the peat surface in which diatoms and algae couldthrive and lacustrine-type sediments were deposited (Fig. 5). Todaypeat ponds are present on the P�eninsule Courbet (Fig. 5A) and inmost of the large valleys characterized by mires (e.g. Plaine deDante, Fig. 5B).
Higher accumulation rates are, beside increased BSi production,probably the result of increased input of minerogenic material intothe ponds, and wind is the most likely transport agent for themineral matter in ponds surrounded by peat. Increased windinesscan also be deduced from the presence of A. selago andL. kerguelensis, both cushion plants that are very well adapted towithstand extreme winds (Wagstaff and Hennion, 2007). Todaythese species, and especially A. selago, are found on the higherexposed plateaus in the archipelago, forming the so-called fell-fieldvegetation together with bryophytes (Van der Putten et al., 2012a).About 12,900 years ago, both pollen taxa are still present butmacrofossil concentrations decrease. Minerogenic content (Ca/Brand Ti/Br, Fig. 2) drops suddenly and so does the accumulation rate.TOC increases and BSi percentages stay more or less at the samelevel. Botryococcus sp. becomes more important. The proxy datasuggest less windy conditions after 12,900 cal yr BP revealed by thelower minerogenic content (Fig. 3, division 2a). However, A. selagoand L. kerguelensis are still the main plant species. Botryococcus isoften presented in microfossil diagrams but is rarely interpreted ina palaeoecological context. This alga is found in shallow andoxygenated freshwater lakes and ponds, bogs and puddles (Guy-Ohlson, 1992). Demetrescu (1999) states that “Well preservedcolonial specimens always reflect settling in a protected deposi-tional site with calmwaters and minimal climatic variations. Whena given factor (such as wind, for instance) disturbs the habitatequilibrium, the colonies sink and reach again the water surfaceonly after the calm status is restored”. In consequence, the higheramount of this alga in the Estacade record from 12,900 cal yr BP andonward, could also point to less wind stress. In conclusion, between12,900 and 11,500 cal yr BP the environment seems to be
N. Van der Putten et al. / Quaternary Science Reviews 122 (2015) 142e157152
characterized by, relatively speaking, less windy, drier and/orwarmer conditions. It may be that the climatic conditions becamemore seasonal and that the ponds dried out during summers,resulting in a possible temporary colonisation by higher plantsduring summer and hence higher “terrestrial” OM.
The period between 11,500 and 10,900 cal yr BP is characterizedby the sudden expansion of A. magellanica, in the pollen as well asin the macrofossil data. The rootlets of this species are alreadypresent c. 5 cm lower. Somewhat later, at about 11,350 cal yr BP U.compacta occurs for the first time in the Estacade record. Bothspecies grow in sheltered habitats. Young and Schofield (1973)regarded these species as warm “lowland” species, while theoccurrence of A. selago is evidence for cold “upland” conditions. In acomparison between pollen data and macrofossil data, Van derPutten et al. (2012b) concluded that such an “upland-lowlandprinciple” is difficult to apply for sub-Antarctic palaeoclimatic in-terpretations, at least for the Holocene period. However, for the LastTermination with its more pronounced climatic changes, thisprinciple seems to be valid based on the shift from an Azorelladominated period to an Acaena dominated period at 11,500 cal yrBP. In this context it is noteworthy that the onset of the occurrenceof Acaena in Core 2 (Port Douzi�eme, Presqu’île Ronarch, Fig. 1B) inYoung and Schofield (1973), after calibration of their initial radio-carbon dates and interpolation between the dates, can be estimatedto about 11,600 cal yr BP, coinciding with the onset in the Estacaderecord.
Based on the geophysical and geochemical data (Fig. 2), theperiod between 11,650 and 10,900 cal yr BP can be subdivided intwo sub-periods (divisions 3a and b, Fig. 2). The onset of division 3ais characterized by a sudden drop in BSi, while TOC shows thehighest values of the whole record. Accumulation rates increase,but here it seems not to be related to increased minerogenic input.The proxy data point to drier and more terrestrial conditions, butwith good preservation of the organic matter and wet enoughconditions for Botryococcus sp. to bloom. Pediastrum sp., however,nearly disappears suggesting that the peat pond milieu had ceasedat that time. From 11,225 cal yr BP onwards TOC decreases. Thepreservation of the OM is rather bad as can be seen in both the HI/OI and the %Abs/%TOC ratios. BSi increases but values stay wellbelow the values measured before 11,650 cal yr BP. It seems that arather well oxidized peat was formed 11,225 cal yr BP, with still wetenough conditions for Botryococcus and diatoms to bloom. Inter-esting is, that from that time onward, cross sections of Acaena twigscan be seen in the core, which are not present before. Maybe Acaenastarted to grow around the site at the start of the Holocene(11,500 cal yr BP) due to warmer (drier) conditions but invaded thesite itself somewhat later (11,225 cal yr BP). One can imagine thatpeat, formed by this woody dwarf shrub with a dense interlacingtwig and root system, results in a more oxidized peat than Azorellapeat.
The second axis of PCA applied to the XRF data discriminatesbetween two groups of elements (Figs. 2 and 3): group 1 with Fe, Ti,Sr and Ca and group 2 with K and Rb. Group 1 elements mightoriginate from the erosion and weathering of the basaltic rockswhile group 2 is more characteristic for a potassic ash. Group 1 isvery prominent between 16,000 and 13,600 cal yr BP and to a lesserextent also between 13,600 and 11,650 cal yr BP. From c.11,650 cal yr BP, elements of group 2 become prominent (Fig. 2). Thesecond axis, therefore, might reflect a change in source area of theminerogenic particles in our record. One could imagine that, duringdeglaciation of Kerguelen Islands, source areas for fine grainedmineral particles, originating from erosion of basaltic bedrock,greatly expanded as a result of retreating glaciers. Although lessminerogenic material is present before 13,600 cal yr BP it seemsthat it is dominated by the basaltic component (group 1). Between
13,600 and 11,650 cal yr BP, both components (basaltic and ash) addto the minerogenic content. From 11,650 cal yr BP onward, the el-ements referring to a potassic ash becomemore important. By thendeglaciated areas were covered by vegetation, stabilizing soils anddiminishing the source area for basaltic minerogenics, a processthat probably already started earlier. The presence of tephra in peatdeposits from the Kerguelen archipelago is not straightforwardrelated to volcanic eruptions. Reworked ash deposits are abundanton the archipelago in some cases even forming dunes. One has totake into account that ash is transported by wind constantly andthat it is sometimes difficult to distinguish between a “real” tephralayer, resulting from a volcanic eruption, and a tephra depositresulting from the reworking of tephra related to older eruptions.
5.3. Palaeoenvironmental and climatic reconstruction
5.3.1. Climatic reconstruction of Kerguelen Islands and comparisonwith the EDC ice core
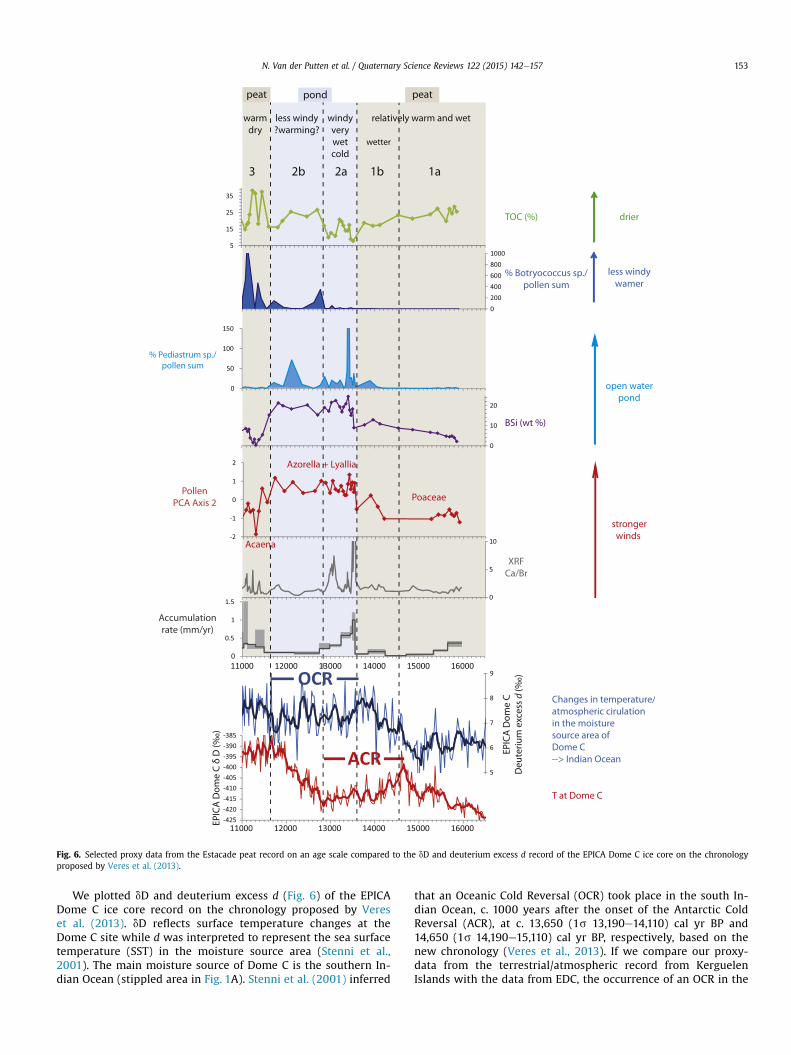
In Fig. 6, we present selected proxy data of the Estacade recordon an age scale and show the climatic interpretation of the data.
The onset of peat growth at the Estacade site 16,000 cal yr BPcoincides with the post-LGM warming in Antarctica, which alreadystarted 18,350 cal yr BP (EPICA Dome C ice core, Veres et al., 2013).Both temperature and effective precipitation (precipitation e
evapotranspiration) were high enough to allow plants to expandfrom their LGM-refugia (Van der Putten et al., 2010) and to providethe humid conditions for peat to form and be preserved. TOC is highand BSi gradually increases. Vegetation is dominated by Poaceaeand the wet loving mossW. fontinaliopsis. We infer relatively warm,wet and stable conditions becoming slightly wetter about14,550 cal yr BP. About 13,600 years ago a sudden change can beobserved in our proxy-data. The peat gives way to a laminatedlacustrine-type of deposit with alternating more minerogenic andmore organic layers. A. selago and L. kerguelensis, cushion plantswhich today occur on wind swept plateaus in the archipelago,expand suddenly and become important plant species. The algaePediastrum sp. occurs, followed closely by a sharp increase of BSicaused by diatom blooms suggesting open water conditions.Climate conditions becamewetter, allowing small ponds to form onthe peat surface, and windier, the latter resulting in higher amountof minerogenic material together with the expansion of the windtolerant plant species. An intensification of the SHW could explainour proxy data from 13,600 (2s 13,765e13,450) cal yr BP onwards.Based on the pollen, BSi and Pediastrum curves, these wet andwindy conditions continued until c. 11,600 cal yr BP. However,based on the drop in minerogenic content, higher TOC and highamounts of Botryococcus sp. it seems that conditions became lesswindy and less humid c. 12,900 cal yr BP. About 11,650 years ago,pond deposits were replaced by peat deposits and A. magellanicaand U. compacta became the dominant plant species on the site,growing in sheltered and warmer conditions. Wet indicators (BSiand Pediastrum) become less prominent or disappear. Warm anddry climate conditions, less influenced by the SHW occurred onKerguelen Islands after 11,600 cal yr BP, coinciding with the earlyHolocene climate optimum in the Antarctic ice records (Massonet al., 2000). Frenot et al. (1997) studied the sensitivity of theAmp�ere glacier of the Cook ice cap by mapping the glacier extentbetween 1962e1995 in relation to changes in temperature andprecipitation. In an area rapidly deglaciated during the warm andrelatively dry 1990s they found well-preserved peat deposits closeto the retreating glacier snout which they dated to c. 11,800e11,300cal yr BP, i.e. the PleistoceneeHolocene transition. It implies thatthe glacier front at least retreated to the 1995 position during thewarm and drier conditions of the early Holocene in the Estacaderecord.
warmdry
T at Dome C
EPIC
A D
ome
C δ
D (‰
)
-425-420-415-410-405-400-395-390-385
11000 12000 13000 14000 15000 16000
Changes in temperature/atmospheric cirulationin the moisturesource area ofDome C--> Indian Ocean
EPIC
A D
ome
CD
eute
rium
exc
ess
d (‰
)
5
6
7
8
9
strongerwinds
% Pediastrum sp./pollen sum
BSi (wt %)
TOC (%)
% Botryococcus sp./pollen sum
a13 2a2b
less windywamer
XRFCa/Br
Poaceae
Azorella + Lyallia
Acaena
drier
peat
less windy?warming?
windyverywetcold
relatively warm and wet
peat pond
ACR
OCR
1b
wetter
5
15
25
35
0
50
100
150
02004006008001000
PollenPCA Axis 2
-2
-1
0
1
2
0
10
20
0
5
10
Accumulationrate (mm/yr)
0
0.5
1
1.5
11000 12000 13000 14000 15000 16000
open waterpond
Fig. 6. Selected proxy data from the Estacade peat record on an age scale compared to the dD and deuterium excess d record of the EPICA Dome C ice core on the chronologyproposed by Veres et al. (2013).
N. Van der Putten et al. / Quaternary Science Reviews 122 (2015) 142e157 153
We plotted dD and deuterium excess d (Fig. 6) of the EPICADome C ice core record on the chronology proposed by Vereset al. (2013). dD reflects surface temperature changes at theDome C site while d was interpreted to represent the sea surfacetemperature (SST) in the moisture source area (Stenni et al.,2001). The main moisture source of Dome C is the southern In-dian Ocean (stippled area in Fig. 1A). Stenni et al. (2001) inferred
that an Oceanic Cold Reversal (OCR) took place in the south In-dian Ocean, c. 1000 years after the onset of the Antarctic ColdReversal (ACR), at c. 13,650 (1s 13,190e14,110) cal yr BP and14,650 (1s 14,190e15,110) cal yr BP, respectively, based on thenew chronology (Veres et al., 2013). If we compare our proxy-data from the terrestrial/atmospheric record from KerguelenIslands with the data from EDC, the occurrence of an OCR in the
N. Van der Putten et al. / Quaternary Science Reviews 122 (2015) 142e157154
moisture source area of Dome C seems to be confirmed. Stenniet al. (2001) concluded that the meridional temperaturegradient between Dome C and its source area was the largest atthe onset of the OCR (13,650 cal yr BP) causing a possibleintensification of the mid- and high latitude atmospheric circu-lation, e.g. intensification of the SHW, which is supported by ourdata (Fig. 6). However, interpretation of deuterium excess d is notstraightforward. Whether it reflects SST changes or a shift in themoisture source area is still not clear (Stenni et al., 2010). Also,comparison of d data between the East Antarctic EDML (EPICADronning Maud Land) and EDC ice cores, with source areas in thesouth Atlantic and south Indian Ocean, respectively, revealeddifferent trends of moisture source temperatures (Stenni et al.,2011). These different shifts in moisture sources are probablyrelated to reorganization of atmospheric circulation at oceanbasin scale, suggesting a different expression of the bipolarseesaw in the two basins (Stenni et al., 2011). Our proxy datashow no clear change at the onset of the ACR. However, based onour proxies it is not possible to reconstruct temperature changesin a quantitative way. If the ACR is mainly a shift to colder con-ditions without a significant change in atmospheric circulation,as could be the case based on the deuterium excess d data fromthe EDC ice core, it is probable that the ACR is not registered inour proxy data. Nevertheless, one could speculate that the onsetof the slightly wetter conditions c. 14,550 cal yr BP (2s15,020e14,061), taking into account the large uncertainties in theageedepth model at that time, is caused by colder conditions atthe onset of the ACR.
5.3.2. The Kerguelen Islands data set in a larger SHW contextToggweiler et al., 2006, suggested that during the LGM, atmo-
spheric CO2 was lower due to reduced exchange between the deepocean and the atmosphere through the Southern Ocean. Thisreduced upwelling at the Antarctic Divergence would be the resultof an equator-ward position of the SHW. For cold periods in theNorthern Hemisphere (coinciding with warming in the South)during the Last Termination, such as Heinrich Stadial 1 (HS1) andYD, a southward shift of the ITCZ and the SHW has been proposedresulting in increased CO2 ventilation from the deep ocean(Toggweiler et al., 2006; Denton et al., 2010). During the ACR, theSHW would have shifted northwards again, resulting in less CO2ventilation and colder conditions in the SH mid-latitudes andAntarctica (Anderson et al., 2009).
An alternative hypothesis of SHW changes was brought for-ward by Lamy et al. (2010) for Holocene records of South Americabut the mechanism may also apply to the Last Termination(Kilian and Lamy, 2012). It was proposed, due to opposing pre-cipitation records from the core and the northern boundary ofthe SHW, that the SHW belt did not shift latitudinally as a wholebut rather that the wind belt expanded during colder periods (asobserved during Austral winter today) and became moreconfined during warmer conditions (Austral summer). Duringcolder conditions the northern margin of the belt experiencesstronger SHW influence while the core of the belt becomes lessinfluenced.
From existing proxy-data it is difficult to assess at which latitudethe SHW were situated during LGM (Kohfeld et al., 2013), to whichlatitude they shifted at the onset of HS1, what their latitude wasduring the ACR and whether the wind belt shifted latitudinally orrather expanded and retracted.
Terrestrial data are mainly limited to southern South Americaand New Zealand and oceanic records usually lack a tightly con-strained chronology due to changes in 14C reservoir ages (Sianiet al., 2013). Furthermore, for a number of records, the proxiesused mainly reflect temperature and/or precipitation changes,
which are not always directly linked to SHW intensity and hencetheir latitudinal position (Sime et al., 2013).
Anderson et al., 2009, observed higher opal fluxes during theLast Termination in cores situated south of the Polar Front (PF) fromthe Atlantic and Pacific sectors of the SO (Fig. 1A) and suggestedthat higher productivity was linked to the enhanced upwellingdriven by a more southward position of the SHW during thatperiod. Toggweiler et al. (2006) suggest that the wind belt shiftedpole-ward towards their modern position at the onset of warmingfollowing the LGM. Based on our record, Kerguelen Islands (49�S)were less influenced by the SHW during HS1 and it is only at theonset of the OCR (13,600 cal yr BP) that intense westerly influenceoccurred. Taking into account that the archipelago today is situatedin the core of the SHW, we propose that the wind belt was probablysituated in a more southerly position during HS1, at least in theIndian Ocean basin. In a marine core situated near the SubtropicalFront (STF) in the Atlantic Ocean (41�S, TNO57-21, Fig. 1A), thepresence of warm planktonic foraminifera species (today occurringwell north of the STF) during HS1 (c. 18,000e14,600 cal yr BP afterBarker and Diz, 2014) indicates that this was the warmest periodduring the deglaciation, including the early Holocene, due to amore southerly position of the STF (Barker et al., 2009). A south-ward shift of the oceanic fronts could be related to a southwardshift of the SHWduring HS1, which is in agreement with our resultsfrom Kerguelen Islands. Moreover, temperatures seems to behighest near the onset of the ACR, coinciding with the very lowaccumulation rates due to high humification of the peat deposits inthe Estacade record between 14,775 (2s 15,195e14,269) and14,250 cal yr BP (2s 14,710e13,975).
In their higher resolution core of the Atlantic sector (TNO57-13,Fig 1A) Anderson et al. (2009) observed that the increased opal fluxof the Last Termination is interrupted by a lower opal flux thatcould correspond to the ACR. In the same basin (41�S, TNO57-21, Fig1A), Barker et al. (2009) interpreted a sudden increase in planktonicpolar foraminifera species, near the onset of the ACR, as a suddennorthward shift of the northern fronts associatedwith the AntarcticCircumpolar Current (ACC). A northward shift of the oceanic frontsshould result in colder conditions in Kerguelen Islands at 49�S, withthe PF likewise shifting northward encircling the archipelago withcolder surface waters. The onset of slightly wetter conditionsaround 14,550 cal yr BP (2s 15,020e14,061) in the Estacade recordcould be an expression of lower temperatures due to a northwardshift of the PF. However, as stated above (5.3.1), the uncertainty inour chronology at that time is rather large.
In the South East Pacific sector of the SO, based on a core alongthe Chilean margin (46�S, MD07-3088, Fig 1A), the end of the firstlong Antarctic divergence upwelling period corresponding to thetransition fromHS1 to ACR is precisely dated to 14,620 cal yr BP (1s14,870e14,610), thanks to the presence of a tephra layer (Sianiet al., 2013). A pollen record from the same core shows a rapidnorthward shift of the SHW at the same time, bringing more pre-cipitation to the area resulting in an expansion of MagellanicMoorland (Montade et al., 2013). This indicates that the site at 46�Swas situated in the core of the SHW during the ACR. At the end ofthe ACR the wind belt shifted back south resulting in less intenseSHW influence at 46�S and coinciding with the onset of the secondupwelling period at 12,765 cal yr BP (1s 12,920e12,640) in thesame record (Siani et al., 2013). Looking at the SouthWest Pacific, inthe Southern Alps of New Zealand, the culmination of late glacialglacier expansion and, in consequence, of the cooling is placed at12,970 ± 300 cal yr BP (Putnam et al., 2010), coinciding withindating uncertainties with the end of the ACR in the South EastPacific. From these data we can conclude that the most prominentchange in the Estacade record occurring at 13,600 cal yr BP seemsnot to be registered in the South Pacific, indicating that this change
N. Van der Putten et al. / Quaternary Science Reviews 122 (2015) 142e157 155
might be limited to the Indian Ocean basin. The Estacade recordshows less intense SHW influence from 12,900 cal yr BP (2s13,070e12,758) and onward, coinciding within chronological un-certainties with the end of the ACR. This decrease of SHW influencecould reflect a pole-ward shift of the core of the wind belt in theIndian Ocean basin to a position south of Kerguelen Islands (49�S)similar to the pole-ward shift in the Pacific (south of 46�S). About11,650 cal yr BP (2s 12,006e11,304), warm, relatively dry and evenless windy conditions occurred in the Estacade record, indicating asubsequent southward shift of the SHW at the early Holoceneclimate optimum. From a study of a peat sequence from Islas de losEstados (Atlantic sector of the SO, 55�S, Fig. 1A), combining bothwind and precipitation proxies, more intense SHW during the ACRwere inferred followed by a southward shift of the wind belt, with aposition further south than 55� S attained by 12,200 cal yr BP(Bj€orck et al., 2012). Both in the Atlantic and Indian sector of the SO,the SHW seem to have been situated south of their modern positionduring the Younger Dryas and the Holocene climate optimum.
Based on our record, Kerguelen Islands (49�S) were lessinfluenced by the SHW during HS1 and YD. Taking into accountthat the archipelago is situated in the core of the SHW today wesuggest that the SHW shifted south of Kerguelen Islands duringNorthern Hemisphere cold events (HS1 and YD) and shiftedequator-ward during the ACR-OCR. Following Lamy et al. (2010),Kerguelen Islands should be less influenced by the SHW duringthe ACR-OCR as the belt was more expanded (Austral wintertoday), than during the warm SH events during HS1 and YD,which contradicts our results. However, the difference betweensummer and winter conditions of the wind belt is much lesspronounced in the Indian Ocean than in South America and wewant to stress that the hypothesis was brought forward based onHolocene records and has not been tested for the Last Termina-tion. Moreover, it might be that the atmospheric circulation pat-terns were different in the different ocean basins as for examplesuggested by the deuterium excess records of the EDC and EDMLice cores (Stenni et al., 2011).
6. Conclusions
The Estacade peat record reveals clear changes during the LastTermination. Peat growth started 16,000 cal yr BP and continueduntil 13,600 cal yr BP suggesting relatively warm and humid con-ditions with slightly wetter conditions from 14,550 cal yr BP andonwards. A shift to a very wet and windy environment occurred13,600 cal yr BP resulting in the formation of peat ponds and hencelacustrine-type deposits. We attribute this change to an intensifi-cation of the SHW, which coincides with the onset of the OCR asinferred from deuterium excess d in the EDC ice core. Lower tem-peratures during this period probably enhanced local wetness onthe Estacade site. Around 12,900 cal yr BP, at the end of the ACR,pond/lake deposits give way to more peaty deposits suggestingslightly drier, less windy and probably warmer conditions. Ker-guelen Islands became less influenced by the SHW although thewind tolerant cushion plant A. selago is still the dominant species inthe area. About 11,650 cal yr BP warm, relatively dry and less windyconditions occurred with expansion of A. magellanica coincidingwith the early Holocene climate optimum found in Antarctic icecores.
Interestingly, the ACR is not clearly registered in the Estacaderecord. However, we do not have a straightforward temperatureproxy. Whether the ACR coincides with a northward shift of theoceanic fronts combined with an equator ward shift of the SHW inthe Indian sector of the SO is not clear yet. From our record, anintensification of the SHWwas delayed until 13,600 cal yr BP. Basedon the large error bars in the age model at 14,550 cal yr BP (2s
15,020e14,061) the onset of wetter conditions could theoreticallybe assigned to colder conditions at the onset of the ACR.
Our results could support the Toggweiler hypothesis: duringLGM the SHWwerewell north of Kerguelen Islands and at the onsetof HS1 a sudden southward shift of the wind belt (due to coldconditions in the northern hemisphere and a concurrent southward shift of the ITCZ) to south of the archipelago, creates therelatively warm and dry conditions for peat growth. During theOCR, the SHW moved northward and Kerguelen Islands were sit-uated in the core of the wind belt. Subsequently a southward shiftbrings less intense SHW influence to Kerguelen Islands culminatingin the early Holocene climate optimum. However, it seems that,during HS1, the SHW were not at the same latitude in the Indiansector of the SO as today. Moreover, we cannot exclude alternativescenarios of changing SHW. The Estacade record only starts16,000 cal yr BP and does not cover the LGM making the assump-tions about the LGM SHW latitude rather speculative.
Acknowledgements
This researchwasmade possible by the fantastic logistic supportfor fieldwork of the French Polar Institute (IPEV, Programme PEI-SACG e 448). Bart Klinck is warmly thanked for his invaluable helpand never-ending enthusiasm in the field. Florian Adolphi, WimClymans, Daniel Conley, Guillaume Fontorbe, Patrick Frings, GitKlintvik Ahlberg, Raimund Muscheler and Anne Birgitte Nielsenfrom the Geology department, Lund University, Sweden arethanked for fruitful discussions and/or help with analyses. MalinKylander (Stockholm University, Sweden) is thanked for the XRFcore scanning. Ryszard Ochyra (Institute of Botany, Polish Academyof Sciences, Krakow, Poland) helped out with some bryophyte de-terminations and Françoise Hennion (CNRS, UMR ECOBIO, Uni-versit�e de Rennes 1, France) made reference material of Lyalliakerguelensis available.
Funding for NVdP was provided by Ghent University, Belgium(BOF-0111 2005) and the Swedish Research Council (VR-623-2009-7399, VR-349-2012-6278 and the LUCCI Linnaeus grant). Grants foranalyses and radiocarbon dating to NVdP from LUCCI WP 3 and theRoyal Physiographic Society in Lund, Sweden are greatly acknowl-edged. We thank the AMS ARTEMIS facility for 14C analyses madepartly within the National CNRS-INSU service and partly throughCEA participation. We also thank two anonymous reviewers fortheir valuable comments on an earlier version of the manuscript.
Appendix A. Supplementary data
Supplementary data related to this article can be found at http://dx.doi.org/10.1016/j.quascirev.2015.05.010.
References
Aubert de la Rüe, E., 1962. Quelques particularit�es des tourbi�eres de l'Archipel deKerguelen. Leur r�epartition; leur structure et leur d�estruction. Rev. T.A.A.F 21,12e30.
Anderson, R.F., Ali, S., Bradtmiller, L.I., Nielsen, S.H.H., Fleisher, M.Q., Anderson, B.E.,Burckle, L.H., 2009. Wind-driven upwelling in the Southern Ocean and theDeglacial Rise in atmospheric CO2. Science 323, 1443e1448.
Andres, M.S., Bernasconi, S.M., McKenzie, J.A., Rohl, U., 2003. Southern Oceandeglacial record supports global Younger Dryas. Earth Planet. Sci. Lett. 216,515e524.
Barker, S., Diz, P., 2014. Timing of the descent into the last Ice Age determined by thebipolar seesaw. Paleoceanography 29, 2014PA002623.
Barker, S., Diz, P., Vautravers, M.J., Pike, J., Knorr, G., Hall, I.R., Broecker, W.S., 2009.Interhemispheric Atlantic seesaw response during the last deglaciation. Nature457, 1097e1102.
Barrow, C.J., 1976. Palynological studies in South Georgia: I. Pollen and sporemorphology of the native vascular species. Br. Antarct. Surv. Bull. 43, 63e75.
N. Van der Putten et al. / Quaternary Science Reviews 122 (2015) 142e157156
Barrows, T.T., Lehman, S.J., Fifield, L.K., De Deckker, P., 2007. Absence of cooling inNew Zealand and the Adjacent Ocean during the Younger Dryas Chronozone,10.1126/science.1145873 Science 318, 86e89.
Bellair, N., 1967. S�edimentologie et palynologie d'une tourbi�ere de Kerguelen (Port-Christmas, P�eninsule Loranchet). Facult�e de Sciences de Paris, Paris, p. 58.
Bennett, K.D., Haberle, S.G., Lumley, S.H., 2000. The Last Glacial-Holocene transitionin Southern Chile. Science 290, 325e328.
Biester, H., Keppler, F., Putschew, A., Martinez-Cortizas, A., Petri, M., 2004. HalogenRetention, Organohalogens, and the role of organic matter decomposition onHalogen Enrichment in two chilean peat bogs. Environ. Sci. Technol. 38,1984e1991.
Bj€orck, S., Rundgren, M., Ljung, K., Unkel, I., Wallin, Å., 2012. Multi-proxy analyses ofa peat bog on Isla de los Estados, easternmost Tierra del Fuego: a unique recordof the variable Southern Hemisphere Westerlies since the last deglaciation.Quat. Sci. Rev. 42, 1e14.
Boyle, J.F., 2001. Inorganic geochemical methods in paleolimnology. In: Last, W.M.,Smol, J.P. (Eds.), Tracking Environmental Changes in Lake Sediments: Physicaland Chemical Techniques. Kluwer Academic Publishers, pp. 83e141.
Broecker, W., 1998. Paleocean circulation during the last deglaciation: a bipolarseesaw? Paleoceanography 13, 119e121.
Bronk Ramsey, C., 2008. Deposition models for chronological records. Quat. Sci. Rev.27, 42e60.
Bronk Ramsey, C., 2009. Bayesian analysis of radiocarbon dates. Radiocarbon 51,337e360.
Bronk Ramsey, C., Lee, S., 2013. Recent and planned developments of the programOxCal. Radiocarbon 55, 720e730.
Caseldine, C.J., Baker, A., Charman, D.J., Hendon, D., 2000. A comparative study ofoptical properties of NaOH peat extracts: implications for humi®cation studies.Holocene 10, 649e658.
Chambers, F.M., Beilman, D.W., Yu, Z., 2010/11. Methods for determining peat hu-mification and for quantifying peat bulk density, organic matter and carboncontent for palaeostudies of climate and peatland carbon dynamics. Mires Peat7. Art. 7.
Clymans, W., Bar~ao, L., Van der Putten, N., Wastegård, S., Gíslad�ottir, G., Bj€orck, S.,Moine, B., Struyf, E., Conley, D.J., 2015. The contribution of tephra constituentsduring biogenic silica determination: implications for soil and paleoecologicalstudies. Biogeosci. Discuss. 12, 3505e3545.
Conley, D.J., Schelske, C.L., 2001. Biogenic silica. In: Smol, J.P., Birks, H.J.B., Last, W.M.(Eds.), Tracking Environmental Change Using Lake Sediments, Terrestrial, Algaland Siliceous Indicators, vol. 3. Kluwer Academic Publishers, Dordrecht,pp. 281e293.
Demetrescu, E., 1999. The chlorococcalean alga Botryococcus and its significance inhydrocarbon exploration. Geo-Eco-Marina 4, 155e160.
Denton, G.H., Anderson, R.F., Toggweiler, J.R., Edwards, R.L., Schaefer, J.M.,Putnam, A.E., 2010. The Last Glacial Termination. Science 328, 1652e1656.
Disnar, J.-R., Guillet, B., Keravis, D., Di-Giovanni, C., Sebag, D., 2003. Soil organicmatter (SOM) characterization by Rock-Eval pyrolysis: scope and limitations.Org. Geochem. 34, 327e343.
Espitali�e, J., Laporte, J.L., Madec, M., Marquis, F., Leplat, P., Paulet, J., Boutefeu, A.,1977. M�ethode rapide de caract�erisation des roches m�eres, de leur potentielp�etrolier et de leur degr�e d'�evolution. Rev. l'Inst. Fr. P�etr. 32, 23e42.
Faegri, K., Kaland, P.E., Krzywinski, K., 1989. Textbook of Pollen Analysis. John Wileyand sons, Ltd, Chichester.
Frenot, Y., Gloaguen, J.-C., Van de Vijver, B., Beyens, L., 1997. Datation de quelquess�ediments tourbeux holoc�enes et oscillation glaciaires aux îles kerguelen. C. R.Acad. Sci. Paris Ecol. 320, 567e573.
Frenot, Y., Gloaguen, J.-C., Mass�e, L., Lebouvier, M., 2001. Human activities,ecosystem disturbance and plant invasions in subantarctic Crozet, Kerguelenand Amsterdam Islands. Biol. Conserv. 101, 33e50.
Gautier, I., Weis, D., Mennessier, J.-P., Vidal, P., Giret, A., Loubet, M., 1990. Petrologyand geochemistry of the Kerguelen Archipelago basalts (South Indian Ocean):evolution of the mantle sources from ridge to intraplate position. Earth Planet.Sci. Lett. 100, 59e76.
Giret, A., Weis, D., Gr�egoire, M., Mattielli, N., Moine, B., Michon, G., Scoates, J.,Tourpin, S., Delpech, G., Gerbe, M.C., Doucet, S., Ethien, R., Cottin, J.Y., 2003.L'Archipel de Kerguelen: les plus vieilles îles dans le plus jeune oc�ean.G�eologues 137, 23e40.
Grasshoff, K., Ehrhardt, M., Kremling, K., 1983. Methods of Sea Water Analysis.Verlag, Chemie, p. 314.
Grimm, E.C., 2004. TGView, 2.0.2. ed. Illenois State Museum Research CollectionCenter, Springfield.
Guy-Ohlson, D., 1992. Botryococcus as an aid in the interpretation of palae-oenvironment and depositional processes. Rev. Palaeobot. Palynol. 71, 1e15.
Hall, K., 1984. Evidence in favour of an extensive ice cover on sub-Antarctic Ker-guelen Island during the Last Glacial. Palaeogeogr. Palaeoclimatol. Palaeoecol.47, 225e232.
Hammer, Ø., Harper, D.A.T., Ryan, P.D., 2001. PAST: Paleontological statistics soft-ware package for education and data analysis. Palaeontol. Electron. 4 (1), 9.
Hodgson, D.A., Graham, A.G.C., Roberts, S.J., Bentley, M.J., Cofaigh, C.�O., Verleyen, E.,Vyverman, W., Jomelli, V., Favier, V., Brunstein, D., Verfaillie, D., Colhoun, E.A.,Saunders, K.M., Selkirk, P.M., Mackintosh, A., Hedding, D.W., Nel, W., Hall, K.,McGlone, M.S., Van der Putten, N., Dickens, W.A., Smith, J.A., 2014. Terrestrialand submarine evidence for the extent and timing of the Last Glacial Maximumand the onset of deglaciation on the maritime-Antarctic and sub-Antarcticislands. Quat. Sci. Rev. 100, 137e158.
Hogg, A.G., Hua, Q., Blackwell, P.G., Niu, M., Buck, C.E., Guilderson, T.P., Heaton, T.J.,Palmer, J.G., Reimer, P.J., Reimer, R.W., Turney, C.S.M., Zimmerman, S.R.H., 2013.SHCal13 Southern Hemisphere Calibration, 0e50,000 Years cal BP.
Jacob, J., Disnar, J.-R., Boussafir, M., Sifeddine, A., Turcq, B., Albuquerque, A.L.S., 2004.Major environmental changes recorded by lacustrine sedimentary organicmatter since the last glacial maximum near the equator (Lagoa do Caç�o, NEBrazil). Palaeogeogr. Palaeoclimatol. Palaeoecol. 205, 183e197.
Janssens, J.A., 1983. A quantitative method for stratigraphic analysis of bryophytesin Holocene peat. J. Ecol. 71, 189e196.
Johnson, T.C., Brown, E.T., Shi, J., 2011. Biogenic silica deposition in Lake Malawi, EastAfrica over the past 150,000 years. Palaeogeogr. Palaeoclimatol. Palaeoecol. 303,103e109.
Kilian, R., Lamy, F., 2012. A review of Glacial and Holocene paleoclimate recordsfrom southernmost Patagonia (49e55�S). Quat. Sci. Rev. 53, 1e23.
Kohfeld, K.E., Graham, R.M., de Boer, A.M., Sime, L.C., Wolff, E.W., Le Qu�er�e, C.,Bopp, L., 2013. Southern Hemisphere westerly wind changes during the LastGlacial Maximum: paleo-data synthesis. Quat. Sci. Rev. 68, 76e95.
Kylander, M.E., Lind, E.M., Wastegård, S., L€owemark, L., 2012. Recommendations forusing XRF core scanning as a tool in tephrochronology. Holocene 22, 371e375.
Lafargue, E., Marquis, F., Pillot, D., 1998. Rock-Eval 6 applications in hydrocarbonexploration, production, and soil contamination studies. Rev. l'Inst. Fr. P�etr. 53,421e437.
Lamy, F., Kilian, R., Arz, H.W., Francois, J.-P., Kaiser, J., Prange, M., Steinke, T., 2010.Holocene changes in the position and intensity of the southern westerly windbelt. Nat. Geosci. 3, 695e699.
Lewis-Smith, R.I., 1984. Terrestrial plant biology of the sub-Antarctic and Antarctic.In: Laws, R.M. (Ed.), Antarctic Ecology. Academic Press, London, pp. 61e162.
Liu, X., Colman, S., Brown, E., Minor, E., Li, H., 2013. Estimation of carbonate, totalorganic carbon, and biogenic silica content by FTIR and XRF techniques inlacustrine sediments. J. Paleolimnol. 50, 387e398.
Lowe, J.J., Rasmussen, S.O., Bj€orck, S., Hoek, W.Z., Steffensen, J.P., Walker, M.J.C.,Yu, Z.C., 2008. Synchronisation of palaeoenvironmental events in the NorthAtlantic region during the Last Termination: a revised protocol recommendedby the INTIMATE group. Quat. Sci. Rev. 27, 6e17.
Masson, V., Vimeux, F., Jouzel, J., Morgan, V., Delmotte, M., Ciais, P., Hammer, C.,Johnsen, S., Lipenkov, V.Y., Mosley-Thompson, E., 2000. Holocene climatevariability in Antarctica based on 11 ice-core isotopic records. Quat. Res. 54,348e358.
Montade, V., Combourieu Nebout, N., Kissel, C., Haberle, S.G., Siani, G., Michel, E.,2013. Vegetation and climate changes during the last 22,000 yr from a marinecore near Taitao Peninsula, southern Chile. Palaeogeogr. Palaeoclimatol. Palae-oecol. 369, 335e348.
Nougier, J., 1970. Contribution �a l'�etude g�eologique et g�eomorphologique des îlesKerguelen. C.N.F.R.A. 27, p. 440.
Putnam, A.E., Denton, G.H., Schaefer, J.M., Barrell, D.J.A., Andersen, B.G., Finkel, R.C.,Schwartz, R., Doughty, A.M., Kaplan, M.R., Schluchter, C., 2010. Glacier advancein southern middle-latitudes during the Antarctic Cold Reversal. Nat. Geosci. 3,700e704.
Roos-Barraclough, F., van der Knaap, W.O., van Leeuwen, J.F.N., Shotyk, W., 2004.A Late-glacial and Holocene record of climatic change from a Swiss peat hu-mification profile. Holocene 14, 7e19.
Sandgren, P., Snowball, I.F., 2001. Application of mineral techniques to paleo-limnology. In: Last, W.M., Smol, J.P. (Eds.), Tracking Environmental Changes inLake Sediments: Physical and Chemical Techniques. Kluwer Academic Pub-lishers, pp. 217e237.
Shotyk, W., 1997. Atmospheric deposition and mass balance of major and traceelements in two oceanic peat bog profiles, northern Scotland and the ShetlandIslands. Chem. Geol. 138, 55e72.
Siani, G., Michel, E., De Pol-Holz, R., DeVries, T., Lamy, F., Carel, M., Isguder, G.,Dewilde, F., Lourantou, A., 2013. Carbon isotope records reveal precise timing ofenhanced Southern Ocean upwelling during the last deglaciation. Nat. Com-mun. 4.
Sime, L.C., Kohfeld, K.E., Le Qu�er�e, C., Wolff, E.W., de Boer, A.M., Graham, R.M.,Bopp, L., 2013. Southern Hemisphere westerly wind changes during the LastGlacial Maximum: model-data comparison. Quat. Sci. Rev. 64, 104e120.
Sommer, M., Kaczorek, D., Kuzyakov, Y., Breuer, J., 2006. Silicon pools and fluxes insoils and landscapes d a review. J. Plant Nutr. Soil Sci. 169, 310e329.
Steig, E.J., Brook, E.J., White, J.W.C., Sucher, C.M., Bender, M.L., Lehman, S.J.,Morse, D.L., Waddington, E.D., Clow, G.D., 1998. Synchronous climate changes inAntarctica and the North Atlantic. Science 282, 92e95.
Stenni, B., Masson-Delmotte, V., Johnsen, S., Jouzel, J., Longinelli, A., Monnin, E.,R€othlisberger, R., Selmo, E., 2001. An oceanic cold reversal during the lastdeglaciation. Science 293, 2074e2077.
Stenni, B., Masson-Delmotte, V., Selmo, E., Oerter, H., Meyer, H., R€othlisberger, R.,Jouzel, J., Cattani, O., Falourd, S., Fischer, H., Hoffmann, G., Iacumin, P.,Johnsen, S.J., Minster, B., Udisti, R., 2010. The deuterium excess records of EPICADome C and Dronning Maud Land ice cores (East Antarctica). Quat. Sci. Rev. 29,146e159.
Stenni, B., Buiron, D., Frezzotti, M., Albani, S., Barbante, C., Bard, E., Barnola, J.M.,Baroni, M., Baumgartner, M., Bonazza, M., Capron, E., Castellano, E.,Chappellaz, J., Delmonte, B., Falourd, S., Genoni, L., Iacumin, P., Jouzel, J.,Kipfstuhl, S., Landais, A., Lemieux-Dudon, B., Maggi, V., Masson-Delmotte, V.,Mazzola, C., Minster, B., Montagnat, M., Mulvaney, R., Narcisi, B., Oerter, H.,Parrenin, F., Petit, J.R., Ritz, C., Scarchilli, C., Schilt, A., Schupbach, S.,Schwander, J., Selmo, E., Severi, M., Stocker, T.F., Udisti, R., 2011. Expression of
N. Van der Putten et al. / Quaternary Science Reviews 122 (2015) 142e157 157
the bipolar see-saw in Antarctic climate records during the last deglaciation.Nat. Geosci. 4, 46e49.
Toggweiler, J.R., Russell, J.L., Carson, S.R., 2006. Midlatitude westerlies, atmosphericCO2, and climate change during the ice ages. Paleoceanography 21, PA2005.
Unkel, I., Fernandez, M., Bj€orck, S., Ljung, K., Wohlfarth, B., 2010. Records of envi-ronmental changes during the Holocene from Isla de los Estados (54.4�S),southeastern Tierra del Fuego. Glob. Planet. Change 74, 99e113.
Van der Putten, N., Stieperaere, H., Verbruggen, C., Ochyra, R., 2004. Holocenepalaeoecology and climate history of South Georgia (sub-Antarctica) based on amacrofossil record of bryophytes and seeds. Holocene 14, 382e392.
Van der Putten, N., Verbruggen, C., Ochyra, R., de Beaulieu, J.-L., De Dapper, M.,Spassov, S., Hus, J., Thouveny, N., 2009. Peat bank growth, Holocene palae-oecology and climate history of South Georgia (sub-Antarctica), based on abotanical macrofossil record. Quat. Sci. Rev. 28, 65e79.
Van der Putten, N., Verbruggen, C., Ochyra, R., Verleyen, E., Frenot, Y., 2010. Sub-antarctic flowering plants: pre-glacial survivors or post-glacial immigrants?J. Biogeogr. 37, 582e592.
Van der Putten, N., Mauquoy, D., Verbruggen, C., Bj€orck, S., 2012a. Subantarcticpeatlands and their potential as palaeoenvironmental and palaeoclimatic ar-chives. Quat. Int. 268, 65e76.
Van der Putten, N., Verbruggen, C., De Beaulieu, J.L., Bj€orck, S., Barrow, C.J., Frenot, Y.,2012b. Is palynology a credible climate proxy in the Subantarctic? Holocene 22,1113e1121.
Veres, D., Bazin, L., Landais, A., Toy�e Mahamadou Kele, H., Lemieux-Dudon, B.,Parrenin, F., Martinerie, P., Blayo, E., Blunier, T., Capron, E., Chappellaz, J.,Rasmussen, S.O., Severi, M., Svensson, A., Vinther, B., Wolff, E.W., 2013. TheAntarctic ice core chronology (AICC2012): an optimized multi-parameter andmulti-site dating approach for the last 120 thousand years. Clim. Past 9,1733e1748.
Wagstaff, S.J., Hennion, F., 2007. Evolution and biogeography of Lyallia and Hec-torella (Portulacaceae), geographically isolated sisters from the SouthernHemisphere. Antarc. Sci. 19, 417e426.
Williams, P.W., King, D.N.T., Zhao, J.X., Collerson, K.D., 2005. Late Pleistocene toHolocene composite speleothem 18O and 13C chronologies from South Island,New Zealandddid a global Younger Dryas really exist? Earth Planet. Sci. Lett.230, 301e317.
Young, S.B., Schofield, E.K., 1973. Pollen evidence for Late Quaternary climatechanges on Kerguelen Island. Nature 245, 311e312.