Embed Size (px)
Citation preview

REINSURANCE MARKET REPORT Results for Year-End 2014
April 2015
13974_COVERS_Year End Financial Results_Opt3 Singles.indd 1 23/03/2015 15:35:14
Contents
Summary ............................................................................................................................... 1 Capital ............................................................................................................................... 1 Return of Capital ................................................................................................................ 1 Return on Equity ................................................................................................................ 1 Underwriting ....................................................................................................................... 2 Cat Losses ......................................................................................................................... 2
Capital ................................................................................................................................... 3 Highlights ........................................................................................................................... 3 Active Capital Management ............................................................................................... 4 Challenging Outlook ........................................................................................................... 5
Earnings ................................................................................................................................ 6 Below Average Losses....................................................................................................... 6 Significant Reserve Releases ............................................................................................ 7 Modest Investment Returns ............................................................................................... 7
Underwriting Performance ..................................................................................................... 8 Premium Volumes .............................................................................................................. 8 Impact of Convergence of Reinsurance and Capital Markets ............................................. 9 Combined Ratios ............................................................................................................... 9
Appendices ......................................................................................................................... 13 The contents herein are provided for informational purposes only and do not constitute and should not be construed as professional advice. Any
and all examples used herein are for illustrative purposes only, are purely hypothetical in nature, and offered merely to describe concepts or
ideas. They are not offered as solutions to produce specific results and are not to be relied upon. The reader is cautioned to consult independent
professional advisors of his/her choice and formulate independent conclusions and opinions regarding the subject matter discussed herein.
Willis is not responsible for the accuracy or completeness of the contents herein and expressly disclaims any responsibility or liability for the
reader's application of any of the contents herein to any analysis or other matter, nor do the contents herein guarantee, and should not be
construed to guarantee, any particular result or outcome.
Nothing in this communication constitutes any legal or financial advice or an offer or solicitation to sell or purchase any securities.
Page 1
-1.6%
-3.2%
13.1%
11.5%
8.3%
5.9%
-2.9%
-3.8%
14.5%
11.6%
7.8%6.7%
0.0%
2.0%
4.0%
6.0%
8.0%
10.0%
12.0%
14.0%
16.0%
RoE, gross of C
at losses
Reported R
oE(net of C
at losses)
RoE, net of C
at lossesand excluding PYD
RoE, net of 4%
(not 1.6%)
Cat losses and
excluding PYD
RoE, gross of C
at losses
Reported R
oE(net of C
at losses)
RoE, net of C
at lossesand excluding PYD
RoE, net of 4%
(not 2.9%)
Cat losses and
excluding PYD
2014 2013
RoE analysis of subset of Willis Reinsurance Index providing Catastrophe loss disclosure RoECat LossPrior Year Development
Summary Capital
• Aggregate shareholders’ equity for the constituents of the Willis Reinsurance Index totalled USD 344B per their latest respective annual financial statements. This represents a 5.0% increase on the prior year.
• 13.8% of the shareholders’ equity reported within the Willis Reinsurance Index is in play following the recent announced major M&A activity. This amounts toUSD48B, of which USD 15B is in the ‘acquired’ companies.
• Including other major regional and local reinsurers, and a pro-rated portion of capital within major groups whose reinsurance portfolio is <10% of their total premium, we derive an estimate of USD 370B of aggregate shareholders equity for the traditional reinsurance market. (If 100% of that capital within these major groups is included the figure is estimated at USD 576B). Including capital from alternative markets this figure increases to an estimated figure of USD 425B (With 100% capital, USD 631B).
Return of Capital • The publicly listed companies within the Willis Reinsurance Index returned USD 7.3B of capital through share
buybacks in 2014, (equivalent to 3.7% of their aggregate opening shareholders’ equity). (Prior year, USD 5.0B, 2.6%)
• 2014 was also notable for several large special dividends, including those of Lancashire (20% of opening shareholders’ equity), Beazley (10%), Hiscox (9%),Swiss Re (4.9%) ,Novae (4%) and WR Berkley (2.9%), in total representing an additional amount of USD 2.4B.
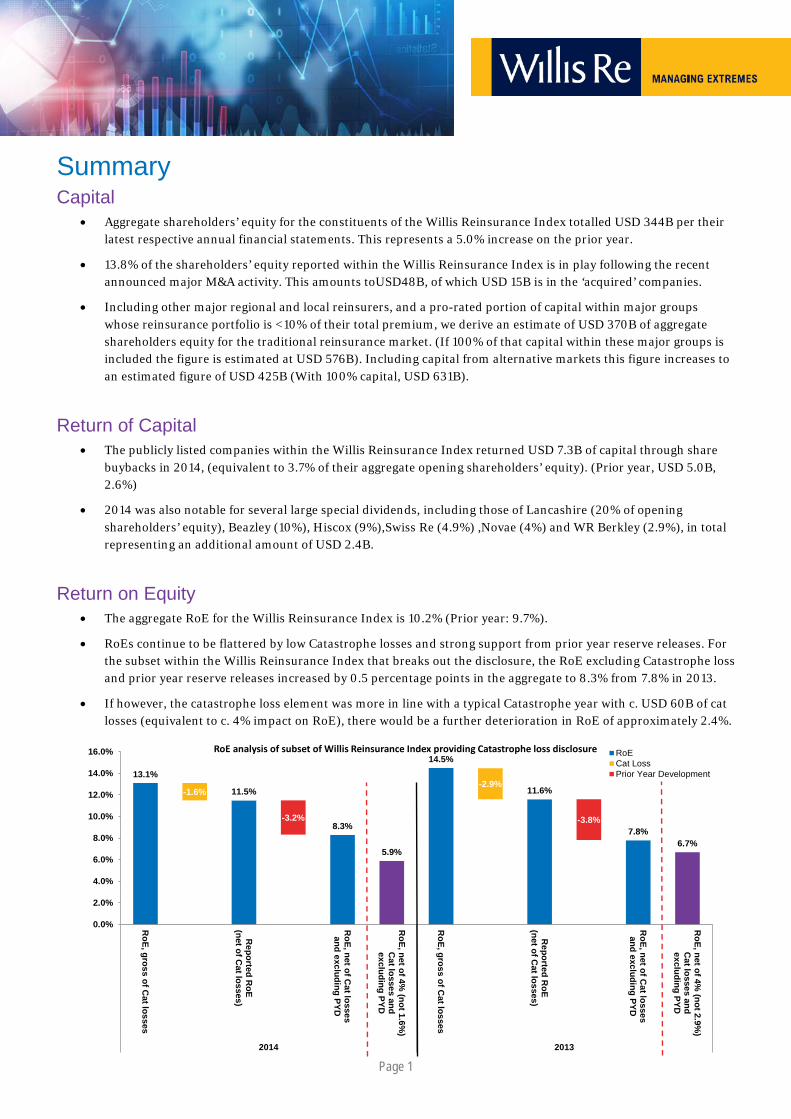
Return on Equity • The aggregate RoE for the Willis Reinsurance Index is 10.2% (Prior year: 9.7%).
• RoEs continue to be flattered by low Catastrophe losses and strong support from prior year reserve releases. For the subset within the Willis Reinsurance Index that breaks out the disclosure, the RoE excluding Catastrophe loss and prior year reserve releases increased by 0.5 percentage points in the aggregate to 8.3% from 7.8% in 2013.
• If however, the catastrophe loss element was more in line with a typical Catastrophe year with c. USD 60B of cat losses (equivalent to c. 4% impact on RoE), there would be a further deterioration in RoE of approximately 2.4%.
Page 2
Underwriting • The aggregate NWP increased by 4.8% to USD 274 B for the latest reported year (Prior year, USD 262B).
However if National Indemnity Co is excluded from the calculation (its premiums include material one-off effects in respect of intra-group reserve transfers) the aggregate Willis Reinsurance Index NWP actually fell by 3.3%.
• The aggregate reported combined ratio of the companies within the Willis Reinsurance Index was 90.7% in the latest reported year (Prior year: 90.3%).
• For those within the Willis Reinsurance Index that made the relevant disclosure, the favourable contribution from reserve releases accounted for around USD 6.9bn or 5.6% of NEP in 2014 (2013: USD 7.6B or 6.2%).
Aggregate
2014 2013
Reported Combined Ratio 90.7% 90.3%
Favourable Development of Prior Years 5.6% 6.2%
Accident Year Combined Ratio 96.3% 96.5%
Catastrophe Loss -2.8% -4.8%
Ex-Cat Accident Year Combined Ratio 93.5% 91.7%
Cat Losses • Global insured Cat losses down approximately 25% to USD 35B in 2014. (2013: USD 44B)
• For those within the Willis Reinsurance Index that made the relevant disclosure, reported catastrophe loss fell by 42% to USD 3.4B. Reported Cat losses equate to 2.8% of relevant aggregate NEP (2013: USD 5.9B, 4.7%) or a c.1.6 percentage point impact on the aggregate RoE (2013: 2.9 percentage points).
Page 3
Capital
Highlights • Continued strong growth in shareholders’ equity, 5.0% on an aggregate basis. (See Chart 1)
• Aggregate Return on Equity (RoE) of 10.2% for the Willis Reinsurance Index (prior year 9.7%)
• Active capital management strategies to address excess capital
• Excess capital also prompting focus on M&A
As shown in Chart 1 below, shareholders’ equity within the Willis Reinsurance Index of reinsurers again rose meaningfully in 2014.
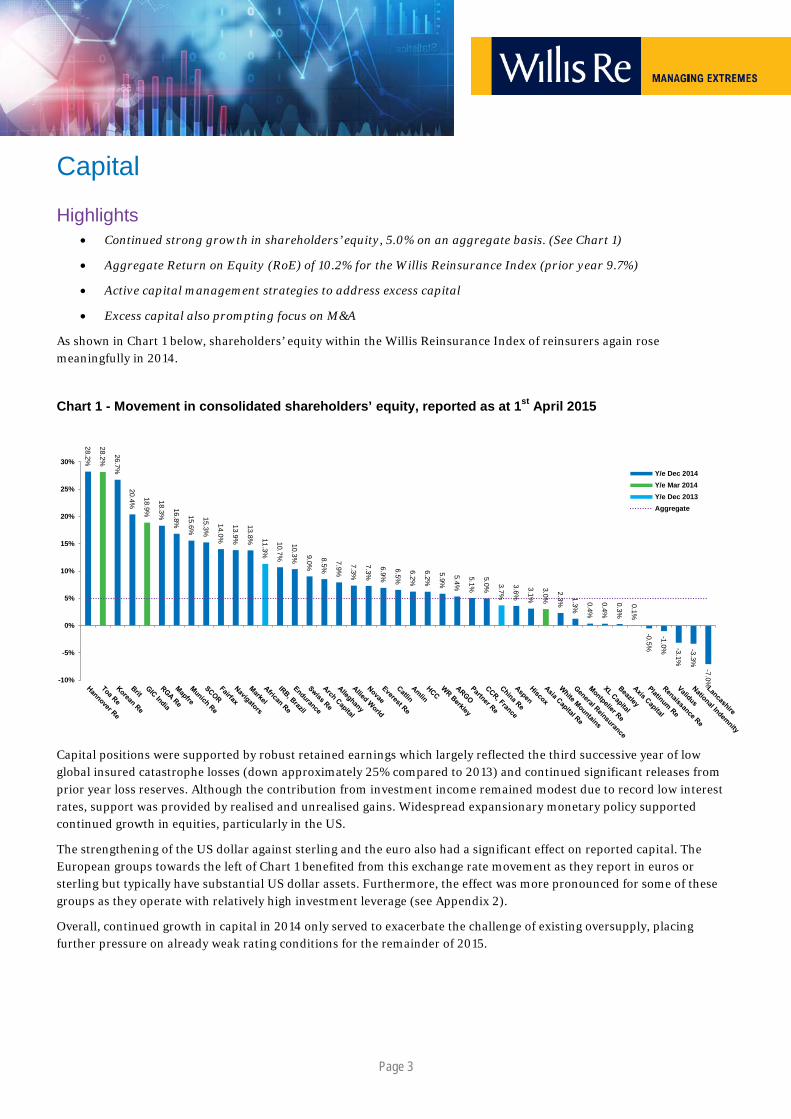
Chart 1 - Movement in consolidated shareholders’ equity, reported as at 1st April 2015
Capital positions were supported by robust retained earnings which largely reflected the third successive year of low global insured catastrophe losses (down approximately 25% compared to 2013) and continued significant releases from prior year loss reserves. Although the contribution from investment income remained modest due to record low interest rates, support was provided by realised and unrealised gains. Widespread expansionary monetary policy supported continued growth in equities, particularly in the US.
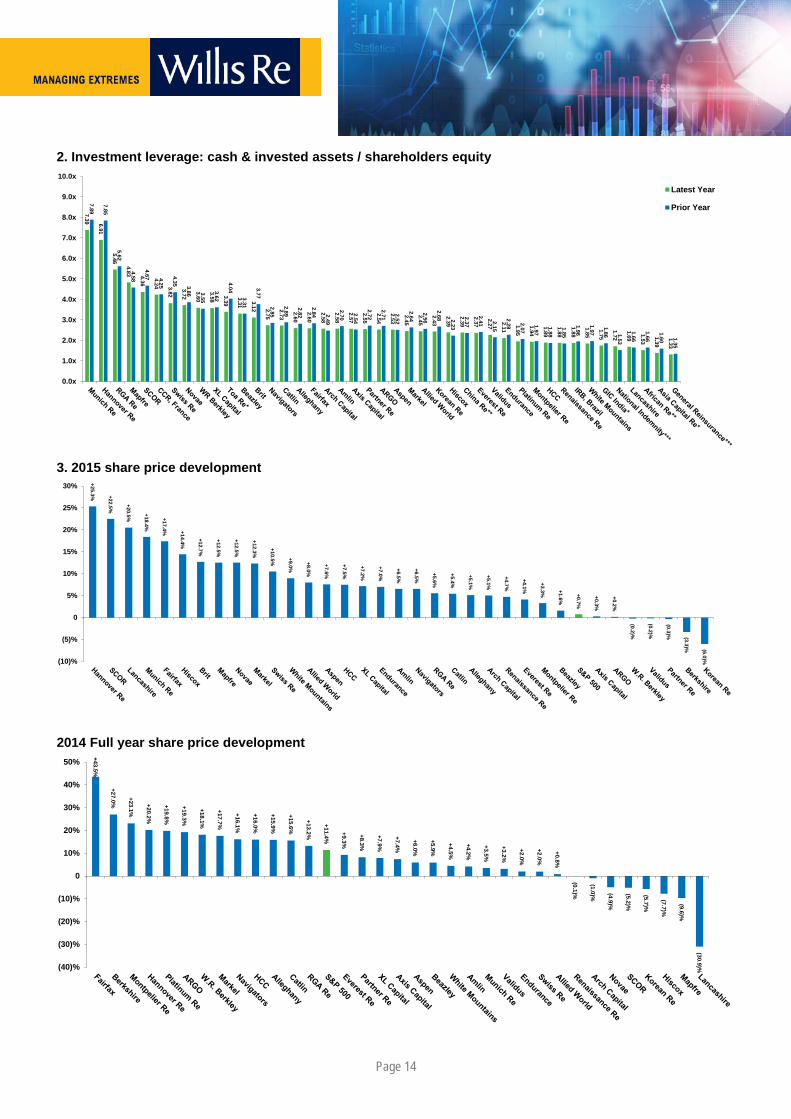
The strengthening of the US dollar against sterling and the euro also had a significant effect on reported capital. The European groups towards the left of Chart 1 benefited from this exchange rate movement as they report in euros or sterling but typically have substantial US dollar assets. Furthermore, the effect was more pronounced for some of these groups as they operate with relatively high investment leverage (see Appendix 2).
Overall, continued growth in capital in 2014 only served to exacerbate the challenge of existing oversupply, placing further pressure on already weak rating conditions for the remainder of 2015.
28.2%
26.7%
20.4% 18.3%
16.8%
15.6%
15.3%
14.0%
13.9%
13.8% 10.7%
10.3% 9.0%
8.5%
7.9%
7.3%
7.3%
6.9%
6.5%
6.2%
6.2%
5.9%
5.4%
5.1%
5.0% 3.6%
3.1%
2.3% 1.3%
0.4%
0.4%
0.3%
0.1%
-0.5%
-1.0% -3.1%
-3.3%
-7.0%
28.2%
18.9%
3.0%
11.3%
3.7%
-10%
-5%
0%
5%
10%
15%
20%
25%
30%Y/e Dec 2014Y/e Mar 2014Y/e Dec 2013Aggregate
Page 4
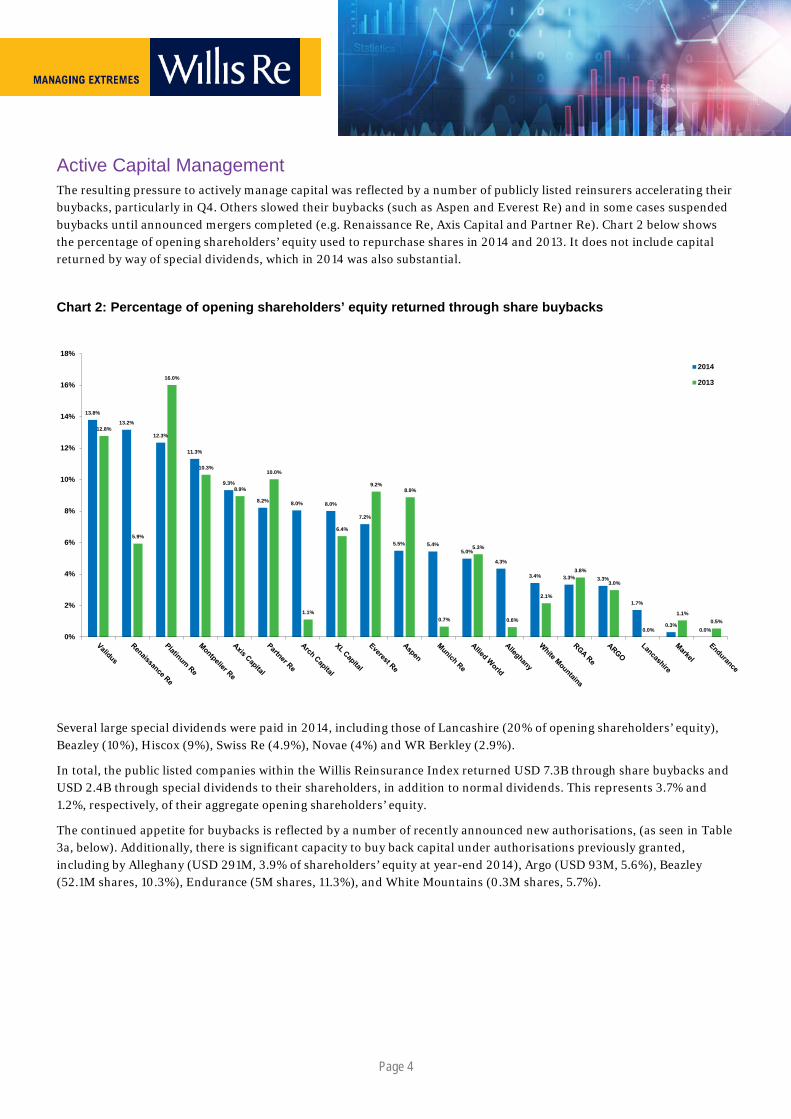
Active Capital Management The resulting pressure to actively manage capital was reflected by a number of publicly listed reinsurers accelerating their buybacks, particularly in Q4. Others slowed their buybacks (such as Aspen and Everest Re) and in some cases suspended buybacks until announced mergers completed (e.g. Renaissance Re, Axis Capital and Partner Re). Chart 2 below shows the percentage of opening shareholders’ equity used to repurchase shares in 2014 and 2013. It does not include capital returned by way of special dividends, which in 2014 was also substantial.
Chart 2: Percentage of opening shareholders’ equity returned through share buybacks
Several large special dividends were paid in 2014, including those of Lancashire (20% of opening shareholders’ equity), Beazley (10%), Hiscox (9%), Swiss Re (4.9%), Novae (4%) and WR Berkley (2.9%).
In total, the public listed companies within the Willis Reinsurance Index returned USD 7.3B through share buybacks and USD 2.4B through special dividends to their shareholders, in addition to normal dividends. This represents 3.7% and 1.2%, respectively, of their aggregate opening shareholders’ equity.
The continued appetite for buybacks is reflected by a number of recently announced new authorisations, (as seen in Table 3a, below). Additionally, there is significant capacity to buy back capital under authorisations previously granted, including by Alleghany (USD 291M, 3.9% of shareholders’ equity at year-end 2014), Argo (USD 93M, 5.6%), Beazley (52.1M shares, 10.3%), Endurance (5M shares, 11.3%), and White Mountains (0.3M shares, 5.7%).
13.8%
13.2%
12.3%
11.3%
9.3%
8.2% 8.0% 8.0%
7.2%
5.5% 5.4%5.0%
4.3%
3.4% 3.3% 3.3%
1.7%
0.3%0.0%
12.8%
5.9%
16.0%
10.3%
8.9%
10.0%
1.1%
6.4%
9.2%8.9%
0.7%
5.3%
0.6%
2.1%
3.8%
3.0%
0.0%
1.1%0.5%
0%
2%
4%
6%
8%
10%
12%
14%
16%
18%
2014
2013
Page 5
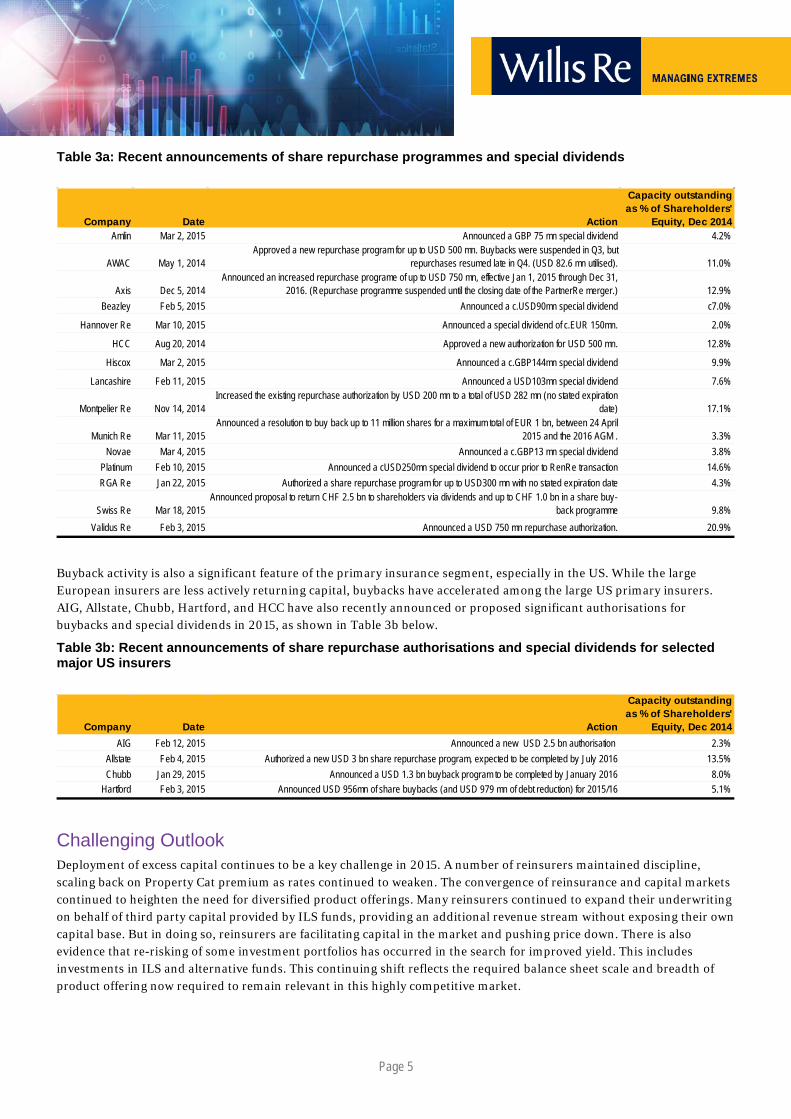
Table 3a: Recent announcements of share repurchase programmes and special dividends
Buyback activity is also a significant feature of the primary insurance segment, especially in the US. While the large European insurers are less actively returning capital, buybacks have accelerated among the large US primary insurers. AIG, Allstate, Chubb, Hartford, and HCC have also recently announced or proposed significant authorisations for buybacks and special dividends in 2015, as shown in Table 3b below.
Table 3b: Recent announcements of share repurchase authorisations and special dividends for selected major US insurers
Challenging Outlook Deployment of excess capital continues to be a key challenge in 2015. A number of reinsurers maintained discipline, scaling back on Property Cat premium as rates continued to weaken. The convergence of reinsurance and capital markets continued to heighten the need for diversified product offerings. Many reinsurers continued to expand their underwriting on behalf of third party capital provided by ILS funds, providing an additional revenue stream without exposing their own capital base. But in doing so, reinsurers are facilitating capital in the market and pushing price down. There is also evidence that re-risking of some investment portfolios has occurred in the search for improved yield. This includes investments in ILS and alternative funds. This continuing shift reflects the required balance sheet scale and breadth of product offering now required to remain relevant in this highly competitive market.
Company Date Action
Capacity outstanding as % of Shareholders'
Equity, Dec 2014Amlin Mar 2, 2015 Announced a GBP 75 mn special dividend 4.2%
AWAC May 1, 2014Approved a new repurchase program for up to USD 500 mn. Buybacks were suspended in Q3, but
repurchases resumed late in Q4. (USD 82.6 mn utilised). 11.0%
Axis Dec 5, 2014Announced an increased repurchase programe of up to USD 750 mn, effective Jan 1, 2015 through Dec 31,
2016. (Repurchase programme suspended until the closing date of the PartnerRe merger.) 12.9%Beazley Feb 5, 2015 Announced a c.USD90mn special dividend c7.0%
Hannover Re Mar 10, 2015 Announced a special dividend of c.EUR 150mn. 2.0%
HCC Aug 20, 2014 Approved a new authorization for USD 500 mn. 12.8%
Hiscox Mar 2, 2015 Announced a c.GBP144mn special dividend 9.9%
Lancashire Feb 11, 2015 Announced a USD103mn special dividend 7.6%
Montpelier Re Nov 14, 2014Increased the existing repurchase authorization by USD 200 mn to a total of USD 282 mn (no stated expiration
date) 17.1%
Munich Re Mar 11, 2015Announced a resolution to buy back up to 11 million shares for a maximum total of EUR 1 bn, between 24 April
2015 and the 2016 AGM . 3.3%Novae Mar 4, 2015 Announced a c.GBP13 mn special dividend 3.8%
Platinum Feb 10, 2015 Announced a cUSD250mn special dividend to occur prior to RenRe transaction 14.6%RGA Re Jan 22, 2015 Authorized a share repurchase program for up to USD300 mn with no stated expiration date 4.3%
Swiss Re Mar 18, 2015 Announced proposal to return CHF 2.5 bn to shareholders via dividends and up to CHF 1.0 bn in a share buy-
back programme 9.8%Validus Re Feb 3, 2015 Announced a USD 750 mn repurchase authorization. 20.9%
Company Date Action
Capacity outstanding as % of Shareholders'
Equity, Dec 2014AIG Feb 12, 2015 Announced a new USD 2.5 bn authorisation 2.3%
Allstate Feb 4, 2015 Authorized a new USD 3 bn share repurchase program, expected to be completed by July 2016 13.5%Chubb Jan 29, 2015 Announced a USD 1.3 bn buyback program to be completed by January 2016 8.0%
Hartford Feb 3, 2015 Announced USD 956mn of share buybacks (and USD 979 mn of debt reduction) for 2015/16 5.1%
Page 6
Earnings
• On an aggregate basis reported combined ratios edged upwards to 90.7% from 90.3%, but they remained supported by:
– Low catastrophe losses which on aggregate represented 2.8 percentage points of reported combined ratios (2013: 4.8 percentage points)
– Significant contribution from prior year loss reserves, representing 5.5% of net earned premium (2013: 6.1%)
• Partially offset by an uptick in underlying accident year combined ratio (excluding Cat loss).
• Average investment yields remained modest at 2.7% on average (prior year 2.6%)
• Underwriting and investment conditions continue to present a challenging outlook
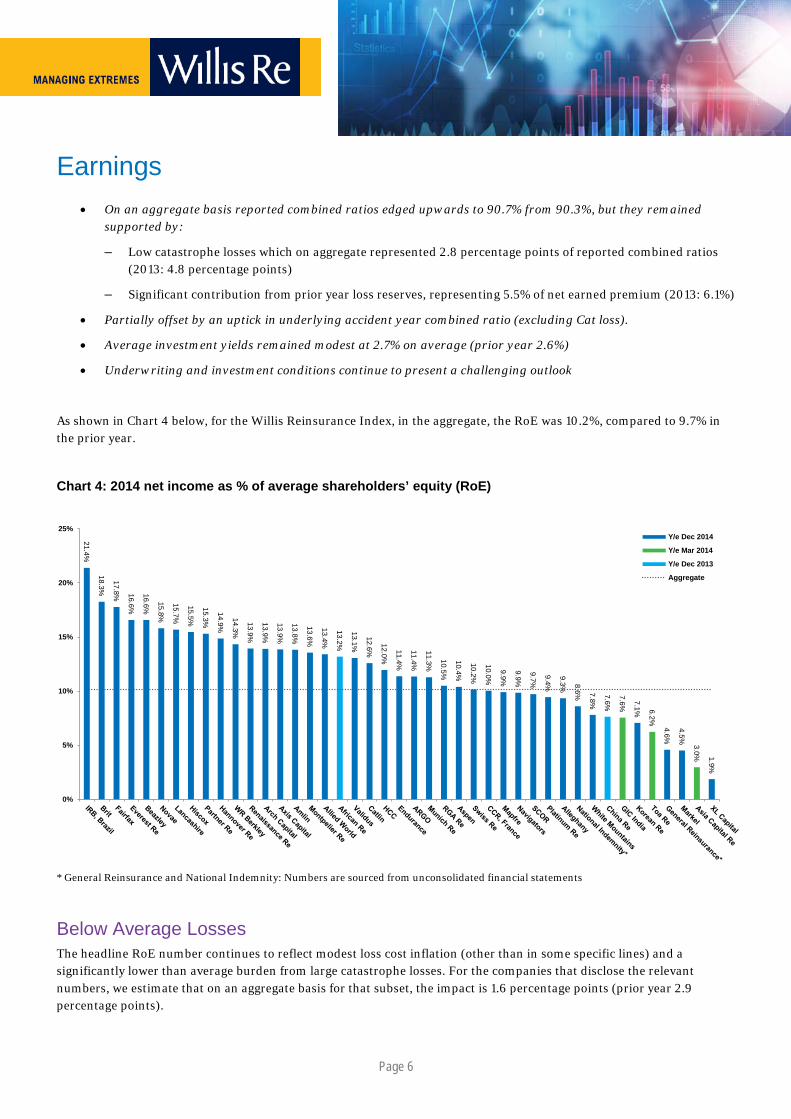
As shown in Chart 4 below, for the Willis Reinsurance Index, in the aggregate, the RoE was 10.2%, compared to 9.7% in the prior year.
Chart 4: 2014 net income as % of average shareholders’ equity (RoE)
* General Reinsurance and National Indemnity: Numbers are sourced from unconsolidated financial statements
Below Average Losses The headline RoE number continues to reflect modest loss cost inflation (other than in some specific lines) and a significantly lower than average burden from large catastrophe losses. For the companies that disclose the relevant numbers, we estimate that on an aggregate basis for that subset, the impact is 1.6 percentage points (prior year 2.9 percentage points).
21.4%
18.3%
17.8% 16.6%
16.6%
15.8%
15.7%
15.5%
15.3%
14.9%
14.3%
13.9%
13.9%
13.9%
13.8%
13.6%
13.4%
13.1%
12.6%
12.0%
11.4%
11.4%
11.3%
10.5%
10.4%
10.2%
10.0%
9.9%
9.9%
9.7%
9.4%
9.3% 8.6% 7.8% 7.1%
4.6%
4.5%
1.9%
7.6% 6.2%
3.0%
13.2%
7.6%
0%
5%
10%
15%
20%
25%Y/e Dec 2014
Y/e Mar 2014
Y/e Dec 2013
Aggregate
Page 7
Significant Reserve Releases Material releases from prior year reserves continued to flatter reported RoEs. We estimate that on an aggregate basis reserve releases improved reported RoEs by approximately 3.2 percentage points (2013 3.8 percentage points).
We believe the effects of continuing rate declines have yet to fully impact reported earnings. Looking further ahead, we expect continued compression of current year margins and pressure on the sustainability of reserve releases.
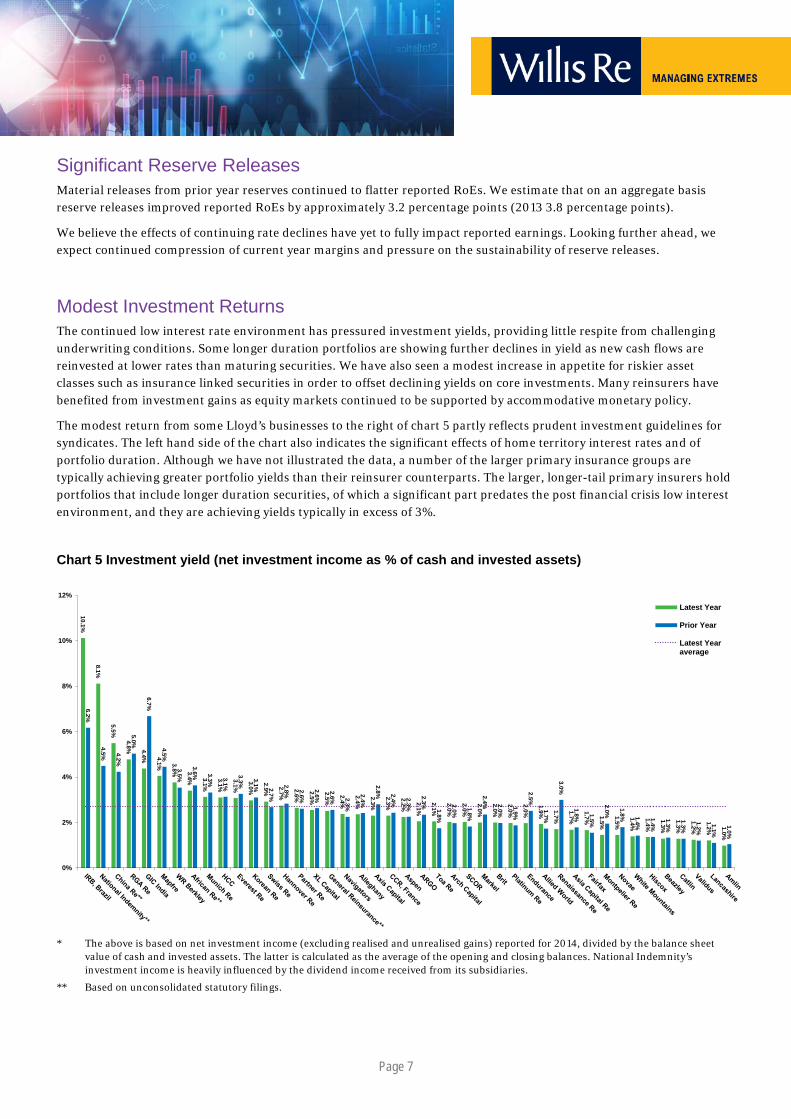
Modest Investment Returns The continued low interest rate environment has pressured investment yields, providing little respite from challenging underwriting conditions. Some longer duration portfolios are showing further declines in yield as new cash flows are reinvested at lower rates than maturing securities. We have also seen a modest increase in appetite for riskier asset classes such as insurance linked securities in order to offset declining yields on core investments. Many reinsurers have benefited from investment gains as equity markets continued to be supported by accommodative monetary policy.
The modest return from some Lloyd’s businesses to the right of chart 5 partly reflects prudent investment guidelines for syndicates. The left hand side of the chart also indicates the significant effects of home territory interest rates and of portfolio duration. Although we have not illustrated the data, a number of the larger primary insurance groups are typically achieving greater portfolio yields than their reinsurer counterparts. The larger, longer-tail primary insurers hold portfolios that include longer duration securities, of which a significant part predates the post financial crisis low interest environment, and they are achieving yields typically in excess of 3%.
Chart 5 Investment yield (net investment income as % of cash and invested assets)
* The above is based on net investment income (excluding realised and unrealised gains) reported for 2014, divided by the balance sheet value of cash and invested assets. The latter is calculated as the average of the opening and closing balances. National Indemnity’s investment income is heavily influenced by the dividend income received from its subsidiaries.
** Based on unconsolidated statutory filings.
10.1%
8.1%
5.5%
4.8% 4.4% 4.1% 3.8% 3.4% 3.1%
3.1%
3.1%
3.0%
2.9%
2.7%
2.6%
2.5%
2.5%
2.4%
2.4%
2.3%
2.3%
2.2% 2.1%
2.1%
2.0%
2.0%
2.0%
2.0%
2.0%
2.0%
1.9% 1.7%
1.7%
1.7% 1.5%
1.5%
1.4%
1.4%
1.3%
1.3%
1.2%
1.2% 1.0%
6.2%
4.5% 4.2%
5.0%
6.7%
4.5%
3.5%
3.6% 3.3% 3.1%
3.3%
3.1% 2.7%
2.8% 2.6%
2.6%
2.6% 2.3%
2.4%
2.8% 2.4%
2.3%
2.3%
1.8%
2.0%
1.8%
2.4% 2.0%
1.9%
2.5%
1.7%
3.0%
1.8% 1.5%
2.0%
1.8% 1.4%
1.4%
1.3%
1.3%
1.2%
1.1%
1.0%
0%
2%
4%
6%
8%
10%
12%
Latest Year
Prior Year
Latest Yearaverage

Page 8
Underwriting Performance Premium Volumes Chart 6 shows that the average reported increase in net written premium (NWP) by our Willis Reinsurance Index companies in the latest reported year was approximately 6.3%. As rates remained pressured, this growth was driven more often by lower outwards cessions of reinsurance or retrocession premiums rather than through organic growth. Where organic growth was achieved it was typically through niche lines of business. The increase in NWP was also supported by underwriting through collateralised vehicles or sidecars and small acquisitions.
Overall, on an aggregate basis and converted into USD, the Willis Reinsurance Index reported a decline in NWP of 3.7% to USD 244B, although this is explained entirely by the decline of the euro vs the US dollar in our calculations (we estimate +2.2% excluding foreign exchange effects within our methodology.).
Chart 6: Full-year 2014 movement in net written premium
Note: Korean Re and National Indemnity are not included within the results above, due to the lack of comparability of the current vs prior year numbers.
*** Based on unconsolidated statutory filings.
The strong reported growth at both Lancashire and Markel largely reflected their respective acquisitions of Cathedral and Alterra. Arch’s growth similarly reflects acquired US mortgage insurance business and premiums written by the Watford Re vehicle that it sponsored with Highbridge.
At the other end of the scale, double digit decreases were reported at RenaissanceRe and Platinum Re. For RenaissanceRe, this was partly due to a reduction in Property Cat business due to continued declining rates. For Platinum Re, the primary reasons were a one off adjustment reported in Q2 2013 to re-estimate ultimate premiums on prior year US Excess Casualty business and, to a lesser extent, a decline in International Property Cat premiums. For Munich Re, much of the 4.4% fall was caused by the strengthening of the USD against the euro (Munich Re’s reporting currency) and by a 19% fall in NWP in its Munich Health division, as a result of falls in volumes in its Canada and US business.
33.2%
29.1%
21.0%
16.1% 12.6%
11.0% 9.5%
9.4%
9.3%
9.0% 8.0%
7.9%
7.2%
7.2%
6.9%
6.4%
6.0%
5.3%
5.2%
5.0%
5.0%
4.9%
4.4%
3.8%
3.4%
2.5% 1.3%
1.3%
1.2%
-0.5% -2.0% -4.1%
-4.4%
-5.6%
-11.3%
-13.2%
26.0%
17.0%
-4.1%
12.2%
-3.0%
-20%
-10%
0%
10%
20%
30%
40%Y/e Dec 2014
Y/e Mar 2014
Y/e Dec 2013
Unweighted average
Page 9
Impact of Convergence of Reinsurance and Capital Markets A brief analysis of 2014 premiums highlights that many traditional reinsurers are embracing structural change to respond to market dynamics. A significant number of reinsurers now offer capacity to clients through managed Special Purpose Vehicles (SPVs), sidecars (often fully collateralised), and collateralised retrocession agreements. Deployment of this third party alternative capital maintains relevance to the client and also provides reinsurers with associated fee income.
Amlin (Leadenhall Capital), Arch (Watford Re) and Aspen (Silverton Re) each reported meaningful contributions within their consolidated financials from new arrangements, while Everest Re (Mount Logan Re) and Montpelier Re (Blue Capital Re) reported significant increases in their existing ones. Other reinsurers, such as Lancashire, who do not fully consolidate their capital market vehicles, are also reporting increased involvement in alternative platforms. White Mountains appears to have adopted a contrary position, dissolving some of its Sirius Capital Markets business in 2014.
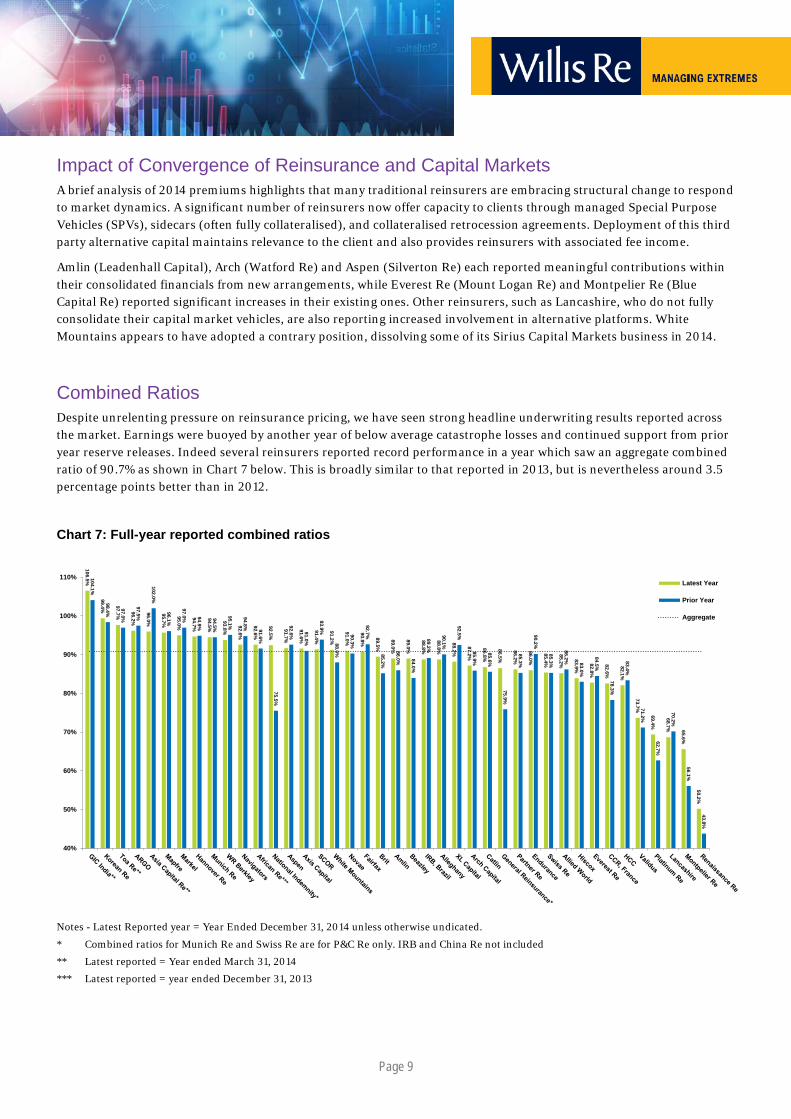
Combined Ratios Despite unrelenting pressure on reinsurance pricing, we have seen strong headline underwriting results reported across the market. Earnings were buoyed by another year of below average catastrophe losses and continued support from prior year reserve releases. Indeed several reinsurers reported record performance in a year which saw an aggregate combined ratio of 90.7% as shown in Chart 7 below. This is broadly similar to that reported in 2013, but is nevertheless around 3.5 percentage points better than in 2012.
Chart 7: Full-year reported combined ratios
Notes - Latest Reported year = Year Ended December 31, 2014 unless otherwise undicated.
* Combined ratios for Munich Re and Swiss Re are for P&C Re only. IRB and China Re not included
** Latest reported = Year ended March 31, 2014
*** Latest reported = year ended December 31, 2013
106.5%
99.4% 97.7%
96.2%
96.0%
95.7%
95.0%
94.7%
94.5%
93.8%
92.6%
92.6%
92.5%
91.7%
91.6%
91.4%
91.2%
91.0%
90.8%
89.5%
89.0%
89.0%
88.8%
88.8%
88.2%
87.2%
86.8%
86.5%
86.2%
86.0%
85.4%
85.2%
83.9%
82.8%
82.6%
82.1%
73.7%
69.4%
68.7% 65.6%
50.2%
104.1%
98.4%
97.0%
97.5%
102.0%
96.1%
97.0% 94.9%
94.5%
95.1%
94.8% 91.6%
75.5%
92.6%
91.0%
93.9%
88.0%
90.3%
92.7%
85.2%
86.0% 84.0%
89.2%
90.1%
92.5%
85.9%
85.6%
75.9%
85.3%
90.2%
85.3%
86.2% 83.0%
84.5%
78.3%
83.4%
71.2%
62.7%
70.2%
56.1%
43.8%
40%
50%
60%
70%
80%
90%
100%
110%Latest Year
Prior Year
Aggregate
Page 10
In the following subsection below, we discuss the key components of the combined ratio for the publicly listed companies within the Willis Reinsurance Index:
i. Impact of prior year loss reserve development
ii. Catastrophe loss component
iii. Underlying accident year combined ratio (i.e. excluding the above two components)
i) Prior Year Loss Development Rating agencies have been performing stress test analyses of industry loss reserve adequacy which have indicated that current capital positions can withstand considerable reserve volatility. Nevertheless a combination of pricing declines and prolonged benign loss environment could represent a threat to future reserve releases which are often the difference between meeting the cost of capital or not.
In 2014, we appear to be seeing some isolated increases in reported adverse reserve development, typically driven by company-specific or event-specific factors. Adverse development is also being more commonly reported for some US insurance lines, such as auto liability and commercial general liability. Indeed, an analysis of US statutory filings indicated a net adverse movement in prior year reserves in the 2014 financial year. Strengthening of asbestos reserves following periodic actuarial reviews has also impacted some commercial insurers’ results.
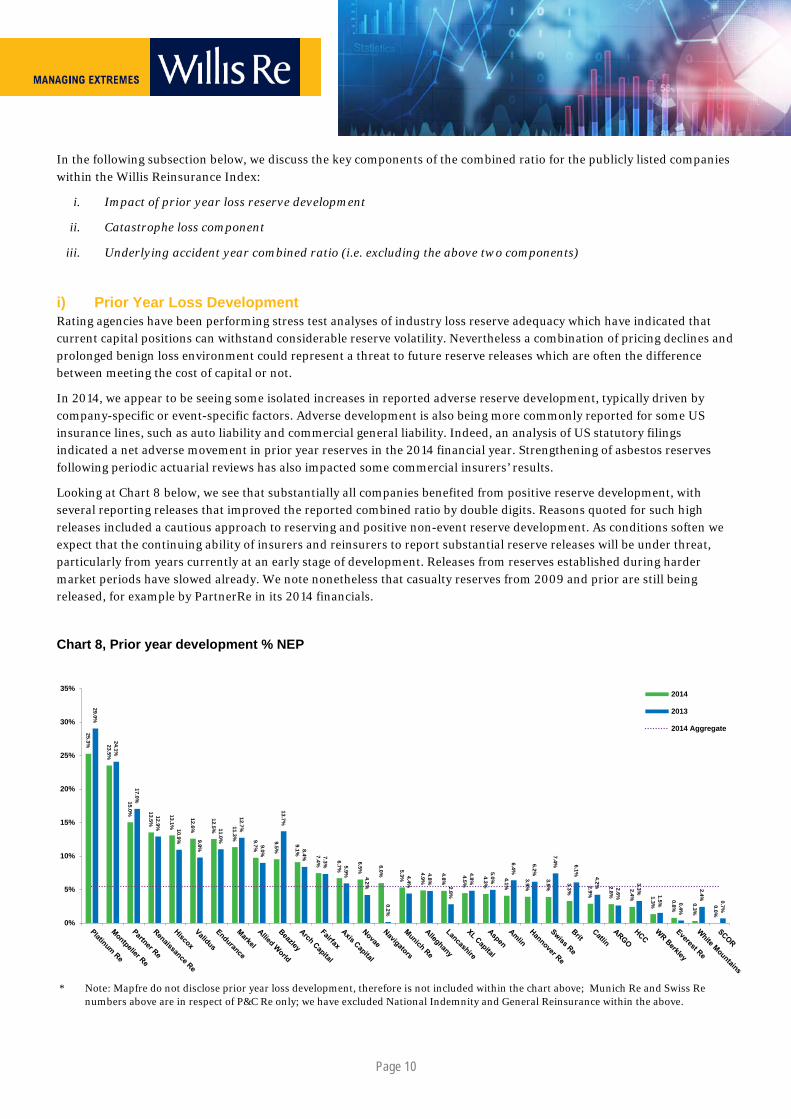
Looking at Chart 8 below, we see that substantially all companies benefited from positive reserve development, with several reporting releases that improved the reported combined ratio by double digits. Reasons quoted for such high releases included a cautious approach to reserving and positive non-event reserve development. As conditions soften we expect that the continuing ability of insurers and reinsurers to report substantial reserve releases will be under threat, particularly from years currently at an early stage of development. Releases from reserves established during harder market periods have slowed already. We note nonetheless that casualty reserves from 2009 and prior are still being released, for example by PartnerRe in its 2014 financials.
Chart 8, Prior year development % NEP
* Note: Mapfre do not disclose prior year loss development, therefore is not included within the chart above; Munich Re and Swiss Re numbers above are in respect of P&C Re only; we have excluded National Indemnity and General Reinsurance within the above.
25.3% 23.5%
15.0% 13.5%
13.1%
12.6%
12.5% 11.3% 9.7%
9.5%
9.1% 7.4% 6.7%
6.5%
6.0% 5.3%
4.9%
4.8%
4.5%
4.3%
4.1%
3.9%
3.9% 3.3%
2.9%
2.8%
2.4% 1.3%
0.8%
0.3%
0.0%
29.0%
24.1%
17.0%
12.9% 10.9% 9.8%
11.0%
12.7%
9.0%
13.7%
8.4% 7.3% 5.9%
4.2%
0.2%
4.4%
4.8%
2.8%
4.8%
5.0%
6.4%
6.2%
7.4% 6.1%
4.2% 2.6%
3.3%
1.5% 0.4%
2.4%
0.7%
0%
5%
10%
15%
20%
25%
30%
35%2014
2013
2014 Aggregate
Page 11
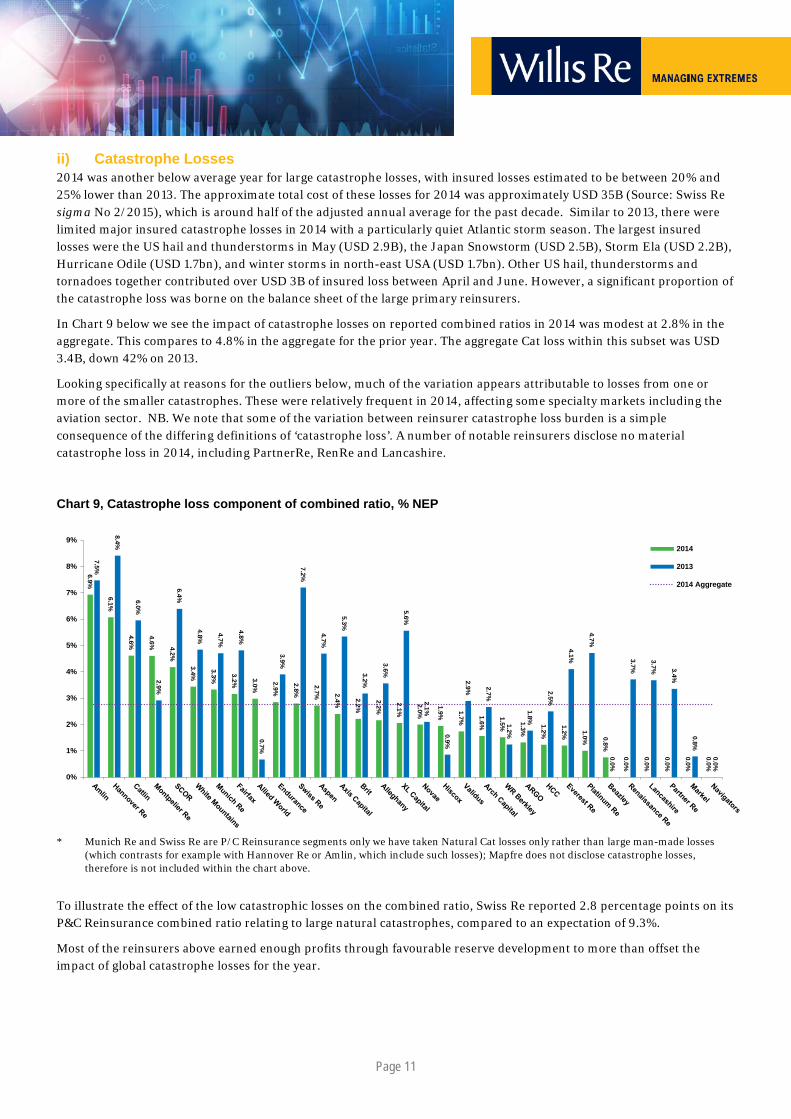
ii) Catastrophe Losses 2014 was another below average year for large catastrophe losses, with insured losses estimated to be between 20% and 25% lower than 2013. The approximate total cost of these losses for 2014 was approximately USD 35B (Source: Swiss Re sigma No 2/2015), which is around half of the adjusted annual average for the past decade. Similar to 2013, there were limited major insured catastrophe losses in 2014 with a particularly quiet Atlantic storm season. The largest insured losses were the US hail and thunderstorms in May (USD 2.9B), the Japan Snowstorm (USD 2.5B), Storm Ela (USD 2.2B), Hurricane Odile (USD 1.7bn), and winter storms in north-east USA (USD 1.7bn). Other US hail, thunderstorms and tornadoes together contributed over USD 3B of insured loss between April and June. However, a significant proportion of the catastrophe loss was borne on the balance sheet of the large primary reinsurers.
In Chart 9 below we see the impact of catastrophe losses on reported combined ratios in 2014 was modest at 2.8% in the aggregate. This compares to 4.8% in the aggregate for the prior year. The aggregate Cat loss within this subset was USD 3.4B, down 42% on 2013.
Looking specifically at reasons for the outliers below, much of the variation appears attributable to losses from one or more of the smaller catastrophes. These were relatively frequent in 2014, affecting some specialty markets including the aviation sector. NB. We note that some of the variation between reinsurer catastrophe loss burden is a simple consequence of the differing definitions of ‘catastrophe loss’. A number of notable reinsurers disclose no material catastrophe loss in 2014, including PartnerRe, RenRe and Lancashire.
Chart 9, Catastrophe loss component of combined ratio, % NEP
* Munich Re and Swiss Re are P/C Reinsurance segments only we have taken Natural Cat losses only rather than large man-made losses (which contrasts for example with Hannover Re or Amlin, which include such losses); Mapfre does not disclose catastrophe losses, therefore is not included within the chart above.
To illustrate the effect of the low catastrophic losses on the combined ratio, Swiss Re reported 2.8 percentage points on its P&C Reinsurance combined ratio relating to large natural catastrophes, compared to an expectation of 9.3%.
Most of the reinsurers above earned enough profits through favourable reserve development to more than offset the impact of global catastrophe losses for the year.
6.9%
6.1%
4.6%
4.6% 4.2%
3.4%
3.3%
3.2% 3.0%
2.9%
2.8%
2.7% 2.4% 2.2%
2.2%
2.1%
2.0%
1.9% 1.7% 1.6%
1.5% 1.3%
1.2%
1.2% 1.0% 0.8%
0.0%
0.0%
0.0%
0.0%
0.0%
7.5%
8.4%
6.0%
2.9%
6.4%
4.8%
4.7%
4.8%
0.7%
3.9%
7.2%
4.7%
5.3%
3.2%
3.6%
5.6%
2.1%
0.9%
2.9% 2.7%
1.2%
1.8%
2.5%
4.1%
4.7%
0.0%
3.7%
3.7% 3.4%
0.8%
0.0%
0%
1%
2%
3%
4%
5%
6%
7%
8%
9%2014
2013
2014 Aggregate
Page 12
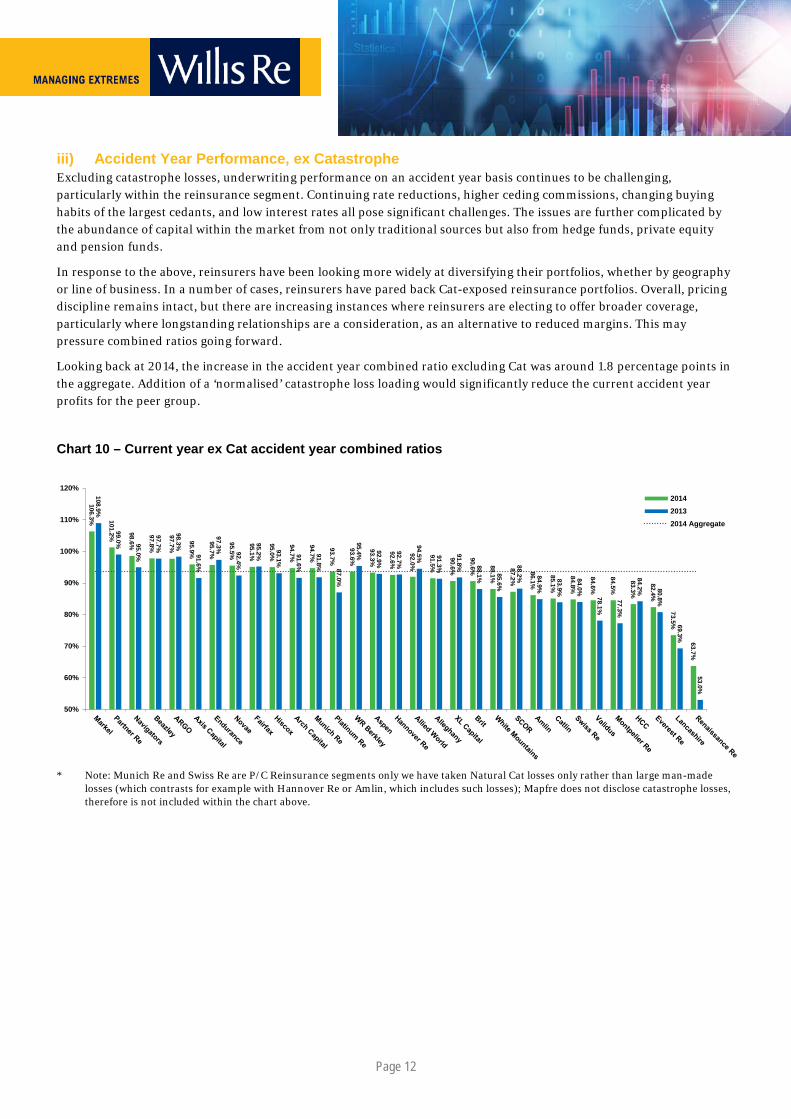
iii) Accident Year Performance, ex Catastrophe Excluding catastrophe losses, underwriting performance on an accident year basis continues to be challenging, particularly within the reinsurance segment. Continuing rate reductions, higher ceding commissions, changing buying habits of the largest cedants, and low interest rates all pose significant challenges. The issues are further complicated by the abundance of capital within the market from not only traditional sources but also from hedge funds, private equity and pension funds.
In response to the above, reinsurers have been looking more widely at diversifying their portfolios, whether by geography or line of business. In a number of cases, reinsurers have pared back Cat-exposed reinsurance portfolios. Overall, pricing discipline remains intact, but there are increasing instances where reinsurers are electing to offer broader coverage, particularly where longstanding relationships are a consideration, as an alternative to reduced margins. This may pressure combined ratios going forward.
Looking back at 2014, the increase in the accident year combined ratio excluding Cat was around 1.8 percentage points in the aggregate. Addition of a ‘normalised’ catastrophe loss loading would significantly reduce the current accident year profits for the peer group.
Chart 10 – Current year ex Cat accident year combined ratios
* Note: Munich Re and Swiss Re are P/C Reinsurance segments only we have taken Natural Cat losses only rather than large man-made losses (which contrasts for example with Hannover Re or Amlin, which includes such losses); Mapfre does not disclose catastrophe losses, therefore is not included within the chart above.
106.3% 101.2% 98.6%
97.8%
97.7%
95.9%
95.7%
95.5%
95.1%
95.0%
94.7%
94.7%
93.7%
93.6%
93.3%
92.6%
92.0%
91.5%
90.6%
90.6%
88.1%
87.2%
86.1%
85.1%
84.8%
84.6%
84.5%
83.3%
82.4%
73.5%
63.7%
108.9%
99.0% 95.0%
97.7%
98.3%
91.6%
97.3% 92.4%
95.2%
93.1%
91.6%
91.8% 87.0%
95.4% 92.9%
92.7%
94.5% 91.3%
91.8% 88.1% 85.6%
88.2% 84.9%
83.9%
84.0%
78.1%
77.3%
84.2% 80.8%
69.3%
53.0%
50%
60%
70%
80%
90%
100%
110%
120%201420132014 Aggregate
Page 13
Dec-31 Dec-31 Dec-31 ∆ FY FY FY ∆ FY FY FY ∆ FY FY FY ∆
2014 2013 2012 FY 2014 2013 2012 FY 2014 2013 2012 FY 2014 2013 2014 2013 2012 FYAfrican Re USD 678 609 569 586 119 85 93 39.7% 13.2% 92.6% 91.6%
Alleghany USD 7,473 6,924 6,404 7.9% 4,498 4,287 3,724 4.9% 679 628 702 8.1% 9.3% 9.5% 88.8% 90.1% 94.1% -1.3%
Allied World USD 3,778 3,520 3,326 7.3% 2,322 2,120 1,838 9.5% 490 418 493 17.3% 13.4% 12.2% 85.2% 86.2% 94.5% -1.0%
Amlin (2) GBP 1,783 1,678 1,497 6.2% 2,296 2,126 2,059 8.0% 237 299 248 -20.8% 13.8% 18.6% 89.0% 86.0% 89.0% +3.0%
Arch Capital USD 6,130 5,647 5,169 8.5% 3,892 3,351 3,052 16.1% 834 710 593 17.6% 13.9% 13.2% 87.2% 85.9% 95.4% +1.3%
ARGO USD 1,647 1,563 1,514 5.4% 1,368 1,351 1,245 1.2% 183 143 52 27.9% 11.4% 9.4% 96.2% 97.5% 104.6% -1.3%
Asia Capital Re (3) USD 819 795 490 389 24 56 3.0% 96.0% 102.0%
Aspen USD 3,419 3,300 3,488 3.6% 2,515 2,300 2,247 9.4% 356 329 280 8.0% 10.4% 9.9% 91.7% 92.6% 94.3% -0.9%
Axis Capital USD 5,821 5,818 5,780 0.1% 3,907 3,928 3,337 -0.5% 811 727 547 11.4% 13.9% 13.7% 91.6% 91.0% 96.2% +0.6%
Beazley (4) USD 1,343 1,339 1,205 0.3% 1,733 1,677 1,543 3.4% 218 264 215 -17.5% 16.6% 21.3% 89.0% 84.0% 91.0% +5.0%
Brit (5) GBP 828 687 684 20.4% 1,025 956 937 7.2% 139 102 85 36.7% 18.3% 15.0% 89.5% 85.2% 93.2% +4.3%
Catlin USD 3,402 3,193 2,922 6.5% 4,345 4,052 3,834 7.2% 418 392 305 6.6% 12.6% 13.0% 86.8% 85.6% 90.0% +1.2%
China Re (1)(6) CNY 45,294 43,675 63,818 56,871 12.2% 3,396 2,318 7.6% na na
CCR, France (1)(7) EUR 1,969 1,875 1,763 5.0% 1,323 1,256 1,346 5.3% 193 210 242 -7.9% 10.0% 11.5% 82.6% 78.3% 87.5% +4.3%
Endurance USD 3,185 2,887 2,711 10.3% 1,934 2,049 2,029 -5.6% 348 312 163 11.7% 11.4% 11.2% 86.0% 90.2% 102.3% -4.2%
Everest Re USD 7,451 6,968 6,733 6.9% 5,257 5,005 4,081 5.0% 1,199 1,259 829 -4.8% 16.6% 18.6% 82.8% 84.5% 93.8% -1.7%
Fairfax (8) USD 9,526 8,353 8,821 14.0% 6,302 6,036 6,194 4.4% 1,633 -573 532 384.8% 17.8% -6.8% 90.8% 92.7% 99.8% -1.9%
General Reinsurance* USD 11,707 11,562 10,693 1.3% 593 543 567 9.3% 538 931 433 -42.2% 4.6% 8.8% 86.5% 75.9% 90.3% +10.6%
GIC India (1)(3)(9) INR 323,821 272,376 132,126 137,712 -4.1% 22,532 23,446 7.6% 106.5% 104.1% +2.4%
Hannover Re (1)(10) EUR 7,551 5,888 6,056 28.2% 12,581 12,420 12,366 1.3% 986 895 858 10.1% 14.9% 15.1% 94.7% 94.9% 95.8% -0.2%
HCC USD 3,903 3,674 3,543 6.2% 2,373 2,255 2,253 5.2% 458 407 391 12.6% 12.0% 11.4% 82.1% 83.4% 83.6% -1.3%
Hiscox (11) GBP 1,453 1,409 1,365 3.1% 1,343 1,371 1,268 -2.0% 216 238 208 -9.1% 15.5% 17.1% 83.9% 83.0% 85.5% +0.9%
IRB, Brazil (12 BRL 2,954 2,668 2,523 10.7% 1,946 1,508 1,061 29.1% 602 349 397 72.5% 21.4% 13.4% 88.8% 89.2% 105.4% -0.3%
Korean Re (1)(13) KRWbn 1,839 1,451 1,413 26.7% 3,929 2,897 3,744 35.6% 116 129 138 -9.7% 7.1% 9.0% 99.4% 98.4% 98.4% +1.0%
Lancashire USD 1,357 1,460 1,387 -7.0% 743 558 576 33.2% 229 223 235 3.1% 15.7% 16.3% 68.7% 70.2% 63.9% -1.5%
Mapfre (1)(14) EUR 9,153 7,834 7,811 16.8% 18,458 18,002 18,272 2.5% 845 791 666 6.9% 9.9% 10.0% 95.7% 96.1% 95.4% -0.4%
Markel USD 7,595 6,674 3,889 13.8% 3,917 3,237 2,214 21.0% 321 281 253 14.3% 4.5% 5.1% 95.0% 97.0% 97.0% -2.0%
Montpelier Re USD 1,648 1,642 1,629 0.4% 651 603 616 7.9% 224 205 228 9.5% 13.6% 12.6% 65.6% 56.1% 81.0% +9.5%
Munich Re (1)(15) EUR 30,033 25,983 27,181 15.6% 47,225 49,404 50,174 -4.4% 3,153 3,313 3,195 -4.8% 11.3% 12.0% 94.5% 94.5% 94.5% +0.0%
National Indemnity* USD 93,998 97,226 78,862 -3.3% 26,655 5,650 7,598 371.7% 8,391 5,366 4,837 56.4% 8.6% 6.2% 92.5% 75.5% 89.7% +17.0%
Navigators USD 1,027 902 879 13.9% 1,000 888 834 12.6% 95 63 64 50.2% 9.9% 7.1% 92.6% 94.8% 99.3% -2.2%
Novae GBP 336 313 294 7.3% 528 497 528 6.4% 50 32 28 58.9% 15.8% 10.5% 91.0% 90.3% 90.5% +0.7%
Partner Re USD 7,049 6,710 6,933 5.1% 5,720 5,397 4,573 6.0% 1,055 664 1,135 58.9% 15.3% 9.9% 86.2% 85.3% 87.8% +0.9%
Platinum Re USD 1,738 1,747 1,895 -0.5% 492 567 565 -13.2% 165 223 327 -26.2% 9.4% 12.4% 69.4% 62.7% 62.5% +6.7%
Renaissance Re USD 3,866 3,904 3,503 -1.0% 1,068 1,204 1,103 -11.3% 533 691 601 -22.9% 13.9% 18.9% 50.2% 43.8% 57.8% +6.4%
RGA Re (1) USD 7,023 5,936 6,910 18.3% 8,670 8,254 7,907 5.0% 684 419 632 -33.7% 10.5% 6.6%
SCOR EUR 5,694 4,940 4,803 15.3% 10,138 9,130 8,538 11.0% 512 549 418 -6.7% 9.7% 10.9% 91.4% 93.9% 94.1% -2.5%
Sw iss Re USD 35,930 32,952 34,002 9.0% 31,640 30,478 25,344 3.8% 3,500 4,444 4,201 -21.2% 10.2% 13.6% 85.4% 85.3% 83.1% +0.1%
Toa Re JPYbn 160 125 201 171 9 8 6.2% 97.7% 97.0%
Validus USD 3,588 3,704 4,021 -3.1% 2,054 2,029 1,859 1.3% 481 533 408 -9.6% 13.1% 14.0% 73.7% 71.2% 86.8% +2.5%
White Mountains (16) USD 3,997 3,906 3,732 2.3% 2,112 1,976 2,127 6.9% 313 322 207 -2.8% 7.8% 8.5% 91.2% 88.0% 94.3% +3.2%
WR Berkley USD 4,590 4,336 4,306 5.9% 5,997 5,500 4,899 9.0% 649 500 511 29.8% 14.3% 11.6% 93.8% 95.1% 97.2% -1.3%
XL Capital (1) USD 10,034 9,998 10,510 0.4% 5,945 6,199 6,281 -4.1% 188 1,060 651 -82.2% 1.9% 10.4% 88.2% 92.5% 96.3% -4.3%
Aggregate** USD 327,702 335,142 311,042 258,689 263,124 248,145 33,331 31,385 29,192 10.3% 9.7% 90.7% 90.3% 93.9%
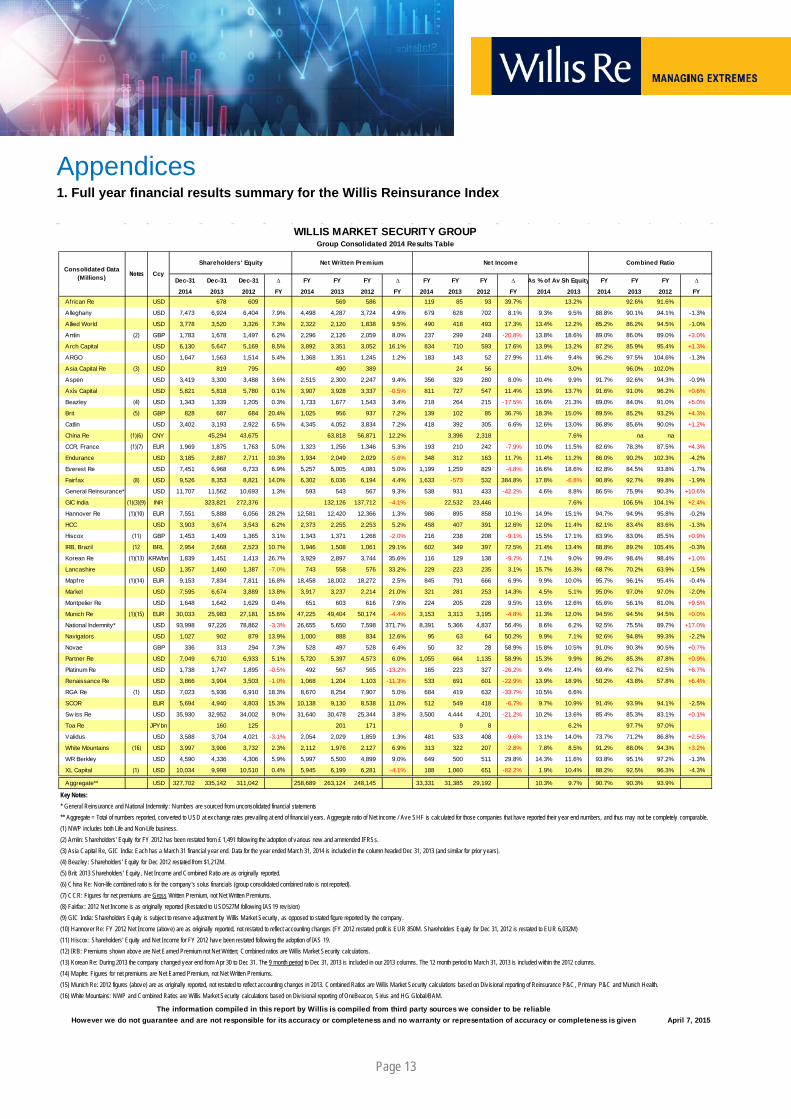
Key Notes: * General Reinsurance and National Indemnity : Numbers are sourced from unconsolidated financial statements** Aggregate = Total of numbers reported, converted to USD at exchange rates prevailing at end of financial years. Aggregate ratio of Net income / Ave SHF is calculated for those companies that have reported their year end numbers, and thus may not be completely comparable.(1) NWP includes both Life and Non-Life business.(2) Amlin: Shareholders' Equity for FY 2012 has been restated from £ 1,491 following the adoption of various new and ammended IFRSs.(3) Asia Capital Re, GIC India: Each has a March 31 financial year end. Data for the year ended March 31, 2014 is included in the column headed Dec 31, 2013 (and similar for prior years).(4) Beazley: Shareholders' Equity for Dec 2012 restated from $1,212M.(5) Brit: 2013 Shareholders' Equity , Net Income and Combined Ratio are as originally reported.(6) China Re: Non-life combined ratio is for the company 's solus financials (group consolidated combined ratio is not reported).(7) CCR: Figures for net premiums are Gross Written Premium, not Net Written Premiums.(8) Fairfax: 2012 Net Income is as originally reported (Restated to USD527M following IAS19 rev ision) (9) GIC India: Shareholders Equity is subject to reserve adjustment by Willis Market Security , as opposed to stated figure reported by the company.(10) Hannover Re: FY 2012 Net Income (above) are as originally reported, not restated to reflect accounting changes (FY 2012 restated profit is EUR 850M. Shareholders Equity for Dec 31, 2012 is restated to EUR 6,032M) (11) Hiscox: Shareholders' Equity and Net Income for FY 2012 have been restated following the adoption of IAS 19.(12) IRB: Premiums shown above are Net Earned Premium not Net Written; Combined ratios are Willis Market Security calculations.(13) Korean Re: During 2013 the company changed year end from Apr 30 to Dec 31. The 9 month period to Dec 31, 2013 is included in our 2013 columns. The 12 month period to March 31, 2013 is included within the 2012 columns.(14) Mapfre: Figures for net premiums are Net Earned Premium, not Net Written Premiums.(15) Munich Re: 2012 figures (above) are as originally reported, not restated to reflect accounting changes in 2013. Combined Ratios are Willis Market Security calculations based on Div isional reporting of Reinsurance P&C, Primary P&C and Munich Health.(16) White Mountains: NWP and Combined Ratios are Willis Market Security calculations based on Div isional reporting of OneBeacon, Sirius and HG Global/BAM.
April 7, 2015
WILLIS MARKET SECURITY GROUPGroup Consolidated 2014 Results Table
Consolidated Data (Millions) Notes Ccy
Shareholders' Equity Net Written Premium Net Income
As % of Av Sh Equity
However we do not guarantee and are not responsible for its accuracy or completeness and no warranty or representation of accuracy or completeness is given
Combined Ratio
The information compiled in this report by Willis is compiled from third party sources we consider to be reliable
Appendices 1. Full year financial results summary for the Willis Reinsurance Index
Page 14
2. Investment leverage: cash & invested assets / shareholders equity
3. 2015 share price development
2014 Full year share price development
7.39 6.91
5.46
4.83 4.36
4.24 3.82
3.72
3.60
3.58
3.39
3.31 3.12 2.75
2.73
2.60
2.60
2.58
2.58
2.57
2.55
2.54
2.53
2.45
2.45
2.43
2.39
2.39
2.37
2.27
2.11
1.95
1.94
1.89
1.88
1.88
1.85
1.75
1.72
1.69
1.53
1.39
1.33
7.89
7.85
5.62
4.58
4.67 4.25
4.35 3.86 3.55
3.62
4.04
3.31
3.77
2.85
2.89
2.82
2.84 2.49
2.70
2.54
2.72
2.71 2.52
2.64
2.56
2.68 2.23
2.37
2.41 2.15
2.28 2.07
1.97
1.88
1.85
1.96
1.97
1.86 1.53
1.66
1.66
1.60 1.35
0.0x
1.0x
2.0x
3.0x
4.0x
5.0x
6.0x
7.0x
8.0x
9.0x
10.0x
Latest Year
Prior Year
+25.3% +22.5%
+20.5%
+18.4%
+17.4% +14.4%
+12.7%
+12.5%
+12.5%
+12.3%
+10.5% +9.0%
+8.0%
+7.6%
+7.5%
+7.2%
+7.0%
+6.5%
+6.5%
+5.6%
+5.4%
+5.1%
+5.1%
+4.7%
+4.1%
+3.3% +1.6%
+0.7%
+0.3%
+0.2%
(0.2)%
(0.2)%
(0.3)% (3.3)% (6.0)%(10)%
(5)%
0
5%
10%
15%
20%
25%
30%
+43.5%
+27.0%
+23.1%
+20.2%
+19.8%
+19.3%
+18.1%
+17.7%
+16.1%
+16.0%
+15.9%
+15.6%
+13.2%
+11.4%
+9.3%
+8.3%
+7.9%
+7.4%
+6.0%
+5.9%
+4.5%
+4.2%
+3.5%
+3.2%
+2.0%
+2.0%
+0.8%
(0.1)%
(1.0)% (4.9)%
(5.2)%
(5.7)%
(7.7)%
(9.6)%
(30.9)%(40)%
(30)%
(20)%
(10)%
0
10%
20%
30%
40%
50%
Willis Re London The Willis Building51 Lime StreetLondon EC3M 7DQTel: +44 (0)20 3124 6000
Willis Limited, Registered number: 181116 England and Wales.Registered address: 51 Lime Street, London EC3M 7DQA Lloyd’s Broker. Authorised and regulated by the Financial Conduct Authority.
© Copyright 2015 Willis Limited/Willis Re Inc. All rights reserved: No part of this publication may be reproduced, disseminated, distributed, stored in a retrieval system, transmitted or otherwise transferred in any form or by any means, whether electronic, mechanical, photocopying, recording, or otherwise, without the permission of Willis Limited/Willis Re Inc. Some information contained in this document may be compiled from third party sources and we do not guarantee and are not responsible for the accuracy of such. This document is for general information only and is not intended to be relied upon. Any action based on or in connection with anything contained herein should be taken only after obtaining specific advice from independent professional advisors of your choice. The views expressed in this document are not necessarily those of Willis Limited/Willis Re Inc., its parent companies, sister companies, subsidiaries or affiliates (hereinafter “Willis”). Willis is not responsible for the accuracy or completeness of the contents herein and expressly disclaims any responsibility or liability for the reader’s application of any of the contents herein to any analysis or other matter, or for any results or conclusions based upon, arising from or in connection with the contents herein, nor do the contents herein guarantee, and should not be construed to guarantee, any particular result or outcome. Willis accepts no responsibility for the content or quality of any third party websites to which we refer.
13974/03/15
How can we help? To find out how we can offer you an extra depth of servicecombined with extra flexibility, simply contact us.
Begin by visiting our website at www.willisre.comor calling your local office.
Main Contact
13974_COVERS_Year End Financial Results_Opt3 Singles.indd 2 23/03/2015 15:35:14