Embed Size (px)
Citation preview

The light transmission and seiche depth of Izmir Bay,western Turkey
Erdem Sayin1, Sezgi Adalioglu2 and Canan Eronat3
Dokuz Eylul University, Institute of Marine Sciences & Technology, Inciralti, 35340 Izmir, Turkey.1e-mail: [email protected]: [email protected]: [email protected]
Izmir Bay is one of the most polluted estuaries in the whole Mediterranean Sea. The inner partof the Bay (Inner Bay) is heavily affected by domestic and industrial discharge. As a result ofthese loads, strong eutrophication occurs in the Inner Bay, which is temporally anaerobic. Theecologically sensitive approach of the local authorities during the last decade has given rise to awide variety of monitoring and research studies on this bay. On the other hand, the municipalityof Izmir started to operate wastewater treatment facilities since January 2000. The Institute ofMarine Sciences and Technology – Izmir (IMST) with its research vessel R/V K Piri Reis hasbeen conducting an intensive monitoring program since 1988 and especially during the recent fewyears. These investigations provide an opportunity for the evaluation of the performance of thewastewater treatment plant in terms of the change in the optical properties of Izmir Bay waterin a positive manner. The turbidity values measured in these monitoring studies indicate that thevalues have changed drastically after January 2000. Their spatial variation indicates that the valuesdecrease from the Inner Bay towards the Aegean Sea. The turbidity (light transmission) valuesare measured with an automatic CTD (conductivity, temperature and depth) system during eachcruise. The seiche disc depth measurement is carried out only occasionally. The accuracy of theseiche disc depth is dependent on certain daylight conditions and depends on the operator. Theseiche disc depth (Ds) is an important parameter to estimate primary production of organic matter(hereafter called production). A relation between light transmission (turbidity) value and seichedisc depth (Ds) is found with very good agreement. The correlations are very high (approximately0.94) with slight seasonal variation.
1. Introduction
Izmir Bay is one of the largest bays in thewestern region of the Aegean Sea coast of Turkey.It is roughly ‘L’ shaped with its entrance fromthe Aegean Sea at its north. According to thetopographical, hydrological and ecological features,Izmir Bay is divided into three regions (Inner, Mid-dle and Outer Bay). Outer Bay is divided intofurther three sub-regions (Outer-I, Outer-II andOuter-III; figure 1). The water properties of thebay are generally analyzed using the data from
these different regions. Monitoring studies in IzmirBay have been carried out by the Institute ofMarine Sciences and Technology of Dokuz EylulUniversity with R/V K Piri Reis, Izmir since 1980.The important physical features based on obser-vations and modeling studies were given by Sayin(2003). Unfortunately, there have been no previousstudies relating the optical properties and turbi-dity of Izmir Bay. Therefore, this study is meantto be a pioneering work which studies the opticalproperties, i.e., light transmission and seiche discdepth of Izmir Bay.
Keywords. Light transmission; light intensity; seiche depth; Izmir Bay; correlation; attenuation coefficient.
J. Earth Syst. Sci. 116, No. 1, February 2007, pp. 57–71© Printed in India. 57

58 Erdem Sayin et al
Figure 1. Locations of CTD stations in the Izmir Bay. Stations selected to identify optical parameter changes (stations 1,11, 22 and 25) are indicated in a circle.
During the past 30–40 years, Izmir Bay has beenheavily influenced by anthropogenic pollution fromthe city of Izmir. This pollution (including domes-tic and industrial waste-water, urban runoff, shipballast, sediment and contaminated waters of riversand streams) has had significant adverse effect onthe water quality of Izmir Bay. Bukata et al (1995)have analyzed the optical properties in naturalwaters. A part of their study deals with the rela-tionship between the seiche depth and the hybridproperty comprised, in part, by inherent opticalproperty of the water column (c) and in part byan apparent optical property of the water column(kd). Bukata et al have found a very high correla-tion between the total attenuation coefficient c andseiche depth Ds for some locations at Great Lakes.Vladimirov et al (1999) have used seiche depth Ds
in certain depth ranges to estimate the bio-opticalparameters, i.e., the mean value of beam atten-uation coefficient and the mean value of verticalattenuation coefficient for the Black Sea. The cor-relation coefficients by their estimates are about0.81. Similar estimates have been made by sev-eral authors (Aas 1980 for the Norwegian coastalareas and Barents Seas, Sherstyankin et al 1988 forLake Baikal and Kullenberg 1980 for the region ofPeru up-welling) for different basins other than theBlack Sea.
Hydro-optical properties of the Izmir Bay areinvestigated by using in situ measurements that
were obtained from 1996 to 2005. There are veryfew CTD measurements in 1995 and no seichedisc measurement at all in 1994 and 1995 in theBay. Seiche disc and the optical sensor (transmis-someter) of a CTD system are used to measurewater clarity. Seiche depth and light transmis-sion values are strongly related to the turbidity ofwater. Therefore, there must be a high correlationbetween seiche depth and light transmission val-ues. Such a relationship could be used to estimateunmeasured seiche depth using light transmissionvalues seasonally and regionally.
In this study we try to estimate the unobservedseiche depth Ds using light transmission values.The reason for this choice is that the light trans-mission values have been observed automaticallyusing a transmissometer which is attached to theCTD frame since 1994 in the Izmir Bay. Onthe contrary, seiche depth measurements need anextra effort and they depend on the operatorand the day light condition, i.e., zenith angle ofthe sun. Seiche depth information contains boththe inherent and the apparent optical properties.On the other hand, the light transmission holdsonly the inherent optical property. Therefore thelight transmission values can be used to calculatethe inherent optical property of the water column(c) directly. To include the apparent optical pro-perty of the water column (kd) into our estimate(to find seiche depth from light transmission), an

Light transmission and seiche depth of Izmir Bay 59
exponentially decreasing function of light trans-mission with depth is assumed in the equations.
This study is divided into six sections of whichthis introduction is the first. Sections two and threecontain a description of the optical properties suchas light transmission and seiche depth behaviorsfor Izmir Bay. Section four involves the mathemati-cal formulation and a summary of the methodsfor finding an appropriate formulation for Ds. Thecomputed results are represented in section fiveand the last section gives concluding remarks andsummarizes the major findings of the study.
2. Light transmission
Light is one of the major energy sources of algaeand some bacteria. Penetrating, scattering andabsorption of light into the water vary with thecharacteristics of chemical, physical, biological con-tents of the water. Light intensity strongly affectsthe photosynthesis and biological growth, etc. Inother words, organisms convert inorganic matterto organic matter and to organic compounds bycapturing light energy. Light penetration and pho-tosynthesis are much more effective in the upperwater column than the lower. The depth into whicha given intensity of light penetrates is a functionof the transparency of the water and differentialabsorption by the water. Since differential absorp-tion by the water is constant, the changes in thedepth of effective light penetration are primarilydue to particle concentration (Khorram et al 1991).Increased turbidity from the addition of excess sus-pended matter to water reduces light penetrationand depresses growth (Clark 1977).
Izmir Bay is one of the most polluted estuariesin the whole Mediterranean Sea. The Inner Bayis heavily affected by domestic and industrial loadsfrom the surrounding city amounting to ca. 5 mil-lion population equivalents (PE). As a result ofthese loads, strong eutrophication occurs in theinner sections of the bay that is temporally anaer-obic (IMST-124 2001). Control of the dischargeof wastewaters into the Middle Bay started sinceJanuary 2000 through the two wastewater treat-ment plants. The treated water is being dischargedinto the Middle Bay from the sea surface.
A transmissometer (Alphatracka II) which isattached to the CTD frame measures the trans-missivity. It has a modulated light source and acoherent detector. The distance between the lightsource and the detector is 10 cm (path length).This sensor measures the beam attenuation coeffi-cient (c). The beam attenuation coefficient includesboth absorption and light scatter losses. The lighttransmission is a function of the beam attenuationcoefficient.
60.0 70.0 80.0 90.0 100.0
Light Transmission (%)
80
70
60
50
40
30
20
10
0
Dep
th[m
]
Winter
60.0 70.0 80.0 90.0 100.0
Light Transmission (%)
80
70
60
50
40
30
20
10
0
Depth
[m]
Summer
Figure 2. Vertical profiles of the average light transmissionvalues of the different part of the Izmir Bay in winter (above)and summer seasons (i: Inner Bay, m: Middle Bay, 1: Outer-I,2: Outer-II, 3: Outer-III).
Generally, the light transmission values (similarto the seiche depths) change seasonally in the threeregions (Inner, Middle, and Outer) of Izmir Bay.During the summer, the Inner Bay is more turbid(∼ 63%, figure 2) in the coastal zone. In winter, theinner bay surface light transmission values increaseto ∼ 79%, from the lower summer values (∼ 63%;figure 2)”. The Middle Bay is only marginally moreturbid than the Outer Bay during both winter andsummer due to the coming surface current fromthe Aegean Sea. It enters into the Outer II throughthe narrow Mordogan Strait. The current intensityincreases in the narrow channel. As a result of thestrong surface current, counter strong bottom cur-rent occurs causing turbidity over the topographyalso in Gulbahce Bay. Therefore, the near-bottomturbidity values are sometimes higher in the OuterII compared to the values in Middle Bay in summeras well as in winter. Light transmission in Outer Iis less than the value in Middle Bay because of the
60 Erdem Sayin et al
26.5º 26.6º 26.7º 26.8º 26.9º 27.0º 27.1º
Longitude
38.4º
38.5º
38.6º
38.7º
La
titu
de
Gediz river
65
67
69
71
73
75
77
79
81
83
85
87
89
91
93
February 1997
light transmission
26.5º 26.6º 26.7º 26.8º 26.9º 27.0º 27.1º
Longitude
38.4º
38.5º
38.6º
38.7º
La
titu
de
Gediz river February 2002
light transmission
65
67
69
71
73
75
77
79
81
83
85
87
89
91
93
Figure 3. Winter distribution of surface light transmission before (above) and after 2000 in the Izmir Bay.
influences of both the sediment-rich surface waterfrom Gediz River and the anticyclonic gyre formedunder the influence of the dominant northerlywind over the Izmir Bay region. With the windsteering effect, most of the suspended materialsinks to the lower layer in the core of anticyclonicmiddle gyre in Outer I. On the other hand, offshorevalues (towards the Aegean Sea) are slightly lowerin the winter (∼ 89%) than the summer values(∼ 90.5%). In all seasons, the most turbid watertakes place in the Inner Bay and the light trans-mission values increase gradually in the directionof the Aegean Sea. Horizontal light transmissionpattern supports these regional differences. Fig-ure 3 gives the winter 1998 and 2001 surface lighttransmission distributions in the Izmir Bay.
In January 2000, the municipality of Izmir hasput the wastewater treatment facilities controllingthe coastal discharge into Izmir Bay into operation.
The observations of light transmission before andafter wastewater treatment indicate that waterclarity has increased remarkably (figures 3 and4). It is obvious that there has been a tremen-dous change in light transmission both in summerand winter. Surface light transmission values havechanged from ∼ 70% to ∼ 85–90% in winter andalso in summer in the recent 4–5 years.
Some stations in the bay have been selected toidentify any change that might occur in opticalparameters after wastewater treatment. These sta-tions are numbered as station 1 (reference station,Aegean Sea water), station 11 (Gediz river area),station 22 (this station is strongly influenced bywastewater treatment) and station 25 (in GulbahceBay).
The light transmission values of sub-surface andsub-bottom layers are shown in figure 5(a) and 5(b)respectively. It is very obvious that the turbidity is

Light transmission and seiche depth of Izmir Bay 61
60.0 70.0 80.0 90.0 100.0Light Transmission (%)
80
70
60
50
40
30
20
10
0
Depth
(m)
February
1997
2002
2005
60.0 70.0 80.0 90.0 100.0
Light Transmission (%)
80
70
60
50
40
30
20
10
0
Depth
(m)
JUNE
1996
1997
2002
2005
Figure 4. The average light transmission vertical profilesbefore and after 2000 in winter (above) and in summer inthe Izmir Bay.
lower in the bay after January 2000 in all stations.This fact is apparent both from the light transmis-sion values and from the seiche disc values. Due toinsufficient seiche disk depth values at 1998–2000on hand, the tremendous change which was seenin light transmission values cannot be shown atstations 22 and 25.
The Institute of Marine Sciences and Technology– Izmir had a project to monitor the Izmir Baywater quality in order to determine and under-stand the role of wastewater treatment plant inthe quality of water in the Bay. As expected, thewastewater treatment plant contributes positively.This improvement is observed by the turbidity allover the area, from Inner to Outer III (figure 5a and5b). The wastewater treatment plant has an influ-ence on turbidity. However, improvement in waterclarity has also been observed near the Aegean Sea(station 1). Continued improvement of the waterclarity after 2000 at all depths and in all stations
suggests that the improvements are not only dueto the wastewater treatment, but may be due tonatural influences in the Aegean Sea. It could berelated to global scale climatic changes that tookplace but this factor needs further investigation.Man’kovskii and Solov’ev (2005) have mentionedabout the variation of transparency in the BlackSea. They have found that the transparency (seichedisc depth) changes from 14.9–18.1 m in the 1970–1973 period to 6.2 m in 1992 and to about 10–12 mbetween 1997 and 2002. They have made a com-ment about the change observed in 1992: “It is dueto the influence of anthropogenic and natural fac-tors, the marine ecosystem has suffered significantchanges which have resulted in a decrease in thetransparency of waters while their productivityimproved. Change in ecosystem affects the compo-sition of the suspension, which leads, in particular,to changes in the characteristics of the indices ofscattering of light”.
The water from the Aegean Sea (station 1)flows generally through the Mordogan Passageinto the Gulbahce Bay (station 25). Therefore,the slope of the time-dependent light transmissioncurve decreases gradually in both station 1 and sta-tion 25 until year 2000. The rise and fall in the lighttransmission values of station 22 (water treatmentplant) after 2000 may be attributed to the tempo-ral variations in the effectiveness of the wastewatertreatment.
3. Seiche depth
The seiche disc is simply a flat circular plate 20–30 cm in diameter, either all white or with twoquadrants painted black and two painted white.It is lowered through the water column in a hori-zontal attitude until it is observed to just disap-pear. The depth at which this happens is calledthe seiche depth. It is widely used for the deter-mination of water clarity. The seiche depth Ds isrelated to optical parameters of the water columnincluding attenuation length, optical depth, beamattenuation coefficient (c), irradiance attenuationcoefficient (kd), scattering albedo, and the forwardscattering and backscattering coefficients (Bukataet al 1995). Seiche depth, Ds, is generally expressedin meters, and is used to provide a quantita-tive estimate of the optical property (c + kd).Seiche depths change regionally and seasonally inthe Izmir Bay. They change from 1–2 m in theInner Bay to 28–29 m in the Outer III region ofthe Outer Bay. The Inner Bay, Middle Bay andthe Gediz River estuary at the northeastern outerbay have more turbid water than the other regions.The turbidity patterns are under the influence ofcurrent, especially wind-induced. The less turbid

62 Erdem Sayin et al
20
40
60
80
100Lig
ht
Tra
nsm
issio
n(%
)
1/1
1/9
6
6/1
3/9
6
7/9
/96
10/7
/96
12/3
/96
2/1
8/9
7
6/1
1/9
7
7/2
/97
10
/2/9
7
1/2
2/9
8
4/2
9/9
8
9/1
/98
10/1
3/9
8
3/9
/00
4/1
2/0
0
5/1
0/0
0
7/1
3/0
0
11/1
5/0
0
1/1
1/0
1
4/1
1/0
1
8/1
3/0
1
12/1
8/0
1
2/1
3/0
2
6/4
/02
8/2
9/0
2
11/1
9/0
2
3/1
/03
5/2
8/0
3
8/1
8/0
3
3/1
1/0
4
8/5
/04
11/6
/04
2/1
2/0
5
4/1
3/0
5
0
10
20
30
Seic
he
Depth
(m)
Station 15mY = -3.771593407 * X + 94.28807692
Y = -0,1304685714 * X + 92,05572095
20
40
60
80
100
Lig
ht
Tra
nsm
issio
n(%
) 1/1
1/9
6
6/2
0/9
6
7/9
/96
10/7
/96
12/3
/96
2/1
8/9
7
6/1
1/9
7
7/3
/97
9/2
4/9
7
2/2
0/9
8
4/3
0/9
8
9/2
/98
10/1
4/9
8
3/9
/00
4/1
2/0
0
5/1
0/0
0
7/1
4/0
0
11/1
5/0
0
1/1
1/0
1
4/1
1/0
1
8/1
5/0
1
12/1
9/0
1
2/1
4/0
2
6/5
/02
8/3
0/0
2
11/2
0/0
2
2/2
8/0
3
5/2
9/0
3
8/1
9/0
3
3/1
2/0
4 8/6
/04
11/6
/04
2/1
3/0
5
4/1
3/0
5
0
4
8
12
16
20
24
Seic
he
Depth
(m)
Station 115m
Y = 0.01960037594 * X + 87.64782105
Y = -3.517197802 * X + 90.20115385
20
40
60
80
100
Lig
ht
Tra
nsm
issio
n(%
)
1/1
2/9
6
6/1
9/9
6
7/1
0/9
6
10/8
/96
11/2
9/9
6
2/1
9/9
7
4/8
/97
6/1
2/9
7
7/4
/97
9/2
2/9
7
1/2
1/9
8
5/1
/98
9/2
/98
10/1
5/9
8
1/9
/99
3/1
0/0
0
4/1
3/0
0
5/1
1/0
0
7/1
2/0
0
11/1
6/0
0
1/1
2/0
1
4/1
2/0
1
8/1
4/0
1
12/2
0/0
1
2/1
5/0
2
6/6
/02
8/3
0/0
2
11/2
1/0
2
3/2
/03
5/2
9/0
3
8/2
0/0
3
3/1
5/0
4
8/8
/04
11/7
/04
2/1
5/0
5
4/1
3/0
50
2
4
6
8
Seic
he
Depth
(m)
Station 225m
Y = -3.079107143 * X + 81.70419048
Y = 0.2837402597 * X + 77.51028571
20
40
60
80
100
Lig
ht
Tra
nsm
issio
n(%
)
6/2
0/9
6
7/9
/96
11/3
0/9
6
2/1
8/9
7
4/8
/97
6/1
1/9
7
7/2
/97
10/2
/97
1/2
2/9
8
4/2
9/9
8
9/1
/98
10/1
3/9
8
3/8
/00
4/1
1/0
0
5/9
/00
7/1
3/0
0
11/1
4/0
0
1/1
0/0
1
4/1
0/0
1
8/1
5/0
1
12/1
8/0
1
2/1
3/0
2
6/4
/02
8/3
1/0
2
11/1
9/0
2
2/2
8/0
3
5/2
8/0
3
8/1
8/0
3
3/3
/04 8
/6/0
4
11/5
/04
2/1
5/0
5
4/1
2/0
5
0
4
8
12
16S
eic
he
Depth
(m)
Station 255m
Y = -3.51034965 * X + 87.20560606Y = -0,1026369283 * X + 89,03077922
Figure 5(a). The light transmission (solid lines) values changing with time (surface water, 5 m). Light transmission trendlines were drawn. Time series of seiche disc depth (dashed lines) values at the same stations were drawn on the sameplot (on a second y-axis). The arrow that is placed on the figures shows the time when the water treatment was initiated(January 2000).
water forms near the Aegean Sea and also in thegyre formed at the Outer I. Seiche disc depthincreases after 2000 in a similar manner to lighttransmission. The seiche disc results of both winterseasons February 1997 and February 2002 indicate
that the seiche depth values change especially inthe Inner Bay, Middle Bay and in the Outer I fromone winter to another (figure 6). The reduced tur-bidity, measured by seiche disc depth, can also beobserved during the summer (figure 7).

Light transmission and seiche depth of Izmir Bay 63
20
40
60
80
100Lig
ht
Tra
nsm
issio
n(%
)
1/1
1/9
6
6/1
3/9
6
7/9
/96
10/7
/96
12
/3/9
6
2/1
8/9
7
6/1
1/9
7
7/2
/97
10
/2/9
7
1/2
2/9
8
4/2
9/9
8
9/1
/98
10
/13
/98
3/9
/00
4/1
2/0
0
5/1
0/0
0
7/1
3/0
0
11
/15/0
0
1/1
1/0
1
4/1
1/0
1
8/1
3/0
1
12
/18/0
1
2/1
3/0
2
6/4
/02
8/2
9/0
2
11
/19
/02
3/1
/03
5/2
8/0
3
8/1
8/0
3
3/1
1/0
4
8/5
/04
11/6
/04
2/1
2/0
5
4/1
3/0
5
Station 140mY = -3.759395604 * X + 94.26576923
Y = -0.1556165414 * X + 94.50010526
20
40
60
80
100
Lig
ht
Tra
nsm
issio
n(%
)
1/1
1/9
6
6/2
0/9
6
7/9
/96
10/7
/96
12
/3/9
6
2/1
8/9
7
11
.06.1
99
77
7/3
/97
9/2
4/9
7
2/2
0/9
8
4/3
0/9
8
9/2
/98
10/1
4/9
8
3/9
/00
5/1
0/0
0
7/1
4/0
0
11/1
5/0
0
1/1
1/0
1
4/1
1/0
1
8/1
5/0
1
12
/19/0
1
2/1
4/0
2
6/5
/02
8/3
0/0
2
11
/20/0
2
2/2
8/0
3
5/2
9/0
3
8/1
9/0
3
3/1
2/0
4
8/6
/04
11
/6/0
4
2/1
3/0
5
4/1
3/0
5
Station 1125m
Y= 0.01575157895 * X + 87.42923842
Y = -3.097197802 * X + 85.10192308
20
40
60
80
100
Lig
ht
Tra
nsm
issio
n(%
)
1/1
2/9
6
6/1
9/9
6
7/1
0/9
6
10
/8/9
6
11
/29/9
6
2/1
9/9
7
4/8
/97
6/1
2/9
7
7/4
/97
9/2
2/9
7
1/2
1/9
8
5/1
/98
9/2
/98
10/1
5/9
8
3/1
0/0
0
4/1
3/0
0
5/1
1/0
0
7/1
2/0
0
11
/16/0
0
1/1
2/0
1
4/1
2/0
1
8/1
4/0
1
12
/20/0
1
2/1
5/0
2 6/6
/02
8/3
0/0
2
11/2
1/0
2
3/2
/03
5/3
0/0
3
8/2
0/0
3
3/1
0/0
4
8/8
/04
11
/7/0
4
2/1
5/0
5
4/1
3/0
5
Station 2220m
Y = -0,04415789474 * X + 83,56030789
Y = -3.111362637 * X + 86.77593407
20
40
60
80
100
Lig
ht
Tra
nsm
issio
n(%
)
6/2
0/9
6
7/9
/96
11
/30
/96
2/1
8/9
7
4/8
/97
6/1
1/9
7
7/2
/97
10
/2/9
7
1/2
2/9
8
4/2
9/9
8
9/1
/98
10
/13/9
8
3/8
/00
4/1
1/0
0
5/9
/00
7/1
3/0
0
11/1
4/0
0
1/1
0/0
1
4/1
0/0
1
8/1
5/0
1
12
/18
/01
2/1
3/0
2
6/4
/02
8/3
1/0
2
11/1
9/0
2
2/2
8/0
3
5/2
8/0
3
8/1
8/0
3
3/3
/04 8
/6/0
4
11
/5/0
4
2/1
5/0
5
4/1
2/0
5
Station 2515mY = -3.509895105 * X + 87.30848485
Y = -0.05544360902 * X + 89.34592481
Figure 5(b). The light transmission values changing with time (near bottom). The arrow that is placed on the figuresshows the time when the water treatment was initiated (January 2000).
4. Relation between light transmissionand seiche disc depth
In this section, a relation between the seiche discdepth and the exponential integral sense of light
transmission is presented. Thus, the seiche discdepth values that were measured in the last fourcruises can be estimated from the measured lighttransmission data as if they were not observed andcompared with the observed values. The data set

64 Erdem Sayin et al
26.5º 26.6º 26.7º 26.8º 26.9º 27.0º 27.1º
Longitude
38.4º
38.5º
38.6º
38.7º
La
titu
de
Gediz river
3
5
7
9
11
13
15
17
19
21
23
February 1997
seiche disc depth
26.5º 26.6º 26.7º 26.8º 26.9º 27º 27.1º
Longitude
38.4º
38.5º
38.6º
38.7º
Lati
tude
3
5
7
9
11
13
15
17
19
21
23
February 2002
seiche disc depth
Figure 6. The seiche depth distributions for February 1997 (top) and 2002 (bottom) in the Izmir Bay. The locations ofstations are shown as black dots.
contains 695 seiche disc measurements and over45,000 light transmission and beam attenuationcoefficient values. They were obtained from thecruise data measured in the stations shown in fig-ure 1. This enables an estimate of seasonal andspatial variability of seiche depth in the bay byevaluating the cruise light transmission data.
When light propagates through water, its inten-sity decreases exponentially with depth. In thisstudy, the exponential loss of intensity (attenua-tion) is taken into account for the calculation ofthe seiche depth as a function of light transmis-sion. Attenuated light is called ‘downwelling irradi-ance attenuation of light’ that is a consequence ofthe absorption and scattering process. Absorptioninvolves the conversion of electromagnetic energyinto other forms (usually heat or chemical energy).The absorbers in seawater are: algae using light as a
source of energy for photosynthesis, inorganic andorganic particulate matter in suspension, dissolvedorganic compounds and the water itself. Scatteringis simply defined as the changes in the direction ofthe electromagnetic energy, as a result of multiplereflections from suspended particles.
Irradiance attenuation is described in terms ofirradiance attenuation coefficient kd, which is anapparent optical property. When the photons com-prise a beam of light, the attenuation is describedin terms of the beam attenuation coefficient c,which is an inherent optical property (Bukata et al1995).
The reduction of light in the water column can beexpressed in terms of the diffuse attenuation coef-ficient, kd (related to the downward irradiance);
Id = I0 · e−kd d, (1)

Light transmission and seiche depth of Izmir Bay 65
26.5º 26.6º 26.7º 26.8º 26.9º 27.0º 27.1º
Longitude
38.4º
38.5º
38.6º
38.7º
Latitu
de
Gediz N.
0
2
4
6
8
10
12
14
16
18
20
22
24
26
June 1997
seiche disc depth
26.5º 26.6º 26.7º 26.8º 26.9º 27.0º 27.1º
Longitude
38.4º
38.5º
38.6º
38.7º
Latitu
de
Gediz N.
0
2
4
6
8
10
12
14
16
18
20
22
24
26
June 2002
seiche disc depth
Figure 7. The seiche depth distributions for June 1997 (top) and 2002 (bottom) in the Izmir Bay.
where I0 is the incident light intensity, Id the lightintensity traveling distance of (d) (Khorram et al1991). The diffuse attenuation coefficient (kd) is anapparent optical property, because it depends bothon the medium and on the directional structure ofthe surrounding light field.
The beam attenuation coefficient in the watercolumn can be defined as follows:
k = kw + kp + ks, (2)
where kw, kp and ks are possible diffusion and scat-tering of light energy due to water (w), suspendedparticles (p) and dissolved matter (s), respectively(Bukata et al 1995). In some literatures authorsprefer to use c instead of k, which is equal to:
c = a + b,
where a is absorption and b is light scatter losses.
There are two approaches (direct and indirect) toestimate the average diffuse attenuation coefficient(kd) in a given water column. The direct approachinvolves the actual measurements of light intensityat different depths using a suitable sensor; thenthe diffuse attenuation coefficient can be calculatedusing equation (1).
The indirect estimation can be done from seichereading (Ds, in meter), using an empirical relation,originally proposed by Poole and Atkins (1929) asfollows:
kd =1.7Ds
. (3)
However, these theoretical equations are not alwaysapplicable for practical purposes, because theyrequire information about the angular distributionof radiation field, which is difficult to measure.
66 Erdem Sayin et al
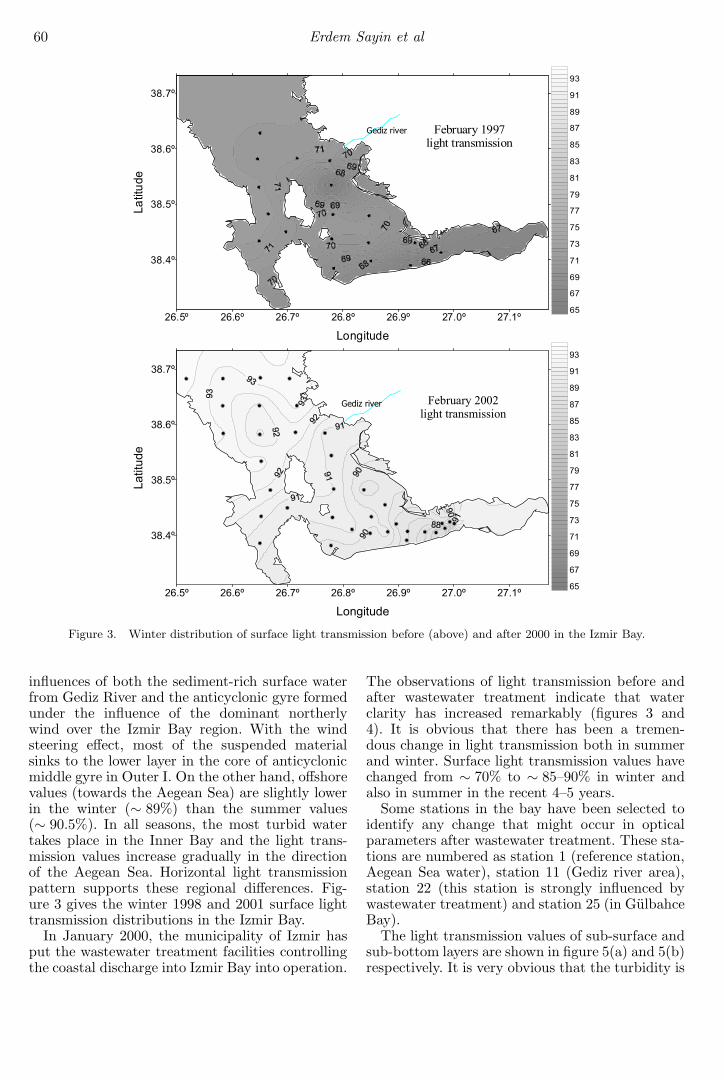
Table 1. The number of observations for each cruise and correlation coefficients related to the relationships betweenseiche depths (Ds) and the sum of light transmission values.
No. of stations No. of stations No. of No. of(observations) light observations common Correlation
Cruise date seiche disc transmission light stations coefficient(month, year) Ds LT transmission Ds + LT R
January 1996 – 19 877 – –
June 1996 14 37 1381 14 0.910
July 1996 21 21 802 21 0.989
September 1996 18 – – – –
October 1996 20 20 744 – –
November 1996 6 24 978 6 –
January 1997 27 – – – –
February 1997 15 18 637 15 0.854
April 1997 – 10 117 – –
June 1997 21 22 852 21 0.923
July 1997 – 39 1620 – –
September 1997 – 23 1092 – –
October 1997 – 10 399 – –
January 1998 – 30 1252 – –
April 1998 15 30 1211 15 0.905
September 1998 – 31 1229 – –
October 1998 – 29 1186 – –
January 1999 – 7 232 – –
March 2000 – 37 1315 – –
April 2000 35 52 1370 35 0.932
May 2000 32 34 1153 32 0.987
July 2000 – 35 1291 – –
November 2000 14 36 1277 14 0.900
January 2001 22 41 1388 22 0.978
April 2001 28 34 1172 28 0.914
August 2001 25 31 1184 25 0.920
December 2001 19 31 1299 19 0.993
February 2002 25 34 2750 25 0.961
June 2002 30 34 1279 30 0.864
August 2002 – 33 1303 – –
November 2002 31 40 1468 31 0.929
March 2003 33 41 1337 33 0.969
August 2003 25 40 1390 25 0.936
March 2004 40 31 1488 40 0.940
August 2004 43 59 1593 43 0.962
November 2004 – 54 2225 – –
February 2005 36 51 1476 36
April 2005 32 47 1521 32
June 2005 36 48 1636 36
September 2005 32 42 1374 32
According to Idso and Gilbert (1974), the con-stant (1.7) always gives fairly close extinctioncoefficients when compared to optically measuredcoefficients in a wide range of water visibility (tur-bid to clear ocean water) covering Ds between 1.9and 35 m (Parsons et al 1994).
The seiche disc is a simple equipment for themeasurement of water clarity. The seiche depth(Ds) can be used to estimate visibility, attenua-tion coefficient and the depth of photic zone byapplying simple empirical formulas. It is possible togain information about biological activities using
Light transmission and seiche depth of Izmir Bay 67
0
4
8
12
16
20
24
28
200 400 600 800 1000 1200
Ds=(1.079643)+(0.0175398)*SLT
R=0.99N=19
December 2001
0
4
8
12
16
20
24
28
200 400 600 800 1000 1200
Ds=(1.26)+(0.02015)*SLT
R=0.98N=22
January 2001
4
6
8
10
12
14
16
18
20
200 300 400 500 600 700 800
Ds=(1.98333)+(0.0197412)*SLT
R=0.85
N=15
February 1997
2
6
10
14
18
22
26
200 300 400 500 600 700 800 900 1000
Ds=(0.176)+(0.0227348)*SLT
R=0.96
N=25
February 2002
0
6
12
18
24
30
200 400 600 800 1000
Ds=(-0.4538)+(0.02466)*SLT
R=0.97N=33
March 2003
2
6
10
14
18
22
200 400 600 800 1000
Ds=(2.4894)+(0.0171)*SLT
R=0.94
N=40
March 2004
-2
2
6
10
14
18
22
26
0 100 200 300 400 500 600 700
Ds=(1.26872)+(0.0279702)*SLT
R=0.91
N=15
April 1998
0
4
8
12
16
20
24
200 400 600 800 1000
Ds=(3.19)+(0.0194)*SLT
R=0.91N=28
April 2001
-4
2
8
14
20
26
0 200 400 600 800 1000 1200
Ds=(-1.439843)+(0.02015)*SLT
R=0.93
N=32
April 2000
2
6
10
14
18
22
26
30
200 400 600 800 1000 1200 1400
Ds=(2.007587)+(0.0177082)*SLT
R=0.99N=32
May 2000
-2
4
10
16
22
28
200 400 600 800
Ds=(-1.392146)+(0.0277)*SLT
R=0.92
N=21
June 1997
0
4
8
12
16
20
24
28
200 400 600 800 1000
Ds=(2.02663)+(0.0201177)*SLT
R=0.86N=30
June 2002
0
2
4
6
8
10
12
14
16
18
0 100 200 300 400 500 600 700
Ds=(1.060965)+(0.0215049)*SLT
R=0.99N=21
July 1996
0
4
8
12
16
20
24
28
200 400 600 800 1000 1200
Ds=(1.098764)+(0.01758)*SLT
R=0.92
N=25
August 2001
-2
4
10
16
22
28
0 200 400 600 800 1000 1200
Ds=(1.245745)+(0.016627)*SLT
R=0.94N=25
August 2003
-2
4
10
16
22
28
34
0 200 400 600 800 1000 1200 1400
Ds=(1.5318)+(0.02064)*SUMLT
R=0.96N=43
August 2004
0
6
12
18
24
30
200 400 600 800 1000
Ds=(0.725432)+(0.0227255)*SLT
R=0.90N=14
November 20000
4
8
12
16
20
24
28
200 400 600 800 1000
Ds=(1.22115)+(0.021319)*SLT
R=0.93
N=31
November 2002
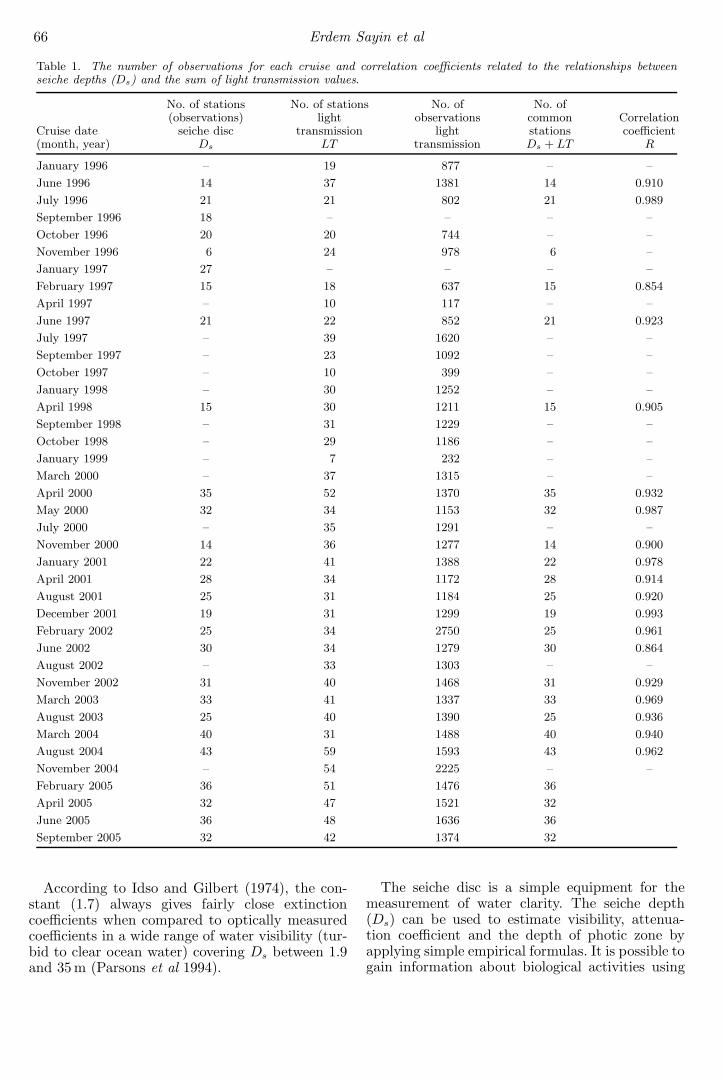
Figure 8. The regression results showing agreement between the seiche disc and the light transmission values.

68 Erdem Sayin et al
Table 2. The c1 and c2 values are the coeffi-cients in equation (4) (Ds = c1 + c2 · SLT ).
Season c1 c2
Winter 1.01695 0.02026
Spring 1.17298 0.02041
Summer 1.09193 0.02022
Autumn 1.06693 0.02176
seiche disc measurements together with remotelysensed data. One of the purposes of this study isto find a relation between in situ light transmis-sion and seiche depth considering the apparent andalso the inherent optical properties of the waterbased on data sets collected from 1996 to 2004. Thelight transmission measurements give informationonly about inherent water properties. However, theseiche disc depth measurements consider not onlyinherent (c) but also apparent (kd) water proper-ties. To gain apparent properties for light transmis-sion, the exponential decrease of light transmissionvalues with depth is assumed. An empirical for-mula has been obtained giving a relation betweenthe sum of exponentially decreasing light transmis-sion and the observed seiche depth value. In this
Stations0
4
8
12
16
20
Seic
he
dis
kdepth
(m)
February2005
Obs
Cal
Inner Bay Middle Bay Outer I Outer II Outer III
Observed Seiche Disk Values (m)
Pre
dic
ted
Se
ich
eD
isk
Va
lue
s(m
)
0
2
4
6
8
10
12
14
16
18
20
0 2 4 6 8 10 12 14 16 18 20
Dspred=1.07292* Dsobs-0.418915
R=0.924N=36
February 2005
Figure 9(a). The comparison between measured and cal-culated seiche disc values for every station from Inner Bayto Outer III (above), the observed vs. the calculated values(below) for February 2005.
formula the observed seiche depth values from 1994to 2004 are used to calculate diffuse attenuationcoefficient kd with the help of equation (3). A linearmodel is developed using the result of regressionanalysis between the observed seiche disc depthvalues and the sum of exponentially decreasinglight transmission for each cruise. The correla-tion coefficients are given in table 1. The obtainedcoefficients of model for each cruise are averagedseasonally to find a relationship between mea-sured and unmeasured seiche disc depth values.Thus, light transmission values can be used inorder to find unmeasured seiche disc depth values.This step will be explained in the next section indetail.
5. Validation and implementationof model
The relation between seiche disc depth and sum oflight transmission values is assumed to be linear.A linear regression formula is:
Ds = c1 + c2 · SLT, (4)
where SLT is the sum of the light transmissionvalues determined assuming that the light trans-mission values decrease with depth as:
Stations0
4
8
12
16
20
24
28
Seic
he
dis
kdepth
(m)
April 2005Obs
Cal
Inner Bay Middle Bay Outer I Outer II Outer III
Observed Seiche Disk Values (m)
Pre
dic
ted
Se
ich
eD
isk
Va
lue
s(m
)
0
5
10
15
20
25
30
0 5 10 15 20 25 30
Dspred=0.9738717*Dsobs-0.594106
R=0.952N=32
April 2005
Figure 9(b). Same as figure 9(a), but for April 2005.

Light transmission and seiche depth of Izmir Bay 69
Stations0
4
8
12
16
20
24
28
Seic
he
dis
kdepth
(m)
June 2005Obs
Cal
Inner Bay Middle Bay Outer I Outer II Outer III
Observed Seiche Disk Values (m)
Pre
dic
ted
Se
ich
eD
isk
Va
lue
s(m
)
0
5
10
15
20
25
30
0 5 10 15 20 25 30
Dspred=0.939991* Dsobs-0.689435
R=0.911
N=32
June 2005
Figure 9(c). Same as figure 9(a), but for June 2005.
SLT=
d=D∑
d=0
LTd e−kd·d, (5)
where D is the depth of the water column. The dif-fuse attenuation coefficient (kd) is estimated fromthe average seiche depth values using equation (3).The number of observations for each cruise andthe results of regression between observed seichedisc depth and the sum of exponentially decrea-sing light transmission values are summarized intable 1 and figure 8. The coefficients, which wereobtained as a result of regression analysis, aregrouped seasonally (table 2).
After the seasonal models are improved, they areapplied on the light transmission data of year 2005(February, April, June and September) to estimatethe seiche disc depths for these months. The calcu-lated and observed seiche disc values are comparedwith each other (figure 9). Correlation coefficientsobtained are shown in table 3.
Similar regression analysis is applied to find amodel for every season. The new measured seichedepth values are compared with the values calcu-lated using the readily developed regression model.Correlation coefficients obtained are very high: thevariations are in the range 0.911–0.997. As a result,it can be concluded that the model is able to esti-mate the seiche disc values only using in situ lighttransmission and historical data set.
Stations0
10
20
30
40
Seic
he
dis
kdepth
(m)
September2005
Obs
Cal
Inner Bay Middle Bay
Outer I Outer II Outer III
Observed Seiche Disk Values (m)
Pre
dic
ted
Se
ich
eD
isk
Va
lue
s(m
)
0
5
10
15
20
25
30
35
40
0 5 10 15 20 25 30 35 40
Dspred=1.09377*Dsobs-0.443791
R=.997N=32
September 2005
Figure 9(d). Same as figure 9(a), but for September 2005.
Table 3. Using the model coefficientsfrom table 2, the correlation coeffi-cient shows the correlation between themeasured and the predicted seiche discvalues.
CorrelationCruise coefficient
February 2005 0.924
April 2005 0.952
June 2005 0.911
September 2005 0.997
Figure 9 shows the regression curves between themeasured and calculated seiche depth values forwinter. The correlation will be better when moredata are adapted to the model. Table 2 shows themodel coefficients obtained from the light trans-mission and the calculated seiche disc values forevery season in the bay. The value c1 of c2 inequation (4) slightly changes seasonally.
6. Discussion and conclusion
The turbidity in Izmir Bay is analyzed usinglight transmission and seiche disc depth values.Although the observed seiche disc depth and alsolight transmission values vary seasonally, they show
70 Erdem Sayin et al
a tendency to increase from the Inner to OuterBay indicating that more turbid water exists in theInner Bay environment. Increasing values are alsoobserved in time domain. After wastewater treat-ment, controlled surface discharge has started intothe Middle Bay since January 2000. It is very obvi-ous both from the light transmission values andalso from the seiche disc values that the turbidityhas been removed generally from the Bay afterJanuary 2000. The wastewater treatment plant hasan influence on turbidity. However, improvementin water clarity has also been observed near theAegean Sea (station 1). Continued improvement ofthe water clarity after 2000 at all depths and inall stations suggests that the improvements are notonly due to the wastewater treatment, but mighthave improved due to natural influences in theAegean Sea.
The other aim of this study is to find anequation to estimate the seiche depth from the lighttransmission data. Seiche disc, which depends onthe combination of inherent and apparent opticalwater parameters, is an important tool to estimateprimary production. This estimation can be com-pared with the estimation obtained from remotesensing data. An exponential function and summa-tion of light transmission values were used in orderto satisfy the inherent and apparent optical pro-perties of water. As a result, we have found veryhigh correlation between the in situ and calcu-lated seiche depth values using light transmissionvalues. The correlation coefficients vary from 0.911to 0.997. This result means that it is possible tomake an estimate of seiche depth using historicallight transmission values after adapting attenua-tion coefficient, kd in the model. Then the modelis also able to give information about the seasonalvariation of seiche depth using seasonal light trans-mission data that were already measured duringcruises.
Sometimes seiche depth measurement could bemore difficult because of occasional occurring ofshallow pycnocline. In these cases, the formulafound in this study can be used to obtain the seichedisc depth by estimating the depth of photic zonerather than the in situ one.
Nomenclature
Id : light intensity traveling distance of dI0 : incident light intensitykd : diffuse attenuation coefficientk : beam attenuation coefficientkw : possible diffusion and scattering of light
energy due to waterkp : possible diffusion and scattering of light
energy due to suspended particles
ks : possible diffusion and scattering of lightenergy due to dissolved matter
Ds : seiche depthR : regression coefficientLT : observed light transmission valueSLT : sum of light transmission valuesLTd : light transmission values at the depthc : beam attenuation coefficienta : absorption coefficientb : scattering coefficientc1, c2 : model coefficients
Acknowledgements
This work was carried out in the framework of theIzmir Bay Marine Research Project. The authorsacknowledge IMST/DEU for supporting the R/VK Piri Reis during the cruises. Grateful thanks aredue to Prof. Dr Deniz Unsalan for valuable discus-sions and suggestions. And special thanks to CetinBasoz who helped us by kindly allowing us to usethe data base. We also extend our thanks to thepeople who participated in the cruises.
References
Aas E 1980 Relations between total quanta, blue irradi-ance and seiche disk observations; In: Studies in Physi-cal Oceanography. Papers dedicated to Professor NilsG Jerlov in commemoration of his seventieth birth-day. Rep. Dept. Phys. Oceanogr., Univ. Copenhagen 4211–27.
Bukata R P, Jerome J H, Kondratyev K Y and PozdnyakovD V 1995 Optical Properties and Remote Sensing ofInland and Coastal Waters; CRC Press Inc, New York.
Clark J 1977 Coastal Ecosystem Management; John Wiley& Sons, New York.
Idso S B and Gilbert R G 1974 On the universality of thePoole and Atkins seiche disc – light extinction equation;J. Appl. Ecol. 11 399–401.
IMST-124 2001 Marine research in the Izmir Bay project.Final Report. Institute of Marine Sciences and Techno-logy, Izmir, Turkey, 260 p.
Khorram S, Cheshire H, Geraci A L and Rosa G L1991 Water Quality Mapping of Augusta Bay, Italyfrom Landsat-TM Data. Int. J. Remote Sensing 12/4803–808.
Kullenberg G 1980 Relationships between optical param-eters in different oceanic areas; Rep. Ins. Fer FysiskOceanografi Kobenhavns Universitet, Copenhagen,No. 42 57–79.
Man’kovskii V I and Solov’ev M 2005 Indicatrices of scat-tering of light and the composition of suspension in theBlack Sea; Phys. Oceanogr. 15(1) 57–70.
Parsons T R, Takahaski M and Hargrave B 1994 Bio-logical Oceanographic Process; 3rd edn. PergamonPress.
Poole H H and Atkins W R G 1929 Photo-electric mea-surements of submarine illumination throughout the year;J. Mar. Siol. Assoc. 16 297–324.
Sayin E 2003 Physical features of the Izmir Bay; Cont. ShelfRes. 23 957–970.

Light transmission and seiche depth of Izmir Bay 71
Sherstyankin P P, Bbondarenko N A, Stepanova V V,Tarasova E N and Shur L A 1988 Interrelation betweenthe beam attenuation coefficient and hydrophysicaland biological indexes of the Baikal water, Opticsof sea and atmosphere. Theses of rep. of 10 ple-nary of WG “Ocean optics” 223–224, Leningrad(in Russian).
Vladimirov V, Man’kovskii V I, Besiktepe S, Solov’ev Mand Mishonov A 1999 Hydro-optical studies of the BlackSea: History and Status; In: Environmental Degrada-tion of the Black Sea: Challenges and Remedies (eds.)Besiktepe S T, Unluata U, Bologa A S (Dordrecht:Kluwer Academic Publishers) NATO Science Series,245–256.
MS received 24 February 2006; revised 30 June 2006; accepted 1 August 2006