Embed Size (px)
Citation preview
Full Terms & Conditions of access and use can be found athttp://www.tandfonline.com/action/journalInformation?journalCode=rero20
Download by: [95.168.107.53] Date: 28 December 2016, At: 07:30
Economic Research-Ekonomska Istraživanja
ISSN: 1331-677X (Print) 1848-9664 (Online) Journal homepage: http://www.tandfonline.com/loi/rero20
The limitations of competition in the insurancemarkets of Slovenia, Croatia and Serbia
Milan Kostić, Ljiljana Maksimović & Boban Stojanović
To cite this article: Milan Kostić, Ljiljana Maksimović & Boban Stojanović (2016) The limitationsof competition in the insurance markets of Slovenia, Croatia and Serbia, Economic Research-Ekonomska Istraživanja, 29:1, 395-418, DOI: 10.1080/1331677X.2016.1169703
To link to this article: http://dx.doi.org/10.1080/1331677X.2016.1169703
© 2016 The Author(s). Published by InformaUK Limited, trading as Taylor & FrancisGroup
Published online: 13 May 2016.
Submit your article to this journal
Article views: 336
View related articles
View Crossmark data
Economic REsEaRch-Ekonomska istRaživanja, 2016voL. 29, no. 1, 395–418http://dx.doi.org/10.1080/1331677X.2016.1169703
© 2016 the author(s). Published by informa Uk Limited, trading as taylor & Francis Group.this is an open access article distributed under the terms of the creative commons attribution License (http://creativecommons.org/licenses/by/4.0/), which permits unrestricted use, distribution, and reproduction in any medium, provided the original work is properly cited.
The limitations of competition in the insurance markets of Slovenia, Croatia and Serbia
Milan Kostića, Ljiljana Maksimovića and Boban Stojanovićb
aFaculty of Economics University of kragujevac, kargujevac, serbia; bFaculty of Economics University of niš, niš, serbia
1. Introduction
Studying the insurance market as a part of the financial market is very complex but also important because this sector occupies a significant position in the financial area of each country. The article analyses the limitations of the insurance markets of Slovenia, Croatia, and Serbia. Comparative analysis of the three markets aims to provide a clear image of the limited competition in the insurance markets, that is to say the level of concentration and inequality of market share distribution between insurance companies in these countries. The importance of the insurance market comes from the fact that it was among the first to participate in the process of internationalisation. The process of globalisation, liberalisation, and deregulation significantly affected the performance of the sector, the conditions of competition in it, and especially the business risks (Njegomir & Stojić, 2012). In the practice of anti-monopoly authorities it is customary to use indices of concentration and inequality for measuring the conditions of competition and companies’ monopoly power, therefore the above indicators shall be used in this research (Saving, 1970).
ABSTRACTThe article analyses the situation in the insurance markets of Slovenia, Croatia, and Serbia in order to provide the insight into the limitation of competition. The study of the limitation of competition was conducted using the theoretically founded indicators of concentration and inequality as follows: Concentration ratio, Herfindahl-Hirschman index, Lorenz curve, Gini coefficient, and Entropy index. The indicators were calculated for all the countries between 2004 and 2011. By comparatively analysing the obtained values of the indicators of concentration and inequality, we came to the conclusion that all three markets are characterised by a similar movement of the indicator, as well as that Croatian market, despite the relatively uneven market share distribution between individual companies, is more competitive than the other two.
KEYWORDSRelevant market; supply concentration; inequality of market share distribution
JEL CLASSIFICATIONL13; L84; D43
ARTICLE HISTORYReceived 10 may 2013 accepted 5 February 2016
CONTACT milan kostić [email protected]
OPEN ACCESS
396 M. KoSTić ET aL.
Analysed markets were selected so as to represent the countries of a region characterised by different levels of development. Slovenia and Croatia have completed the transition and are already in the EU. Serbia is still in the process of slow and incomplete transition, away from full membership in the EU. For more than two decades these countries’ markets have belonged to a single market, therefore it is interesting to analyse the development of com-petition in them from 2004, 15 years after their separation. The study is particularly inter-esting because today’s economy is in the global economic crisis, which affects the business conditions in the sector, and requires a more comprehensive approach to the management of risk and insurance companies’ capital (Marović, Njegomir, & Maksimović, 2010).
The article affirms the application of economic analysis in the field of competition. The application of economic analysis in this field is the world trend, which started in the US, continued in the EU, and with less intensity in the region as well. The article points out the advantages, but also the limitations in the application of the indicators of concentration and inequality. Further development of anti-monopoly legislation in the countries of the region will be towards greater use of economic analysis, especially the use of different indices of concentration and inequality.
2. Literature review
The measurement of the competition’s limitation level in various markets is attracting the attention of many researchers. It has been studied on the example of the real sector and on the example of financial sector. Many authors have provided assessments on the conditions of competition using the usual indicators of concentration and inequality. One of the first and also the most important works in this field is the work of Adelman (1951), which deals with the theoretical analysis of different concentration indicators. The following is a very important work by Vanlommel, de Brabander, and Liebaers (1977), which examines the level of concentration on the example of 119 Belgian industry sectors, as well as the work by Curry and George (1983), which deals with the theoretical and practical analysis of aggregate concentration on the example of the UK and US economy in the period between 1909 and 1980. The works which deal with the sectorial assessment of the level of concentration and inequality of supply are also important. Belobaba and Van Acker (1994) studied the level of concentration in the US air transport market, and Einarsson (2008) investigated the level of concentration in the retail markets of the Nordic countries. The prominent works in the field of financial sector analysis are by Bikker and Haaf (2002, 2002a), who applied different indicators of concentrations to analyse the conditions of competition in the banking sector of European and other developed countries. The contribution of the authors in studying the level of concentration and inequality in the financial sector is the most important. Significant work to explore the limitation of banking market is by Al-Muharrami, Matthews, and Kahabari (2006), which deals with the determination of concentration level of the Arab GCC banking system.
The work by Mitton (2008) should be distinguished in the study of concentration indica-tors, which designates that concentration level is greater in smaller countries, as well as that the importance of concentration is largely dependent on the institutional factors that give them a certain power. Regardless of the various theorists who have discussed various ways to determine the level of concentration and inequality of the market, the claim articulated by Davies (1979, 1980) is still valid and states that a universal concentration indicator has
EConoMiC RESEaRCH-EKonoMSKa iSTRaživanja 397
not yet been found. Instead, we use several indicators in order to give a comprehensive image of competitive conditions in the market.
The works that are prominent in the region, in which we are to study the level of insur-ance market limitation, are by Tipurić, Kolaković, and Dumičić (2002, 2003) dealing with the supply concentration on the example of the banking sector in Croatia. As for Serbia, the interesting work which is related to the determination of concentration in the market of cable distributors is by Maksimović, Radosavljević, and Borisavljević (2011), and the work dealing with the concentration of non-specialist retail trade of Niš by Stojanović and Radivojević (2010).
The work to be presented is a continuation of the research previously conducted regarding Serbian insurance market (Kostić, 2009) and limitations in the application of concentration indicators on the example of the insurance market of a number of countries (Maksimović & Kostić, 2012). This work is more comprehensive and advanced research, since it contains a long time series data and the broader framework of analysis, in order for the assessment of competition conditions to be more comprehensive.
3. Research hypotheses
Based on the fact that the analysed markets are a part of the broader, European market and that there is a tendency for their further involvement in European integration, the reduction of limitation level is expected to be intensified in the insurance markets of the analysed countries.
The financial sector is constantly open to entry of foreign competition, so once leading insurance companies lose their importance. This finding confirms the conclusion given in a previous work where it is clearly indicated that, in some markets (in this case the Croatian insurance market), there was a reduction concerning the share of major competitors and the values of all the concentration indicators used (Tipurić et al., 2002). We shall try to verify this statement by testing appropriate hypotheses, whose proof is important because the research is carried out in considerably changed circumstances, primarily related to the financial and economic crisis. The research hypothesis that will be analysed is:
Hypothesis 1: The level of supply concentration in all the analysed markets reduces in the entire period of the research.
The following hypothesis which is associated with the previous one and is related to the indicators of inequality is:
Hypothesis 2: The level of inequality in the market share distribution in all the analysed markets reduces in the entire period of the research.
Given that this is a market that once belonged to a single market it can be concluded that in the value movement of the indicators of concentration and inequality in the analysed markets, there is a high level of agreement. This suggests a new research hypothesis:
Hypothesis 3: Between the movement of the indicators’ values in different markets there is a high level of statistically significant correlation.
398 M. KoSTić ET aL.
4. Data collection and methodology
For the analysis of competition conditions in the insurance market of Slovenia, Croatia, and Serbia, we used the data on total premium at the disposal of the association of supervisors and individual agencies involved in the supervision of insurance companies. Data from the following institutions were used in the paper: International Association of Insurance Supervisors (IAIS) (http://www.iaisweb.org/IAIS-members-31), National Bank of Serbia (http://www.nbs.rs/internet/cirilica/60/60_2/index.html), Croatian Financial Services Supervisory Agency (2004, 2005, 2006, 2007, 2008, 2009, 2010 and 2011), and Slovenian Insurance Supervision Agency (2004, 2005, 2006, 2007, 2008, 2009, 2010, and 2011). The total premium was chosen to be a variable for measuring concentration for the following reasons: the premium is the most important component of the insurance company’s reve-nue and is the result of its core activity. Data on total premium are in regular reports and publications of the regulatory authorities responsible for the supervision and control of insurance companies (Kostić, 2009).
The data include eight consecutive years (2004–2011). Using the collected data corre-sponding values of concentration indicators were obtained, and were used for a comparative analysis of the insurance markets’ limitation level in these countries. Studying of the level of concentration and inequality in the insurance market was performed using a number of indicators of concentration and inequality, namely: Concentration ratio of the four largest companies and Herfindahl-Hirschman index, Gini coefficient, Lorenz curve, and Entropy index.
4.1. Concentration ratio
The Concentration ratio is a sum of market shares (si) of the largest n companies on the analysed market (Waldman & Jensen, 2001; Begović et al., 2002):
This ratio is most often calculated as the sum of market shares of the four largest compa-nies in the market. Taking a great number of companies reduces its analytical significance. Researchers or government agencies involved in the level of supply concentration supervi-sion decide on the number of companies to be included in the calculation of this indicator, provided that they use it as an official indicator (Martin, 2002). Given that the most common number of companies included in the determination of the ratio is four, the indicator was named Concentration ratio of the four largest companies (CR4).
In the EU the high level of market concentration exists when the CR4 index exceeds the value of 25, while in the US the limit is 50. The market where the index is above 50 is considered to be highly concentrated, the one where the value is between 25 and 50 is moderately concentrated, and the one with the value below 25 is non-concentrated market (Kostić, 2009). In the literature, there are interpretations that the value of the index above 40 indicates an oligopolistic market, while the value over 90 designates market similar to monopoly (American Bar Association, Section of Antitrust Law, 2005).
(1)CR =
n∑
i=1
si
EConoMiC RESEaRCH-EKonoMSKa iSTRaživanja 399
4.2. Herfindahl-Hirschman index
The Herfindahl-Hirschman index, as a convex function of the analysed companies’ market shares, is an index sensitive to the number of corporations and inequality in the distribution of their market shares. The importance assigned to each company corresponds to the value of its market share (wi=si), which implies that the index is determined as the sum of squared market shares of individual companies (Martin, 2002), i.e.:
where si is the market share of i firm. This index provides a more accurate image of the mar-ket concentration level, since, because of the squaring of market shares, greater importance is assigned to the firms with larger market share than to those with smaller. The index value is in the interval between 0 and 10.000, or between 0 and 1, depending on the method of expressing market share. Reference values of the index are shown in Table 1.
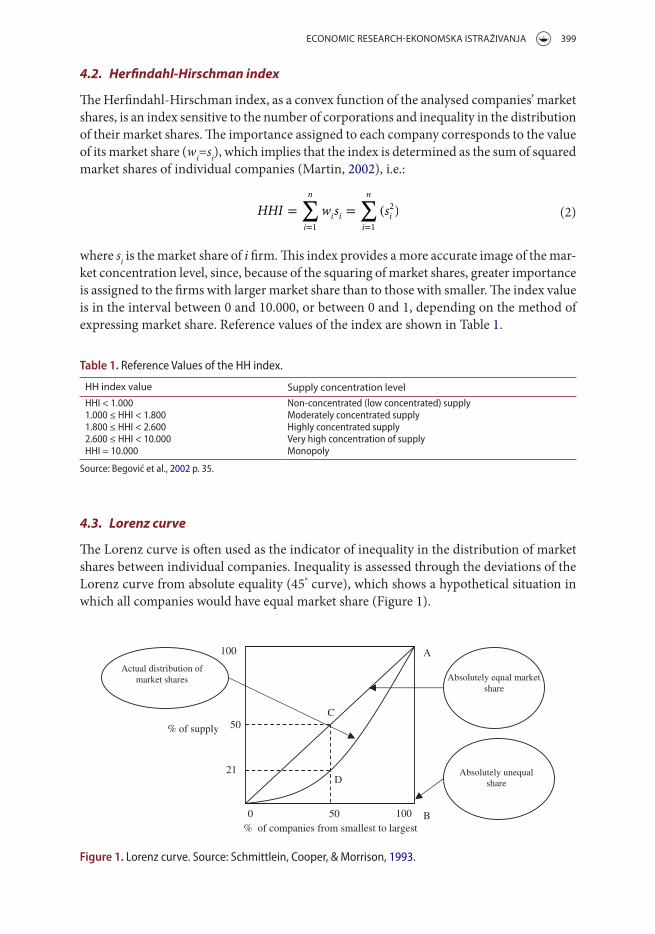
4.3. Lorenz curve
The Lorenz curve is often used as the indicator of inequality in the distribution of market shares between individual companies. Inequality is assessed through the deviations of the Lorenz curve from absolute equality (45° curve), which shows a hypothetical situation in which all companies would have equal market share (Figure 1).
(2)HHI =
n∑
i=1
wisi=
n∑
i=1
(s2i)
Table 1. Reference values of the hh index.
source: Begović et al., 2002 p. 35.
HH index value Supply concentration levelhhi < 1.000 non-concentrated (low concentrated) supply 1.000 ≤ hhi < 1.800 moderately concentrated supply1.800 ≤ hhi < 2.600 highly concentrated supply2.600 ≤ hhi < 10.000 very high concentration of supplyhhi = 10.000 monopoly
100% of companies from smallest to largest
% of supply
C
D
A
B0 50
100
50
21
Absolutely equal market share
Absolutely unequal share
Actual distribution of market shares
Figure 1. Lorenz curve. source: schmittlein, cooper, & morrison, 1993.
400 M. KoSTić ET aL.
4.4. Gini coefficient
The Gini coefficient quantifies the deviation of the Lorenz curve from absolute equality curve, and measures inequality in the distribution of market shares between the companies. The Gini coefficient is determined by the following form (Lipczynski, Wilson, & Goddard, 2009):
where n is the rank of firms sorted in descending order from largest to smallest, N is the number of firms involved in the calculation, and xi firm size measured through the value of sales (in the analysed case the total premium). The value of this indicator is in the inter-val between 0 and 1, where 0 means that the distribution of market shares between the companies is equal while 1 means that the overall market belongs to a corporation (White, 1982, 544).
4.5. Entropy index
The Entropy index is an indicator of inequality in the distribution of market shares (Bikker & Haaf, Measures of Competition and Concentration in the Banking Industry: a Review of the Literature, 2002):
where si is the market share of i firm, and loge
(
1
si
)
the reciprocal value of the natural loga-rithms of market shares. The index value can range between 0, which indicates a monopoly, and E=loge(n) when there are n companies of the same size in the branch. The entropy coefficient is taken from the theory on information which shows the level of decision cer-tainty. If there was only one company on the market, the uncertainty of customer retention for the monopolist would be minimal because customers would not have a choice. The opposite situation is when there are a lot of companies and then customers can choose and uncertainty of the choice increases.
Because of the unevenly defined upper threshold, the results can be incomparable between market structures that contain a different number of companies. For comparabil-ity of the index between branches and different moments of time, its relative value is used. The equation of the relative entropy index is as follows (Lipczynski et al., 2009):
The value of the relative entropy index is in the interval between 0 and 1, where 0 cor-responds to the situation when there is a monopoly, while 1 corresponds to a perfectly competitive market.
(3)G =
�
∑N
n=1
∑n
i=1 xi
0, 5(N + 1)∑N
i=1 xi
�
− 1
(4)E =
n∑
i=1
silog
e
(
1
si
)
(5)RE =E
loge(n)
=
[
1
loge(n)
] n∑
i=1
silog
e
(
1
si
)
EConoMiC RESEaRCH-EKonoMSKa iSTRaživanja 401
5. The research
The research on the limitation of the insurance markets of Slovenia, Croatia, and Serbia contains a part concerning the determination of the relevant market’s limitations, a part which is related to the evaluation of the level of concentration and inequality of supply on the market thus defined, as well as the analysis of the correlation in the movement of these indicators for the three countries.
5.1. Relevant market
The relevant market implies a market with identical or similar competition conditions. It has two dimensions: product and geographic (Motta, 2008). It follows that in defining the boundaries of the relevant market it is necessary to define relevant product market and relevant geographic market. The relevant product market is defined as a set of products and services which are regarded as interchangeable by the consumer by reason of the products’ intended use, characteristics, and their prices. On the other hand, the relevant geographic market comprises the area in which the conditions of competition are sufficiently homoge-neous and are appreciably different from neighbouring areas (European Commission, 1997).
Insurance market, which consists of all forms of insurance on the entire area of the analysed countries (Serbia, Croatia, and Slovenia), can be taken as a relevant market in this research for assessing the market power of corporations and limitations of supply. In defining the relevant product market, we started from the assumption that it is about a unique product which has no adequate substitute. Since we analysed the general assess-ment of the level of concentration and inequality, the division of insurance by types in this market was not conducted. As for the size of the relevant geographic market, the whole area of the countries was taken for assessing, as required by the very nature of business and the available data (Kostić, 2009). Furthermore, business conditions in one country are unique for all the participants, so they can make territorial completeness. The annual reports and regulatory bodies confirm that this market definition is good for the research being undertaken, where, among other, the approach we implemented is used as an item for the assessment of competitive conditions.
5.2. Analysis of the research results
Based on collected data, the research was conducted in the frame of the relevant market’s defined borders. Analysis of the research results, using the appropriate indicators of concen-tration and inequality and based on them statistical estimates, requires the previous view of the number of insurance companies operating in the analysed markets in the research period. Some authors consider this component of the market to be significant in assessing the competitive conditions of market share distribution (White, 1982). The article assigns equal importance to both the elements, but we believe that the number of companies will largely determine competition conditions in the analysed markets. Table 2 shows changes in the number of insurance companies by countries for the entire research period.
As can be seen from Table 2 the largest number of active insurance companies is in Croatia, then in Serbia, and in the end in Slovenia. This arrangement of active insur-ance companies will affect the obtained indicator values, especially those related to the concentration.
402 M. KoSTić ET aL.
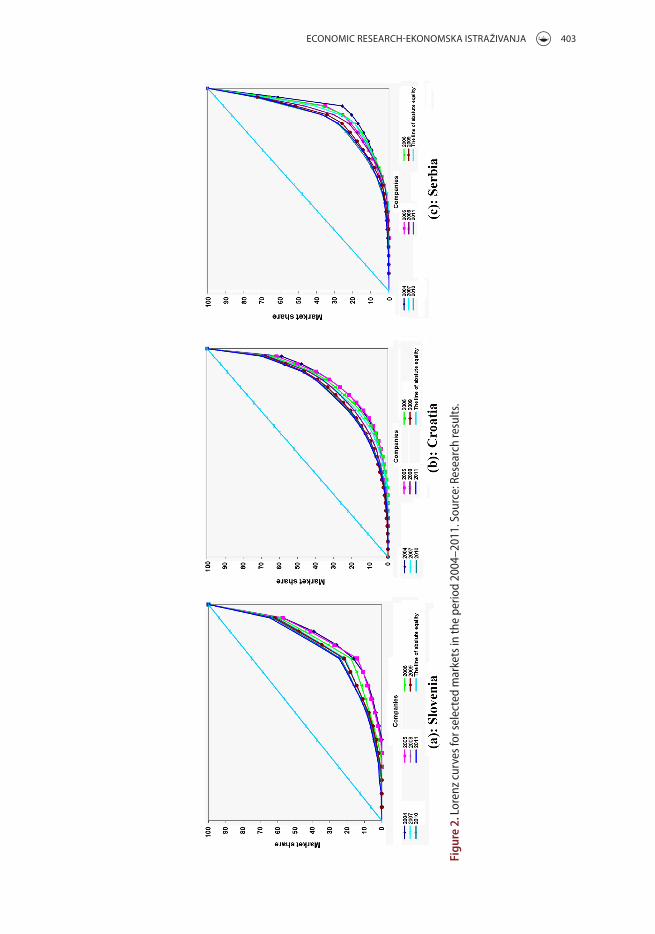
Analysis of the research results will be carried out separately for concentration indicators and inequality indicators. Tables 3 and 4 and Figure 2 provide information on the movement of the indicators for the period between 2004 and 2011.
Based on the data presented in Table 3 we may give a rough estimate that in the period from 2004 to 2011 there was a decline in the value of concentration indicators, suggesting the concentration level reduction in all the analysed markets.
Table 4 and Figure 2 provide information on the inequality in the distribution of market shares between the companies in the analysed markets, in the entire period of the research.
The analysis of inequality indicators leads to the following conclusion: although it can be said that there is a tendency to reduce inequality, it is not as clearly expressed as a trend of concentration reduction.
Table 3. the supply concentration indicator’s value movement in selected insurance markets in the period 2004–2011.
source: Research results.
Year
Slovenia Croatia Serbia
CR4 HHi CR4 HHi CR4 HHi2004 83,60 2490,54 67,65 2052,52 89,91 2831,922005 85,81 2488,81 67,54 1882,98 79,02 2270,292006 82,18 2291,90 65,49 1721,32 81,15 2236,472007 78,99 2128,22 63,96 1601,23 81,15 2050,622008 78,30 2118,98 63,34 1551,44 77,98 1820,382009 78,09 2054,77 60,81 1447,31 74,20 1640,992010 76,10 1953,80 59,80 1397,19 71,61 1520,662011 75,29 1869,16 59,70 1356,93 72,10 1551,26
Table 4. the movement of the inequality indicator’s values in the distribution of supply in selected insur-ance markets in the period 2004–2011.
source: Research results.
Year
Slovenia Croatia Serbia
G E RE G E RE G E RE2004 0,6171 1,7403 0,6785 0,6746 2,1688 0,6824 0,7225 1,7240 0,57552005 0,5820 1,7402 0,7003 0,6593 2,2017 0,7022 0,6449 1,9067 0,67302006 0,5668 1,8537 0,7227 0,5925 2,2532 0,7522 0,5949 1,8712 0,70912007 0,5620 1,9476 0,7380 0,6086 2,3152 0,7490 0,6261 1,9281 0,69542008 0,5623 1,9536 0,7403 0,6358 2,3711 0,7366 0,6770 2,0282 0,67702009 0,5879 1,9669 0,7263 0,6374 2,4490 0,7430 0,6610 2,1413 0,70332010 0,5696 2,0194 0,7457 0,6065 2,4539 0,7623 0,6309 2,2181 0,71762011 0,5846 2,0549 0,7411 0,6134 2,4809 0,7615 0,6515 2,2054 0,7034
Table 2. number of active insurance companies in slovenia, croatia, and serbia.
*number of active insurance companies which had no premium income in the analysed year.source: annual Reports 2004–2011.
Year Slovenia Croatia Serbia2004 13 24 202005 14(2*) 23 172006 13 20 142007 14 22 18(2*)2008 15(1*) 25 21(1*)2009 15 27 22(1*)2010 15 25 222011 16 26 23
EConoMiC RESEaRCH-EKonoMSKa iSTRaživanja 403
Figu
re 2
. Lor
enz
curv
es fo
r sel
ecte
d m
arke
ts in
the
perio
d 20
04–2
011.
sou
rce:
Res
earc
h re
sults
.
404 M. KoSTić ET aL.
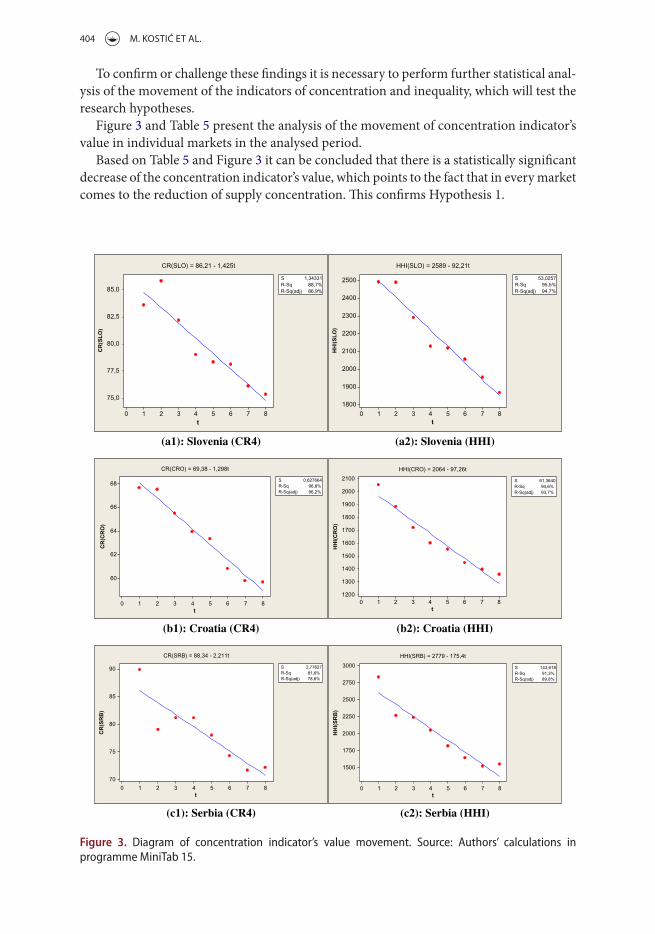
To confirm or challenge these findings it is necessary to perform further statistical anal-ysis of the movement of the indicators of concentration and inequality, which will test the research hypotheses.
Figure 3 and Table 5 present the analysis of the movement of concentration indicator’s value in individual markets in the analysed period.
Based on Table 5 and Figure 3 it can be concluded that there is a statistically significant decrease of the concentration indicator’s value, which points to the fact that in every market comes to the reduction of supply concentration. This confirms Hypothesis 1.
876543210
85,0
82,5
80,0
77,5
75,0
t
CR(SLO)
S 1,34331R-Sq 88,7%R-Sq(adj) 86,9%
CR(SLO) = 86,21 - 1,425t
876543210
2500
2400
2300
2200
2100
2000
1900
1800
t
HHI(SLO)
S 53,0257R-Sq 95,5%R-Sq(adj) 94,7%
HHI(SLO) = 2589 - 92,21t
(a1): Slovenia (CR4)
876543210
68
66
64
62
60
t
CR(CRO)
S 0,627664R-Sq 96,8%R-Sq(adj) 96,2%
CR(CRO) = 69,38 - 1,298t
876543210
2100
2000
1900
1800
1700
1600
1500
1400
1300
1200
t
HHI(CRO)
S 61,3640R-Sq 94,6%R-Sq(adj) 93,7%
HHI(CRO) = 2064 - 97,26t
(b1): Croatia (CR4)
876543210
90
85
80
75
70
t
CR(SRB)
S 2,77627R-Sq 81,6%R-Sq(adj) 78,6%
CR(SRB) = 88,34 - 2,211t
876543210
3000
2750
2500
2250
2000
1750
1500
t
HHI(SRB)
S 143,618R-Sq 91,3%R-Sq(adj) 89,8%
HHI(SRB) = 2779 - 175,4t
(c1): Serbia (CR4) (c2): Serbia (HHI)
(b2): Croatia (HHI)
(a2): Slovenia (HHI)
Figure 3. Diagram of concentration indicator’s value movement. source: authors’ calculations in programme minitab 15.
EConoMiC RESEaRCH-EKonoMSKa iSTRaživanja 405
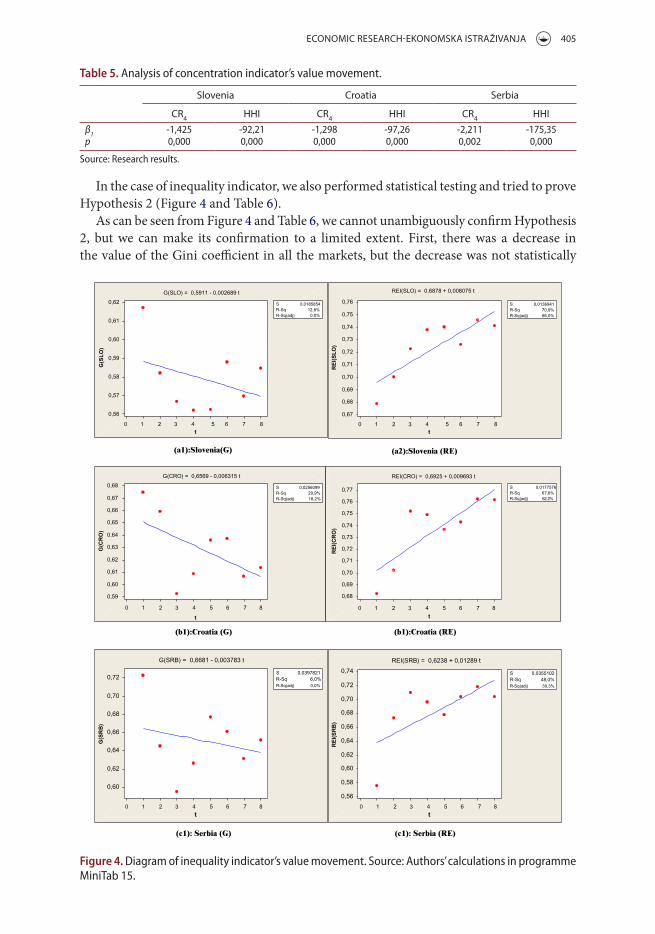
In the case of inequality indicator, we also performed statistical testing and tried to prove Hypothesis 2 (Figure 4 and Table 6).
As can be seen from Figure 4 and Table 6, we cannot unambiguously confirm Hypothesis 2, but we can make its confirmation to a limited extent. First, there was a decrease in the value of the Gini coefficient in all the markets, but the decrease was not statistically
Table 5. analysis of concentration indicator’s value movement.
source: Research results.
Slovenia Croatia Serbia
CR4 HHi CR4 HHi CR4 HHiβ1 -1,425 -92,21 -1,298 -97,26 -2,211 -175,35p 0,000 0,000 0,000 0,000 0,002 0,000
0,74
0,72
0,70
0,68
0,66
0,64
0,62
0,60
0,58
0,56
t
REI(SRB)
S 0,0355102R-Sq 48,0%R-Sq(adj) 39,3%
REI(SRB) = 0,6238 + 0,01289 t
7643210
876543210
0,62
0,61
0,60
0,59
0,58
0,57
0,56
t
G(SLO)
S 0,0185854R-Sq 12,8%R-Sq(adj) 0,0%
G(SLO) = 0,5911 - 0,002689 t
0,77
0,76
0,75
0,74
0,73
0,72
0,71
0,70
0,69
0,68
t
REI(CRO)
S 0,0177576R-Sq 67,6%R-Sq(adj) 62,2%
REI(CRO) = 0,6925 + 0,009693 t
0,72
0,70
0,68
0,66
0,64
0,62
0,60
t
G(SRB)
S 0,0397821R-Sq 6,0%R-Sq(adj) 0,0%
G(SRB) = 0,6681 - 0,003783 t
0,68
0,67
0,66
0,65
0,64
0,63
0,62
0,61
0,60
0,59
t
G(CRO)
S 0,0256099R-Sq 29,9%R-Sq(adj) 18,2%
G(CRO) = 0,6569 - 0,006315 t
85
7643210 85 7643210 85
7643210 85
876543210
0,76
0,75
0,74
0,73
0,72
0,71
0,70
0,69
0,68
0,67
t
REI(SLO)
S 0,0136941R-Sq 70,9%R-Sq(adj) 66,0%
REI(SLO) = 0,6878 + 0,008075 t
(a1):Slovenia(G) (a2):Slovenia (RE)
(b1):Croatia (G) (b1):Croatia (RE)
(c1): Serbia (G) (c1): Serbia (RE)
Figure 4. Diagram of inequality indicator’s value movement. source: authors’ calculations in programme minitab 15.
406 M. KoSTić ET aL.
significant. This is illustrated by the Lorenz curve (Figure 2), which indicates a general tendency to reduce the inequality, which is not emphasised.
On the other hand, the relative entropy index value increases in all markets, reflecting the growing uncertainty, and thus the competition among companies. However, this competi-tion increase in the Serbian market is statistically slightly significant, whereas in Croatia and
Slovenia is very significant (of course, not at the level of concentration indicator). We can conclude that Hypothesis 2 can be unambiguously confirmed only for the relative entropy index in the markets of Croatia and Slovenia.
Considering the above, we conclude that competitive conditions are better at the end of the research period than at the start.
Further research analyses the correlation in the movement of various indicators of con-centration and inequality between the analysed markets. Correlation in the indicators’ value movement between the analysed markets and the value of its statistical significance are given in Table 7.
As can be seen in Table 7, the movement of the analysed indicators of concentration and inequality between the insurance markets of Serbia, Croatia and Slovenia, shows a high level of correlation that is statistically significant. This suggests that identical move-ments of the level of concentration and inequality are achieved in all analysed markets, indicating the similarity of the business context in all the countries. This has confirmed Hypothesis 3.
Table 7. correlation value in the movement of selected indicators of concentration and inequality in the insurance market of serbia, croatia, and slovenia in the period 2004–2011.
**correlation is significant at the 0.01 level (2-tailed).*correlation is significant at the 0.05 level (2-tailed).source: Research results.
CR4 HH G RE
SRB CRo SLo SRB CRo SLo SRB CRo SLo SRB CRo SLo
SRB Pearson Correlation 1,000 ,866** ,728* 1,000 ,978** ,920** 1,000 ,842** ,747* 1,000 ,896** ,843**
sig. (2-tailed) ,005 ,041 ,000 ,001 ,009 ,033 ,003 ,009 cRo Pearson correlation ,866** 1,000 ,956** ,978** 1,000 ,974** ,842** 1,000 ,741* ,896** 1,000 ,933**
sig. (2-tailed) ,005 ,000 ,000 ,000 ,009 ,035 ,003 ,001 sLo Pearson correlation ,728* ,956** 1,000 ,920** ,974** 1,000 ,747* ,741* 1,000 ,843** ,933** 1,000
sig. (2-tailed) ,041 ,000 ,001 ,000 ,033 ,035 ,009 ,001
Table 6. analysis of inequality indicator’s value movement.
source: Research results.
Slovenia Croatia Serbia
G RE G RE G REβ1 -0,0027 0,00808 -0,0063 0,00969 -0,0038 0,0129P 0,385 0,009 0,161 0,012 0,560 0,057
EConoMiC RESEaRCH-EKonoMSKa iSTRaživanja 407
6. Conclusion and limitations of the research
Based on the above, we can derive some conclusions. First, generally in all the analysed markets, there is a trend to reduce the concentration and inequality in the distribution of market share. Concentration reduction in all the markets is statistically significant, while inequality reduction is not. On this basis, we can conclude that competition strengthens in the observed markets which should provide greater choice for consumers and lower prices for provided services.
The country with the lowest level of supply concentration in the insurance sector is Croatia, followed by Serbia, and then Slovenia. The probable reason for this is the fact that the largest number of active insurance companies is in the Croatian market. As for the inequality in the distribution of market share, Slovenia stands out with most properly distributed shares.
When we speak of consumers’ certainty of choice, as yet another indicator of the market structure limitation, we can say that there is less certainty in Croatia and Slovenia than in Serbia. This indicates greater possibility of choices by consumers in the markets of Croatia and Slovenia than in Serbia.
The general conclusion to be drawn is that, despite the relatively uneven distribution of market share, the Croatian insurance market is more competitive than the other two.
As for the movement of the indicator of concentration and inequality, it can be said that the process is being achieved at a similar pace in all three countries, which indicates that these markets belong to the same business environment.
Presented research and conclusions contain certain limitations, primarily for the use of concentration indicators. Concentration indicators are a useful tool in assessing the level of market limitation: they give an exact evaluation of the level of concentration and equality of market share distribution and a relatively clear picture of companies’ potentials to use market power. However, they are not immune to some of the problems and limitations.
The first problem is related to the definition of the relevant market’s boundaries, i.e., market volume, in spatial and production sense. In the case of the insurance market the problem is related to the different types of insurance and their levels of substitutability. From this it follows that the entire insurance market can be seen as the relevant product market, but we can distinguish the life insurance and non-life insurance market. Also, as a separate market, it is possible to single out motor vehicle insurance or the health insurance market, and the like. In this article, we opted for a complete insurance market. The framework for the analysis was identical for all the countries so that the data is comparable.
The second problem is related to the inability of the indicators to acknowledge certain qualitative characteristics of the market, such as market structure stability, the level of product differentiation, the height of entry barriers, operating costs, etc. Also, these indices do not include industrial tradition, nor do they include features and objectives of managers who run the companies. The inclusion of these elements would make the assessment of market limitation more detailed and therefore more complete.
The third problem is related to the size of economy and market: the value of the indicator will not have the same meaning for ‘small’ and ‘large’ economy (Mitton, 2008). In a small economy it is normal that due to small space and low purchasing power there is a higher level of tolerance to a high value of concentration indicator. This problem has no great signif-icance, given that in this case the countries have similar number of insurance beneficiaries.
408 M. KoSTić ET aL.
Regardless of all the limitations, the research provides a clear image of competition con-ditions in the insurance market of the three countries, which is at the same time the image of competition conditions in the insurance market of the region they belong to.
The research should improve competition policy, through greater application of eco-nomic analysis. Oligopolisation in most markets, also in the insurance market, imposes the requirement to monitor the degree of limitation of competition and formulate measures to ensure competitive conditions through economic analysis. Competition policy, which contains high level of economic analysis, would be able to better encourage companies’ competitive and prevent monopolistic practice through precise quantification of the results of uncompetitive behaviour, as well as measures taken by anti-monopoly authorities.
References
Adelman, M. A. (1951). The measurement of industrial concentration. The Review of Economics and Statistics, 33, 269–296.
Al-Muharrami, S., Matthews, K., & Kahabari, Y. (2006). Market structure and competitive conditions in the Arab GCC banking system. Journal of Banking and Finance, 30, 3487–3501.
American Bar Association, Section of Antitrust Law. (2005). Market power handbook. Chicago, IL: ABA.
Begović, B., Bukvić, R., Mijatović, B., Paunović, M., Sepi, R., & Hiber, D. (2002). Antimonopolska politika u SR Jugoslaviji [Competition policy in the FR of Yugoslavia]. Belgrade: Center for Liberal-Democratic Studies.
Belobaba, P., & Van Acker, J. (1994). Airline market concentration – an analyses of US origin-destination markets. Journal of Air Transport Management, 1, 5–14.
Bikker, J. A., & Haaf, K. (2002a). Competition, concentration and their relationship: An empirical analysis of the banking industry. Journal of Banking and Finance, 26, 2191–2214.
Bikker, J. A., & Haaf, K. (2002). Measures of competition and concentration in the banking industry: A review of the literature. Economic & Financial Modelling, 1–46.
Croatian Financial Services Supervisory Agency (2004, 2005, 2006, 2007, 2008, 2009, 2010 and 2011). Annual reports. Zagreb: Croatian Financial Services Supervisory Agency.
Curry, B., & George, K. D. (1983). Industrial concentration: A survey. The Journal of Industrial Economics, 31, 203–255.
Davies, S. W. (1979). Choosing between concentration indices: The iso-concentration curve. Economica, 46, 67–75.
Davies, S. W. (1980). Measuring industrial concentration: An alternative approach. The Review of Economics and Statistics, 62, 306–309.
Einarsson, A. (2008). The retail sector in the Nordic countries: A description of the differences, similarities, and uniqueness in the global market. Journal of Retailing and Consumer Services, 15, 443–451.
European Commission. (1997, 12 9). Commission notice on the definition of the relevant market for the purposes of community competition Law. Official Journal of European Union, OJ C 372, 09/12/1997, 5–13.
Kostić, M. (2009). Analiza koncentracije ponude u sektoru osiguranja Srbije [Supply concentration analysis in Serbian insurance sector]. Industrija, 37, 59–77.
Lipczynski, J., Wilson, J., & Goddard, J. (2009). Industrial organisation – competition, strategy, policy. Harlow: Prentice Hall.
Maksimović, L., & Kostić, M. (2012). Limitations in the application of concentration indicators – Example of insurance market in Serbia, Croatia, Slovenia. Romania and Austria. Politika preduzeća, 60, 199–205.
Maksimović, L., Radosavljević, G., & Borisavljević, K. (2011). Concentration in the radio television program distribution market in the Republic of Serbia. Industrija, 39, 31–43.
EConoMiC RESEaRCH-EKonoMSKa iSTRaživanja 409
Marović, B., Njegomir, V., & Maksimović, R. (2010). The implications of the financial crisis to the insurance industry – Global and regional perspective. Economic Research-Ekonomska Istraživanja, 23, 127–141.
Martin, S. (2002). Advanced industrial economics. Oxford, UK: Blackwell Publishers Ltd.Mitton, T. (2008). Institutions and concentration. Journal of Development Economics, 86, 367–394. Motta, M. (2008). Competition Policy: Theory and Practice. Cambridge: Cambridge University Press.Njegomir, V., & Stojić, D. (2012). Determinants of nonlife insurance market attractiveness for foreign
investments: Eastern European evidence. Economic Research-Ekonomska Istraživanja, 25, 297–310. Saving, T. (1970). Concentration ratios and the degree of monopoly. International Economic Review,
11, 139–146. Schmittlein, D. C., Cooper, L. G., & Morrison, D. G. (1993). Truth in concentration in the land of
(80/20) laws. Marketing Science, 12, 167–183.Slovenian Insurance Supervision Agency (2004, 2005, 2006, 2007, 2008, 2009, 2010, and 2011). Annual
reports. Ljubljana: Slovenian Insurance Supervision Agency.Stojanović, B., & Radivojević, V. (2010). Koncentracija ponude kao izraz nesavršenosti tržišta - primer
nespecijalizovane trgovine na malo na tržištu grada Niša [Concentration of supply: A form of market imperfection: Example of non-specialized retail trade in Nis ]. Ekonomika preduzeća, 58, 327–338.
Tipurić, D., Kolaković, M., & Dumičić, K. (2002). Istraživanje promjena u koncentraciji hrvatske bankarske industrije 1993-2000 [Research of change in Croatian banking industry concentration 1993-2000]. Ekonomski pregled, 53, 474–494.
Tipurić, D., Kolaković, M., & Dumičić, K. (2003). Koncentracijske promjena hrvatske bankarske industrije u desetogodišnjem razdoblju (1993-2002) [Concentration changes of Croatian banking industry in the past decade (1993-2002)]. Zbornik Ekonomskog fakulteta u Zagrebu, 1–2.
Vanlommel, E., de Brabander, B., & Liebaers, D. (1977). Industrial concentration in Belgium: Empirical comparison of alternative seller concentration measures. The Journal of Industrial Economics, 26(1), 1–20.
Waldman, E. D., & Jensen, E. (2001). Industrial organization - theory and practice. New York, NY: Addison Wesley Longman.
White, A. P. (1982). A note on market structure measures and the characteristics of markets that they measure. Southern Economic Journal, 49, 542–549.
http://www.iaisweb.org/IAIS-members-31. (n.d.). Retrieved February 15, 2013 from International Association of Insurance Supervisors.
http://www.nbs.rs/internet/cirilica/60/60_2/index.html. (n.d.). Retrieved February 15, 2013 from National bank of Serbia.
410 M. KoSTić ET aL.
Appendices
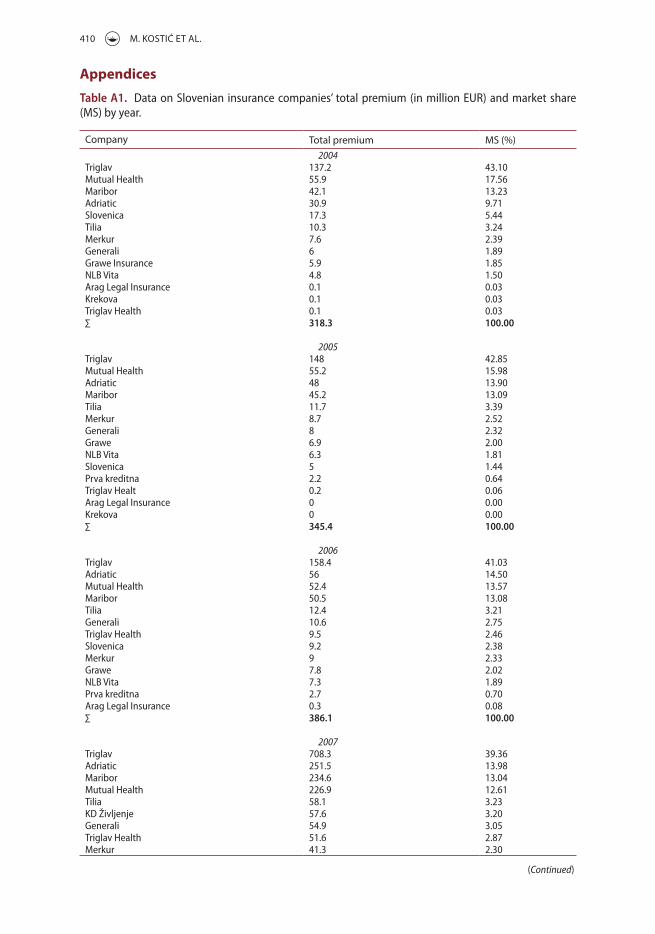
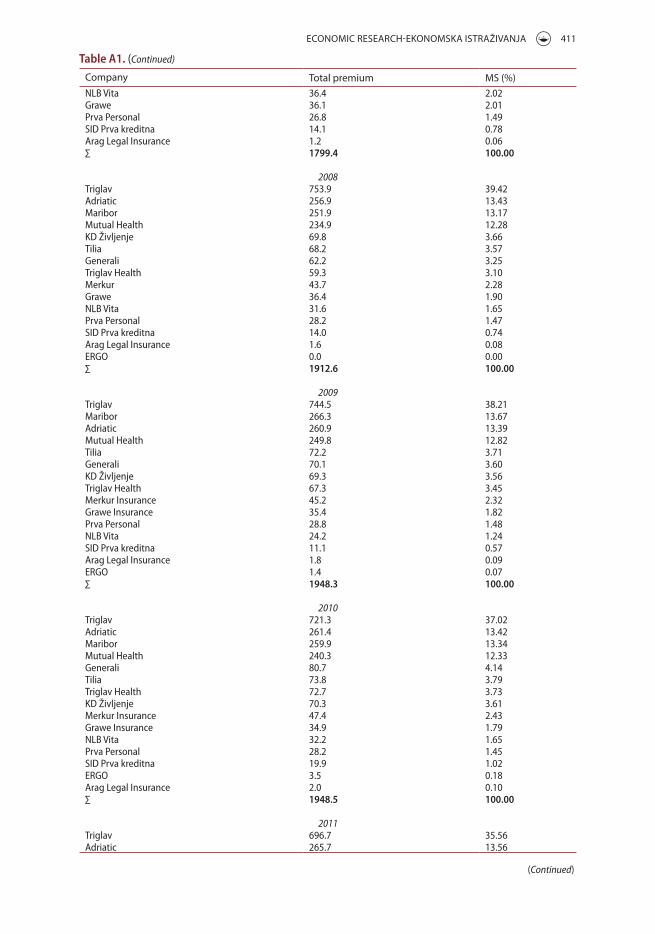
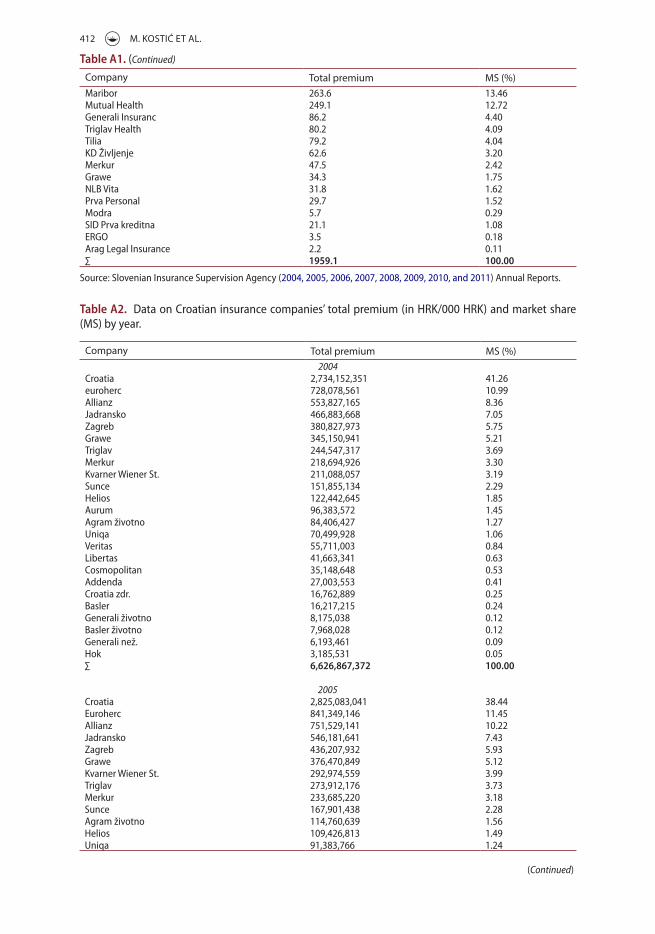
Table A1. Data on slovenian insurance companies’ total premium (in million EUR) and market share (ms) by year.
Company Total premium MS (%)2004
triglav 137.2 43.10mutual health 55.9 17.56maribor 42.1 13.23adriatic 30.9 9.71slovenica 17.3 5.44tilia 10.3 3.24merkur 7.6 2.39Generali 6 1.89Grawe insurance 5.9 1.85nLB vita 4.8 1.50arag Legal insurance 0.1 0.03krekova 0.1 0.03triglav health 0.1 0.03∑ 318.3 100.00
2005triglav 148 42.85mutual health 55.2 15.98adriatic 48 13.90maribor 45.2 13.09tilia 11.7 3.39merkur 8.7 2.52Generali 8 2.32Grawe 6.9 2.00nLB vita 6.3 1.81slovenica 5 1.44Prva kreditna 2.2 0.64triglav healt 0.2 0.06arag Legal insurance 0 0.00krekova 0 0.00∑ 345.4 100.00
2006triglav 158.4 41.03adriatic 56 14.50mutual health 52.4 13.57maribor 50.5 13.08tilia 12.4 3.21Generali 10.6 2.75triglav health 9.5 2.46slovenica 9.2 2.38merkur 9 2.33Grawe 7.8 2.02nLB vita 7.3 1.89Prva kreditna 2.7 0.70arag Legal insurance 0.3 0.08∑ 386.1 100.00
2007triglav 708.3 39.36adriatic 251.5 13.98maribor 234.6 13.04mutual health 226.9 12.61tilia 58.1 3.23kD življenje 57.6 3.20Generali 54.9 3.05triglav health 51.6 2.87merkur 41.3 2.30
(Continued)
EConoMiC RESEaRCH-EKonoMSKa iSTRaživanja 411
Company Total premium MS (%)nLB vita 36.4 2.02Grawe 36.1 2.01Prva Personal 26.8 1.49siD Prva kreditna 14.1 0.78arag Legal insurance 1.2 0.06∑ 1799.4 100.00
2008triglav 753.9 39.42adriatic 256.9 13.43maribor 251.9 13.17mutual health 234.9 12.28kD življenje 69.8 3.66tilia 68.2 3.57Generali 62.2 3.25triglav health 59.3 3.10merkur 43.7 2.28Grawe 36.4 1.90nLB vita 31.6 1.65Prva Personal 28.2 1.47siD Prva kreditna 14.0 0.74arag Legal insurance 1.6 0.08ERGo 0.0 0.00∑ 1912.6 100.00
2009triglav 744.5 38.21maribor 266.3 13.67adriatic 260.9 13.39mutual health 249.8 12.82tilia 72.2 3.71Generali 70.1 3.60kD življenje 69.3 3.56triglav health 67.3 3.45merkur insurance 45.2 2.32Grawe insurance 35.4 1.82Prva Personal 28.8 1.48nLB vita 24.2 1.24siD Prva kreditna 11.1 0.57arag Legal insurance 1.8 0.09ERGo 1.4 0.07∑ 1948.3 100.00
2010triglav 721.3 37.02adriatic 261.4 13.42maribor 259.9 13.34mutual health 240.3 12.33Generali 80.7 4.14tilia 73.8 3.79triglav health 72.7 3.73kD življenje 70.3 3.61merkur insurance 47.4 2.43Grawe insurance 34.9 1.79nLB vita 32.2 1.65Prva Personal 28.2 1.45siD Prva kreditna 19.9 1.02ERGo 3.5 0.18arag Legal insurance 2.0 0.10∑ 1948.5 100.00
2011triglav 696.7 35.56adriatic 265.7 13.56
(Continued)
Table A1. (Continued)
412 M. KoSTić ET aL.
Company Total premium MS (%)maribor 263.6 13.46mutual health 249.1 12.72Generali insuranc 86.2 4.40triglav health 80.2 4.09tilia 79.2 4.04kD življenje 62.6 3.20merkur 47.5 2.42Grawe 34.3 1.75nLB vita 31.8 1.62Prva Personal 29.7 1.52modra 5.7 0.29siD Prva kreditna 21.1 1.08ERGo 3.5 0.18arag Legal insurance 2.2 0.11∑ 1959.1 100.00
source: slovenian insurance supervision agency (2004, 2005, 2006, 2007, 2008, 2009, 2010, and 2011) annual Reports.
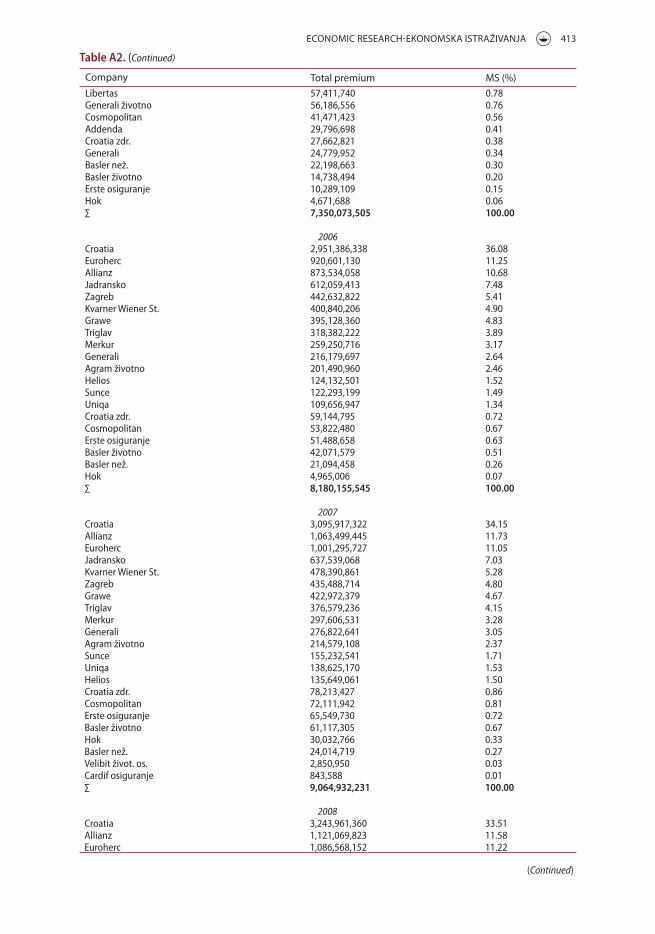
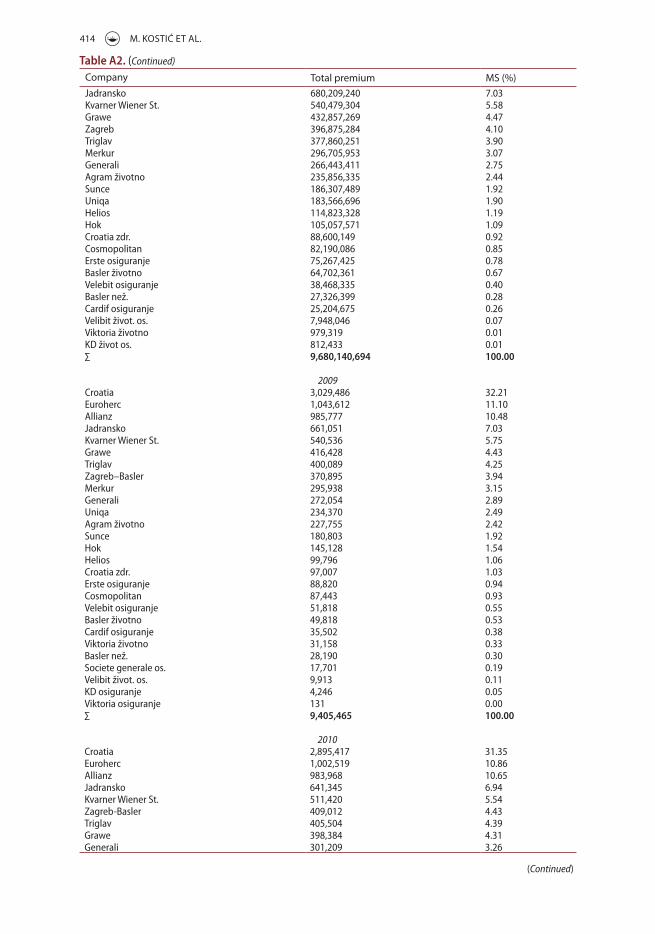
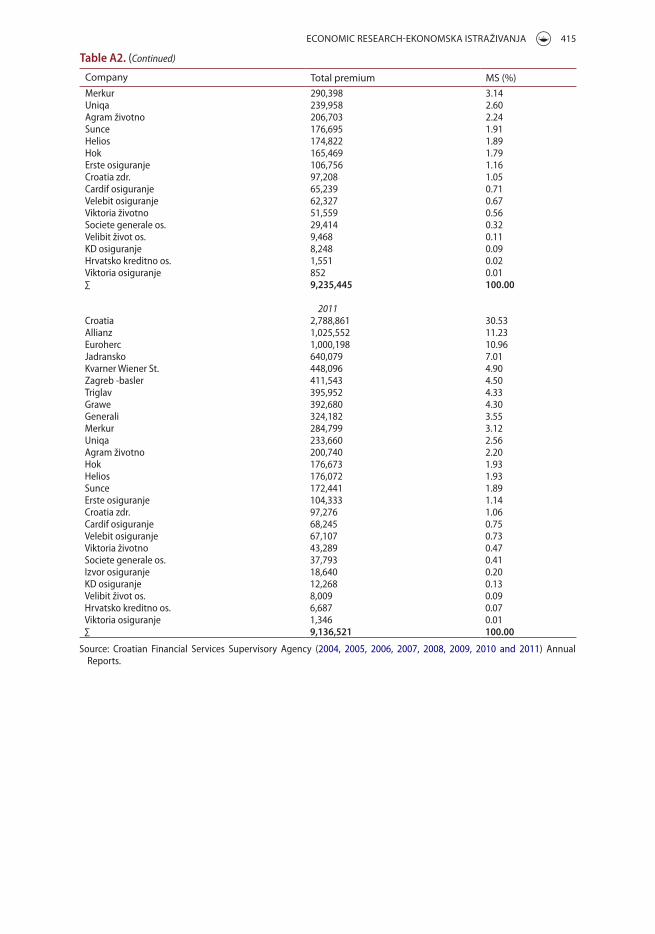
Table A2. Data on croatian insurance companies’ total premium (in hRk/000 hRk) and market share (ms) by year.
Company Total premium MS (%)2004
croatia 2,734,152,351 41.26euroherc 728,078,561 10.99allianz 553,827,165 8.36jadransko 466,883,668 7.05Zagreb 380,827,973 5.75Grawe 345,150,941 5.21triglav 244,547,317 3.69merkur 218,694,926 3.30kvarner Wiener st. 211,088,057 3.19sunce 151,855,134 2.29helios 122,442,645 1.85aurum 96,383,572 1.45agram životno 84,406,427 1.27Uniqa 70,499,928 1.06veritas 55,711,003 0.84Libertas 41,663,341 0.63cosmopolitan 35,148,648 0.53addenda 27,003,553 0.41croatia zdr. 16,762,889 0.25Basler 16,217,215 0.24Generali životno 8,175,038 0.12Basler životno 7,968,028 0.12Generali než. 6,193,461 0.09hok 3,185,531 0.05∑ 6,626,867,372 100.00
2005croatia 2,825,083,041 38.44Euroherc 841,349,146 11.45allianz 751,529,141 10.22jadransko 546,181,641 7.43Zagreb 436,207,932 5.93Grawe 376,470,849 5.12kvarner Wiener st. 292,974,559 3.99triglav 273,912,176 3.73merkur 233,685,220 3.18sunce 167,901,438 2.28agram životno 114,760,639 1.56helios 109,426,813 1.49Uniqa 91,383,766 1.24
(Continued)
Table A1. (Continued)
EConoMiC RESEaRCH-EKonoMSKa iSTRaživanja 413
Company Total premium MS (%)Libertas 57,411,740 0.78Generali životno 56,186,556 0.76cosmopolitan 41,471,423 0.56addenda 29,796,698 0.41croatia zdr. 27,662,821 0.38Generali 24,779,952 0.34Basler než. 22,198,663 0.30Basler životno 14,738,494 0.20Erste osiguranje 10,289,109 0.15hok 4,671,688 0.06∑ 7,350,073,505 100.00
2006croatia 2,951,386,338 36.08Euroherc 920,601,130 11.25allianz 873,534,058 10.68jadransko 612,059,413 7.48Zagreb 442,632,822 5.41kvarner Wiener st. 400,840,206 4.90Grawe 395,128,360 4.83triglav 318,382,222 3.89merkur 259,250,716 3.17Generali 216,179,697 2.64agram životno 201,490,960 2.46helios 124,132,501 1.52sunce 122,293,199 1.49Uniqa 109,656,947 1.34croatia zdr. 59,144,795 0.72cosmopolitan 53,822,480 0.67Erste osiguranje 51,488,658 0.63Basler životno 42,071,579 0.51Basler než. 21,094,458 0.26hok 4,965,006 0.07∑ 8,180,155,545 100.00
2007croatia 3,095,917,322 34.15allianz 1,063,499,445 11.73Euroherc 1,001,295,727 11.05jadransko 637,539,068 7.03kvarner Wiener st. 478,390,861 5.28Zagreb 435,488,714 4.80Grawe 422,972,379 4.67triglav 376,579,236 4.15merkur 297,606,531 3.28Generali 276,822,641 3.05agram životno 214,579,108 2.37sunce 155,232,541 1.71Uniqa 138,625,170 1.53helios 135,649,061 1.50croatia zdr. 78,213,427 0.86cosmopolitan 72,111,942 0.81Erste osiguranje 65,549,730 0.72Basler životno 61,117,305 0.67hok 30,032,766 0.33Basler než. 24,014,719 0.27velibit život. os. 2,850,950 0.03cardif osiguranje 843,588 0.01∑ 9,064,932,231 100.00
2008croatia 3,243,961,360 33.51allianz 1,121,069,823 11.58Euroherc 1,086,568,152 11.22
(Continued)
Table A2. (Continued)
414 M. KoSTić ET aL.
Company Total premium MS (%)jadransko 680,209,240 7.03kvarner Wiener st. 540,479,304 5.58Grawe 432,857,269 4.47Zagreb 396,875,284 4.10triglav 377,860,251 3.90merkur 296,705,953 3.07Generali 266,443,411 2.75agram životno 235,856,335 2.44sunce 186,307,489 1.92Uniqa 183,566,696 1.90helios 114,823,328 1.19hok 105,057,571 1.09croatia zdr. 88,600,149 0.92cosmopolitan 82,190,086 0.85Erste osiguranje 75,267,425 0.78Basler životno 64,702,361 0.67velebit osiguranje 38,468,335 0.40Basler než. 27,326,399 0.28cardif osiguranje 25,204,675 0.26velibit život. os. 7,948,046 0.07viktoria životno 979,319 0.01kD život os. 812,433 0.01∑ 9,680,140,694 100.00
2009croatia 3,029,486 32.21Euroherc 1,043,612 11.10allianz 985,777 10.48jadransko 661,051 7.03kvarner Wiener st. 540,536 5.75Grawe 416,428 4.43triglav 400,089 4.25Zagreb–Basler 370,895 3.94merkur 295,938 3.15Generali 272,054 2.89Uniqa 234,370 2.49agram životno 227,755 2.42sunce 180,803 1.92hok 145,128 1.54helios 99,796 1.06croatia zdr. 97,007 1.03Erste osiguranje 88,820 0.94cosmopolitan 87,443 0.93velebit osiguranje 51,818 0.55Basler životno 49,818 0.53cardif osiguranje 35,502 0.38viktoria životno 31,158 0.33Basler než. 28,190 0.30societe generale os. 17,701 0.19velibit život. os. 9,913 0.11kD osiguranje 4,246 0.05viktoria osiguranje 131 0.00∑ 9,405,465 100.00
2010croatia 2,895,417 31.35Euroherc 1,002,519 10.86allianz 983,968 10.65jadransko 641,345 6.94kvarner Wiener st. 511,420 5.54Zagreb-Basler 409,012 4.43triglav 405,504 4.39Grawe 398,384 4.31Generali 301,209 3.26
(Continued)
Table A2. (Continued)
EConoMiC RESEaRCH-EKonoMSKa iSTRaživanja 415
Company Total premium MS (%)merkur 290,398 3.14Uniqa 239,958 2.60agram životno 206,703 2.24sunce 176,695 1.91helios 174,822 1.89hok 165,469 1.79Erste osiguranje 106,756 1.16croatia zdr. 97,208 1.05cardif osiguranje 65,239 0.71velebit osiguranje 62,327 0.67viktoria životno 51,559 0.56societe generale os. 29,414 0.32velibit život os. 9,468 0.11kD osiguranje 8,248 0.09hrvatsko kreditno os. 1,551 0.02viktoria osiguranje 852 0.01∑ 9,235,445 100.00
2011croatia 2,788,861 30.53allianz 1,025,552 11.23Euroherc 1,000,198 10.96jadransko 640,079 7.01kvarner Wiener st. 448,096 4.90Zagreb -basler 411,543 4.50triglav 395,952 4.33Grawe 392,680 4.30Generali 324,182 3.55merkur 284,799 3.12Uniqa 233,660 2.56agram životno 200,740 2.20hok 176,673 1.93helios 176,072 1.93sunce 172,441 1.89Erste osiguranje 104,333 1.14croatia zdr. 97,276 1.06cardif osiguranje 68,245 0.75velebit osiguranje 67,107 0.73viktoria životno 43,289 0.47societe generale os. 37,793 0.41izvor osiguranje 18,640 0.20kD osiguranje 12,268 0.13velibit život os. 8,009 0.09hrvatsko kreditno os. 6,687 0.07viktoria osiguranje 1,346 0.01∑ 9,136,521 100.00
source: croatian Financial services supervisory agency (2004, 2005, 2006, 2007, 2008, 2009, 2010 and 2011) annual Reports.
Table A2. (Continued)
416 M. KoSTić ET aL.
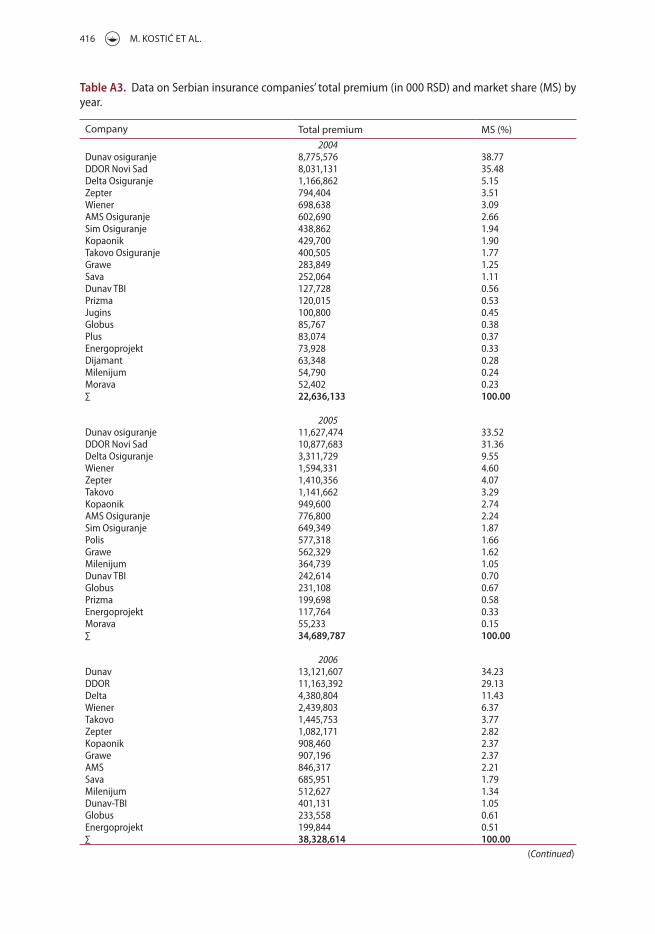
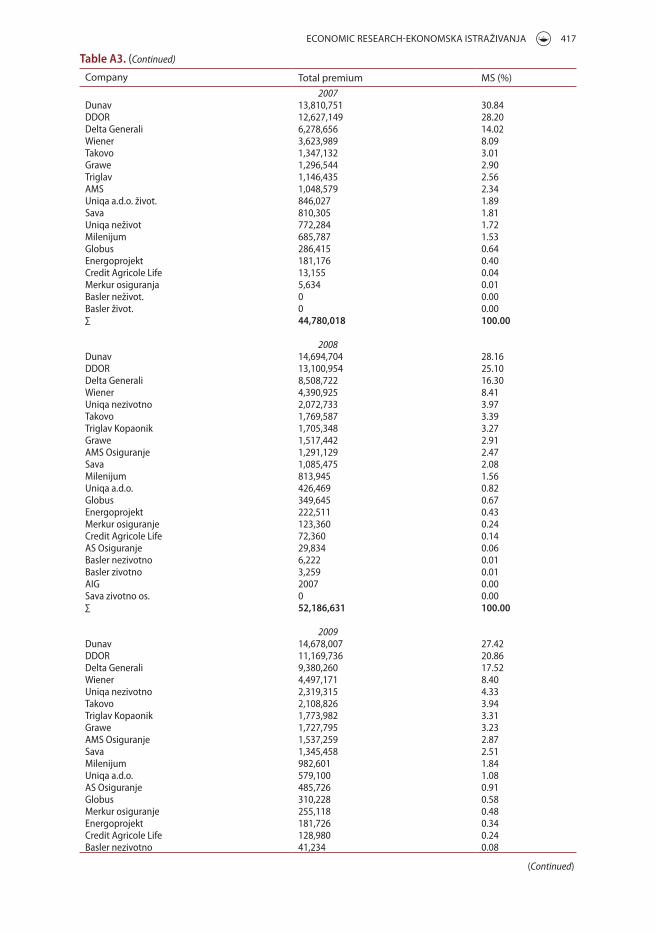
Table A3. Data on serbian insurance companies’ total premium (in 000 RsD) and market share (ms) by year.
Company Total premium MS (%)2004
Dunav osiguranje 8,775,576 38.77DDoR novi sad 8,031,131 35.48Delta osiguranje 1,166,862 5.15Zepter 794,404 3.51Wiener 698,638 3.09ams osiguranje 602,690 2.66sim osiguranje 438,862 1.94kopaonik 429,700 1.90takovo osiguranje 400,505 1.77Grawe 283,849 1.25sava 252,064 1.11Dunav tBi 127,728 0.56Prizma 120,015 0.53jugins 100,800 0.45Globus 85,767 0.38Plus 83,074 0.37Energoprojekt 73,928 0.33Dijamant 63,348 0.28milenijum 54,790 0.24morava 52,402 0.23∑ 22,636,133 100.00
2005Dunav osiguranje 11,627,474 33.52DDoR novi sad 10,877,683 31.36Delta osiguranje 3,311,729 9.55Wiener 1,594,331 4.60Zepter 1,410,356 4.07takovo 1,141,662 3.29kopaonik 949,600 2.74ams osiguranje 776,800 2.24sim osiguranje 649,349 1.87Polis 577,318 1.66Grawe 562,329 1.62milenijum 364,739 1.05Dunav tBi 242,614 0.70Globus 231,108 0.67Prizma 199,698 0.58Energoprojekt 117,764 0.33morava 55,233 0.15∑ 34,689,787 100.00
2006Dunav 13,121,607 34.23DDoR 11,163,392 29.13Delta 4,380,804 11.43Wiener 2,439,803 6.37takovo 1,445,753 3.77Zepter 1,082,171 2.82kopaonik 908,460 2.37Grawe 907,196 2.37ams 846,317 2.21sava 685,951 1.79milenijum 512,627 1.34Dunav-tBi 401,131 1.05Globus 233,558 0.61Energoprojekt 199,844 0.51∑ 38,328,614 100.00
(Continued)
EConoMiC RESEaRCH-EKonoMSKa iSTRaživanja 417
Company Total premium MS (%)2007
Dunav 13,810,751 30.84DDoR 12,627,149 28.20Delta Generali 6,278,656 14.02Wiener 3,623,989 8.09takovo 1,347,132 3.01Grawe 1,296,544 2.90triglav 1,146,435 2.56ams 1,048,579 2.34Uniqa a.d.o. život. 846,027 1.89sava 810,305 1.81Uniqa neživot 772,284 1.72milenijum 685,787 1.53Globus 286,415 0.64Energoprojekt 181,176 0.40credit agricole Life 13,155 0.04merkur osiguranja 5,634 0.01Basler neživot. 0 0.00Basler život. 0 0.00∑ 44,780,018 100.00
2008Dunav 14,694,704 28.16DDoR 13,100,954 25.10Delta Generali 8,508,722 16.30Wiener 4,390,925 8.41Uniqa nezivotno 2,072,733 3.97takovo 1,769,587 3.39triglav kopaonik 1,705,348 3.27Grawe 1,517,442 2.91ams osiguranje 1,291,129 2.47sava 1,085,475 2.08milenijum 813,945 1.56Uniqa a.d.o. 426,469 0.82Globus 349,645 0.67Energoprojekt 222,511 0.43merkur osiguranje 123,360 0.24credit agricole Life 72,360 0.14as osiguranje 29,834 0.06Basler nezivotno 6,222 0.01Basler zivotno 3,259 0.01aiG 2007 0.00sava zivotno os. 0 0.00∑ 52,186,631 100.00
2009Dunav 14,678,007 27.42DDoR 11,169,736 20.86Delta Generali 9,380,260 17.52Wiener 4,497,171 8.40Uniqa nezivotno 2,319,315 4.33takovo 2,108,826 3.94triglav kopaonik 1,773,982 3.31Grawe 1,727,795 3.23ams osiguranje 1,537,259 2.87sava 1,345,458 2.51milenijum 982,601 1.84Uniqa a.d.o. 579,100 1.08as osiguranje 485,726 0.91Globus 310,228 0.58merkur osiguranje 255,118 0.48Energoprojekt 181,726 0.34credit agricole Life 128,980 0.24Basler nezivotno 41,234 0.08
(Continued)
Table A3. (Continued)
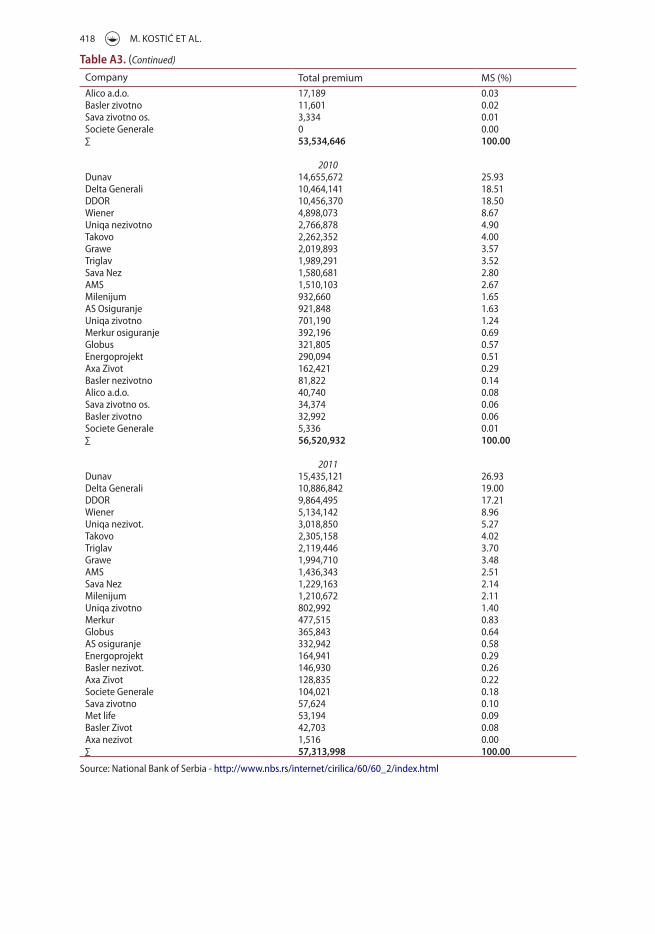
418 M. KoSTić ET aL.
Company Total premium MS (%)alico a.d.o. 17,189 0.03Basler zivotno 11,601 0.02sava zivotno os. 3,334 0.01societe Generale 0 0.00∑ 53,534,646 100.00
2010Dunav 14,655,672 25.93Delta Generali 10,464,141 18.51DDoR 10,456,370 18.50Wiener 4,898,073 8.67Uniqa nezivotno 2,766,878 4.90takovo 2,262,352 4.00Grawe 2,019,893 3.57triglav 1,989,291 3.52sava nez 1,580,681 2.80ams 1,510,103 2.67milenijum 932,660 1.65as osiguranje 921,848 1.63Uniqa zivotno 701,190 1.24merkur osiguranje 392,196 0.69Globus 321,805 0.57Energoprojekt 290,094 0.51axa Zivot 162,421 0.29Basler nezivotno 81,822 0.14alico a.d.o. 40,740 0.08sava zivotno os. 34,374 0.06Basler zivotno 32,992 0.06societe Generale 5,336 0.01∑ 56,520,932 100.00
2011Dunav 15,435,121 26.93Delta Generali 10,886,842 19.00DDoR 9,864,495 17.21Wiener 5,134,142 8.96Uniqa nezivot. 3,018,850 5.27takovo 2,305,158 4.02triglav 2,119,446 3.70Grawe 1,994,710 3.48ams 1,436,343 2.51sava nez 1,229,163 2.14milenijum 1,210,672 2.11Uniqa zivotno 802,992 1.40merkur 477,515 0.83Globus 365,843 0.64as osiguranje 332,942 0.58Energoprojekt 164,941 0.29Basler nezivot. 146,930 0.26axa Zivot 128,835 0.22societe Generale 104,021 0.18sava zivotno 57,624 0.10met life 53,194 0.09Basler Zivot 42,703 0.08axa nezivot 1,516 0.00∑ 57,313,998 100.00
source: national Bank of serbia - http://www.nbs.rs/internet/cirilica/60/60_2/index.html
Table A3. (Continued)