Embed Size (px)
Citation preview

1
Donald J. Hernandez
Hunter College and The Graduate Center
City University of New York
THE LINK BETWEEN
THIRD GRADE READING SKILLS AND
HIGH SCHOOL GRADUATION RATES
Invited Lecture
The Edward J. Bloustein School of Planning and Public Policy
and
The National Institute for Early Education Research
September 20, 2011
SLIDE 1. Title Slide
Good afternoon. Today I am going to present results from
a new study showing how third-grade reading skills and poverty
influence high school graduation.
SLIDE 2.
Thanks for Support and Assistance
I would like to begin by thanking the Annie E. Casey
Foundation and the Foundation for Child Development for their

2
support of the research which I am presenting today. For their
assistance in accessing data for the study, I would also like to
thank the thank staff of the National Longitudinal Survey of
Youth in Washington, D.C., and I would like to thank the Center
for Social and Demographic Analysis at the University of
Albany, State University of New York for their computer
assistance.
SLIDE 3.
Overview of New Study
I will begin by discussing why it is important to focus on
third-grade reading skills. Then, I will highlight key features of
my new study. Next, I will present results. Then, I will present
a brief overview of programs and policies that are especially
relevant to solving the problems of poor third-grade reading
skills and failure to graduate from high school. Next, I will
describe future research which I am planning, to provide a

3
deeper understanding of factors that lead to low third-grade
reading skills and to high rates of not graduating from high
school. Finally, I will shift to a focus on the circumstances of
children. Specifically, I will present results that I have
calculated for that state of New Jersey from the U.S. Census
Bureau’s 2005-2007 American Community Survey. My aim is
to identify and highlight key groups of children in New Jersey
who merit particular attention, because they are at special risk of
experiencing low third-grade reading scores and low rates of
graduation from high school.
SLIDE 4.
Why Focus on
Third Grade Reading Skills? (Pivot Point)
Third grade is a pivot point in a child’s education, because
third grade marks the point when children shift from “learning to
read” to “reading to learn”. Until about third grade, teachers and

4
students spend a great deal of time in the task of learning to
read.
But then, the educational process turns a corner. After third
grade, elementary school curricula generally assume that
children have achieved a mastery of reading. So, the focus
shifts to using these reading skills to learn about other topics.
As a result, students who have not mastered their reading skills
by third grade will be at a substantial disadvantage, compared to
other students, as they move further through elementary school,
and beyond.
SLIDE 5.
Why Focus on
Third Grade Reading Skills? (President Bush)
Third-grade reading skills have become very important for
another very practical set of reasons resulting from the
requirements of the No Child Left Behind Act of 2001(NCLB).

5
Recognizing the importance of early reading skills, the
NCLB asserted “President Bush’s unequivocal commitment to
ensuring that every child can read by the end of third grade.”
Reflecting this strong commitment, the NCLB has, from
the very beginning, required states to test reading skills for all
students beginning in third grade, and to report these results for
children by poverty status and race-ethnicity, as well as for
English Language Learners and children with disabilities.
SLIDE 6.
Why Focus On
Third Grade Reading Skills? (President Obama)
More recently in 2010, President Obama developed a
blueprint for revising the Elementary and Secondary School Act.
This blueprint calls for “Putting Reading First”, by significantly
increasing the Federal Investment in scientifically based early
reading instruction.

6
President Obama has called for restoring the United States
of its position as No. 1 in percentage of college graduates,
compared to being tied for 9th now. Accomplishing this goal
will mean that millions more students will have to graduate from
high school, which in turn means that millions more children
will have to master reading skills by third grade.
These education policies embedded in the NCLB are based
on research beginning more than three decades ago, which
shows that children with low third-grade reading test scores are
less likely to graduate from high school than are children with
higher reading scores. In addition, as I noted a moment ago, the
curricula of schools themselves are organized so that third grade
is a key pivot point. Third grade is the point where children stop
learning to read and begin reading to learn.
SLIDE 7.
New Results in This Study

7
In this context, results which I present today are from the
first-ever study to calculate high school graduation rates for
children with different reading skill levels, children with
different poverty experiences, and children in diverse race-
ethnic groups.
SLIDE 8. Fourth-Grade Reading Skills of
America’s Children, Based on NAEP,
“The Nation’s Report Card”
In order to classify children by reading skill level, we
decided to look at results from the National Assessment of
Educational Progress, or NAEP, also known as “The Nation’s
Report Card.” NAEP found that in 2009 only one-third of
fourth-grade students were proficient readers, that is, only one-
third were reading at or above grade level.
One might plausibly assume, or hope, that most children
would be reading at or above grade level. But it turns out that

8
two-thirds of fourth-graders, 67%, read below grade level, that
is, they are reading below the proficient level.
The NAEP indicates that “Fourth grade students
performing at the Proficient level should be able to integrate and
interpret texts and apply their understanding of the text to draw
conclusions and make evaluations”. Again, the NAEP results
show that two-thirds of fourth grade students are below this
level of reading proficiency, because they are not able to draw
conclusions and make evaluations based on their integration and
interpretation of a text.
Among students who are not proficient readers, NAEP
finds that one-third are reading at the basic level, and one-third
are reading below the basic level.
Slide 9.
Key Features of the New Study

9
Given these facts, we decided to divide our sample into
thirds, which we call high, medium, or low skill readers,
reflecting the different reading skills in the NAEP results. We
calculated high school graduation rates for these three groups
from the 1979 National Longitudinal Study of Youth, because
this is the only nationally representative survey that has tested
the reading skill of third graders, and then followed these same
children into young adulthood. In other words, this is the only
national data set for which it is possible calculate high school
graduation rates separately for children who had different levels
of reading skill in third grade.
Our results are calculated from a sample of 3,795 children
who were born between 1979 and 1989, and whose mothers
were 22-32 years old. These mothers were born during the last
half of the post-World War II baby-boom, in the years between
1957 and 1964.

10
The Reading test used in the NLSY79 is The Peabody
Individual Achievement Test (or PIAT) Reading Recognition
subtest, which is commonly used to assess reading skills of
children in national surveys.
The NLSY79 conducts interviews every other year. So we
had poverty data for each child for a total of five years. We
classified children as never living in poverty, or as living in
poverty for at least one of those five years.
We were also able to distinguish three major race-ethnic
groups, namely, non-Hispanic Whites, non-Hispanic Blacks, and
Hispanics.
Finally, we calculated rates for graduating from high school
on-time, that is, graduating by age 19, but the data do not
indicate whether or not the students actually dropped out.
SLIDE 10. Percent Not Graduating
from High School by

11
3rd
Grade Reading Proficiency
What do our results show? High school graduation rates
vary enormously for children with different third-grade reading
skills. One-in-six children, 16%, who are not reading
proficiently in third grade did not graduate from high school.
This is four times the rate of 4% not graduating for children who
are proficient readers.
SLIDE 11. Percent of Students
Not Graduating,
among Not-Proficient Readers
Among not-proficient readers the proportion not graduating
from high school rises from 9% for students with basic reading
skills to 23% for students with below basic reading skills. Third
grade reading matters clearly matters for high school graduation.
SLIDE 12.
3rd
Grade Reading Test Scores

12
for All Students and Non-Graduates
As a result of these enormous differences in graduation
rates across reading-skill groups, children with the lowest
reading scores account for only-third of all children, but they
account for more than three-fifths, 63 percent, of all children
who do not graduate from high school.
More broadly, although two-thirds of all children read
below the proficient level, children who read below the
proficient level account for 88% of children who do not graduate
from high school. In sharp contrast, 33% of all students are
proficient readers, but these proficient readers account for a only
a small 12% of students who do not graduate from high school.
SLIDE 13. Percent of Students
Not Graduating by Reading Proficiency
& Poverty Experience

13
This slide shows the proportion of students who do not
graduate from high school for children who differ in both their
third-grade reading skill and their experience with family
poverty.
Children in poor families may arrive at school without the
language and social skills they need for learning, and they tend
to live in neighborhoods with low-performing schools. For
these and other reasons, children with low third-grade reading
skills and who live in poverty are in double-jeopardy for not
graduating from high school.
As the left-hand panel of this slide shows, overall, 22% of
children who have lived in poverty do not graduate from high
school, compared to 6% who were never poor. This rises to
32% for students spending more than half of the survey
interview-years in poverty.

14
The middle panel of these slide shows that poverty matters
even for children who are proficient readers. Among children
who are proficient readers with no poverty experience, only 2%
do not graduate from high school, but this increases more than
five-fold to 11 percent for proficient readers with poverty
experience.
The right-hand panel shows how poor reading skills
combine with poverty. Among children who are not proficient
readers but who do not have poverty experience, 9% do not
graduate from high school. But among children who are not
proficient readers and who do experience poverty, one-in-four,
26%, do not graduate from high school.
SLIDE 14.
Poverty Experience for
All Students and Non-Graduates

15
This slide shows the poverty experience of students who do
and do not graduate from high school.
As measured in our study, 38% of children lived in a poor
family for at least one year. However, because of the high risk
of not graduating from high school among children with poverty
experience, poor children account for a large 70% of all children
how did not graduate from high school. This is very high, but it
is important to note many non-poor children also do not
graduate from high school. Never-poor children still account for
30% of the all children who do not graduate from high school.
SLIDE 15. Percent of Students
Not Graduating by Reading Proficiency
& Race-Ethnicity
This slide shows the proportions not graduating from high
school for reading proficiency groups, separately for Whites,
Blacks, and Hispanics.

16
This far right panel of this graph shows that Black and
Hispanic children who are not reading proficiently are about
twice as likely as similar white children to not graduate from
high school. The difference is 24%-25%, compared to 13% for
Whites.
SLIDE 16.
Race-Ethnicity of
All Students and Non-Graduates
Still, because the majority of children born in the U.S.
during the 1980s were White, a majority of all children who did
not graduate in our study, 56% were Whites, while 30% were
Blacks, and 14% were Hispanic.
SLIDE 17. Percent Not Graduating from
High School across Reading, Poverty,
and Race-Ethnic Groups

17
This slide summarizes some of these results. It shows that
children who are not proficient readers are 4 times more likely
than proficient readers to not graduate from high school, at 16%
vs. 4%. If students are not proficient readers, and they also
experience poverty, they are more than 6 times more likely than
proficient readers to not graduate from high school, at 26% vs.
4%, and if they also are Black or Hispanic, they are about 8
times more likely to not graduate from high school at 31%-33%
vs. 4%.
SLIDE 18. Percent Not Graduating from
High School across Select Reading
and Poverty Groups
At the opposite extreme, only 2% of students who read
proficiently and never live in poverty fail to graduate from high
school, and there is little difference across race-ethnic groups,
with a range of 2%-5% for White, Black, and Hispanic students.
18
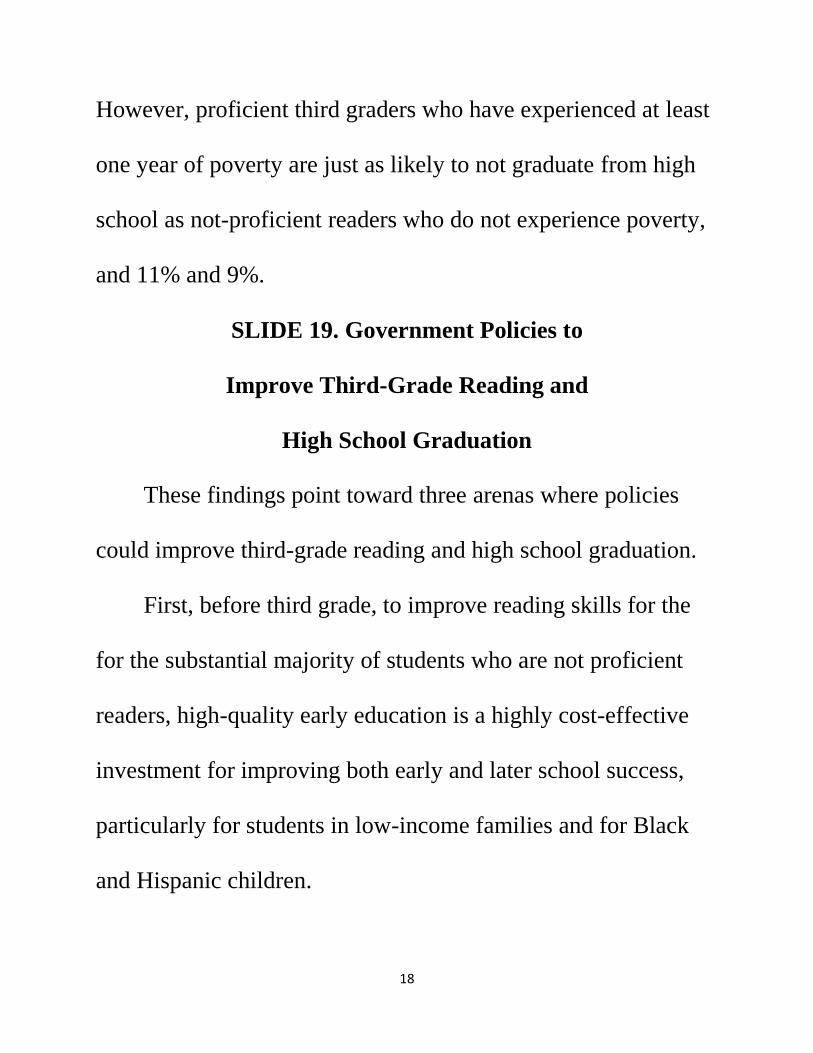
However, proficient third graders who have experienced at least
one year of poverty are just as likely to not graduate from high
school as not-proficient readers who do not experience poverty,
and 11% and 9%.
SLIDE 19. Government Policies to
Improve Third-Grade Reading and
High School Graduation
These findings point toward three arenas where policies
could improve third-grade reading and high school graduation.
First, before third grade, to improve reading skills for the
for the substantial majority of students who are not proficient
readers, high-quality early education is a highly cost-effective
investment for improving both early and later school success,
particularly for students in low-income families and for Black
and Hispanic children.

19
Unfortunately, studies show that the effects of good Pre-
Kindergarten programs can “fade out”. But research also shows
that gains for students are sustained if high-quality Pre-
Kindergarten is linked and aligned with the grades Kindergarten
to 3rd, to create across Pre-Kindergarten through 3rd grade a
common curriculum and standards for social and academic
goals.
The integrated PreK-3rd approach to education, if fully
developed and effectively implemented, involves six
components:
(1) Aligned curriculum, standards, and assessment from
Pre-Kindergarten through third grade,
(2) Consistent instructional approaches and learning
environments,

20
(3) Availability of Pre-Kindergarten for all children ages
3 and 4, as well as full-day kindergarten for older
children,
(4) Classroom teachers who possess at least a bachelor’s
degree and are certified to teach grades PreK-3rd,
(5) Small class sizes, and
(6) A strong partnership between the school and families.
A recent study of an integrated PreK-3rd approach
implemented in Chicago found improved educational outcomes
leading to a long-term societal return of $8.24 for every $1.00
invested in the first 4-6 years of school, including the Pre-
Kindergarten years.
Second, health and developmental problems undermine
student success in school, and need to be addressed with
effective government policies. For example, 10% of people in
families with incomes of $50,000 or more are not covered by

21
health insurance. But this jumps of 19% for those with family
incomes between $25,000 and $50,000 ($49,999), and to 29%,
nearly one-in-three for those with family incomes below
$25,000.
Children in poor families also are more likely than their
peers to have parents with limited education, because lower
education is associated with earning lower incomes. These
finding suggest that policies and programs which would increase
access to health insurance for children and to improved
education for parents, particularly in low-income families, could
play an important role in fostering children’s educational
success.
Thus, third, effective education and work training programs
for parents can help lift families out of poverty. In addition,
two-generation programs that integrate high-quality early

22
education for children with effective work-force development
programs for parents are especially promising.
The Foundation for Child Development, the Annie E.
Casey Foundation, the W.K. Kellogg Foundation, and others are
working to design and implement effective two-generation
policies. For the Foundation for child development, this means
tightly linking strong early education and PreK-3rd schooling
with sector-based workforce development programs.
Sector-based workforce development programs identify
jobs for which there is a demand in local areas, such as the
health sector or the high-technology sector, that allow families
to rise out of poverty and enter the middle class. These
workforce development programs provide the education,
training, and wrap-around services that lead to a career path with
well-paid work.

23
Linking high quality early education with high quality
sector-based workforce development program can lead to
positive synergies for the success of both children and parents.
The links between parent education, family income, and
children’s educational success suggest the potential value in
pursuing this kind of two-generation strategy.
SLIDE 20.
Future Analyses to Provide
Deeper Understanding
Before turning to a focus on children in New Jersey, I
would like to briefly describe the next steps for the research I
have presented here. First, my colleagues and I are studying
how much difference it makes for high school graduation rates,
if children with various third-grade reading skills live in
neighborhoods with high concentrations of poverty. I also have
received funding to systematically assess and identify resources

24
leading to proficient third-grade reading and high school
graduation associated with mother’s education, family income,
access to health insurance, access to Pre-Kindergarten and high
quality schools, and improved neighborhood safety. Finally, I
also am seeking funding to expand the research to study specific
processes that link family, school, and neighborhood resources
to third-grade reading success and to high school graduation.
Now I would like to turn to a focus on children in the state
of New Jersey. This second slide show presents results for
children ages 0-17 in New Jersey based on the U.S. Census
Bureau’s 2005-2007 American Community Survey.
SLIDE 1. Percent with ELL Parents Only & 200% Poverty
In focusing on children in New Jersey, I will highlight 12
groups of children who experience high poverty rates, or who
are likely to live in families where the parents are limited in their
English language fluency, or both. I have already shown the

25
links between limited reading proficiency by third grade, living
in a family with poverty experience, and not graduating from
high school graduation.
But there’s another factor which I was not able to study,
and which is quite likely to be related third-grade reading
success and not graduating from high school, namely growing
up in a family with parents who are not fluent English speakers.
Children in these families confront the additional challenge
associated with not having exposure in the home to strong
English language role models. It is quite clear that young
children who are not exposed to proficient English speakers at
home will require additional language opportunities to become
proficient readers of English by third grade.
It is important, therefore, to identify those groups of
children with parents who are not English fluent. In view of the
ways in which other family and socioeconomic circumstances

26
may influence the acquisition of reading skills, it also is
important to understand the family and socioeconomic
circumstances in which these children live. To address these
issues, I have calculated a range of results for children in New
Jersey.
I am focusing on 12 groups which are comparatively large
and which experience high poverty rates, high rates of parents
not speaking English proficiently or both. I have also calculated
additional results for a much larger set of groups which I can
provide to anyone who is interested, as well as similar results for
children every state, and the U.S. as a whole.
This slide shows the proportion of children who live only
with parents who English Language Learners, that is, parents
who are not fluent English speakers. It also shows the
proportion living in families with incomes below 200% of the
federal poverty threshold.

27
Four of these groups have small proportions with ELL
parents only, but high 200% poverty rates. The first two groups
are Black children in native-born families with parents born only
in the U.S., and Hispanic children in native-born families. No
more than 10% of these children in New Jersey live with ELL
parents only, but 41-46% have family incomes below 200% of
the federal poverty threshold. Taken together, Black and
Hispanic children in native-born families account for one-in-
five, 19% of all children in New Jersey.
Two additional groups fit this pattern, children in
immigrant families from the Middle East and Black children in
immigrant families from Africa. Children in these immigrant
families live with at least one immigrant parent, that is, one
parent who was not born in the U.S. Together with the two
native-born groups, these children account for 21% of all
children in New Jersey.

28
Four additional groups of children have both high
proportions living with ELL parents only and high 200%
poverty rates. These are children in immigrant families from
Mexico, the Dominican Republic Central America, and
Pakistan.
The proportions with ELL parents range from 34% for
Pakistan, to 51-53% for the Dominican Republic and Central
America, to 71% for Mexico. Similarly, the proportions in
families with incomes below 200% of the federal poverty
threshold range from 34% for Pakistan to 43-49% for the
Dominican Republic and Central America, to 69% for Mexico.
The last set of four groups is children in immigrant families
from Vietnam, South America, Korea, and China. These
children experience lower 200% poverty rates, in the range of
12-19%, but they experience substantial proportions with ELL

29
parents only, ranging from 30% for China, to 39-42% for South
America and Korea, to a high of 55% for Vietnam.
Taken together, the 10 immigrant groups in this slide about
for 17% of all children in New Jersey. Combined with the two
native-born groups, these 12 groups of children account for 36%
of all children in New Jersey.
By comparison, White children in native-born families
account for just under one-half, 49% of children in New Jersey.
Thus, taken together the number of children in 12 groups in this
slide is three-fourths as large as the number of White children in
native-born families.
Now I would like to turn to more detailed results for these
groups regarding English language skills, U.S. citizenship,
family composition, parental education, work, and wages, as
well as poverty, homeownership, overcrowded housing, housing
cost-burden.

30
SLIDE 2. Percent of Children Ages 5-17 Potentially
Bilingual, i.e., Speaking English and Another Language
Despite the high proportions with only ELL parents in the
home for many of these groups, about one-half or more of
children in most of these groups are potentially bilingual,
speaking both English and another language at home.
The proportion is only 3% for Whites and Blacks in native-
born families, but this jumps to 45% for Hispanic children in
native-born families and Black children in immigrant families
from Africa, and then to a range of 63% to 75% for most other
groups, and the extremely high level of 83% for children with
origins in Central America, and 89% for children with origins in
Mexico or the Dominican Republic.
Thus, most children are learning English, although these
statistics not indicate the extent to which they are learning the
academic English which is necessary for success in school.

31
SLIDE 3. Percent in Linguistically Isolated Households
Still, substantial proportions live in linguistically isolated
households where no one in the home over age 13 speaks
English exclusively or very well. The proportion is less than 1%
for White children and Black children in immigrant families.
But this rises to 5% for Hispanic children in native-born
families, and 10-13% for children in immigrant families from
the Mideast and Blacks from Africa. The proportion is in the
range of 21-25% for most other groups, but this rises to about
one-third, at 30-36% for children in immigrant families from the
Dominican Republic, Central America, and Vietnam, and to a
very high 53% for children in immigrant families from Mexico.
Children and parents in these families face special
challenges as they seek success in school and work, or access to
health care and other services. Schools and other institutions
that do not provide outreach in the home languages of these
32
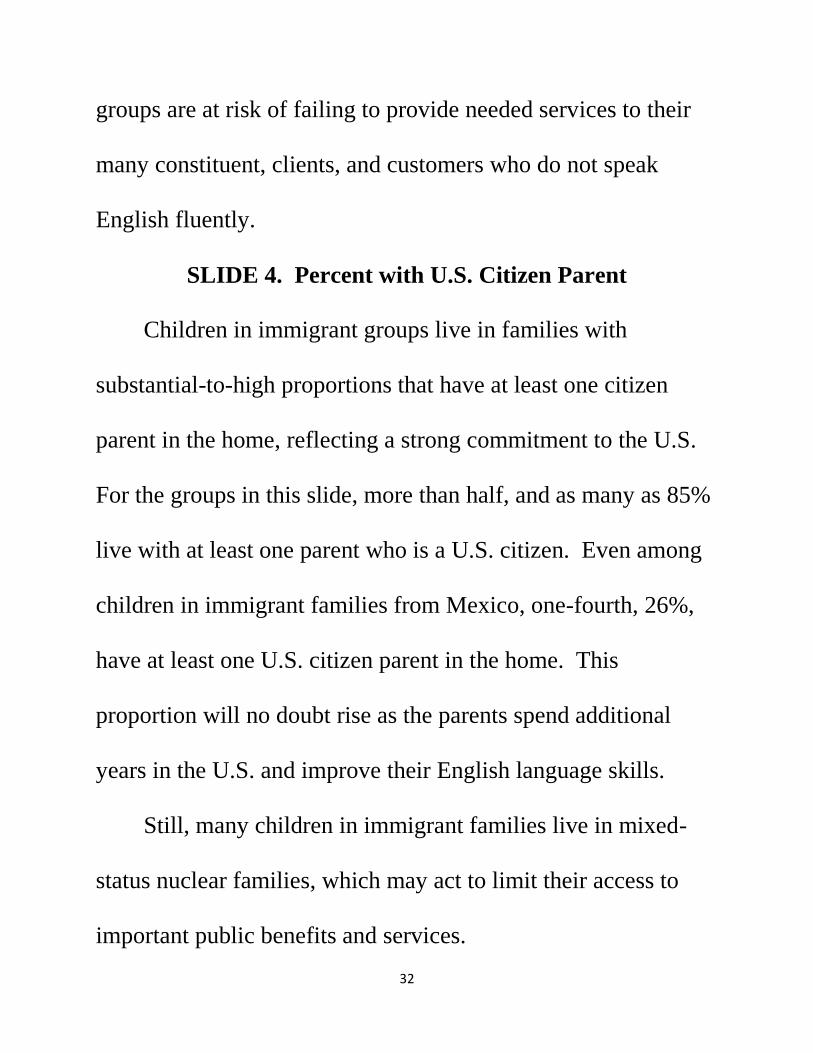
groups are at risk of failing to provide needed services to their
many constituent, clients, and customers who do not speak
English fluently.
SLIDE 4. Percent with U.S. Citizen Parent
Children in immigrant groups live in families with
substantial-to-high proportions that have at least one citizen
parent in the home, reflecting a strong commitment to the U.S.
For the groups in this slide, more than half, and as many as 85%
live with at least one parent who is a U.S. citizen. Even among
children in immigrant families from Mexico, one-fourth, 26%,
have at least one U.S. citizen parent in the home. This
proportion will no doubt rise as the parents spend additional
years in the U.S. and improve their English language skills.
Still, many children in immigrant families live in mixed-
status nuclear families, which may act to limit their access to
important public benefits and services.

33
SLIDE 5. Percent Children U.S. Citizens
The vast majority of children in immigrant families with
origins in this slide are themselves U.S. citizens, mainly because
they were born in the U.S. The proportion is in the range of 86-
95% for most immigrant groups, and is only slightly lower at
80-81% for children with origins in Mexico and Korea.
Most of these children are likely to spend most or all of
their lives in the U.S., learning English, attending schools, and
ultimately entering the paid labor force. These children of
immigrants, as U.S. citizens, share precisely the same rights and
privileges as do those citizen children in native-born families.
All of these children clearly are important to the future of New
Jersey and the nation.
SLIDE 6. Percent Living with Two Parents
Children living with two parents tend, on average, to be
somewhat advantaged in their educational success, compared to

34
children in one-parent families Among White children in
immigrant families in New Jersey, 85% live with two parents.
The proportion living with two parents is within a 5-7
percentage point range, at 80-92% for most groups in this slide.
The proportion is somewhat lower for children in immigrant
families with origins in Mexico or Central America, at 76-78%,
and for Black children in immigrant families from Africa, at
73%. Least likely to have two parents in the home who are
children in native-born families are Hispanics at 53% and
Blacks at 38%.
SLIDE 7. Percent Living with Four or More Siblings
Siblings can play an important role in the lives of children
as companions and during adulthood as sources of social and
economic support. But larger numbers of children must also
share scarce resources in the family home including parental
time and income.

35
Nine percent of White children in native-born families live
in larger families with four or more siblings. This proportion is
somewhat larger for only five groups in this slide, Blacks and
Hispanics in native-born families at 11-12, and children in
immigrant families from the Mideast, Pakistan, and for Blacks
from Africa at 15%-17%.
SLIDE 8. Percent with Grandparent in the Home
Grandparents in the home can provide essential child care,
nurturing, or economic resources. Only 6% of White children in
native-born families have a grandparent in the home, similar to
the proportion of groups in this slide. This dearly doubles to
11% for children in immigrant families from Central and South
America, and it rises to 13-17% for Blacks and Hispanics in
native-born families, and children in immigrant families from
Pakistan, Vietnam, and China.
SLIDE 9. Percent with Mother Not H.S. Graduate

36
It has long been known that children whose parents have
completed fewer years of schooling tend, on average, to
themselves complete fewer years of schooling and to obtain
lower paying jobs when they reach adulthood. Parents whose
education does not extend beyond the elementary level may be
especially limited in the knowledge and experience needed to
help their children succeed in school. Immigrant parents often
have high educational aspirations for their children, but may
know little about the U.S. educational system, particularly if
they have completed only a few years of school.
Only 3 percent of White children in native-born families
have a mother who has not graduated from high schools. The
proportion is no more than 8% for several groups in this slide,
but the remaining groups are 3 to 19 times more likely to have a
mother who has not graduated from high school. The proportion

37
for children in immigrant families from the Middle East and
Pakistan is 10-11%, but this rises to14-19% for Black and
Hispanic children in native-born families and for children in
immigrant families from South America. Still higher, 23-25%
have a mother who has not graduate from high school among
children in immigrant families from the Dominican Republic
Vietnam, and this jumps to 35% for Central American and 57%
for Mexico.
SLIDE 10. Percent with Mother 0-8 Years of School
Parents who have completed only 8 years of school or less
have not entered, let alone completed high school. This low
level of educational attainments for mothers is found among
only 1% or fewer White and Black children in native-born
families. But the proportion with mothers completing no more
than 8 years of school climbs to 5-7% for Hispanics in native-
born families and for children in immigrant families from the

38
Middle East and South America. Higher still, 10-12% have a
mother with no more than 8 years of school among children in
immigrant families from the Dominican Republic and Vietnam,
and high still for 18% for Central America, and 36% for
Mexico.
Parents with little schooling may, as a consequence, be less
comfortable with the education system, less able to help their
children with school work, and less able to effectively engage
teachers and education administrators.
It may be especially important for educators in New Jersey
to focus attention on the needs of children in immigrant families
from Mexico and Central America, the Dominican Republic,
Vietnam, because these children are especially likely to have
parents who have completed only a few years of school.
SLIDE 11. Percent with Father Employed

39
The overwhelming majority of children live in families
with a strong work ethic. Among White children in native-born
families with a father in the home, 97% have a father working in
the paid labor force to support the families. This proportion is in
the narrow range of 89-97% for all the groups in this slide.
SLIDE 12. Percent with Father Employed Full-Time
Many fathers cannot, however, find full-time year-round
work. Even among White children in native-born families,
nearly one-in-eight, 16%, with fathers in the home have a father
who is not working full-time year-round, while 84% do have a
fully employed father in the home.
The proportion also is 79% or more for children in
immigrant families from the Middle East, the Dominican
Republic, and Pakistan, and for Black children in immigrant
families from Africa. This proportion falls to the range of 68-
77% for Black and Hispanic children in native-born families and

40
for children in immigrant families from Mexico, Central
America, South American, and Korea.
Thus, substantial proportions of children in these families
may experience disruptions in father’s employment that could
undermine their concentration and engagement in school.
SLIDE 13. Percent with Mother Employed
Many children also have a mother who is employed. This
proportion is 73% not only for White children in native-born
families, but also for Hispanic children in native-born families,
and children in immigrant families from Vietnam and South
American. Even higher, 77-79% of children in immigrant
families have working mothers if they are from the Dominican
Republic or China, or are Blacks with immigrant parents from
Africa.
Somewhat lower are the proportion with working mothers
from Central America at 68%, and Mexico at 53%, while

41
proportion drops to just under one-half at 46% for the Middle
East, and 37% for Pakistan.
SLIDE 14. Percent with Mother Employed Full-Time
The proportions with mothers employed full-time year-
round are smaller, but still substantial. In the middle of the
range are White children in native-born families and children in
immigrant families from Korea at 32%.
The proportion with mothers working full-time year-round
is substantially higher in the range of 39-54% for Black and
Hispanic children in native-born families, and for children in
immigrant families from the Dominican Republic, Central
America, Vietnams, South America, and China, as well as for
Black children in immigrant Families from Africa.
In the lower range of 18-25% are children in immigrant
families from the Middle East, Mexico, and Pakistan.

42
Overall between about one-in-five and more than one-half
of children in every group in this slide has a mother working
full-time year round, with much higher proportions for fathers,
and still higher proportions if we include parents working part-
time.
These statistics reflect indicate that these children live in
families with a strong work ethic. But they also point to the
difficulties that many parents may have in engaging with
teachers and schools during either regular school hours, or
during evenings when parents with non-standard work shifts
have to be on the job. These results point toward the value and
the need for schools and teachers to be flexible in the times they
are available to parents, to assure that parents have the
opportunity to engage with teachers and schools.
SLIDE 15. Percent with Father < 200% Minimum Wage

43
Although fathers and mothers often work to support their
families, low wages for many parents place a limit on the
income they can earn. Only 5% of White children in native-
born families have fathers who earn less than 200% of the
federal minimum wage. But the proportion it about 2-3 times
greater at 12-17% for Black and Hispanic children in native-
born families, and for children in immigrant families with
origins in Pakistan, Korea, and China. The proportion is about 4
times greater at 19-22% for children in immigrant families from
the Middle East, Central America, and South America, and for
Black children with immigrant parents from Africa, and nearly
10 times higher at 48% for children in immigrant families from
Mexico.
SLIDE 16. Percent with Mother < 200% Minimum Wage
Children with working mothers are even more likely to
have mothers with earnings below 200% of the federal
44
minimum wage. The proportion is 11% for Whites in native-
born families and about 13% for children in immigrant families
from China. But this jumps to 18%-29% for Black and Hispanic
children in native-born families, and children in immigrant
families from the Middle East, Pakistan, Vietnam, and for Black
children with immigrant parents from Africa. Still higher, 41-
45% of children in immigrant families from the Dominican
Republic, and Central and South America have mothers earning
less than twice the federal minimum wage, and this jumps to
69% for children with origins in Mexico.
SLIDE 17. Federal Poverty Rate
Low wages, even for full-time workers, can lead to high
poverty rates. Children from low-income families tend to
experience a variety of negative developmental outcomes,
including less success in school, lower educational attainment,
and earning lower incomes during adulthood.

45
Poverty rates merit considerable attention in part because
extensive research documents that poverty has greater negative
consequences than either limited education among mothers or
living in a one-parent family.
In 2005-2007, the federal poverty rate for White children in
native-born families in New Jersey was 4%, and about the same
for children in immigrant families from China at 5%. Federal
poverty rates were 2-3 times greater at 10-15% for children in
immigrant families from Central and South America, Pakistan,
Vietnam, and Korea, and for Black children with immigrant
parents from Africa. The federal poverty rates were 4-5 times
greater in the range of 19-25% for Black and Hispanic children
in native-born families, and for children in immigrant families
from the Middle East and the Dominican Republic, and this
climbed to 28% for Mexico.
SLIDE 18. Percent below 200% Poverty Threshold

46
The official federal poverty measure is used most often to
assess economic deprivation in the U.S., but more than a 15
years ago a National Research Council report urged that the
official poverty measure be revised, because “…it no longer
provides an accurate picture of the differences in the extent of
economic poverty among population groups or geographic areas
of the country, nor an accurate picture of trends over time”.
Recognizing the limitations of the official approach to
measuring economic deprivation, major public programs for
children increasingly are setting eligibility criteria at higher
levels. This slide also shows results indicating the extent to
which children live below 200% of the federal poverty
threshold. This measure is often used in discussions of public
policy, and I will refer to it as the 200% poverty rate.

47
One-in-ten White children in native-born families in New
Jersey, 11%, lived in poverty in 2005-2007, about the same as
children in immigrant families from China at 12%.
The proportion doubles to about one-in-five, however, for
children in immigrant families from Vietnam and Korea. And, it
triples to about one-in-three for children in immigrant families
from Pakistan and South American. Even higher, the 200%
poverty rate is in the range of 37-46% for Black and Hispanic
children in native-born families, and for children in immigrant
families from the Middle East, Central America, and Black
children with immigrant parents from Africa. Still higher, the
200% poverty rates rises to about one-half of children in
immigrant families from the Dominican Republic, at 49%, and
to two-of-every-three children in immigrant families from
Mexico, at 69%.

48
These levels of economic deprivation can have serious
consequences of the success of children in school, pointing to
the need for the school breakfast and lunch program, and other
policies to reduce economic deprivation among children.
SLIDE 19. Percent in Home Owned by Family
High poverty rates carry through to the housing situation of
children, with lower rates of homeownership and high rates of
overcrowding. Still, many children in the groups included in
this slide live in homes owned by parents or other family
members. These levels of homeownership reflect a strong
commitment by these families to their adopted cities, towns, and
neighborhoods. Children in immigrant families from China are
about as likely as White children in native-born families to live
in family-owned homes, at 88-89%. The proportion is about
40% or more for most other groups in this slide. Even among

49
children in immigrant families from Mexico, one-in-five live in
family owned homes, despite their very high poverty rates.
SLIDE 20. Percent in Home Owned by Family
Families with low wages and below-poverty-line incomes
may double-up with other family members or nonrelatives to
share housing costs and make scarce resources go further,
leading to overcrowded housing conditions.
Overcrowded housing can make it difficult for a child to
find a place to do homework, and it can have negative
consequences for behavioral adjustment and psychological
health. Children are classified in this slide as living in
overcrowded housing if they live in a home with more than one
person per room.
The rate of overcrowding is 3% for White children in
native-born families, and somewhat higher at 5-8% for children
in immigrant families from Vietnam and Korea.

50
This climbs to the range of 11-14% for Black and Hispanic
children in native-born families, and for children in immigrant
families from the Middle East, and to 17%-23% for children in
immigrant families from the Dominican Republic, Pakistan, and
South America, and for Black children with immigrant parents
from Africa.
The highest rates of overcrowding are for children in
immigrant families from Central America at 26% and Mexico at
46%.
SLIDE 21. Percent with Moderate or Severe
Housing Cost Burden
Families that spend a large proportion of their income for
housing have less money available for food, clothing, medicines,
and other necessities. The Census Bureau defines moderate or
severe housing cost burden as a family that spends more than
30% of its income on housing.

51
Nearly two-in-five White children in native-born families
experience these levels of housing cost burden, at 38%. The
proportion is lower for only two groups, children in immigrant
families from Vietnam and China. For the other groups in this
slide the proportions range from about one-half at 53% to about
two-thirds at 69%.
SLIDE 22. Conclusions (1)
In conclusion, the new results which I presented today
show that third-grade reading proficiency is strongly associated
with high school graduation. Children who are not reading
proficiently by third grade are much more likely to not graduate
from high school.
This is especially true for Black and Hispanic children and
for children who experience family poverty. Since reading
proficiency means reading English, children growing up in
families with parents who are limited in their English

52
proficiency also are likely to be at risk of not reading
proficiently by third grade.
SLIDE 23. Conclusions (2)
These findings point toward the need for strong early
education policies that teach reading from an early age, and to
policies that foster English language proficiency among parents,
and improved skills that lead to higher paying jobs for parents.
These policies and program include high-quality PreK-3rd
education with curricula and standards aligned to maximize the
school success of children. They include health insurance and
nutrition programs that will foster the health and development of
children. And they include the Dual-Generation programs
which tightly link high-quality early education for children with
sector-based workforce development programs for their parents.
SLIDE 24. Conclusions (3)

53
I’ve also presented results from the American Community
Survey showing the largest groups of children in New Jersey
who experience high poverty rates, who often have parents who
are English Language Learners, or both.
Children who experience especially high poverty rates, but
lower rates of living with ELL parents only, are Black and
Hispanic children in native-born families, and children in
immigrant families from the Middle East and Black children
with immigrant parents from Africa. Children who experience
high rates of living with ELL parents only, and lower poverty
rates, are children in immigrant families from Vietnam, South
America, Korea, and China. Children who experience both very
high poverty rates and very high proportions living with ELL
parents only are children in immigrant families from Mexico,
the Dominican Republic, Central America, and Pakistan.

54
Taken together, these children account for about for 36% of
all children in New Jersey. These children merit special
attention from educators and policy-makers. The future of New
Jersey depends in no small part on the success these children in
experience in reading proficiency by third-grade, and their
success in graduating from high school.