Embed Size (px)
Citation preview
THE LISBON SCORECARD XThe road to 2020
Simon Tilford and Philip Whyte
CENTRE FOR EUROPEAN REFORM
The Lisbonscorecard XThe road to 2020
Simon Tilford and Philip Whyte
Published by the Centre for European Reform (CER), 14 Great College Street, London, SW1P 3RXTelephone +44 20 7233 1199, Facsimile +44 20 7233 1117, [email protected], www.cer.org.uk© CER MARCH 2010 ★ ISBN 978 1 901229 96 7
The Centre for European Reform is a think-tank devoted to improving the quality of the debate onthe European Union. It is a forum for people with ideas from Britain and across the continent todiscuss the many political, economic and social challenges facing Europe. It seeks to work withsimilar bodies in other European countries, North America and elsewhere in the world.
The CER is pro-European but not uncritical. It regards European integration as largely beneficialbut recognises that in many respects the Union does not work well. The CER therefore aims topromote new ideas for reforming the European Union.
Director: CHARLES GRANT
ADVISORY BOARD
GIULIANO AMATO.............................................................................................. Former Italian Prime Minister
ANTONIO BORGES.................................... Chairman, Hedge Fund Standards Board and former Dean of INSEAD
NICK BUTLER .................................................................. Senior Policy Adviser to Prime Minister Gordon Brown
IAIN CONN ................................... Group Managing Director and Chief Executive, Refining & Marketing, BP p.l.c.
HEATHER GRABBE .................. Director, Open Society Institute–Brussels and Director of EU affairs, Soros Network
LORD HANNAY.................................................................................... Former Ambassador to the UN & the EU
LORD HASKINS .......................................................................................... Former Chairman, Northern Foods
FRANÇOIS HEISBOURG................................................ Senior Adviser, Fondation pour la Recherche Stratégique
WOLFGANG ISCHINGER.................................................................... Global Head, Government Affairs, Allianz
LORD KERR (CHAIR) ................. Chairman, Imperial College London and Deputy Chairman, Royal Dutch Shell plc
CAIO KOCH-WESER................................................................................ Vice Chairman, Deutsche Bank Group
FIORELLA KOSTORIS PADOA SCHIOPPA............................................... Professor, La Sapienza University, Rome
RICHARD LAMBERT........................................................ Director General, The Confederation of British Industry
PASCAL LAMY......................................................... Director General, WTO and Former European Commissioner
DAVID MARSH...................................................... Chairman, Advisory Board, London & Oxford Capital Markets
DOMINIQUE MOÏSI................................................ Senior Adviser, Institut Français des Relations Internationales
JOHN MONKS.............................................................. General Secretary, European Trade Union Confederation
BARONESS NEVILLE-JONES......................................... National Security Adviser to the leader of the opposition
CHRISTINE OCKRENT............................................................................ CEO, Audiovisuel Extérieur de la France
STUART POPHAM............................................................................................. Senior Partner, Clifford Chance
LORD ROBERTSON............................................. Deputy Chairman, TNK-BP and former Secretary General, NATO
ROLAND RUDD......................................................................................... Chairman, Business for New Europe
KORI SCHAKE............................................. Research fellow, Hoover Institution and Bradley Professor, West Point
LORD SIMON ............................ Director, GDF Suez and former Minister for Trade and Competitiveness in Europe
PETER SUTHERLAND........................................................................... Chairman, Goldman Sachs International
LORD TURNER ..................................................................................... Chairman, Financial Services Authority
ANTÓNIO VITORINO...................................................................................... Former European Commissioner
IGOR YURGENS..................................................................... Chairman of the Board, Bank Renaissance Capital
Contents
About the authors
Authors’ acknowledgements
Forewords
1 Introduction 1
2 The Lisbon agenda 13
3 The scorecard
A. Innovation 15
New approaches to measuring innovation 26by Jonathan Kestenbaum
B. Liberalisation 29
C. Enterprise 45
EU R&D policy: Time for some real innovation 49by David Connell
A European industrial policy for the 21st century 63by Peter Marsh
D. Employment and social inclusion 67
E. Sustainable development 85
4 Conclusion 91
The scorecard table 100
ABOUT THE AUTHORS
Simon Tilford is chief economist at the Centre for European Reform.His previous CER publications include: ‘Carbon capture and storage:What the EU needs to do’, February 2010 (with Stephen Tindale);‘Rebalancing the Chinese economy’, November 2009; ‘The Lisbonscorecard IX: How to emerge from the wreckage’, February 2009(with Philip Whyte); ‘The euro at ten: Is its future secure?’, January2009; ‘Is EU competition policy an obstacle to innovation andgrowth?, November 2008; and ‘How to make EU emissions tradinga success’, May 2008.
Philip Whyte is a senior research fellow at the Centre for EuropeanReform. His previous CER publications include: ‘How to restorefinancial stability’, January 2010; ‘Narrowing the Atlantic: The wayforward for EU-US trade and investment’, May 2009; ‘The Lisbonscorecard IX: How to emerge from the wreckage’, February 2009(with Simon Tilford); and ‘State, money and rules: An EU policy forsovereign investments’ (with Katinka Barysch and Simon Tilford),December 2008.
AUTHORS’ ACKNOWLEDGEMENTS
We are grateful to the many officials, experts and business peoplewho have provided us with ideas and insights for this scorecard. Weare also grateful to Charles Grant, Hugo Brady and Clara O’Donnellfor comments on earlier drafts – and to Kate Mullineux for layoutand production. Finally, we would like to thank AstraZeneca,Clifford Chance, KPMG, Tesco and Unilever for sponsoring thisreport. The views expressed in this report do not necessarily reflecttheirs, and we take responsibility for all errors and omissions.
★
Copyright of this publication is held by the Centre for European Reform. You may not copy, reproduce,
republish or circulate in any way the content from this publication except for your own personal and non-
commercial use. Any other use requires the prior written permission of the Centre for European Reform.

Foreword
AstraZeneca is delighted to offer its continued support to the CER and thethorough research it has conducted in updating its annual Lisbon scorecard.
Policy makers must continue to focus on areas which can help secure Europe’slong term prosperity and meet the challenge of global competition. One ofthe most strategically important tasks facing the EU in 2010 will be to replacethe Lisbon agenda with a new programme of reforms (EU 2020). While someprogress was made under Lisbon, it was not sufficient. EU 2020 cannot affordto fail if Europe is to compete in the knowledge economy. The keycomponents of the successor agenda must include research and development(R&D); a sharper focus on raising education and skills; and measures toreward innovation.
The pharmaceutical industry remains a strategically important part of Europe’seconomy, investing more in R&D than any other industry. For this to continuewe must work with the Commission and the member-states to ensure thatinnovation is encouraged and rewarded. A central theme in this effort needsto be the protection of intellectual property rights, without which nopharmaceutical company could invest the considerable sums required todevelop life-saving medicines.
In 2010, the EU will be discussing some important proposals affecting thepharmaceutical industry: measures to combat the counterfeit of medicines,pharmacovigilance, information to patients, the use of animals in research andthe EU patent. It is critical that we make progress in all of these areas.
The CER report is instructive and provides some key lessons which must betaken on board when developing EU 2020. I am confident that with therequired political will, we can boost Europe’s competitiveness.
Ulf Säther
Regional Vice President, Europe

Foreword
It is sadly ironic that a decade which started with such high hopes for Europeshould end with financial crisis and recession – a long way from the ambitionenshrined in the original Lisbon agenda to make Europe “the most dynamicand competitive knowledge-based economy in the world capable ofsustainable economic growth with more and better jobs and greater socialcohesion, and respect for the environment by 2010”.
It is too simplistic to conclude, as some have done, that the process has failed.This annual publication, sponsored from the start by KPMG, has recorded asmany successes as failures.
But it is clear that the reform project is far from complete. And the fact thatprogress has been less than desirable just emphasises the need to redoubleefforts over the coming decade. Where will growth come from? With demandset to remain weak in the short-term as households, businesses andgovernments repair damaged balance sheets and, in the longer-term,populations decline, reform is even more vital.
The Lisbon agenda needs to be succeeded by a more focused programme. Thenew EU 2020 agenda should concentrate particularly on the areas likely tohave the biggest payoffs in promoting productivity – freeing up of labourmarkets and the adoption of new technologies – and be sold to the public noton nebulous concepts such as ‘markets’ and ‘competition’, but as promotingconsumer choice and welfare.
KPMG has been proud to sponsor the CER’s European economic reform‘scorecards’. It is vital that this latest assessment is seen as an end of termreport, not the end of the process.
John Griffith-Jones
Joint Chairman KPMG LLP
Foreword
Once again, we are pleased to sponsor the Lisbon scorecard and continue tosupport the CER’s invaluable work. In its tenth and final year, much will bewritten about the success or failure of the Lisbon agenda. One thing is clear:the policy is a good one and maintaining pressure on EU member-states tocontinue to reform is imperative.
The new European Commission must demonstrate early on that it has theexpertise and drive to continue to push through reforms at a time whenmember-states may be struggling with other challenges. Key to thisprogramme will be the review of the internal market undertaken by ProfessorMario Monti. The internal market is the jewel in the crown of EU policy. In thewords of Commissioner Barnier: “The internal market is our best protection intimes of crisis”. I could not put it better myself. A crucial aspect of the internalmarket is the services sector, which represents a massive three-quarters of EUGDP. The deadline for transposition of the services directive has passed. Ifimplemented properly, this legislation should open up the services market totrue cross-border competition, bringing efficiency gains to a key sector of theEuropean economy. Political momentum must be maintained byCommissioner Barnier and his colleagues.
We commend and support the CER for their continued work to ensure acompetitive Europe.
Stuart Popham
Senior Partner, Clifford Chance LLP

Foreword
Unilever is glad to give its support to this year’s edition of the CER’s Lisbonscorecard. Unilever was one of the earliest examples of a large European cross-border merger. The firm has supported the European integration process eversince, because we see it as essential for Europe’s long-term competitiveness. Thistimely publication has certainly met its target by continuously stressing the needfor change to key policy-makers, the business world and the public at large.
The Economist recently wrote: “Lisbon failed because lots of Europeans do notwant to live in the most dynamic and competitive economy in the world. Theyprefer to work fewer hours than Americans and Japanese (about 10 per centfewer, on average), to take long holidays, and to retire as soon as possible.”
But there is no need to be so pessimistic. Although the implementation of theLisbon strategy clearly fell short of its original objectives, the process did still bringsome positive results as was shown by the various CER Lisbon scorecard reports.
Two things are clear: firstly, the rest of the world will not be standing still, andsecondly, a lethargic Europe will certainly not be able to deliver the resultsEuropean citizens are longing for. Europe will therefore need to re-launch itself.
In the meantime, a wide range of legislative proposals are currently beingdiscussed within the EU that are of crucial importance to our industry sector.
These include proposals for nutrition labelling of foods; the adoption of newauthorisation procedures for novel foods; the overhauling of EU rules oncosmetics; as well as the labelling of chemicals in products. The final results willshow whether the EU will deliver on its ‘better regulation’ promise.
There still a lot to be done and we sincerely hope the CER will continue to play itsextremely useful watchdog role.
Miguel Veiga-Pestana
Vice President, Global External Affairs, Unilever
Foreword
Tesco, a global business based in London with a market capitalisation ofS38.1bn in February 2010, has stores in six EU countries. We are proud of ourrecord as an employer. We created 20,000 new jobs in the EU last year – manywent to young people, and many provided part-time and flexible employmentfor people trying to balance work and family.
The single market has been good for businesses and growth, and good forconsumers and workers alike. It has facilitated vigorous competition in retail,which has delivered to customers enormous benefits: more choice, betterservice, and lower prices. Tesco focuses very hard on the customer; Europeanand domestic regulators need to do the same.
The need for economic growth and the need to protect the environment arenot mutually exclusive. We have to change the way our businesses are run.Tesco has environmental stores across the EU, including one in Rajec, Slovakia,which is partly made of wood, wool and straw. But consumers are part of thesolution too. Tesco halved the price of energy-efficient light bulbs and salesincreased six fold. Millions of consumers making small changes make a bigdifference, and business has an opportunity to help them.
Continued reform is vital if Europe is to improve its competitiveness. If theeconomic and regulatory environment were improved in the EU, there wouldbe more investment, higher growth, and more jobs. The principles of theoriginal Lisbon agenda now need to be reborn in an ambitious and measurable2020 strategy.
Lucy Neville-Rolfe, CMG
Executive Director, Corporate and Legal Affairs, Tesco
1 Introduction
In late 2009, Europe emerged from its deepest recession since the1930s. Despite the damage inflicted to jobs, businesses and publicfinances, there was widespread relief at the end of the year thatthings did not turn out worse. Decisive action by governments andcentral banks mitigated the severity of the downturn. Unemploymentdid not rise as sharply as many forecasters had expected (partlythanks to welcome signs of flexibility on the part of workers andemployers). And fears that Europe and the rest of the world mightlurch into protectionism proved largely unfounded. Actions bygovernments undoubtedly tested the rules of the EU’s single market,and the Commission had to show flexibility in the way competitionpolicy was enforced. But the single market did not unravel.
Having averted the collapse of the global financial system, andweathered a painful recession, it is tempting to look ahead with asense of cautious optimism. But any optimism should be temperedby the scale of the task ahead. After the unprecedented fiscal andmonetary stimulus provided in 2009, policy will have to be‘normalised’. Timing will be crucial: too early, and economies couldtip back into recession; too late, and they could face sovereign debtcrises (like Greece in early 2010). Even if the policy tightening istimed to perfection, a rapid economic rebound seems unlikely.Recoveries from financial crises are always slower than those fromnormal recessions (because of tight credit and high levels of debt).And EU countries will find it hard to export their way out of troublebecause no other major economy is willing or able to replace the USas the world’s consumer of last resort.
The best that the EU can hope for, therefore, is a slow, grindingrecovery. The economic, social and fiscal scars left by the financialcrisis will be with the region for a long time to come. It will take
failures’ (like pollution or financial crises) or in providing publicgoods (such as education and health). All it suggested was thatfeatures of member-states’ economies were impediments toproductivity and employment; and that tackling these obstacles wasa condition for future prosperity and the survival of Europeans’cherished welfare systems.
Luxembourg’s prime minister, Jean-Claude Juncker, famouslyremarked that European leaders know what reforms they need topush through – they just do not know how to win elections oncethey have done so. That being so, a cynic reviewing progresstowards the Lisbon targets might be tempted to conclude thatreforms have been subordinated to political careers. This would notbe entirely fair. Most countries are closer to most of their Lisbontargets now than they were in 2000. Progress has unquestionablybeen made. The share of Europeans completing secondary anduniversity education has increased. There is more competition insectors like energy and telecoms. Both the legal and the effective agesof retirement have risen in many countries. The female employmentrate has surged. Countries have made good progress towards theirenvironmental targets. And so on.
On the whole, however, the level of progress has beenunderwhelming. Few member-states have come close to hitting thetargets they set themselves in 2000, and the gap between the bestand the worst performing countries is arguably wider in 2010 thanit was in 2000. It is impossible to tell how reforms would haveprogressed in the absence of the Lisbon agenda. However, it is hardto shake off the nagging suspicion that most EU member-states’reform paths would not have been very different if Lisbon had neverexisted. Why? Because there has been no more policy convergencewithin the EU than there has been between the EU and the rest of theOECD. The Lisbon agenda may have had a modest influence on thereform process in some of the smaller member-states. But in thelarger ones, reforms have been driven by domestic politicaldynamics, not external pressure.
Introduction 3
many years, rather than just a few quarters, before most EUcountries return to the levels of economic activity that they recordedin 2008. Unemployment may not have risen as sharply as someobservers had feared at the start of 2009, but it will not declinemuch in the near future: labour hoarding by employers during thedownturn, and the weakness of economic growth coming out of it,almost certainly point to a largely jobless recovery. The publicfinances, for their part, have been durably weakened by the crisis –and will be hard to consolidate at a time when the costs of anageing population will be kicking in. In short, most EU countriesface a hard slog, with little prospect of reaching sunlit uplands anytime soon.
Given the scale of the damage inflicted by the financial crisis, it isnot unreasonable to question what remains of the Lisbon agenda –the programme of supply-side reforms that was launched in 2000 inan effort to boost the long-term growth potential of EU economies.Since the agenda was launched, governments have found it easier tosell its promise than its content. The reason is that many Europeanshave long seen it as a poorly-disguised attempt to import ‘Anglo-Saxon neo-liberalism’ through the back door – or, which somethink amounts to the same thing, to dismantle Europe’s cherishedsocial welfare models. Unsurprisingly, these critics have seized onthe financial crisis to argue that it discredits a reform programmewith deregulation and market liberalisation at its core. The crisis,on this view, has rehabilitated the case for active states andregulated markets.
Are the critics right? Certainly, the crisis holds important lessons forthe regulation of markets – particularly financial ones. It is also truethat confidence in world financial markets would have collapsed ifgovernments had not intervened to prop them up. The crisis, inshort, provided a reminder of just how crucial states are to theorderly functioning of markets. But it is hard to see how thisconventional insight invalidates the case for the Lisbon agenda. Thelatter, after all, never questioned the state’s role in correcting ‘market
2 The Lisbon scorecard X
short-list of ‘structural indicators’, which measures member-states’performance in economic, social and environmental categories –such as employment rates, greenhouse gas emissions, research anddevelopment (R&D) spending and so on. These are necessarilylagging indicators – they do not take into account the full impact thecrisis will have on countries’ scores. For example, macroeconomicdata for 2009 were not available at the time of writing. Thescorecard provides an overview of the EU’s record on economicreform. It is not a predictor of short-term economic performance.Instead, it points to the capacity of member-states to flourish in aworld in which high-cost countries cannot sustain their livingstandards unless they excel in knowledge-based industries.
Since we are analysing dozens of policy areas in the 27 member-states, our assessment of national reform efforts is by necessityimpressionistic and partial. Nevertheless, we try to single out thosemember-states that have done the most to live up to their Lisboncommitments, as well as those that have done the least. Thosecountries that already meet many or most of the Lisbon targets areawarded ‘hero’ status, as are those that are catching up at a fastpace. Those that lag seriously behind or have made slow progressare designated as ‘villains’.
Strong performers
The five strongest performers in this year’s scorecard are the threeNordic member-states, Austria and the Netherlands. They scorehighly across indicators of social equity, labour market performanceand environmental sustainability. Crucially, they combinecompetitive markets with comprehensive welfare provision. Noneof these countries, of course, is perfect. Danish productivity growthhas been weak for a number of years, holding back growth in percapita GDP. Sweden has high rates of youth unemployment andlarge numbers of people on long-term sick leave. Austria’s effectiveage of retirement is too low and the country has a relatively poorrecord of reducing greenhouse gases. Finland suffers from
Introduction 5
The costs of inaction are now becoming clearer. It is surely nocoincidence that the members of the eurozone which are currentlyexperiencing the greatest loss of confidence in financial markets arethose which are the furthest from meeting their Lisbon targets andhave done the least to reform their economies. Some countries havetreated the single currency as a shield, forgetting that it is also acorset (which requires countries to have flexible markets for goods,services and labour). In effect, some eurozone members havesquandered the decline in borrowing costs which they enjoyed afterjoining and put off the reforms that were needed to make theirmembership of the euro a success. The result is that they are nowstuck with rigid and externally uncompetitive economies – and nomechanism to adjust, beyond punishing wage cuts which theirsocieties are disinclined to accept.
Since the Lisbon agenda comes to the end of its term in 2010, EUleaders will shortly have to decide whether they should replace it witha successor. They will almost certainly agree that they should. But ifthe successor agenda – already dubbed ‘EU 2020’ – is to have agreater purchase on national reform efforts than the Lisbon agenda,it will need to be given better instruments. Although the underlyingdiagnosis of the Lisbon agenda remains as relevant today as it was in2000, EU 2020 would also benefit from a slight reordering ofpriorities. This report argues, for example, that it is far moreimportant for EU countries’ future prosperity and social cohesion toraise the education and skills levels of their populations than it is forthem to hit arbitrary (and largely misleading) targets on research anddevelopment spending. The conclusion to this report discusses waysin which EU 2020 might be turned in to a more effective reformprogramme than the Lisbon agenda.
The Lisbon league table
The scorecard’s ‘Lisbon league table’ assesses individual EUcountries’ performances relative to their Lisbon targets, comparingtheir standings in 2009 with 2000. The table is based on the EU’s
4 The Lisbon scorecard X
employment rate. The Czech Republic, in particular, also continuesto use energy very inefficiently.
Must do better
Every EU member-state could do better. But Europe’s economicprospects largely depend on the performance of five big countries:France, Germany, Italy, Spain and the UK. Together these fiveaccount for almost three-quarters of EU GDP. Germany is now thestrongest performer among these bigger member-states, ranked 6th,having overtaken the UK, which has slipped to 8th. France has risenone place to 9th. These three countries perform strongly comparedwith the remaining two big economies, Spain and Italy. Spainremains in 19th place, while Italy has slid two places to 24th. Theselast two countries are classed as laggards (see below.)
Germany scores well on measures of innovation and environmentalsustainability. The country also combines a relatively highemployment rate with good productivity. But Germany scores lesswell for social equity. It is one of the few member-states where socialinequalities have risen since 2000, and the share of 25-34 year-oldswith a university degree is low by European standards. However,Germany’s most serious problem is the extreme weakness ofdomestic demand, which was masked in the years running up to thefinancial crisis by very strong growth in exports. Persistent wagerestraint and a very high savings rate have depressed consumption,leaving the economy very unbalanced. Inevitably, Germany was hithard by the downturn, experiencing one of the largest GDPcontractions in the EU in 2009, at around 5 per cent. The country’sexporters are certainly price competitive, but with the globaleconomy – and many of Germany’s European trading partners, inparticular – set to remain very weak for a number of years, Germanywill not be able to rely on exports to drive economic growth. Thechallenge for the country is to stimulate domestic demand in orderto reduce its dependence on exports. The rest of the eurozone alsoneeds Germany to start growing under its own steam. If it fails to do
Introduction 7
unimpressive productivity. Nevertheless, these five economies comeclosest to what the architects of the Lisbon agenda envisaged for thewhole of Europe.
However, if one country stands out as the ‘chief hero’ of theCER’s Lisbon scorecard it is the Netherlands. It is the only EUcountry to combine very high levels of productivity with a highemployment rate. EU countries typically have high productivityand low employment rates (France and Belgium) or highemployment rates and relatively low productivity (Finland andUK). The Netherlands only ranks 4th because of its relatively lowlevel of R&D spending. But this largely reflects the structure of theDutch economy, which is strongly skewed towards services.Moreover, as we argue in this report, R&D spending is in any casea poor proxy for innovation: a high level of R&D is largelyirrelevant if the ideas and technologies generated are notsuccessfully commercialised and do not result in productivitygrowth. The Netherlands does have one vulnerability, however:the weakness of domestic demand. Exports have accounted formuch of the growth in the economy in recent years. In light of thepronounced economic weakness in most of its European tradingpartners – which account for 80 per cent of the country’s exports– the Netherlands will have to take steps to bolster privateconsumption if it is to maintain its strong economic performance.
Two of the new member-states also rank as strong performers: theCzech Republic and Slovenia, which occupy 10th and 11th placesrespectively in the scorecard. Both have posted strong economicgrowth. In 2009 real GDP per capita stood at an estimated 77.4 percent of the EU average in the Czech Republic and 86.1 per cent inSlovenia. In both countries social inequality is low and educationlevels high (in secondary schools, at least), and rising expenditure onR&D suggests that manufacturers are moving up the value-chain.However, the countries are not without their weaknesses. Labourmarkets remain rigid. Both countries suffer from high levels of long-term unemployment, and in the Czech case from a relatively low
6 The Lisbon scorecard X
public spending will be unavoidable if the government wants toprevent a sharp rise in public debt.
Laggards
Four eurozone economies are our villains: Spain, Portugal, Greeceand Italy, which rank 19th, 20th, 22nd and 24th respectively in thescorecard. Some of the new member-states score just as badly, butthey are considerably poorer and have had much less time to takeaction to address their weaknesses. All four Southern Europeaneconomies score poorly across indicators of social equity, labourmarket performance, innovation and environmental sustainability.All have high levels of inequality and generally poor skills levels.Despite low employment rates (Portugal is a partial exception in thisregard), their productivity levels are weak. Crucially, they have madevery slow progress on improving their performance. Spain’semployment rate did rise from 56.3 per cent in 2000 to 64.3 per centin 2008, but much of this was down to an unsustainable constructionboom which has now turned to bust: the country’s rate ofunemployment shot up to almost 20 per cent in 2009. The onlycountries with lower employment rates than Italy are Hungary andMalta. Only Malta has a lower secondary school graduation ratethan Portugal, and Spain performs little better. The four SouthernEuropean laggards have consistently been among the slowest in theEU to liberalise markets for goods and services, and have very poorregulatory environments for business.
The economic downturn has exposed the unsustainability of all fourcountries’ public finances. Greece is the most vulnerable, but it is justthe starkest example of the problems facing economies that have lostcompetitiveness within the eurozone and now have weak publicfinances and poor growth prospects. They must cut budget deficitswhile lowering costs relative to the rest of the eurozone, and this ata time when inflation in economies such as Germany and theNetherlands is very low and investors are jittery about sovereignrisk. Unfortunately, none of the four has taken the necessary steps to
Introduction 9
so the struggling Southern European members of the currency unionwill find it almost impossible to rebalance their economies and puttheir public finances on a sustainable footing.
The UK has the most competitive markets for goods and services inthe EU and one of the most flexible labour markets. It has a strongrecord of reducing greenhouse gases. Even after experiencing one ofthe deepest recessions in the EU in 2009, it will be the secondwealthiest of the bigger EU economies, narrowly behind Germanyand ahead of France. However, the UK has some major weaknesses.The first is that despite the efforts of the current Labour government,it still performs poorly on many social indicators. A major reasonfor the government’s lack of success has been the failure to addresssome of the root causes of poverty in the UK – such as exceptionallyhigh drop-out rates from secondary education. Another majorweakness is the country’s fiscal position, which has deterioratedmarkedly after a decade-long public spending spree. The UK is nowsaddled with a large and unproductive state, weak infrastructure andpersistently high levels of inequality. The outlook for productivitygrowth appears poor. Either the British state must shrinksubstantially, or it must justify the share of economic resources itcommands by doing a better job than it currently does.
France boasts strong labour productivity and a relatively highgraduation rate from secondary school, as well as a good record ofreducing emissions of greenhouse gases. The current government hascut payroll taxes and progressively relaxed the country’s 35-hourworking week introduced in 2000. It has also cut income andcorporate tax rates. But France’s employment rate, at 64.9 per centin 2008, is still well short of the Lisbon target of 70 per cent. Thegovernment has done very little to increase competition in productmarkets, and it remains ambivalent about EU competition rules,which it argues put European companies at a disadvantage. Finally,France’s public finances are very weak. The country has done morethan many other EU countries, notably the UK, to put the financingof public sector pensions on a sustainable footing. But big cuts in
8 The Lisbon scorecard X
11
improve their productivity performance. They must therefore rely oncutting real wages in order to recoup competitiveness within thecurrency union. As a result, there is a serious risk of them stagnatingand sliding into deflation.
Italy provides a graphic warning of what can happen to an economythat habitually postpones economic reforms. The decline in thecountry’s wealth vis-à-vis the rest of the eurozone has beenprecipitous. In 2000, Italy’s real GDP per head at purchasing powerparity (PPP) was higher than France’s and almost as high as inBritain and Germany. By 2009 Italy had fallen behind Spain. Thiswould have been bad enough had the country at least managed toboost its competitiveness compared to the rest of the eurozone.Unfortunately, Italy has experienced the worst of both worlds: veryweak economic growth and a steady increase in its costs vis-à-vis therest of the eurozone. Italy is running a current-account deficit of 3per cent of GDP, despite prolonged economic stagnation (aneconomy growing as weakly as Italy would not normally be runninga current-account deficit). The country must raise its game – it scorespoorly on just about every indicator: only Bulgaria, Romania andMalta do worse.
10 The Lisbon scorecard X
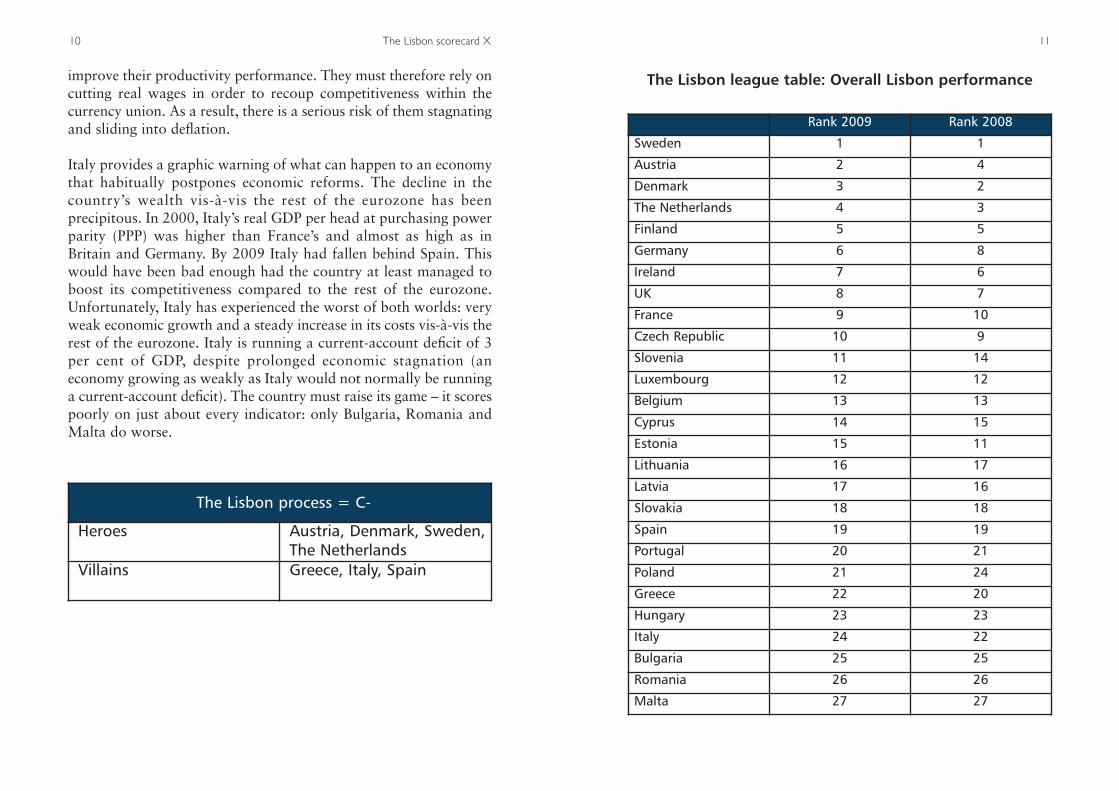
The Lisbon process = C-
Heroes Austria, Denmark, Sweden,The Netherlands
Villains Greece, Italy, Spain
The Lisbon league table: Overall Lisbon performance
Rank 2009 Rank 2008
Sweden 1 1
Austria 2 4
Denmark 3 2
The Netherlands 4 3
Finland 5 5
Germany 6 8
Ireland 7 6
UK 8 7
France 9 10
Czech Republic 10 9
Slovenia 11 14
Luxembourg 12 12
Belgium 13 13
Cyprus 14 15
Estonia 15 11
Lithuania 16 17
Latvia 17 16
Slovakia 18 18
Spain 19 19
Portugal 20 21
Poland 21 24
Greece 22 20
Hungary 23 23
Italy 24 22
Bulgaria 25 25
Romania 26 26
Malta 27 27
2 The Lisbon agenda
The key elements of the Lisbon agenda are set out below. For thepurposes of the scorecard we have grouped the main targets underfive broad headings.
★ Innovation
Europe will not be able to compete in the global economy onthe basis of low-tech products in traditional sectors. Europe’srecord in generating new ideas is good and it possesses a skilledworkforce. But with a few notable exceptions – such aspharmaceuticals and mobile phones – the EU has struggled tocommercialise its inventions for international markets. Japan,the United States and, increasingly, emerging economies such asChina look set to dominate the production of high-techproducts unless the EU improves its performance.
★ Liberalisation
In theory, the EU succeeded in creating a single market for goodsand services in 1992. In practice, many barriers to cross-borderbusiness remain in place. At Lisbon in 2000, the heads ofgovernment agreed to complete the single market in key sectorssuch as telecoms, energy and financial services. The liberalisationof these markets should help to reduce prices, for businesses andconsumers alike, and accelerate the EU’s economic integration.
★ Enterprise
Dynamic new firms are the key to job creation and innovation.But Europe does not reward entrepreneurial success sufficiently,
3 The scorecard
A. Innovation
A1. Information society
★ Increase internet access for households, schools and public services
★ Promote new technologies, such as broadband internet
At the time of the launch of the Lisbon agenda in 2000, the US wasexperiencing rapid productivity growth. After closing gradually forthe best part of 50 years, the gap in productivity between the US andEurope was again widening. One reason for this was strong USinvestment in information and communications technology (ICT),accompanied by the organisational changes needed to make the bestuse of the technology. The EU rightly believed that Europeancountries would need to emulate the application of ICT taking placein the US.
Rates of investment in ICT vary enormously across the EU. Somemember-states – such as Finland, the Netherlands and Sweden –have invested more than the US over the last ten years, whereasothers – such as Germany and the UK – have invested a similaramount. However, investment in ICT in the southern members ofthe EU – Italy, Portugal, Spain and Greece – has remained weak.
The top performing EU countries now have very impressive levels ofinternet use: at the end of 2009 over 75 per cent of households hadaccess to the internet in Denmark, the Netherlands, Sweden, Finland,
while failure is too heavily stigmatised. Europe’s citizens areaverse to taking financial risks, and small businesses often faceobstacles to expansion, such as regulatory red tape. The EU andits governments need to ensure a better business environmentfor small firms. The EU should also ensure that member-statesreduce market-distorting state subsidies and that competitionpolicy promotes a level playing field.
★ Employment and social inclusion
The Lisbon agenda spelt out the vital role that employmentplays in reducing poverty, as well as in ensuring the long-termsustainability of public finances. The EU and its governmentsneed to give people incentives to take up jobs, and to trainthem with the skills necessary to compete in fast-changinglabour markets. EU member-states must also tackle theproblem of ageing populations by reducing the burden ofpensions on state finances, while ensuring that pensioners arenot pushed into poverty.
★ Sustainable development and the environment
The EU added the objective of sustainable development to theLisbon agenda during the Swedish presidency of 2001. The EUis aiming to reconcile its aspirations for higher economicgrowth with the need to fulfil its international environmentalcommitments such as the Kyoto greenhouse gas targets.
14 The Lisbon scorecard X
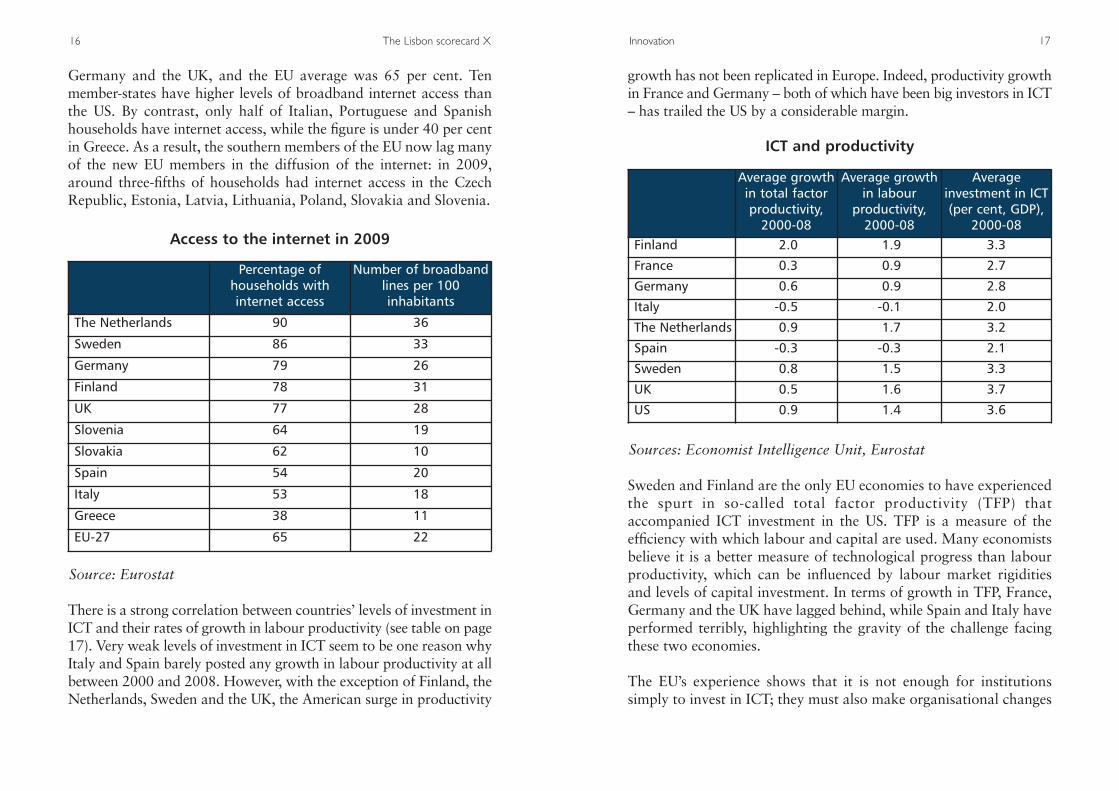
growth has not been replicated in Europe. Indeed, productivity growthin France and Germany – both of which have been big investors in ICT– has trailed the US by a considerable margin.
Sweden and Finland are the only EU economies to have experiencedthe spurt in so-called total factor productivity (TFP) thataccompanied ICT investment in the US. TFP is a measure of theefficiency with which labour and capital are used. Many economistsbelieve it is a better measure of technological progress than labourproductivity, which can be influenced by labour market rigiditiesand levels of capital investment. In terms of growth in TFP, France,Germany and the UK have lagged behind, while Spain and Italy haveperformed terribly, highlighting the gravity of the challenge facingthese two economies.
The EU’s experience shows that it is not enough for institutionssimply to invest in ICT; they must also make organisational changes
Innovation 17
Germany and the UK, and the EU average was 65 per cent. Tenmember-states have higher levels of broadband internet access thanthe US. By contrast, only half of Italian, Portuguese and Spanishhouseholds have internet access, while the figure is under 40 per centin Greece. As a result, the southern members of the EU now lag manyof the new EU members in the diffusion of the internet: in 2009,around three-fifths of households had internet access in the CzechRepublic, Estonia, Latvia, Lithuania, Poland, Slovakia and Slovenia.
There is a strong correlation between countries’ levels of investment inICT and their rates of growth in labour productivity (see table on page17). Very weak levels of investment in ICT seem to be one reason whyItaly and Spain barely posted any growth in labour productivity at allbetween 2000 and 2008. However, with the exception of Finland, theNetherlands, Sweden and the UK, the American surge in productivity
16 The Lisbon scorecard X
Source: Eurostat
Access to the internet in 2009
Percentage of households with internet access
Number of broadbandlines per 100 inhabitants
The Netherlands 90 36
Sweden 86 33
Germany 79 26
Finland 78 31
UK 77 28
Slovenia 64 19
Slovakia 62 10
Spain 54 20
Italy 53 18
Greece 38 11
EU-27 65 22
ICT and productivity
Sources: Economist Intelligence Unit, Eurostat
Average growthin total factor productivity,2000-08
Average growthin labour
productivity,2000-08
Average investment in ICT (per cent, GDP),
2000-08Finland 2.0 1.9 3.3
France 0.3 0.9 2.7
Germany 0.6 0.9 2.8
Italy -0.5 -0.1 2.0
The Netherlands 0.9 1.7 3.2
Spain -0.3 -0.3 2.1
Sweden 0.8 1.5 3.3
UK 0.5 1.6 3.7
US 0.9 1.4 3.6
convince sceptical electorates of the need for furtherliberalisation, at both national and EU level.
4. Inefficient public sectors. Public sector productivity has laggedthat of the private sector by a substantial margin in most, if notall, member-states since 2000. Indeed, in some – Italy and theUK, for example – productivity in the public sector has actuallyfallen over this period. The pace of organisational change acrossstate sectors needs to accelerate if they are to make better use ofnew technologies and boost productivity. If they fail to do so,big cuts in spending on public services will be inevitable in manymember-states.
Innovation 19
if they are to realise the full benefits of new technology. Institutionsin Finland, Sweden and the Netherlands appear to have been able todo this, while those in other EU economies have struggled to do soand are therefore failing to replicate the productivity performanceachieved by American counterparts. There are a number of reasonswhy European businesses are taking too long to restructure. Butaction is clearly needed in four areas:
1. Skills: Many member-states lack workers with the necessaryskills to make the most of new technology. Although mostcountries have made progress in increasing the proportion oftheir workforces with tertiary education, drop-out rates fromsecondary education remain high in many member-states (seesection D2).
2. Labour market regulation: In many member-states excessivelabour market regulation makes it very costly to lay-off orredeploy staff. This, in turn, makes it hard for firms to profitfully from investment in ICT, and slows the diffusion of newtechnology. The financial crisis has damaged the case for liberaleconomic reforms in the eyes of many Europeans, throwinginto doubt the gradual liberalisation of labour markets that hasbeen underway in most member-states. This is unfortunate,because the further weakening of Europe’s economic growthprospects requires more, not less, labour market flexibility.
3. Single market: The fragmentation of the EU’s single market andthe lack of competition within and between the member-statesboth reduce incentives for companies to make the most efficientuse of ICT. By contrast, companies in the US operate in a big,seamless market with much lower levels of protection. The EUhas made progress in opening up some previously protectedservice sectors to competition, leading to dramatically higherproductivity in the telecoms and airline sectors. But these are theexceptions to the rule. Most European service markets are a longway from being integrated (see section B). Governments need to
18 The Lisbon scorecard X
Information society = B
Heroes Finland, The Netherlands,Sweden
Villains Greece, Italy, Spain
A2. Research and development
★ Agreement on a European Union patent
★ EU annual R&D spending to reach 3 per cent of GDP by 2010
Innovation rightly sits at the heart of debates over economic growth.In the developed economies sustained economic growth is dependenton productivity growth, which in turn requires innovation of onesort or another. The need to raise the innovative capacity of EUeconomies is now even more pressing than it was in 2000. Withoutimproved productivity, EU governments will struggle to cope withthe impact of population ageing on public finances, and livingstandards will stagnate or even start to fall. However, measuringinvestment in innovation is far from straightforward. In 2000, theEU adopted the traditional measures – spending on research anddevelopment (R&D) as a proportion of GDP, and the number ofpatents filed. But a much broader measure of investment ininnovation is needed; high technology alone will not delivereconomic growth.
In 2000 the EU set an R&D target of 3 per cent of GDP by 2010.This target will be missed by a huge margin: in 2008, public andprivate spending on R&D accounted for 1.9 per cent of EU GDP,unchanged from 2000. Europe continues to perform poorly relativeto the US and Japan, where the shares were 2.6 per cent and 3.1 percent respectively. Just two member-states – Finland and Sweden –meet the 3 per cent target. And 21 of the 27 EU member-statesdevoted less than 2 per cent of GDP to R&D in 2008. Nor has theperformance of the laggards such as Spain and Italy improved. Theycontinue to devote just 1.2 per cent of their GDP to R&D and havebeen overtaken by a number of new member-states, including theCzech Republic, Slovenia and Estonia.
Meanwhile, progress towards a European patent has been glacial.Firms or individuals still have to file a patent in each member-statewhere protection is required. For a patent to be effective across the
manufacturing companies of the last decade, but not because it hasdeveloped cutting-edge new technologies; the firm’s R&D spendinghas been limited. Rather, it has used existing technology in innovativenew ways. America’s General Motors entered bankruptcy in 2009,despite having spent more on R&D than any other company in theworld over the preceding ten years. New ideas or inventions meanlittle if they are not successfully commercialised.
Conventional measures of innovation are an even less reliableindicator of innovation in service sectors than in manufacturingindustries. This is a major drawback because service sectors accountfor two-thirds of economic activity in the EU, and it is in this sectorthat the gap between EU and US productivity growth is the greatest.Practically none of the spending on innovation by service sectorcompanies is captured by figures for R&D or the number of patentsfiled. For example, airlines such as Easyjet or Ryanair haverevolutionised air travel in Europe, forcing down costs and boostingproductivity by introducing new business models. But neither firm is‘innovative’ in the traditional sense of the word.
Innovation 23
whole EU it also needs to be translated into each of the EU’s 23official languages. The fragmentation of the patent system imposessignificant costs on business: an EU-wide patent costs aroundS70,000, compared with S20,000 in the US. In December 2009, EUindustry ministers finally agreed to create a Europe-wide patent aswell as a centralised court that would deal with patent-relateddisputes. This will be a big step forward. However, nationalgovernments have yet to resolve the thorny issue of language. Ideally,the EU patent would be in the language of the filer’s country oforigin and English, the closest Europe has to a lingua franca.
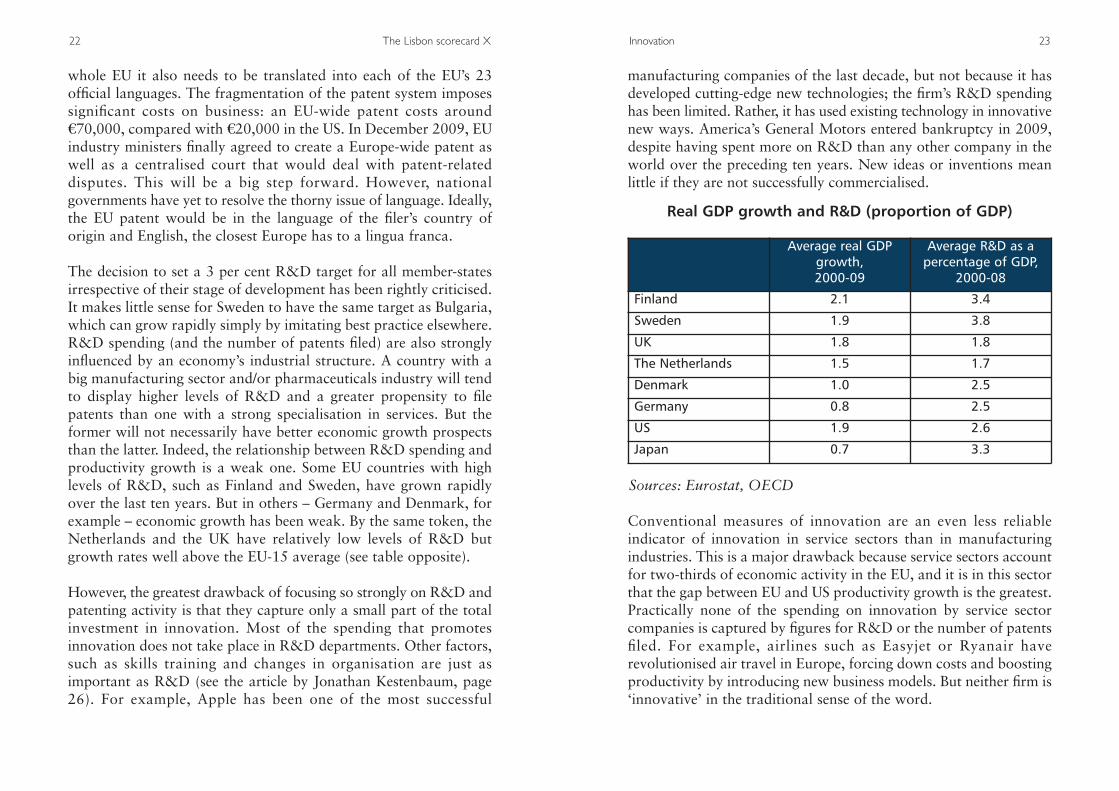
The decision to set a 3 per cent R&D target for all member-statesirrespective of their stage of development has been rightly criticised.It makes little sense for Sweden to have the same target as Bulgaria,which can grow rapidly simply by imitating best practice elsewhere.R&D spending (and the number of patents filed) are also stronglyinfluenced by an economy’s industrial structure. A country with abig manufacturing sector and/or pharmaceuticals industry will tendto display higher levels of R&D and a greater propensity to filepatents than one with a strong specialisation in services. But theformer will not necessarily have better economic growth prospectsthan the latter. Indeed, the relationship between R&D spending andproductivity growth is a weak one. Some EU countries with highlevels of R&D, such as Finland and Sweden, have grown rapidlyover the last ten years. But in others – Germany and Denmark, forexample – economic growth has been weak. By the same token, theNetherlands and the UK have relatively low levels of R&D butgrowth rates well above the EU-15 average (see table opposite).
However, the greatest drawback of focusing so strongly on R&D andpatenting activity is that they capture only a small part of the totalinvestment in innovation. Most of the spending that promotesinnovation does not take place in R&D departments. Other factors,such as skills training and changes in organisation are just asimportant as R&D (see the article by Jonathan Kestenbaum, page26). For example, Apple has been one of the most successful
22 The Lisbon scorecard X
Sources: Eurostat, OECD
Average real GDPgrowth,2000-09
Average R&D as a percentage of GDP,
2000-08
Finland 2.1 3.4
Sweden 1.9 3.8
UK 1.8 1.8
The Netherlands 1.5 1.7
Denmark 1.0 2.5
Germany 0.8 2.5
US 1.9 2.6
Japan 0.7 3.3
Real GDP growth and R&D (proportion of GDP)
poor employment rates, such as Italy and Spain, would faceambitious targets for both.
Innovation 25
There is no doubt that innovation indicators are needed to assessprogress and performance. But a meaningful input measure ofinnovation would need to be much broader than spending onR&D or patents. It would need to comprise investment inknowledge as a whole – not just scientific research, but thespending needed to commercialise new ideas and profit from them.An index of innovation such as the one under development by theUK’s National Endowment for Science, Technology and the Arts(NESTA) will be invaluable for those countries that can collect thenecessary data. Unfortunately, that is likely to be the case in onlya minority of the EU’s member-states.
The EU should consider adopting an output measure – the rate ofproductivity growth – as its 2020 innovation target. The rate ofproductivity growth gives a good indication of innovation bycapturing the impact of spending on R&D but also of investment incrucial factors such as skills and organisational change. It providesa good measure of the sustainability of economic growth andprovides a better basis for addressing one of the biggest problemsfacing the EU economy: weak public sector productivity.
Rates of productivity growth vary, of course, with levels ofeconomic development: poor countries will have stronger rates ofproductivity growth than mature ones. Labour regulations alsoinfluence labour productivity. Rigid employment laws mean thatcompanies operating in France and Belgium have a strong incentiveto employ capital over labour, even where this is inefficient. As aresult, targets for productivity growth would have to vary acrosscountries. Poor member-states would be expected to deliver fasterproductivity growth than wealthier ones. Countries whereproductivity is high and levels of employment low – France andBelgium – would have to meet tough targets for employment rates,but less onerous ones for productivity growth. And countries withhigh employment rates and relatively low productivity, such as theNordic member-states and the UK, would be given toughproductivity targets. Those with low levels of productivity and
24 The Lisbon scorecard X
Research and development = D
Heroes Finland, The Netherlands,Sweden
Villains Greece, Italy, Spain
2726
New approaches to measuringinnovation
The Lisbon agenda put innovation at the heart of the EU’s economic future.In particular, its ambitious target of increasing EU R&D spending to 3 percent of GDP galvanised policy-makers across the continent and spurred aplethora of valuable initiatives. In the wake of the global financial crisis, theagenda looks even more far-sighted: to thrive in the uncertain economy ofthe coming decade, amid increasing competitive pressures from theemerging economies of Asia and beyond, innovation will be vital.
I hope I will be forgiven, then, for a piece of iconoclasm. For although theLisbon agenda is more current than ever, its central target is not. It is timeto scrap the R&D target as our barometer for our innovative performance.
There are two reasons why the time is right to do this. Firstly, it isincreasingly clear that R&D is a poor measure for how much Europe investsin innovation. Secondly, and crucially, we are now able to do better, thanksin part to work done by NESTA and its international research partners.
Let us first consider the case for a new measure. R&D spending is a usefulindicator of innovative activity as far as it goes. In some sectors, such aspharmaceuticals, it is a reasonable proxy for innovation. But more often, itreflects a mid-20th century, manufacturing-based paradigm that increasinglyfails to represent how the economy works. The largest EU economies arenow dominated by services (they make up 78 per cent of the UK’s economicoutput, for example), and innovating to increase their productivity is anoverwhelmingly important factor in our economic performance.
The work of successive expert groups has confirmed this, and surveys likethe Community Innovation Survey increasingly seek to reflect it. Knowledge-intensive businesses depend on a whole range of intangible investments toinnovate. These include not only R&D, but also design, organisationalinnovation, the development of new skills, and the development of new
creative content. Particularly for service businesses, these other, ‘hidden’forms of innovation are vitally important. We have seen that in UK firms,R&D represents only 11 per cent of overall intangible investment.
This is where NESTA’s Innovation Index comes in. Working with leadinginnovation researchers and economists, and an international advisory andexpert group, we have assembled a pilot version of a wider measure ofinnovation. The Innovation Index considers the whole range of intangibleinvestments in innovation, from design to copyright, and then measurestheir effects on the UK’s productivity. The findings offer strong support forthe overall goals of the Lisbon agenda: two-thirds of the UK’s private sectorproductivity growth over the past decade can be attributed to innovation.
The Index also offers a new basis for comparison: by including more thansimply R&D in its definition of the inputs to innovation, it includes manyof the investments made by service industries and a wider range of inputsby manufacturers.
Our industries increasingly depend on the ability to combine different typesof innovation investment – for example, R&D, customer research andproduct design to launch a new consumer electronics product, or servicedesign, organisational development and training to launch a new retailbanking service. So the time is ripe for a new measure of innovation. Wewould argue for the measurement not of just R&D as a percentage of GDP,but of all intangible investments. More statistical work needs to be done forthis to become a mainstream measure. We are refining our approach overthe next six months, and other organisations, including the OECD and theUS Department of Commerce, are considering their own versions.
But the direction of travel is clear. Only a wider measure of innovation canprovide the insight we need to keep innovation at the heart of EU economicpolicy. After all, as a wise man once said: what gets measured gets done.
Jonathan Kestenbaum
Chief Executive, National Endowment of Science, Technology and the Arts(NESTA). To find out more about The Innovation Index go towww.nesta.org.uk.
B. Liberalisation
B1. Telecoms and utilities
★ Increase competition in telecoms markets
★ Liberalise gas and electricity markets and improve supplysecurity
Increased competition between telecoms and utilities providers tendsto push down prices and improve services for households andenterprises. The liberalisation of EU telecoms markets has been oneof the great success stories of the past decade, with the prices oftelecoms services falling dramatically in real terms across the EU asa result of increased competition. However, the EU is still a long wayfrom having a single market for such services. Incumbents stilldominate telecoms in many member-states. The big differences in theway telecoms sectors are regulated across the EU create substantialbarriers to competition. This is especially so in the area of marketsfor broadband internet access.
Former state monopolies continue to handle around 70 per cent ofall local calls (including connections to the internet through a phoneline). In many of the new member-states (Hungary, Latvia,Lithuania, Slovakia and Slovenia) there is still little competition.France Telecom and Spain’s Telefonica control around 80 per cent oflocal calls, while in the case of former monopolies in Germany andthe UK the proportion is less than 60 per cent. There is morecompetition among providers of long distance national calls, andmore still in international calls, but the ranking of laggards andleaders is roughly the same. In mobile telephony, on the other hand,the incumbents’ share of the market is under 40 per cent on average,and as little as a quarter in Denmark and the UK.
Market dominance tends to result in higher prices: in 2008 Slovakspaid almost three times as much for local calls as Swedish customers.
network was illegal. Germany had ignored repeated warnings by theCommission that the 2006 law ran counter to EU competition law.This legal precedent, combined with November’s decision to rule out‘regulatory holidays’, leaves the way open for legal action against arange of countries that accord preferential treatment to theirdominant telecoms supplier.
Energy
The liberalisation of European energy markets started later and hasnot gone as far as in telecoms. Since July 2004 industrial users havehad the right to choose between alternative suppliers of gas andelectricity. However, former monopolies (many often still with stateinvolvement) continue to play a dominant role in many member-states. This is inevitable in tiny Malta or isolated Finland. But inothers, such as France, a reluctance to open markets to competition,or to allow foreign energy firms to acquire French ones, appears tobe the main reason.
The problem is that in many member-states, the company thatproduces or imports energy also controls the infrastructure fordistributing it (national electricity grids or gas pipelines). Wherethis is the case, newcomers struggle to break into the market. Franceis an extreme example, for both gas and electricity. Gaz de France(GDF) and Total account for 95 per cent of French gas imports andcontrol the country’s pipeline network, with the result thatcustomers enjoy very little choice. Meanwhile, Electricité de France(EDF) accounts for 87 per cent of power production, owns thetransmission network and directly supplies 95 per cent of thecustomers. The UK, by contrast, liberalised its energy markets in the1980s, and now has a multitude of players, ranging from the formerstate-owned monopolies to foreign firms (including GDF and EDF).
The situation is little better when it comes to the retail sector. SinceJuly 2007, all EU consumers have theoretically had the freedom toswitch suppliers, but in practice this has meant little. Only 7 per cent
Liberalisation 31
Slovaks also paid well over the odds for national calls, at S1.61 fora ten minute call in 2008, compared to just 28 cents in Sweden. Theprices of international calls – where competition is much strongerthan in local or national telephone – also continue to varyconsiderably. But the correlation between liberalisation and lowprices does not hold in all cases. For example, despite their countries’liberalised telecoms markets, Finns and Britons pay more than theEU average for a ten minute international call – at S2.29 in the UKand a whopping S4.78 in Finland in 2008. By contrast, Germanconsumers paid just 29 cents for a similar call.
In November 2007, the Commission put forward a package ofreforms aimed at creating a genuine single market for telecomsservices. But the two most important elements of the package – theproposal to split the management of telecoms networks from theprovision of call and internet services (‘functional unbundling’), andthe establishment of a European telecoms regulator with powersover national telecoms regulators – failed to win the support ofnational governments. Instead of a pan-European regulator theyagreed to set up a new advisory body called the Body of EuropeanRegulators in Telecommunications (BERT), whose powers will belimited to making recommendations. Similarly, there will be noforced unbundling. However, it will remain illegal for nationalregulators to give incumbents ‘regulatory holidays’ in order toencourage them to invest in expensive new technology, such as fibre-optic networks. Operators that want to use new fibre-optic lines willhave to pay a premium to the incumbents in order to compensatethem for the risk they have taken on in building the new networks.This should provide the owners of the networks with sufficientincentives to make the necessary investments in new technology,while ensuring that they face competition.
The Commission should now focus on using competition policy toprevent market abuse. In December 2009, the European Court ofJustice (ECJ) ruled that a German law allowing Deutsche Telekomto deny possible competitors access to its high-speed broadband
30 The Lisbon scorecard X
could have totalled S7 billion. In July 2009, E.ON and Gaz de Francewere each fined S553 million for collusion (in a deal which ran until2005, they had agreed that they would not compete on each other’snational territory). This was the first time the Commission had finedenergy companies for breaching anti-trust rules.
Liberalisation 33
of households switched gas supplier in 2007, and 8 per cent theirelectricity supplier – despite the fact that a high proportion of thosewho did reported lower prices as a result. These relatively low levelsof switching reflect the fact that it remains difficult to move betweensuppliers. But it also reflects inertia: the experience of countrieswhich liberalised retail markets long before the 2007 deadline – theNetherlands, Sweden and the UK – shows that it takes quite a whilefor customers to grow accustomed to switching suppliers.
The Commission has been pursuing a twin-track strategy to open upenergy markets. The main approach has been legislation. Thelegislative battle to force large integrated energy groups to‘unbundle’ their distribution networks was decided in 2009: theEU’s ‘third package’ of energy laws allowed gas and powercompanies to keep their networks provided they run them asseparate entities. A minority of governments – led by France andGermany – had fiercely opposed unbundling, arguing that only bigvertically integrated groups had the necessary financial resources toinvest in new capacity. Further progress on the creation of anintegrated market will now depend on how the new rules areimplemented by EU governments, and whether companies finallybuild the interconnectors needed for a pan-European power and gasmarket. But it will also depend on whether the new Commissiondecides to pursue liberalisation through the use of competition rules.
Indeed, action by the EU’s competition authorities will probably domore to shape the future of the EU energy market than the politicalcompromise reached in the ‘third package’. Competition policy hasbecome the principal driver of energy market liberalisation. In 2008,the largest German energy group, E.ON, announced that it wouldsell its power grid, while RWE, another big German power firm,decided to spin-off its gas distribution infrastructure. Both firmsmade this decision after the Commission had found that they hadused their control of networks to prevent rivals from entering theregional markets they dominate. The firms agreed to unbundle inexchange for not having to pay fines, which in the case of E.ON
32 The Lisbon scorecard X
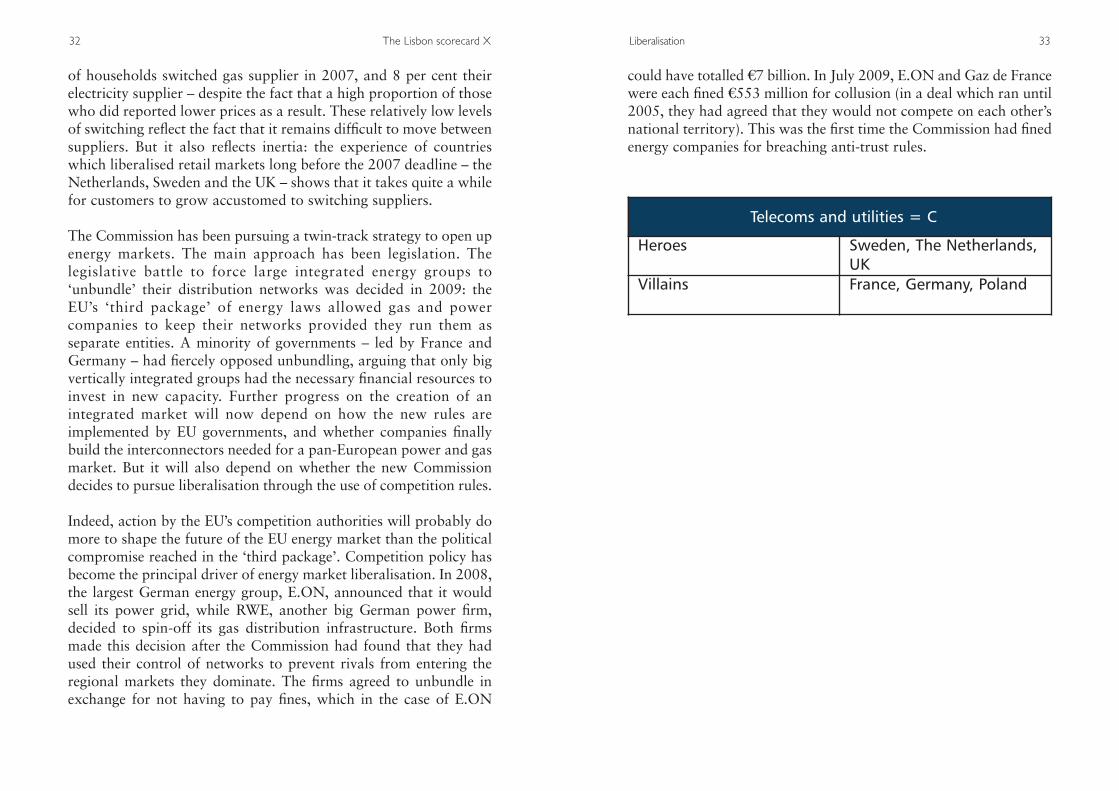
Telecoms and utilities = C
Heroes Sweden, The Netherlands,UK
Villains France, Germany, Poland
B2. Transport
★ Increase competition in transport services
★ Encourage investment in trans-European networks
★ Make the transport sector more environmentally sustainable
The transport sector accounts for 7 per cent of EU GDP and 5 percent of total employment. But its importance to the Europeaneconomy goes well beyond its direct contribution to growth andemployment. Because of the central role that it plays in labourmobility and the distribution of goods and services, a modern,integrated and reliable transport system has an importantinfluence on productivity. However, transport also generatesexternalities – costs such as pollution that are imposed oneveryone, whether they travel or not. One reason why EUcountries have struggled to contain the growth in their greenhousegas emissions is that economic expansion generates increaseddemand for transport services.
So EU transport policy has focused on meeting two objectives thathave proved hard to reconcile. The first has been to improve theefficiency with which people and freight move around the EU.This has involved liberalising the provision of services within eachtransport mode (air, road, rail and water), and improvinginfrastructure by developing transport links between countries(known as ‘trans-European networks’ or TENs). The EU’s secondaim has been to improve the environmental sustainability of thetransport sector. EU countries have made greater progress on thefirst objective than the second. There is more competition thanthere was in 2000 (even if there are still large variations acrosscountries). But the EU has struggled to make the sector moreenvironmentally friendly. Greenhouse gas emissions have risenfaster in the transport sector than in any other sector of theEuropean economy.
the 30 ‘priority axes’ that have been identified has been slow.Though it has been hampered by procedural and technical problems,the main obstacle has been financial. The problem is three-fold: thecost of completing the EU’s 30 priority axes is huge (an estimatedS250 billion); EU funding for TENs is miniscule (just S5.1 billionbetween 2007 and 2013); and it has proved difficult to mobilisenational sources of funding for cross-border projects which arecomplex and financially risky.
Making transport more environmentally sustainable
Perhaps the greatest disappointment has been the failure of EUcountries to set the transport sector on a more environmentallysustainable footing. Transport is the only sector of the Europeaneconomy in which greenhouse gas emissions have increased over thepast decade. Transport now accounts for almost a quarter of allgreenhouse gas emissions in the EU-27. Although the sector hasbecome more energy efficient, the improvement has not been enoughto offset the rise in transport volumes (particularly of freight).Changes in transport patterns have not helped either. Transportvolumes have grown fastest in the most polluting sorts of transport(air and road), while the share accounted for by the least pollutingmethod (rail) has declined since 2000. In the absence of changes topolicy, these trends will persist – and prevent the EU from meetingits emissions targets.
On current trends, emissions from transport alone will exceed theEU’s target for all sectors in 2050. So the EU will have to startmaking big absolute cuts in transport sector emissions. Much hopeis being pinned on technological innovation to improve energyefficiency and, in the longer term, to reduce reliance on fossil fuels.But innovation on its own will not reverse the trend of risingemissions over the coming decade, not least because the growth ofroad traffic is likely to outstrip gains in energy efficiency. Otherpolicies will therefore be needed if emissions from the transportsector are to be contained. A key objective should be to limit, and if
Liberalisation 37
Improving the efficiency of the transport sector
There is unquestionably more competition within the transportsector than there was a decade ago. The poster child ofliberalisation has, of course, been the air transport sector, whereincreased competition has brought about dramatic falls in pricesand huge rises in passenger volumes and choice. Progress has beenrecorded in other sectors too. Since 2001, the EU has adopted threelegislative ‘packages’ aimed at opening railways to greatercompetition. Rail freight was liberalised in 2007, domestic andinternational rail passenger services in 2010. However, the actualdegree of competition which currently prevails in rail transportremains much lower than it is in the air transport sector. Severalyears after EU legislation was adopted and was supposed to haveentered into force, a variety of national institutional impedimentscontinue to prevent new entrants from breaking in to formerlymonopolistic markets.
In member-states such as Germany, Sweden and the UK, competitionin freight and passenger rail services is already well advanced. Butmany countries have not yet fully implemented key provisions in thedirectives, and the Commission has had to send infringement lettersto most of them. The most common faults have been the failure toseparate adequately the management of the infrastructure from thetrain operators; the setting of discriminatory access charges; and thefailure to set up independent regulatory authorities with thenecessary powers to enforce competition. The upshot is that in manycountries the institutional arrangements continue to favour theincumbents. Some of the worst culprits have been the CzechRepublic, Greece, Romania and Slovenia.
Improving transport connections between countries has also beendifficult. Although many EU countries boast some of the finesttransport infrastructure in the world, cross-border links leave muchroom for improvement. The Commission has long viewed thedevelopment of ‘trans-European networks’ (TENs) as a centralelement of the EU’s single market programme. However, progress on
36
39
at all possible reverse, the adverse trend in the transport mix:measures must be introduced to slow the growth in the mostpolluting forms of transport and to boost the least polluting ones.
This will not be an easy task. But the EU (and individual member-states) can help by doing more to boost competition betweendifferent kinds of transport, rather than just within them. Currently,the cleanest forms of transport are not competing on an equalfooting with the dirtier ones, because the latter are not yetinternalising the full costs of their activities. For example, roadtransport imposes costs on non-users – in the form of congestion,pollution and noise – which amount to an estimated 2.6 per cent ofEU GDP. An important part of EU transport policy is to make surethat users pay a greater share of these costs. The ‘Eurovignette’directive, which has entered into force in 2010, applies the ‘polluterpays’ principle by imposing road charges on heavy goods vehicles.And the airline sector is set to be brought within the scope of theEU’s emissions trading scheme by 2012.
During the course of 2010, the Commissionwill publish a White Paper on the future of EUtransport policy. Much of its thinking hasalready been foreshadowed in a 2009
communication.1 The Commission wants to encourage thedevelopment of green technologies, notably via incentives in theEU’s R&D budget. It also – rightly – wants to ensure thatcompetition is properly enforced (particularly in the rail sector). Butit will need to give more thought to upgrading creaking railinfrastructure, particularly in Central and Eastern Europe. As arecent report points out, the EU will not meet its environmentaltargets unless various policy strands are pursued together. Whatever
is done to liberalise the rail sector, new entrantswill remain elusive if the networks are rundown, infrastructure charges are too high, andother forms of transport are effectivelysubsidised by the taxpayer.2
38 The Lisbon scorecard X
1 European Commission,‘A sustainable future fortransport’, June 2009.
2 Chris Nash and Bryan Matthews,‘European transport policy:Progress and prospects’,September 2009.
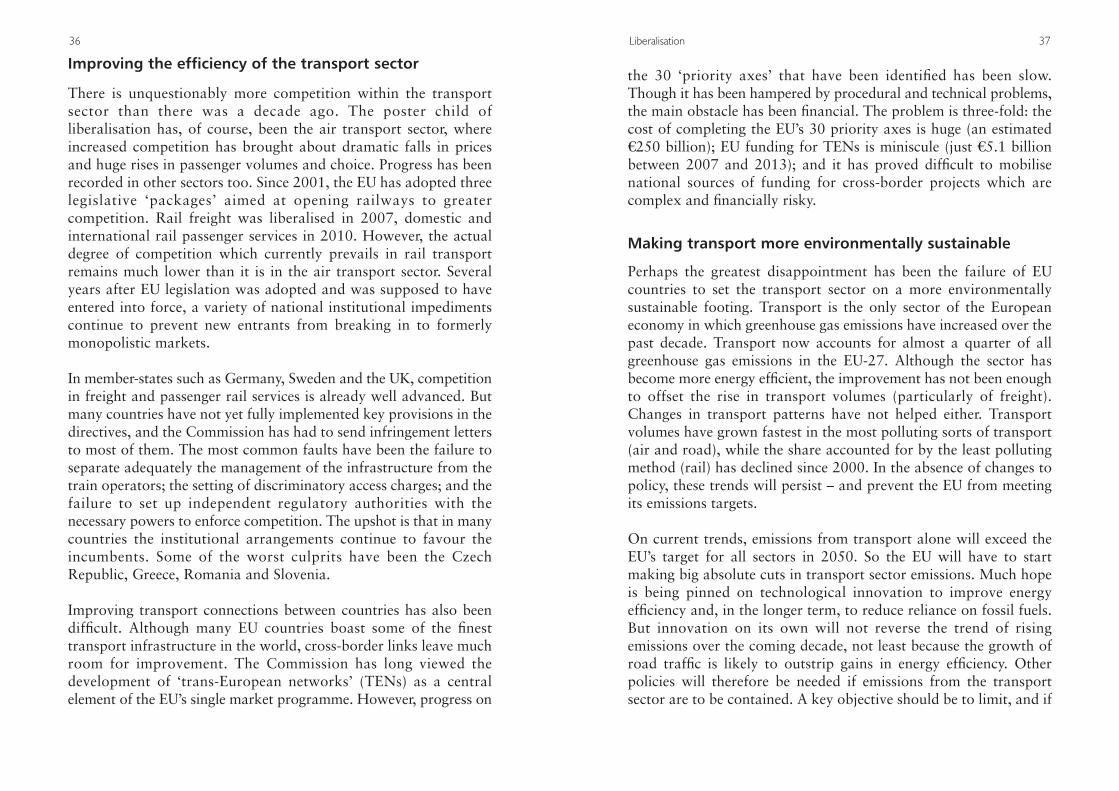
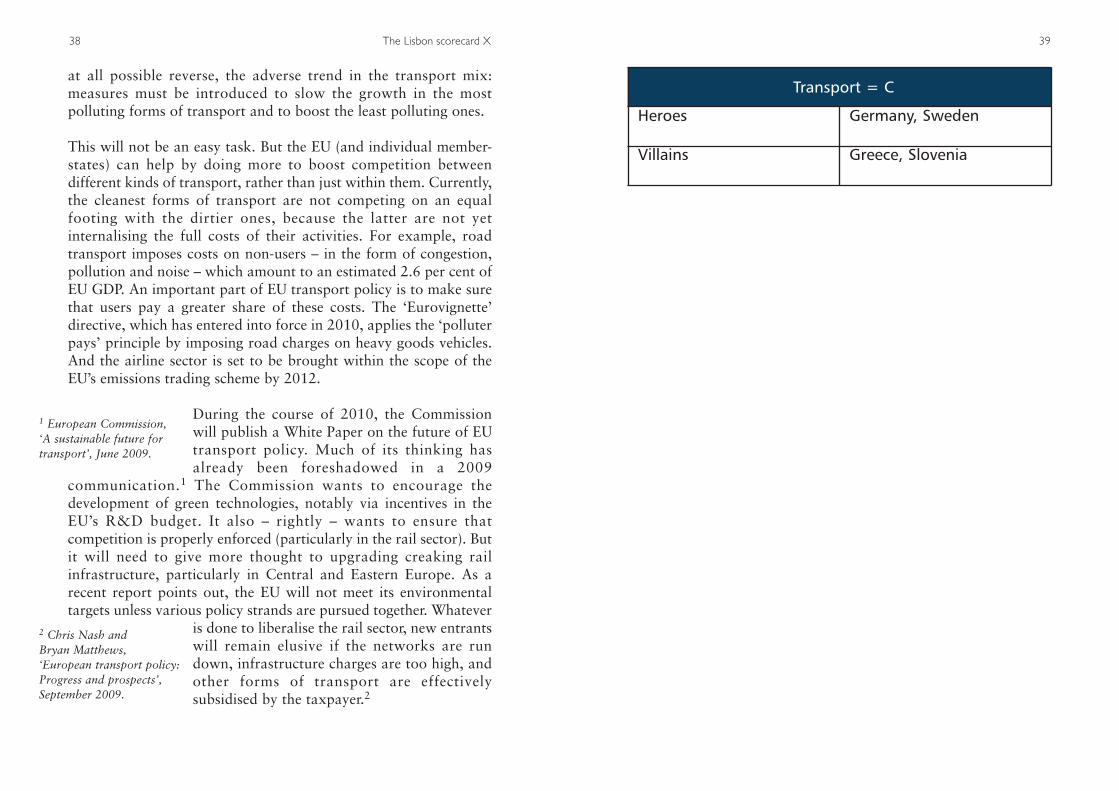
Transport = C
Heroes Germany, Sweden
Villains Greece, Slovenia
B3. Financial and general services
★ Create a single market in services
★ Complete the financial services action plan
The completion of the EU’s single market in services was a centralobjective of the Lisbon agenda. It is not hard to see why. Servicesaccount for 70 per cent of EU GDP, and the widening of thetransatlantic productivity gap since the mid-1990s has been largelydue to accelerating productivity growth in the US service sector.Since services markets are less integrated in the EU than in the US,removing barriers to trade between member-states was thought tobe one way of improving Europe’s productivity performance. Of allthe Lisbon objectives, however, this has proved to be one of themost fraught. The Commission’s efforts to open the market forgeneral services ran into bitter opposition in 2005. And thefinancial crisis has raised awkward questions about the EU’s singlemarket in banking.
General services
Firms have long struggled to provide services seamlessly across theEU. Rules that discriminate overtly against foreign providers haveadmittedly become rarer as they have been challenged and struckdown by the courts. Even so, the existence of 27 different nationalregulatory regimes has inevitably created obstacles to firms wantingto provide services across borders. These national obstacles havestifled competition, acted as a drag on productivity – and spawnedspecial interest groups opposed to change. In an effort to lowerthese barriers, in 2005 the Commission tried to apply a mutualrecognition regime. This would have allowed firms providingservices on a temporary basis in another EU country to follow theregulations of their home country. However, the proposal (the so-called Bolkestein directive) was blocked by countries fearing itwould spark a ‘race to the bottom’ in social rights.
tackled if the EU’s single market in banking is to be preserved. Sincethe late 1980s, the EU has sought to create a single market byallowing firms to open branches, or provide services on a cross-border basis, in another EU member-state, on the basis of a singleauthorisation from their home country (an arrangement referred toin EU jargon as ‘passporting’). Several problems, however, havecome to light – most of them exposed by Icelandic banks. First, the‘passport’ has encouraged the emergence of banks which threatenthe fiscal solvency of their home country. Second, some homecountries may be financially unable to honour commitments todepositors in other countries if one of their banks fails. Third, cross-border co-operation between supervisors has not been up to scratchand has proved fragile in a crisis.
It is hard to think of an arrangement more likely to undermine EUcitizens’ faith in the single market than one which exposes them tothe risk of losing their savings to a reckless bank established inanother member-state. Equally, it is difficult to see how the EU cancontinue encouraging financial integration in the region if themember-states do not trust or cannot work effectively with eachother. As the UK’s Turner Review into the financial crisis points out,the EU therefore faces a choice: either it accepts that host countrieswill have to wield more power over foreign banks operating ontheir territory, which would open the door to the very restrictionsand discriminatory treatment that the single market was designed toeliminate; or it overhauls prudential supervisoryrules and significantly increases the level ofinstitutional co-operation at EU level in aneffort to rescue the single market in banking.3
Unsurprisingly, the EU has chosen the second of these options. In2009, the European Commission submitted aproposed directive that largely followed therecommendations of a committee headed byJacques de Larosière.4 The directive, whichcommands the broad support of the member-
Liberalisation 43
A less ambitious directive therefore had to be adopted. Instead oftrying to prise open national markets by applying the principle ofmutual recognition, the directive reasserts existing treatycommitments to the free provision of services, and circumscribes theexceptional circumstances under which national restrictions can bejustified. The services directive entered into force at the start of2010. However, a number of EU countries have yet to implement thedirective into their domestic law; and many countries will continueto defend aspects of their regulatory regimes which interfere with thefree provision of services on their territory. Despite the directive’sentry into force, therefore, it will be some time before nationalbarriers to the cross-border provision of services are lowered. Theirremoval will be a laborious process, because each regulatory barrierwill have to be challenged individually in each sector and country. Inevery case, moreover, the onus will be on the service provider toprove that national rules flout EU law by being discriminatory,disproportionate or unnecessary.
Financial services
In contrast to the market for general services, that for financialservices had been proceeding rather well until the financial crisisbroke. Regional market integration in the financial sector had beenspurred by the introduction of the euro; by improvements in theunderlying technological infrastructure; and by an ambitiouslegislative programme, the Financial Services Action Plan (FSAP),which aimed to lower the regulatory barriers to financial firmsselling their products and services across the EU. But some nationalbarriers still remained. Securities markets, for example, continued tobe impeded by the fragmentation of national clearing and settlementsystems, which arrange the payment and transfer of securitiesbetween buyers and sellers. And the cross-border integration of theretail banking market was still a work in progress.
The financial crisis has not reversed the past decade’s advances inintegration. But it has exposed fault-lines which will have to be
42 The Lisbon scorecard X
3 Financial ServicesAuthority, ‘The TurnerReview: A regulatoryresponse to the financialcrisis’, March 2009.
4 Jacques de Larosière,‘Report of the high-levelgroup of financial supervision in the EU’,February 2009.
C. Enterprise
C1. Business start-up environment
★ Encourage entrepreneurship
★ Create the right environment for start-ups
Young firms are the bedrock of most dynamic economies. Not only arethey usually the source of most of the jobs that are created. They arealso the strongest drivers of productivity growth. It is not hard tounderstand why. Because they are less hamstrung by inherited workingpractices and business assumptions, they are usually more nimble andare often better at exploiting new, productivity-enhancing technologies.Their very existence, moreover, provides a much-needed competitivespur to established firms, forcing them to innovate and become moreefficient in turn. It is no surprise, then, that the Lisbon agenda placessuch high importance on the need to improve the environment forentrepeneurship. There have always been plenty of good small andmedium-sized enterprises (SMEs) in the EU. But in many cases this hasbeen in spite of the business environment, not thanks to it.
Numerous factors make it harder to establish a firm in the EU thanin the US – and for that firm to grow into a global giant.Burdensome regulations inhibit the emergence of new firms byincreasing start-up costs. Funding for start-ups is less freelyavailable. Tacit or explicit government support for ‘nationalchampions’ in some countries creates a bias in favour of incumbentsand raises barriers to entry. Restrictive labour laws interfere with theprocess of ‘creative destruction’ by hampering the growth of newfirms and slowing the exit of older, less efficient ones. And all sortsof barriers – cultural, linguistic, fiscal and regulatory – still make theEU a less integrated market than the US. Improving the environmentfor start-ups is consequently a wide-ranging task which involveseverything from reforming labour laws and bankruptcy regimes, toimproving the availability of seed capital.
states, will beef up supervisory arrangements by turning the so-called‘Level 3 committees’ (which co-ordinate regulatory approachesacross the EU) into European Supervisory Authorities (ESAs) forbanking, securities and insurance. The ESAs will have greaterresources and responsibilities than the Level 3 committees. But theywill not supplant national authorities, which will remain responsiblefor day-to-day supervision. The task of the ESAs will be to developa common rule book; mediate between supervisory authorities whendisputes between them arise; and co-ordinate risk management.
The future of the financial sector
As the EU overhauls the way the financial sector is regulated andsupervised, it needs to have a clear idea about what it wants toachieve. Following the financial crisis, there is no question that acomprehensive overhaul of prudential supervisory rules is necessaryif the financial system is to be placed on a more stable footing. Butthere is no free lunch. If the regulatory pendulum swings too far, theprice paid for a more stable financial system may be permanentlylower economic growth. The challenge for the EU is not to abolishrisk or legislate future crises out of existence. It is to design a systemthat strikes a sensible balance between financial stability andeconomic growth, and that makes sure that risks are borne by thosewho take them (rather than being offloaded on to the taxpayer). Inaddition, as the EU overhauls financial regulation, it is important thatit does not overlook the need to improve the efficiency of the financialsystem – notably with regard to funding start-ups (see Section C1).
44 The Lisbon scorecard X
Financial and general services = C
Heroes None
Villains Too many to mention
restrictive than elsewhere, imposing greater costs on EuropeanSMEs. The tax burden remains much higher in the EU than it doesin almost any other region in the world. And obtaining constructionpermits or registering property still takes far too long in many EUcountries. These features are, of course, longstanding. They reflectsocial choices that European voters show no desire to abandon.
Even so, there are still many prosaic, unglamorous things that EUgovernments can do to improve the environment for entrepeneurs.One is to improve the legal framework for businesses that fail.Evidence suggests that the medium-term returns from such reformsare significant. Why? Because regimes where bankrupts are notostracised are usually associated with higher rates of businesscreation. Unfortunately, bankruptcy retains a stigma in much ofEurope that it does not in the US. True, countries such as Denmark,Finland and Ireland already have efficient bankruptcy regimes, evenby global standards, with high rates of recovery for creditors. Butothers, such as the Czech Republic, France, Greece and Hungary donot. Well-designed bankruptcy regimes should rehabilitate viablefirms, liquidate those which are not as quickly as possible, andmaximise recovery rates for creditors.
Funding start-ups
Another traditional Achilles heel in much of the EU has been therelative dearth of risk capital to fund start-ups and their subsequentexpansion. This is certainly not true across all EU countries.Denmark, Sweden and the UK already have thriving venture capitalindustries, and France’s has grown strongly since reforms in 2003.But the sector in many other countries is almost non-existent.Moreover, even where the industry is well-developed, venturecapitalists tend to prefer investing in firms that are alreadyestablished. Add to this the fact that banks are reluctant to lend toentrepeneurs with good ideas but little collateral, and it is not hardto see why start-ups have a harder time in Europe than in the US.The issue has received less attention than it deserves. Of the Lisbon
Enterprise 47
Encouraging entrepeneurship
It would be churlish to deny that reforms have led to a modestimprovement of certain EU countries’ business environments.Encouragingly, many of the countries where obstacles to start-upswere the greatest ten years ago – notably Greece, the CzechRepublic, France, Hungary and Italy – have taken the largest steps.France, once notorious for stifling entrepeneurial spirit withbureaucracy, is now one of the easiest countries in the EU in whichto set up a business. However, even though progress has been madesince the launch of the Lisbon agenda, it has not resulted in atransformation of Europe’s business environment. Across the EU asa whole, bureaucratic requirements for start-ups remain far tooonerous. And many problems – high barriers to entry, segmentednational markets, unhelpful regulations, and so on – remain aspressing now as they were back in 2000.
Consider where EU countries stand in relation to theircounterparts elsewhere in the world. Every year, the World Bankmonitors many of the policies that matter most for SMEs throughits ‘Doing Business’ survey. The survey measures the ease ofsetting up or closing a business, employing staff, registeringproperty, obtaining funding and so on. According to its latestsurvey, only four EU member-states – Denmark, Ireland, Swedenand the UK – rank in the world’s top 20 locations for ease ofdoing business. In a large number of EU countries, thebureaucratic obstacles to opening a new business remaindepressingly widespread. Only two EU countries – Ireland and theUK – rank within the top 20 places. According to the WorldBank, it takes fewer days to open a business in Argentina, Syria orRussia than it does in Spain or Greece.
European countries do, of course, have many advantages. Theirbusiness environments are generally more stable and predictablethan in many other parts of the world, and contracts are betterenforced. But they also have numerous weaknesses – and these aredepressingly common across the EU. Labour laws are more
46
49
agenda’s 24 ‘integrated guidelines’, none focuses specifically on thefinancing of innovative firms.
It would be wrong to imply that the EU has ignored the subjectaltogether. The Commission has advocated making greater use of theEuropean Investment Bank (EIB) and the European Investment Fund(EIF) to provide financial support to SMEs. And in 2007 it issued acommunication designed to encourage the emergence of a pan-EUventure capital industry by lowering the barriers that impede cross-border business in the sector. The Commission’s thinking is that ifcross-border activity can be boosted, funding problems for start-upsin countries with under-developed venture capital sectors may bealleviated.5 Even so, it remains true that the question of funding
innovative start-ups has not been a prominentfeature of EU policy since the Lisbon agenda’slaunch. A successor to the Lisbon agenda mustdo more to improve start-up companies’ accessto funding.
48 The Lisbon scorecard X
5 European Commission,‘Removing obstacles tocross-border investments byventure capital funds’,December 2007.
Business start-up environment = B-
Heroes Ireland, UK
Villains Greece, Spain
EU R&D policy: Time for some real innovation
For over a quarter of a century, European R&D policy has been dominatedby the idea that multi-partner collaboration between companies anduniversities in different countries is the key to building a successfulinnovation-driven economy. It is a philosophy rooted in the desire ofViscount Etienne Davignon, the former industry commissioner, to encouragecross-border co-operation and mergers in the early 1980s. The idea wasforged at a time when policy-makers everywhere were awed by Japan’sMinistry of International Trade and Industry (MITI) and the collaborativeR&D programmes on which its success seemed to rest.
One product of this era is the EU’s Framework Programmes for Research andTechnological Development. The seventh such programme (FP7), which runsfrom 2007 to 2013, makes roughly S7.5 billion available a year – two-thirdsof it for collaborative R&D grants. However, despite the increasingimportance ascribed to R&D by politicians and policy-makers, thepercentage of GDP spent on R&D across the EU remains below 2 per cent,barely higher than ten years ago, and well short of the 2010 target of 3 percent set at the Lisbon summit in March 2000. SMEs only receive around 12per cent of total EU grant monies, smaller even than the pathetically lowtarget of 15 per cent set by the Commission.
The disproportionate contribution of SMEs to innovation is widelyacknowledged by policy-makers. According to the US Small BusinessAdministration, small businesses generate 13-14 times as many patents peremployee as larger ones, and are responsible for 60-80 per cent of new jobs.So the inability of FP7 to enrol European SMEs in its flagship R&Dprogrammes is a major indictment of EU innovation policy.
University intellectual property (IP) plays a smaller role in high growth start-ups than policy-makers often assume. In Cambridge, one of Europe’sleading clusters for science and technology based start-ups, the most
5150
successful firms in their early stages rely strongly on customers – throughR&D contracts and the commissioning of prototypes – to stimulateinnovative solutions and to fund development. Addressing customer needsthrough the discipline of a contractual relationship plays a critical role inthe innovation process. Conventional venture capital has tended to play atmost a secondary role in the funding of these firms. And importantly, themost successful firms have tended to avoid becoming involved in multi-partner, collaborative R&D projects, especially those funded by the EU.These EU R&D programmes are generally seen as a distraction: too farremoved from the market to be of interest to SMEs, with conflictingobjectives and priorities among the partners, and large managementoverheads for very little funding.
The contrast with US policy could not be greater. For nearly 30 years thelead US policy to encourage innovative SMEs has been the Small BusinessInnovation Research (SBIR) Programme – a procurement-based,competitive programme that awards R&D contracts to fund thedevelopment of new technologies in response to federal agency needs ascustomers. Worth $2.3 billion a year, the SBIR programme makes some4,000 awards each year in two phases. Crucially, firms retain the IP, andcollaboration with other firms is not required. In contrast to the partialfunding approach of EU R&D grants – a major disadvantage for cashstrapped early stage firms – SBIR awards cover 100 per cent of projectcosts plus a small profit element. Most of this funding goes to firmsemploying fewer than 25 people.
The SBIR is effectively ‘the largest seed capital fund in the world’, and hasplayed a critical role in the funding of early stage US science and technologycompanies. Unlike the EU’s collaborative R&D programmes, it has anenthusiastic following amongst entrepreneurs, venture capitalists andpolicy-makers, and it is admired throughout the world. In recent years, boththe UK and the Netherlands have developed successful small-scale SBIRprogrammes of their own. However, EU procurement rules discourage thiskind of programme at national level, and the problem is compounded bycurrent pressures on the public finances.
The EU could create an equivalent of SBIR if it allocated S800 million a yearfrom the eighth framework programme (FP8) to fund 40 per cent of thecost of programmes run by national public sector agencies – in areas like
healthcare, the environment, energy and transport. This would give firmsaccess to important customers early in the product development cycle. Asa first step, this kind of programme could be piloted during the remainderof FP7.
As the EU faces growing competition from technologically-sophisticated butlow wage countries like China and India, an SBIR initiative could provide justthe kind of innovative boost that Europe’s small science and technologybased firms need. It is time for some real innovation in EU R&D policy.
David Connell
Director, TTP Capital Partners Ltd and Senior Research Associate, Centre forBusiness Research, University of Cambridge.
C2. Regulatory burden
★ Member-states to implement 99 per cent of all single marketlegislation
★ Simplify the EU’s regulatory environment to reduce the burdenon business
The global financial crisis has provided a stark reminder thatmarket economies rarely function properly without anappropriate regulatory framework. Regulations and public bodiesplay a vital role by correcting market failures, protectingconsumers, preventing market abuse and enforcing competition.But regulations can have all sorts of unintended consequences. Byreducing choice, for example, they can damage the consumerinterests they are designed to protect. In addition, poorly-designedregulations can impose major costs on the broader economy. Theycan stifle innovation and productivity by deterring the creationand expansion of new firms. And they can hinder the creation ofnew jobs. In other words, poorly-designed and over-burdensomeregulations can ultimately damage the two determinants of acountry’s prosperity over the long run: the levels of productivityand employment.
Implementation and enforcement of EU laws
Some degree of regulatory convergence is necessary at EU level toensure that different national standards do not impede cross-bordertrade. However, the EU’s single market has long been blighted by thefact that many countries are slow to transpose EU directives intonational law. And once they have done so, they are sometimes reluctantto enforce them or comply with their spirit. The goods news is that EUmember-states have become better at implementing single marketlegislation – so much so that the Commission felt able in 2007 to raisethe bar by setting them a more ambitious target of implementing 99per cent of all single market legislation by 2009 (up from 98.5 per cent
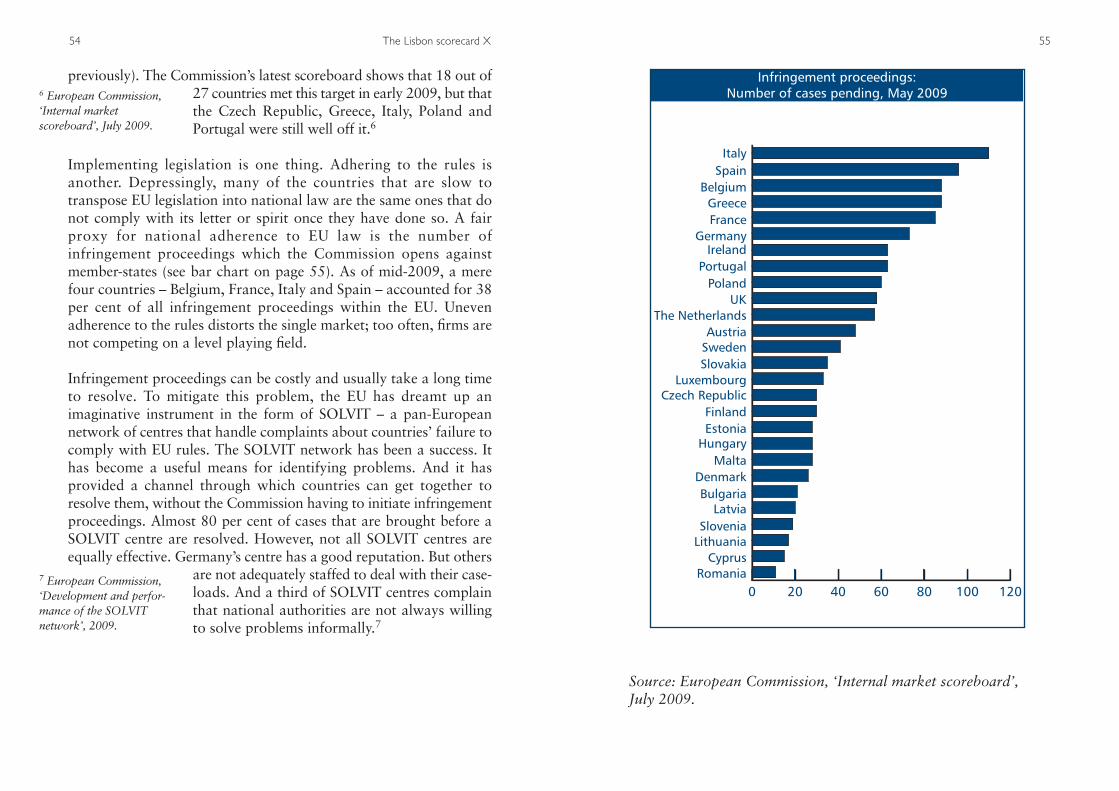
55
previously). The Commission’s latest scoreboard shows that 18 out of27 countries met this target in early 2009, but thatthe Czech Republic, Greece, Italy, Poland andPortugal were still well off it.6
Implementing legislation is one thing. Adhering to the rules isanother. Depressingly, many of the countries that are slow totranspose EU legislation into national law are the same ones that donot comply with its letter or spirit once they have done so. A fairproxy for national adherence to EU law is the number ofinfringement proceedings which the Commission opens againstmember-states (see bar chart on page 55). As of mid-2009, a merefour countries – Belgium, France, Italy and Spain – accounted for 38per cent of all infringement proceedings within the EU. Unevenadherence to the rules distorts the single market; too often, firms arenot competing on a level playing field.
Infringement proceedings can be costly and usually take a long timeto resolve. To mitigate this problem, the EU has dreamt up animaginative instrument in the form of SOLVIT – a pan-Europeannetwork of centres that handle complaints about countries’ failure tocomply with EU rules. The SOLVIT network has been a success. Ithas become a useful means for identifying problems. And it hasprovided a channel through which countries can get together toresolve them, without the Commission having to initiate infringementproceedings. Almost 80 per cent of cases that are brought before aSOLVIT centre are resolved. However, not all SOLVIT centres areequally effective. Germany’s centre has a good reputation. But others
are not adequately staffed to deal with their case-loads. And a third of SOLVIT centres complainthat national authorities are not always willingto solve problems informally.7
54 The Lisbon scorecard X
6 European Commission,‘Internal market scoreboard’, July 2009.
7 European Commission,‘Development and perfor-mance of the SOLVIT network’, 2009.
Infringement proceedings:Number of cases pending, May 2009
0 20 40 60 80 100 120
ItalySpain
BelgiumGreeceFrance
GermanyIreland
PortugalPoland
UKThe Netherlands
AustriaSwedenSlovakia
LuxembourgCzech Republic
FinlandEstonia
HungaryMalta
DenmarkBulgaria
LatviaSlovenia
LithuaniaCyprus
Romania
Source: European Commission, ‘Internal market scoreboard’, July 2009.
EU. On this basis, it has established a programme that aims to reduceadministrative costs on business by 25 per cent by 2012. TheCommission has proposed several measures to meet this objective,including a revision to a VAT directive that aims to remove regulatoryobstacles to electronic invoicing. The very smallest firms should bethe greatest beneficiaries of the drive to reduce the administrativeburden. For example the Commission is proposing to exempt themfrom statistical reporting requirements on intra-EU trade, as well asfrom EU accounting rules.
Better regulation: The challenge ahead
There has been a profound culture change in the Commission sincethe Lisbon agenda was launched. It has become far more sensitive tothe costs that EU legislation imposes on businesses. And it hasdisplayed a welcome appetite for reducing the amount of red tape towhich firms are subject. The challenge now is to make sure that thischange of culture starts producing tangible savings for business.This task, however, cannot be the responsibility of the Commissionalone. Since most EU laws cannot take effect until implementedinto national law, businesses will not reap the benefits of betterregulation unless national governments take the concept seriously.The national context is all the more important given the tendency ofcertain countries to ‘gold-plate’ EU laws by adding nationalrequirements over and above those required by the directives theyare implementing.
The EU must continue to give high priority to its better regulationagenda. And it must not allow itself to be side-tracked by currentarguments surrounding the regulatory overhaul in the financial sector.It is tempting to think that because the crisis exposed inadequacies inthe way the financial sector was regulated, the need is for moreregulation – in finance and elsewhere. This line of reasoning, however,is too simplistic. An overhaul of the way financial markets areregulated and supervised is unquestionably needed. But the purposeshould not be to expand the volume of rules per se. It should be to
Enterprise 57
Improving the regulatory environment by cutting red tape
Aside from ensuring that single market rules are uniformly enforced,the EU’s other priority has been to reduce the amount of red tapeassociated with such rules. The first prong of its ‘better regulation’agenda has been to avoid the adoption of unnecessary rules byimproving the quality of the Commission’s impact assessments. Intheory, all proposals for EU legislation must now pass a series of testsbefore they are submitted. The Commission must prove thatalternatives to legislation have been considered; that the social,economic and environmental impact has been properly assessed; andthat the legislation is proportionate to the objective it is intended tomeet. Impact assessments have improved since the Commissionestablished a board to exercise quality control over them. But theyneed to improve further in order to allay suspicions that they are justfig-leaves to justify predetermined policy choices.
The second prong of the EU’s better regulation agenda has been aprogramme of ‘simplification’. This has entailed withdrawingproposals that can no longer be justified by more rigorous impactassessments; repealing redundant laws; and making laws that arestill in force easier to understand by consolidating (or ‘codifying’)the initial texts and their subsequent amendments into onedocument. This programme has been laborious, but it hasdelivered results. Since 2005, the Commission has withdrawn 108proposals that were in the legislative pipeline but which could nolonger be justified. And by 2008, the EU had finished codifying 229
of the 436 laws that it had targeted. TheCommission estimates that this has already cutthe volume of the acquis (the body of EU law)by 10 per cent.8
The final plank of the better regulation agenda has been to reduce theadministrative burden that EU laws impose on businesses. In 2007,the Commission identified 42 pieces of legislation in 13 priority areasthat, combined, imposed an estimated S115-130 billion inadministrative costs (such as form filling) on businesses across the
56
8 European Commission,‘Third strategic review ofbetter regulation in the EU’,January 28th 2009.
C3. State aid and competition policy
★ Promote competition and reduce subsidies to industry
★ Overhaul state aid rules while taking into account the needs ofsmall businesses
Competition policy is one of the few instruments the Commissioncan deploy directly against companies and governments that do notplay by the rules of the single market. Neelie Kroes, who held thecompetition portfolio in the previous Commission, upheld thecompetition rules in an uncompromising manner. Her successor,Joaquín Almunia, will face a tougher task. The consensus across theEU in favour of robust competition policies was always patchy buthas recently frayed further. The financial crisis has emboldenedthose governments that have long believed that the EU’scompetition rules are placing European firms at a disadvantagecompared with their competitors in other economies. TheCommission will have to find a way of reconciling pressure frommember-states for more activist industrial policies with adherenceto an independent competition policy.
The amount of state aid paid out by EU governments fell from 0.71per cent of EU GDP in 2002 to 0.53 per cent in 2007. Moreover,governments spent less on bail-outs and aid for corporaterestructuring, and more on meeting the EU’s ‘horizontal’ objectives:environmental efficiency, regional economic development, thegrowth of SMEs and R&D. However, this favourable trend came toan end in 2009. In response to the sharp deterioration in theavailability of credit following the financial crisis, the Commissiontemporarily eased state aid rules to allow governments to guaranteeloans to firms and to increase subsidies to small companies sufferingfrom the credit drought. Governments have made use of thistemporary relaxation. For example, the French government hasextended huge aid to the country’s car industry, ostensibly to supportthe development of low emission cars.
improve their design. The EU’s ‘better regulation’ agenda has not,therefore, been invalidated by the crisis. Regulations can sometimes bejustified. Unnecessary costs never can be.
58 The Lisbon scorecard X
Regulatory burden = B-
Heroes Denmark, EuropeanCommission, Finland
Villains Greece, Italy, Spain
encourage the growth of firms in high-tech sectors, where itcontinues to perform poorly. However, there is no case for looseningstate aid rules to allow direct support to high-tech firms. These rulesare already much more flexible than the Commission’s criticsacknowledge. Europe’s weak performance in high-tech sectorsreflects, among other things, the EU’s very costly patent regime, thelack of properly pan-European capital markets, and governments’failure to invest enough in higher education. Allowing governmentsmore freedom to support their chosen firms would do nothing toaddress these problems, but would introduce distortions into thesingle market.
However, there is one area where there could be a case for moreflexible EU competition rules. Governments can stimulateinnovation by establishing regulatory standards or setting specifictargets. This works particularly well in sectors such as greentechnology, as the Commission has recognised. But the EU alsoneeds to learn from the US about the contribution that publicprocurement can make to fostering new technologies. Publicprocurement accounts for over 15 per cent of EU GDP, which makesit a formidable resource.
Unlike in the US, EU rules do not allow public bodies conductinga tender and the companies submitting bids to work together todevelop the specifications. The Commission is understandablywary of changing the rules, fearing that national authorities wouldgive preference to local firms. However, if European countries areto succeed in boosting public sector productivity and instimulating the growth of more high-tech firms, they have nochoice but to use public procurement more creatively. This willrequire the Commission to craft guidelines which allow creativerelationships between the public sector and firms, yet avoidcompromising the single market. It will also require a culturalchange on the part of the public sector. Fiscal austerity and theneed to do more with less money could help to achieve thenecessary evolution in thinking.
Enterprise 61
Although the Commission is now in the process of reversing thistemporary relaxation of the rules, state aid will remain a battlefield.Against a backdrop of very weak economic growth, many highprofile European firms will go bankrupt over the next few years.Faced with high unemployment and growing frustration at whatthey see as unfair competition created by global currencymisalignments and interventionist industrial policies, EUgovernments will be tempted to step in and rescue them. Althoughthis could make sense for the member-state in question – if only inthe short term – it would not do so for the European economy as awhole. Bail-outs of struggling firms would exacerbate the problem ofover-capacity, thereby reducing profitability and future investment.Governments that keep struggling companies alive risk retarding thereallocation of resources from underperforming sectors to faster-growing, high-tech ones that is needed to boost productivity.
Should competition rules be relaxed?
Many EU governments believe that the rise of economies withinterventionist governments means that Europe can no longer affordits laissez-faire approach to state aid and the ownership ofcompanies. They are especially worried about China, whichcombines very activist industrial policies with mercantilist tradepolicies, and is now the world’s largest exporter. In addition, theextent to which resources were misallocated by financial markets inthe run-up to the crisis has made some governments doubt that themarket is the best way of channelling resources to cutting edgesectors. They want to be free to intervene directly to foster thegrowth of businesses they consider to be strategically important andto prevent foreign takeovers of such firms.
Various governments, including the British one, have called for amore ‘flexible’ competition regime for high-tech firms. For example,the current business secretary (and former EU trade commissioner),Peter Mandelson, wants to make it easier for governments to extendrisk capital to high-tech firms. Europe certainly needs to do more to
60 The Lisbon scorecard X
63
There is no doubt that the structure of the Chinese economy and theChinese authorities’ manipulation of its currency pose a seriouschallenge for European policy-makers. Unless China changes track,it will be hard for them to resist protectionist pressure. Nevertheless,any dilution of EU competition rules would be bad news for the EUeconomy. Rather than weakening the case for robust competitionpolicy, weak economic growth strengthens it. Competition is key toproductivity growth. In properly contested markets, firms have tostrive to be innovative and to maximise their productivity if they areto flourish. The record of the last few years suggests that financialmarkets are a long way from allocating capital to those that canemploy it most productively. But they are surely still better at thistask than governments.
62 The Lisbon scorecard X
State aid and competition policy = C+
Heroes European Commission, The Netherlands, UK
Villains France
A European industrial policyfor the 21st century
As Europe moves hesitantly out of recession, it is time to reappraise wheremanufacturing fits into the continent’s economy. Contrary to a widespreadbelief prevalent for the past decade, there is scope for manufacturing toexpand as a proportion of total output. It could take up some of the slackin the economy that is likely to appear from the weakening of the financialservices sector.
In helping manufacturing to perform better, the European Commission canplay a role. Now is not the time to revert to the policies of supporting‘national champions’ by handing out large sums of money, either in theform of direct support or special contracts. What is required instead is amore refined strategy built around aiding the development of those areasof industry where Europe has an advantage.
A key task is to understand what modern manufacturing means. Itencompasses all the parts of the ‘value-chain’ connected to the physicalproduction of goods. This means that even companies doing littlemanufacturing themselves, but which devise and sell factory-madeproducts, are part of manufacturing.
Think of Apple: a company with virtually no factories but whose productssum up some of the best qualities in engineering, design and userapplications. Europe has plenty of companies such as this, in fields frombabies’ buggies to computer chips; they are manufacturers in the sense ofbeing concerned with the product even if they might contract out physicalproduction to others, perhaps in lower cost countries such as China.
In addition to these so-called ‘virtual manufacturers’, there are ‘servi-manufacturers’: companies which gain a large percentage of their revenuesfrom services as well as manufacturing. Rolls-Royce gains half its revenues
6564
from maintaining and monitoring the aero-engines it makes, sometimeswhile they are flying.
A third broad category is the ‘touch-manufacturers’. These are the companiesin specialist disciplines where a lot of manual production techniques and craft-based skills are required, in areas such as machine building or high-valueautomotive parts. Often, products are made in short production runs whererapid changes in specification are needed to fit in with customers’ preferences.
In all these fields Europe has a good track record. Policy-makers andbusiness people need to understand that successful manufacturers requirea range of strengths in different disciplines, often concerned with sellingservices, and that nurturing the relevant skills is important.
To build on this, the Commission should concentrate on a broad approachof encouraging technology development in universities and other academicestablishments; supporting training programmes to boost more commercialthinking in science and technology (such as through creating universityspin-out companies); and a modest programme of R&D grants to help smalland mid-sized businesses.
National governments should be encouraged to spend more of their publicprocurement funds – for instance in large information technology projects– on contracts with small rather than big companies, so as to giveentrepreneurially-minded smaller businesses a useful boost. Suchprogrammes would not only help the business of wealth creation, but couldalso play a part in increasing the effectiveness of many large state-fundedtechnology projects, the results of which are often disappointing.
Projects of this kind would be inspired by schemes in the US that help smalland innovative businesses, such as the highly successful series of grants runby the National Science Foundation.
Above all, the Commission should be concerned with education in thebroadest sense: bringing to the attention of the wider public theachievements of the continent’s best manufacturers, and encouragingfuture entrepreneurs to consider them as role models.
This means supporting the efforts by private sector think-tanks anduniversity institutes to discover the ingredients that make these companieswhat they are, and to make these more generally known.
Manufacturing has a huge potential to stimulate economic growth over thenext 20 years. Rather than stay on the sidelines while the US and Asia makethe running, Europe should be at the centre of efforts to gain the maximumbenefits from what manufacturing has to offer.
Peter Marsh
Financial Times
D. Employment and social inclusion
D1. Bringing people into the workforce
★ Raise the employment rate to 70 per cent by 2010
★ Raise the employment rate for women to 60 per cent and thatfor older workers to 50 per cent
When the Lisbon agenda was launched in 2000, around two-thirdsof the gap in transatlantic living standards was explained bydifferent levels of ‘labour utilisation’: Europeans were poorer thantheir US counterparts because fewer of them had jobs, and becausethose who did have jobs worked shorter weeks and took longerholidays. There is no reason why Europeans should aspire to closethe transatlantic gap for its own sake – particularly as that gappartly reflects a perfectly legitimate preference for leisure overincome. But economic inactivity cannot be explained by a culturalpreference for leisure alone. There are many people across Europewho are not working but would like to be – and this was true wellbefore the large-scale job losses resulting from the global financialcrisis in 2008-09.
There are two central reasons why the Lisbon agenda seeks toencourage EU countries to raise their employment rates. The first isto tackle social exclusion. In many EU countries, far too high ashare of the working age population does not belong to the labourforce. Too often, this reflects a ‘discouraged worker’ effect – that is,the prevalence of people of working age who have become sodisheartened looking for work that they have stopped doing soaltogether. The second reason for raising employment rates is toplace social welfare systems on a more sustainable long-termfooting. As European populations get older, the level ofparticipation in the labour force needs to rise, so that social welfaresystems remain affordable.
59.1 per cent in 2008 – within touching distance of the 2010target of 60 per cent. Gratifyingly, many of the countries thatposted the largest increases (Estonia, Germany, Italy, Latvia andSpain) were those with the lowest initial female employment rates.True, female employment in a handful of countries – such asHungary, Malta and Slovakia – has stagnated at low levels. Butoverall, the trend across the EU has been positive. The femaleemployment rate remains much lower in Greece and Italy (whereit is below 50 per cent) than it is in Denmark, the Netherlands andSweden (where it exceeds 70 per cent). However, the gap has atleast narrowed since 2000.
The other great beneficiaries of job creation since 2000 have beenolder workers. Across the EU-27 as a whole, the employment rateamong workers aged 55 to 64 rose from 36.9 per cent in 2000 to45.6 per cent in 2008. But the gap between the best-performingcountry and the worst-performing remains huge. While Swedenhas an employment rate of 70.1 per cent among those aged 55 to64, in countries like Italy and France it is still well under 40 percent. The scale of this difference partly reflects variations in theeffective age of retirement, but it also reflects the extraordinarilylow rates of female employment in the 55 to 64 age group in somecountries. In 2008, the employment rate for women in thisparticular age group was just 12.5 per cent in Malta and little over20 per cent in Italy, Poland and Slovenia. In Sweden, by contrast, itstood at almost 67 per cent.
Why Europe must not be complacent
Does the rise in employment rates between 2000 and 2008 point toan improvement in the long-term performance of EU countries’labour markets? The answer is: yes, but only up to a point. Since2000, countries like Austria, France and Germany have all pushedthrough reforms which have made their labour markets moreflexible. Improvements in levels of education, moreover, have madethe working-age population more employable: Europeans with
Employment and social inclusion 69
In some EU countries, raising the employment rate requiressomething of a Copernican revolution: they need to do the exactopposite of what they started doing in the 1970s. The good news isthat most governments seem to have abandoned the flawed policiesof the past, which tried to keep the unemployment rate down byrationing work (in the form of shorter working weeks) or byactively encouraging economic inactivity (in the form of earlyretirement). The bad news is that few countries have done much totackle the dual nature of their labour markets. The result is thatlabour markets in many EU countries – France and Spain amongthem – are still divided between privileged ‘insiders’ on full-timecontracts (with high levels of job protection and generous pensionprovisions) and ‘outsiders’ (usually the young) who, if they arelucky enough to find a job, have to get by on a succession of short-term contracts with no perks.
The employment rate has risen
How have EU countries progressed towards their employmenttargets? At first glance, there are grounds for encouragement. At thetime of writing, data for 2009 were not available. However, between2000 and 2008, the employment rate rose in all but two member-states – Portugal and Romania (see table on page 71). In somecountries – such as Bulgaria, Estonia, Latvia – the rise wasspectacular. But solid increases were also posted in Cyprus,Germany, Greece, Italy, the Netherlands, Slovenia and Slovakia.Moreover, employment rose in all the EU’s wealthiest member-statesbetween 2000 and 2008 – a period when 12 poorer countries wereadmitted to the EU and imports from China surged. This should layto rest a persistent myth about globalisation: namely, that thegrowth of trade with, and ‘offshoring’ (délocalisation) to, low-wagecountries condemns higher wage countries to rising unemployment.
The main beneficiaries of rising employment since the launch of theLisbon agenda in 2000 have been women. The rate of femaleemployment in the EU-27 increased from 53.7 per cent in 2000 to
68 The Lisbon scorecard X
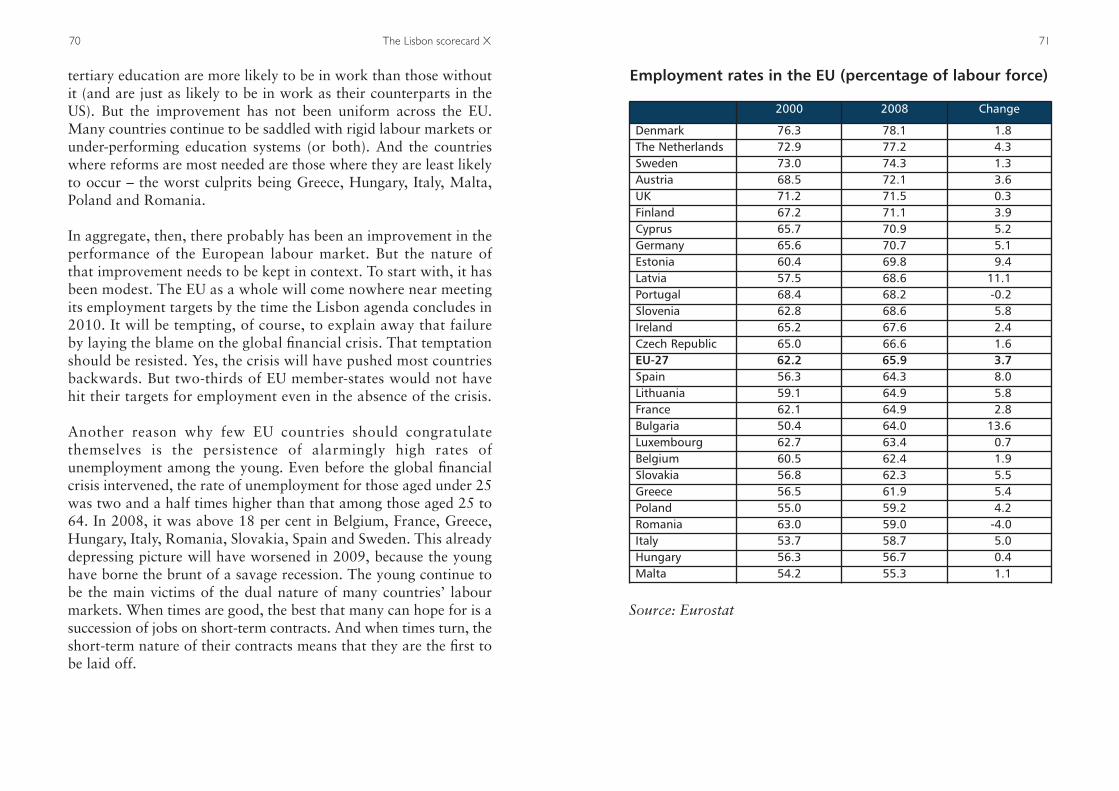
71
tertiary education are more likely to be in work than those withoutit (and are just as likely to be in work as their counterparts in theUS). But the improvement has not been uniform across the EU.Many countries continue to be saddled with rigid labour markets orunder-performing education systems (or both). And the countrieswhere reforms are most needed are those where they are least likelyto occur – the worst culprits being Greece, Hungary, Italy, Malta,Poland and Romania.
In aggregate, then, there probably has been an improvement in theperformance of the European labour market. But the nature ofthat improvement needs to be kept in context. To start with, it hasbeen modest. The EU as a whole will come nowhere near meetingits employment targets by the time the Lisbon agenda concludes in2010. It will be tempting, of course, to explain away that failureby laying the blame on the global financial crisis. That temptationshould be resisted. Yes, the crisis will have pushed most countriesbackwards. But two-thirds of EU member-states would not havehit their targets for employment even in the absence of the crisis.
Another reason why few EU countries should congratulatethemselves is the persistence of alarmingly high rates ofunemployment among the young. Even before the global financialcrisis intervened, the rate of unemployment for those aged under 25was two and a half times higher than that among those aged 25 to64. In 2008, it was above 18 per cent in Belgium, France, Greece,Hungary, Italy, Romania, Slovakia, Spain and Sweden. This alreadydepressing picture will have worsened in 2009, because the younghave borne the brunt of a savage recession. The young continue tobe the main victims of the dual nature of many countries’ labourmarkets. When times are good, the best that many can hope for is asuccession of jobs on short-term contracts. And when times turn, theshort-term nature of their contracts means that they are the first tobe laid off.
70 The Lisbon scorecard X
Employment rates in the EU (percentage of labour force)
2000 2008 Change
Denmark 76.3 78.1 1.8The Netherlands 72.9 77.2 4.3Sweden 73.0 74.3 1.3Austria 68.5 72.1 3.6UK 71.2 71.5 0.3Finland 67.2 71.1 3.9Cyprus 65.7 70.9 5.2Germany 65.6 70.7 5.1Estonia 60.4 69.8 9.4Latvia 57.5 68.6 11.1Portugal 68.4 68.2 -0.2Slovenia 62.8 68.6 5.8Ireland 65.2 67.6 2.4Czech Republic 65.0 66.6 1.6EU-27 62.2 65.9 3.7Spain 56.3 64.3 8.0Lithuania 59.1 64.9 5.8France 62.1 64.9 2.8Bulgaria 50.4 64.0 13.6Luxembourg 62.7 63.4 0.7Belgium 60.5 62.4 1.9Slovakia 56.8 62.3 5.5Greece 56.5 61.9 5.4Poland 55.0 59.2 4.2Romania 63.0 59.0 -4.0Italy 53.7 58.7 5.0Hungary 56.3 56.7 0.4Malta 54.2 55.3 1.1
Source: Eurostat
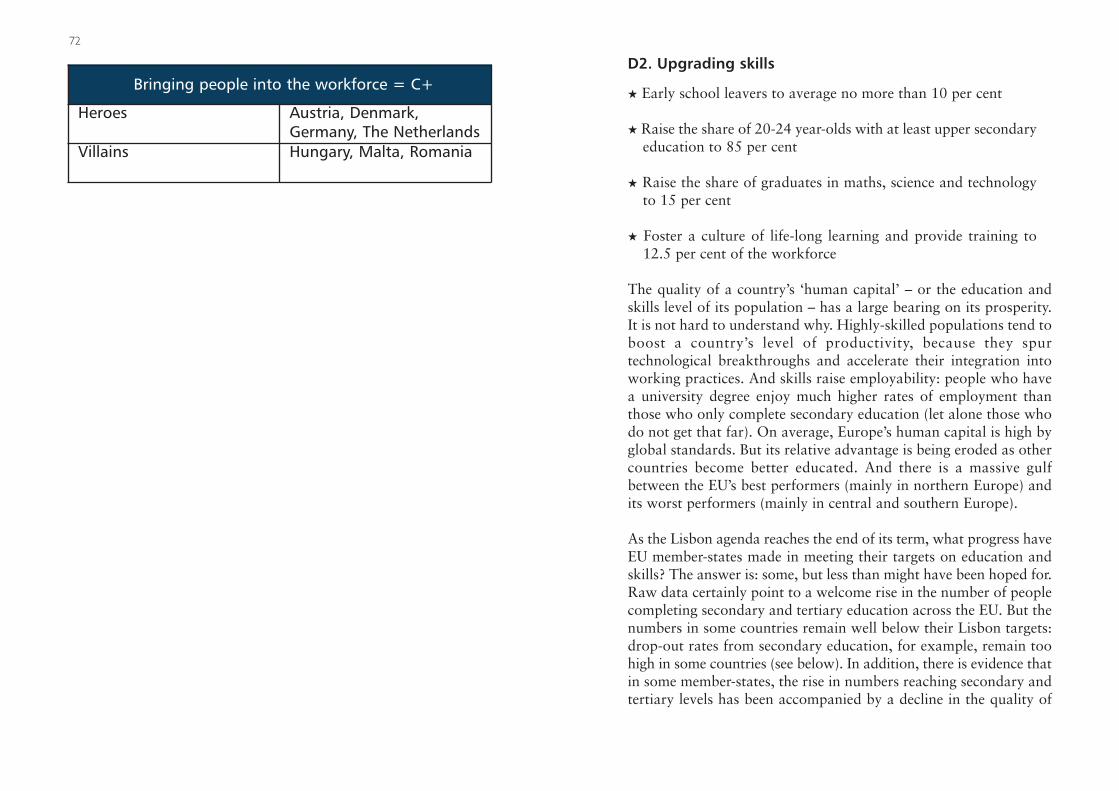
D2. Upgrading skills
★ Early school leavers to average no more than 10 per cent
★ Raise the share of 20-24 year-olds with at least upper secondaryeducation to 85 per cent
★ Raise the share of graduates in maths, science and technologyto 15 per cent
★ Foster a culture of life-long learning and provide training to12.5 per cent of the workforce
The quality of a country’s ‘human capital’ – or the education andskills level of its population – has a large bearing on its prosperity.It is not hard to understand why. Highly-skilled populations tend toboost a country’s level of productivity, because they spurtechnological breakthroughs and accelerate their integration intoworking practices. And skills raise employability: people who havea university degree enjoy much higher rates of employment thanthose who only complete secondary education (let alone those whodo not get that far). On average, Europe’s human capital is high byglobal standards. But its relative advantage is being eroded as othercountries become better educated. And there is a massive gulfbetween the EU’s best performers (mainly in northern Europe) andits worst performers (mainly in central and southern Europe).
As the Lisbon agenda reaches the end of its term, what progress haveEU member-states made in meeting their targets on education andskills? The answer is: some, but less than might have been hoped for.Raw data certainly point to a welcome rise in the number of peoplecompleting secondary and tertiary education across the EU. But thenumbers in some countries remain well below their Lisbon targets:drop-out rates from secondary education, for example, remain toohigh in some countries (see below). In addition, there is evidence thatin some member-states, the rise in numbers reaching secondary andtertiary levels has been accompanied by a decline in the quality of
72
Bringing people into the workforce = C+
Heroes Austria, Denmark,Germany, The Netherlands
Villains Hungary, Malta, Romania
Large variations in quality persist across the EU
Length of education is only one measure of a country’s performance.The quality of the education provided is harder to measure – and notstrictly captured by the Lisbon agenda’s numerical targets.Nevertheless, a number of reasonable proxies for quality exist. Oneof these is the PISA survey carried out every three years by theOECD, which tests 15 year-olds for their numeracy, literacy, abilityto solve problems and other skills. The surveys have consistentlypointed to a sharp north-south divide within the EU, and to apedestrian performance overall. Only three EU countries rank in theworld’s top ten for scientific competence or numeracy. The EU’slargest member-states – France, Germany and the UK – achieve onlymoderate scores. And the EU’s southern member-states (Greece,Italy, Portugal and Spain) are among the worst performers in everysingle test.
Similar variations in quality exist at university level. Regular surveyscarried out by the Times Higher Education Supplement andShanghai’s Jiao Tong University both reach a similar conclusion: toofew Europeans graduate from world-class universities, with onlytwo European universities (Cambridge and Oxford in the UK) in theworld’s top ten. It is, of course, possible to question the methodologyof these surveys. The Shanghai index has a strong bias towardstechnology and science and omits some of Europe’s best universitiesin subjects like economics. Nor do the surveys capture the quality ofresearch in countries such as France and Germany, where excellentwork is often carried out in institutions like the Max PlanckInstitutes and the Centre National de RechercheScientifique (CNRS). To correct these biases, theEU is developing its own rankings of worlduniversities, based on what it believes to be abetter methodology.9
The EU’s own rankings may show universities from certain EUcounties in a slightly better light. But it would be surprising if theyfundamentally altered the picture painted by existing surveys:
75
education provided. The result is that Europe increasingly resemblesa two-tier region in which a person’s economic prospects arestrongly influenced by the country he or she happens to be born in.
The numbers in education have risen
In almost every EU country, more of the population is completingsecondary education now than in 2000. In 2007 (the last year forwhich data are available), 81 per cent of 25 to 34 year-olds had atleast an upper secondary education, while among 35 to 44 year-olds it was only 75 per cent. Portugal, the country with the mostground to cover in 2000, has made good strides: 44 per cent of 25to 35 year-olds had at least an upper secondary education in2007, compared with 27 per cent of 35 to 44 year-olds. ButPortugal still has a huge distance to cover: it remains way behindthe Nordic countries, where 90 per cent of children finishsecondary education. Other EU member-states where drop-outrates have fallen but remain much too high include Italy, Spainand the UK. The poor performance of the UK is striking, given thehuge increases in public spending committed to education over thepast decade.
The number of students completing tertiary education has also risen.Across the EU, around 30 per cent of those aged 25 to 34 had auniversity degree in 2007, compared with 25 per cent among thoseaged 35 to 44. In recent years, particularly large increases inuniversity graduation rates have been posted in countries such asFrance, Ireland, Poland, Spain and Sweden. One notable exceptionto this trend is Germany, where a smaller share of students aged 25-34 have completed tertiary education than those aged 45 to 54.Variations in graduation rates across the EU remain stark. Fewerthan 20 per cent of young people graduate from university in theCzech Republic, Hungary, Italy, Portugal and Slovakia, comparedwith 40 per cent in Finland, Ireland and Sweden. But even the latterremain way behind countries like Japan and South Korea, where theproportion is more than 50 per cent.
74 The Lisbon scorecard X
9 Helena Spongenberg, ‘EUto test new university ranking in 2010’, EUObserver, January 6th 2010.
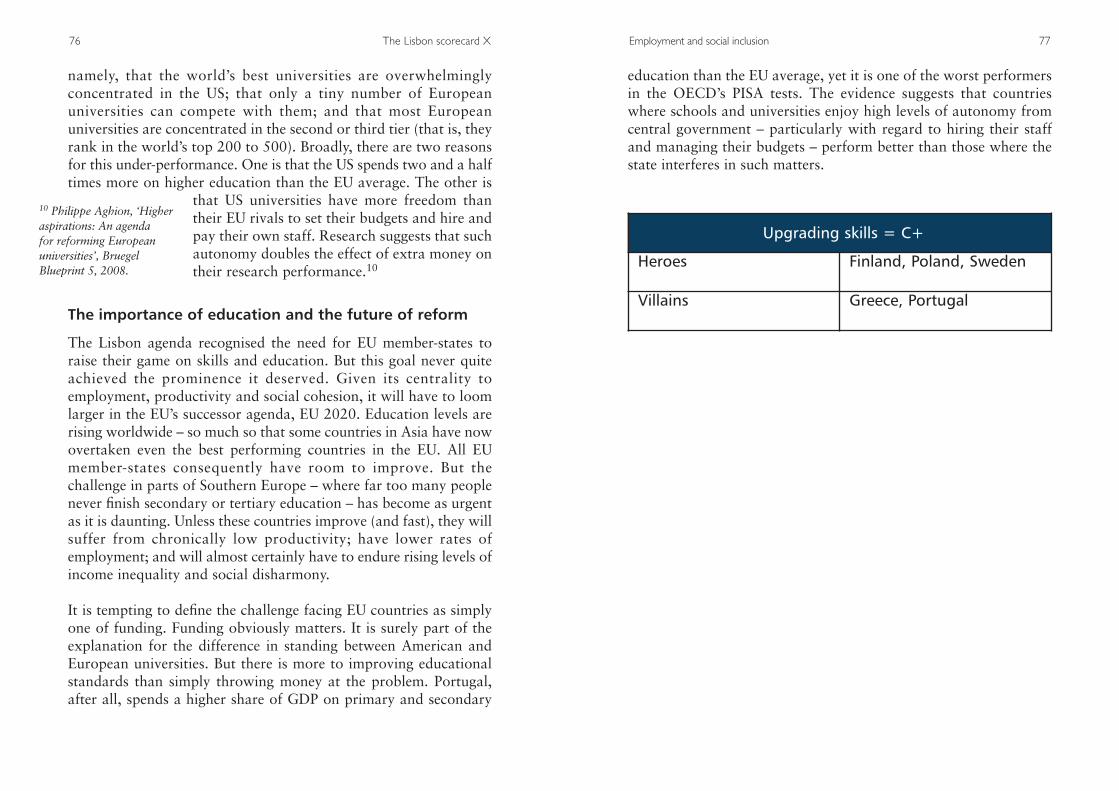
education than the EU average, yet it is one of the worst performersin the OECD’s PISA tests. The evidence suggests that countrieswhere schools and universities enjoy high levels of autonomy fromcentral government – particularly with regard to hiring their staffand managing their budgets – perform better than those where thestate interferes in such matters.
Employment and social inclusion 77
namely, that the world’s best universities are overwhelminglyconcentrated in the US; that only a tiny number of Europeanuniversities can compete with them; and that most Europeanuniversities are concentrated in the second or third tier (that is, theyrank in the world’s top 200 to 500). Broadly, there are two reasonsfor this under-performance. One is that the US spends two and a halftimes more on higher education than the EU average. The other is
that US universities have more freedom thantheir EU rivals to set their budgets and hire andpay their own staff. Research suggests that suchautonomy doubles the effect of extra money ontheir research performance.10
The importance of education and the future of reform
The Lisbon agenda recognised the need for EU member-states toraise their game on skills and education. But this goal never quiteachieved the prominence it deserved. Given its centrality toemployment, productivity and social cohesion, it will have to loomlarger in the EU’s successor agenda, EU 2020. Education levels arerising worldwide – so much so that some countries in Asia have nowovertaken even the best performing countries in the EU. All EUmember-states consequently have room to improve. But thechallenge in parts of Southern Europe – where far too many peoplenever finish secondary or tertiary education – has become as urgentas it is daunting. Unless these countries improve (and fast), they willsuffer from chronically low productivity; have lower rates ofemployment; and will almost certainly have to endure rising levels ofincome inequality and social disharmony.
It is tempting to define the challenge facing EU countries as simplyone of funding. Funding obviously matters. It is surely part of theexplanation for the difference in standing between American andEuropean universities. But there is more to improving educationalstandards than simply throwing money at the problem. Portugal,after all, spends a higher share of GDP on primary and secondary
76 The Lisbon scorecard X
10 Philippe Aghion, ‘Higheraspirations: An agenda for reforming European universities’, BruegelBlueprint 5, 2008.
Upgrading skills = C+
Heroes Finland, Poland, Sweden
Villains Greece, Portugal
D3. Modernising social protection
★ Overhaul pension systems to ensure the long-term sustainabilityof public finances
★ Increase the effective age of retirement by five years (to 65) by2010
★ Significantly reduce the number of people at risk from povertyand social exclusion
Ever since it was launched, the Lisbon agenda has suffered from theperception in some quarters that it is an assault on the social modelto which many European citizens remain attached. This perceptionis largely nonsense. For one thing, the countries which come closestto meeting their Lisbon targets – the Nordic countries, Austria andthe Netherlands – happen to produce the best social outcomes inthe EU. For another, many national welfare systems work less wellthan their supporters claim: some produce very poor socialoutcomes (in terms of high levels of poverty, income inequality andlong-term unemployment); others are little more than inter-generational Ponzi schemes that are destined to collapse owing topopulation ageing. The Lisbon agenda is therefore right to havestressed the need for social welfare systems to be modernised. Andcritics are largely wrong to see reforms of national social welfaremodels as an attack on the European way of life – much of whichis well worth defending.
Reducing poverty and social exclusion
When it was originally conceived, the Lisbon agenda contained twoprongs: a wide-ranging programme of reforms to improve thesupply-side of the economy; and a social dimension that aimed,among other things, to reduce the number of people at risk frompoverty and social exclusion. Many critics believe that these twodimensions are fundamentally incompatible; and that the socialdimension has been subordinated to the economic one, particularly
without raising the skills levels of their populations’ are highlyunlikely, therefore, to emulate Danish employment rates or socialoutcomes. As EU leaders ponder the shape of Lisbon’s successoragenda, they would do well to pay more attention to the role playedby education in producing socially cohesive societies.
Reforming pension systems
Europe’s long-term pension problem is so well-known it scarcelyneeds restating. In many EU countries, state-run pay-as-you-go(PAYG) pension systems rely on people in work to pay the pensionsof people in retirement. But populations across the EU are ageingowing to declining fertility rates and rising life expectancy. The resultis that the ranks of pensioners are set to surge at a time when thenumber of people of working age will be declining. On current trends,the EU will have two people of working age for every pensioner by2050, down from four at present. The European Commission hasestimated that in the absence of reforms, the burden of supporting anageing population with a shrinking workforce would push the ratio ofgovernment debt to GDP for the EU as a wholeabove 200 per cent by 2050.11 These projectionsare optimistic, because they predate the financialcrisis – and so take no account of the explosionof government debt resulting from it.
All EU countries face the same problem to a greater or lesser degree,although national differences in demographic trends and pensionarrangements mean that reforms are more urgent in some countriesthan in others. The largest increases in age-related governmentexpenditures are projected to be in Belgium, the Czech Republic,Hungary, Ireland, Italy, Luxembourg, Portugal, Slovenia and Spain.Sizeable increases are also expected in Denmark, Finland, France,Germany, the Netherlands, Slovakia and the UK. The challengesposed to the public finances by population ageing are notinsuperable. In essence, they require action on two fronts. The firstis to mitigate the impact of a smaller working age population by
Employment and social inclusion 81
since the agenda was revised following the report written by a groupled by Wim Kok in 2005. It is not hard to see why this belief hastaken hold. The Lisbon agenda was conceived as a programme toclose the EU’s wealth gap with the US. And since the US had higherlevels of poverty and social exclusion than the EU, it was notunreasonable to fear that the price of greater dynamism would be adeterioration of social outcomes towards US levels. Many Europeanstherefore think that they face a binary choice between dynamismand social solidarity.
A glance at the table on page 83 suggests that this belief is notreally borne out by the evidence. It is certainly true that the UK,whose product and labour markets bear some resemblance to thosein the US, suffers from higher levels of poverty and inequality thanthe EU average. However, the lowest levels of poverty and incomeinequality are in the Nordic region, where high levels of competitiongenerally prevail in markets for goods and services. And thecountries with the very worst social outcomes in the EU – Greece,Italy and Portugal – are countries whose markets for goods, servicesand labour are more highly regulated than anywhere else in the EU.In short, equitable social outcomes are not necessarily threatened bymarket liberalisation. Nor are they guaranteed by high levels ofregulation. The Lisbon agenda, with its emphasis on competitionand innovation, does imply a recalibration of existing social models.But it does not require them to be swept away.
Much of the European Commission’s attention has focused onpromoting the merits of Denmark’s model of ‘flexisecurity’ – that is,liberal labour laws allied to generous but conditional social welfarepayments. There is certainly much that other EU countries can learnfrom the success of Denmark’s model (even if cultural andinstitutional factors mean that its results may not be easilyreproducible elsewhere). But the enviable social outcomes in Denmarkrest on more than just the interaction of its labour laws with its taxand benefits system. They are also the result of its excellent educationsystem. Countries which adopt their own versions of flexisecurity
80 The Lisbon scorecard X
11 European Commission,‘The long-term sustainabilityof public finances in theEuropean Union’, 2007.
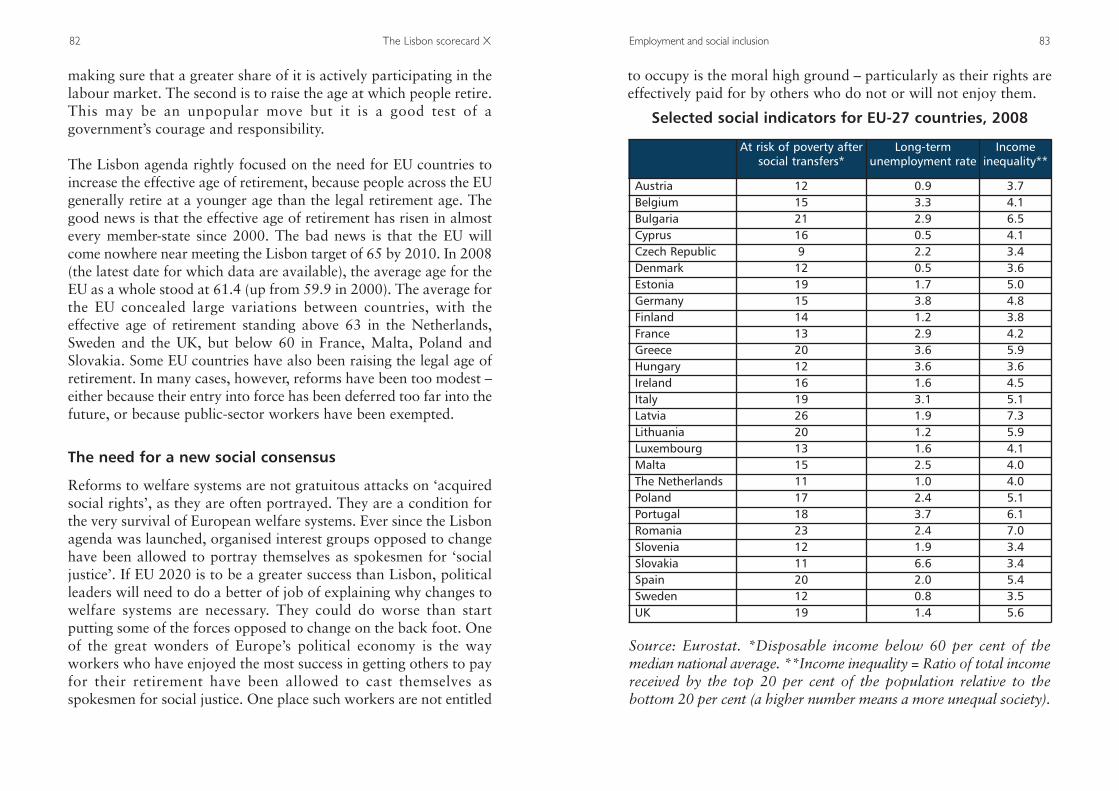
to occupy is the moral high ground – particularly as their rights areeffectively paid for by others who do not or will not enjoy them.
Employment and social inclusion 83
making sure that a greater share of it is actively participating in thelabour market. The second is to raise the age at which people retire.This may be an unpopular move but it is a good test of agovernment’s courage and responsibility.
The Lisbon agenda rightly focused on the need for EU countries toincrease the effective age of retirement, because people across the EUgenerally retire at a younger age than the legal retirement age. Thegood news is that the effective age of retirement has risen in almostevery member-state since 2000. The bad news is that the EU willcome nowhere near meeting the Lisbon target of 65 by 2010. In 2008(the latest date for which data are available), the average age for theEU as a whole stood at 61.4 (up from 59.9 in 2000). The average forthe EU concealed large variations between countries, with theeffective age of retirement standing above 63 in the Netherlands,Sweden and the UK, but below 60 in France, Malta, Poland andSlovakia. Some EU countries have also been raising the legal age ofretirement. In many cases, however, reforms have been too modest –either because their entry into force has been deferred too far into thefuture, or because public-sector workers have been exempted.
The need for a new social consensus
Reforms to welfare systems are not gratuitous attacks on ‘acquiredsocial rights’, as they are often portrayed. They are a condition forthe very survival of European welfare systems. Ever since the Lisbonagenda was launched, organised interest groups opposed to changehave been allowed to portray themselves as spokesmen for ‘socialjustice’. If EU 2020 is to be a greater success than Lisbon, politicalleaders will need to do a better of job of explaining why changes towelfare systems are necessary. They could do worse than startputting some of the forces opposed to change on the back foot. Oneof the great wonders of Europe’s political economy is the wayworkers who have enjoyed the most success in getting others to payfor their retirement have been allowed to cast themselves asspokesmen for social justice. One place such workers are not entitled
82 The Lisbon scorecard X
Selected social indicators for EU-27 countries, 2008
At risk of poverty aftersocial transfers*
Long-term unemployment rate
Incomeinequality**
Austria 12 0.9 3.7Belgium 15 3.3 4.1Bulgaria 21 2.9 6.5Cyprus 16 0.5 4.1Czech Republic 9 2.2 3.4Denmark 12 0.5 3.6Estonia 19 1.7 5.0Germany 15 3.8 4.8Finland 14 1.2 3.8France 13 2.9 4.2Greece 20 3.6 5.9Hungary 12 3.6 3.6Ireland 16 1.6 4.5Italy 19 3.1 5.1Latvia 26 1.9 7.3Lithuania 20 1.2 5.9Luxembourg 13 1.6 4.1Malta 15 2.5 4.0The Netherlands 11 1.0 4.0Poland 17 2.4 5.1Portugal 18 3.7 6.1Romania 23 2.4 7.0Slovenia 12 1.9 3.4Slovakia 11 6.6 3.4Spain 20 2.0 5.4Sweden 12 0.8 3.5UK 19 1.4 5.6
Source: Eurostat. *Disposable income below 60 per cent of themedian national average. **Income inequality = Ratio of total incomereceived by the top 20 per cent of the population relative to thebottom 20 per cent (a higher number means a more unequal society).
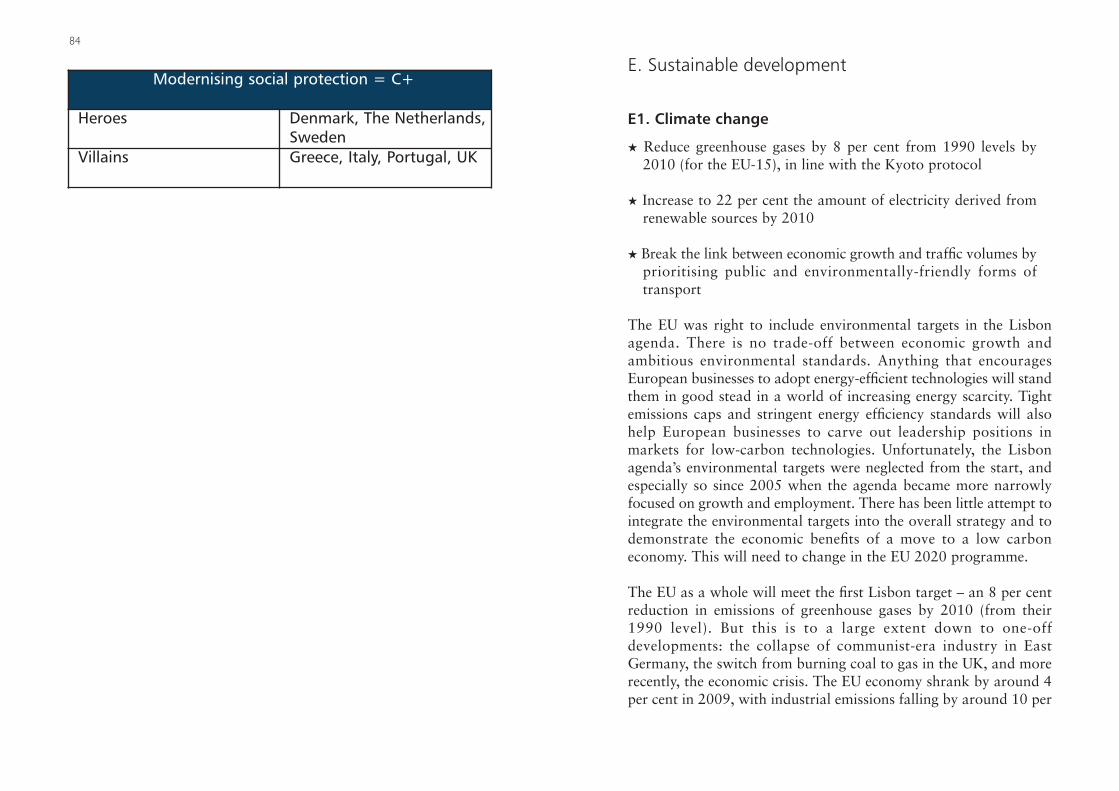
E. Sustainable development
E1. Climate change
★ Reduce greenhouse gases by 8 per cent from 1990 levels by2010 (for the EU-15), in line with the Kyoto protocol
★ Increase to 22 per cent the amount of electricity derived fromrenewable sources by 2010
★ Break the link between economic growth and traffic volumes byprioritising public and environmentally-friendly forms oftransport
The EU was right to include environmental targets in the Lisbonagenda. There is no trade-off between economic growth andambitious environmental standards. Anything that encouragesEuropean businesses to adopt energy-efficient technologies will standthem in good stead in a world of increasing energy scarcity. Tightemissions caps and stringent energy efficiency standards will alsohelp European businesses to carve out leadership positions inmarkets for low-carbon technologies. Unfortunately, the Lisbonagenda’s environmental targets were neglected from the start, andespecially so since 2005 when the agenda became more narrowlyfocused on growth and employment. There has been little attempt tointegrate the environmental targets into the overall strategy and todemonstrate the economic benefits of a move to a low carboneconomy. This will need to change in the EU 2020 programme.
The EU as a whole will meet the first Lisbon target – an 8 per centreduction in emissions of greenhouse gases by 2010 (from their1990 level). But this is to a large extent down to one-offdevelopments: the collapse of communist-era industry in EastGermany, the switch from burning coal to gas in the UK, and morerecently, the economic crisis. The EU economy shrank by around 4per cent in 2009, with industrial emissions falling by around 10 per
84
Modernising social protection = C+
Heroes Denmark, The Netherlands,Sweden
Villains Greece, Italy, Portugal, UK
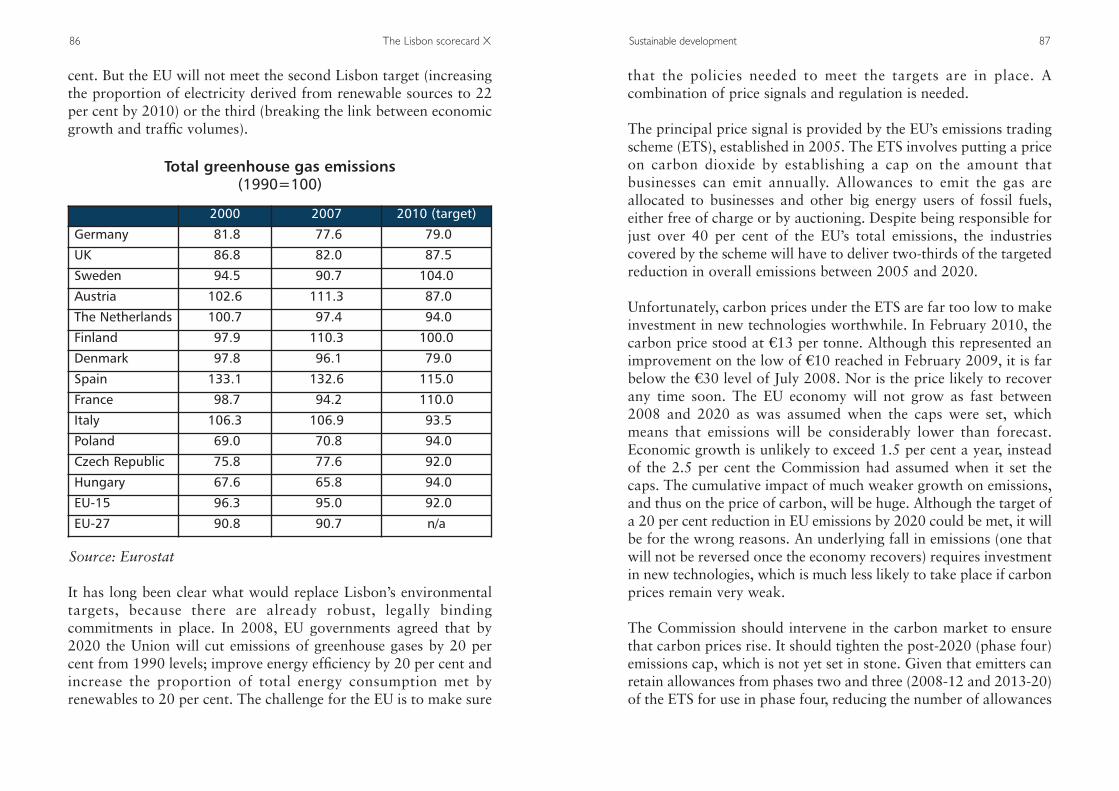
that the policies needed to meet the targets are in place. Acombination of price signals and regulation is needed.
The principal price signal is provided by the EU’s emissions tradingscheme (ETS), established in 2005. The ETS involves putting a priceon carbon dioxide by establishing a cap on the amount thatbusinesses can emit annually. Allowances to emit the gas areallocated to businesses and other big energy users of fossil fuels,either free of charge or by auctioning. Despite being responsible forjust over 40 per cent of the EU’s total emissions, the industriescovered by the scheme will have to deliver two-thirds of the targetedreduction in overall emissions between 2005 and 2020.
Unfortunately, carbon prices under the ETS are far too low to makeinvestment in new technologies worthwhile. In February 2010, thecarbon price stood at S13 per tonne. Although this represented animprovement on the low of S10 reached in February 2009, it is farbelow the S30 level of July 2008. Nor is the price likely to recoverany time soon. The EU economy will not grow as fast between2008 and 2020 as was assumed when the caps were set, whichmeans that emissions will be considerably lower than forecast.Economic growth is unlikely to exceed 1.5 per cent a year, insteadof the 2.5 per cent the Commission had assumed when it set thecaps. The cumulative impact of much weaker growth on emissions,and thus on the price of carbon, will be huge. Although the target ofa 20 per cent reduction in EU emissions by 2020 could be met, it willbe for the wrong reasons. An underlying fall in emissions (one thatwill not be reversed once the economy recovers) requires investmentin new technologies, which is much less likely to take place if carbonprices remain very weak.
The Commission should intervene in the carbon market to ensurethat carbon prices rise. It should tighten the post-2020 (phase four)emissions cap, which is not yet set in stone. Given that emitters canretain allowances from phases two and three (2008-12 and 2013-20)of the ETS for use in phase four, reducing the number of allowances
Sustainable development 87
cent. But the EU will not meet the second Lisbon target (increasingthe proportion of electricity derived from renewable sources to 22per cent by 2010) or the third (breaking the link between economicgrowth and traffic volumes).
It has long been clear what would replace Lisbon’s environmentaltargets, because there are already robust, legally bindingcommitments in place. In 2008, EU governments agreed that by2020 the Union will cut emissions of greenhouse gases by 20 percent from 1990 levels; improve energy efficiency by 20 per cent andincrease the proportion of total energy consumption met byrenewables to 20 per cent. The challenge for the EU is to make sure
86 The Lisbon scorecard X
Total greenhouse gas emissions(1990=100)
Source: Eurostat
2000 2007 2010 (target)
Germany 81.8 77.6 79.0
UK 86.8 82.0 87.5
Sweden 94.5 90.7 104.0
Austria 102.6 111.3 87.0
The Netherlands 100.7 97.4 94.0
Finland 97.9 110.3 100.0
Denmark 97.8 96.1 79.0
Spain 133.1 132.6 115.0
France 98.7 94.2 110.0
Italy 106.3 106.9 93.5
Poland 69.0 70.8 94.0
Czech Republic 75.8 77.6 92.0
Hungary 67.6 65.8 94.0
EU-15 96.3 95.0 92.0
EU-27 90.8 90.7 n/a
Stronger regulation will also be needed in order to meet theemissions targets for the sectors not covered by the ETS, which aretargeted to reduce emissions by 10 per cent between 2005 and 2020.The EU has made a good start at addressing the problem of caremissions, which after air travel is the fastest rising source ofemissions. By 2015, the range of cars produced by each carmanufacturer will on average have to emit no more than 120 gramsof carbon dioxide per kilometre, falling to 95 grams in 2020. Thistarget has spurred a lot of innovation, and is a good example of thekind of integration between the environmental and innovationtargets that is desirable. The EU’s emissions targets have effectivelybecome a source of competitive advantage.
But much more will have to be done to promote energy efficiency, inparticular in buildings, which account for about 40 per cent of theEU’s energy use. Improving the efficiency with which they use energyoffers the cheapest way of cutting emissions. In November 2009, EUgovernments finally agreed that all new buildings would have tocomply with tough energy-performance standards by 2020. Thisdeadline is far too distant; there is no justification for waiting adecade to introduce such a requirement. Moreover, no standardswere laid down for the energy performance of existing buildings. Ifsubstantive progress is to be made in reducing emissions frombuildings, the target for new buildings needs to be brought forward,and standards gradually introduced for existing buildings. This isunlikely to increase building costs by much – competition hasquickly brought down the cost of energy-efficient housing inGermany and Austria, the two EU economies that lead in this field.And the ongoing benefits in terms of much lower running costs andemissions would be enormous.
Against a backdrop of weak economic growth, poor public financesand frustration at the EU’s failure at Copenhagen, there will be noshortage of opposition to taking action to boost carbon prices ortighten regulation. In order to maintain the consensus in favour ofambitious unilateral action, the EU must demonstrate that these
Sustainable development 89
available in the post-2020 period would help to prevent furtherfalls in prices in the short term. The Commission should alsoannounce that from 2013 auctions will be subject to a minimumprice of S30. Those allowances that do not meet the reserve pricewould then be withdrawn from the market. Such a move wouldincrease carbon prices and reassure firms that prices will remain highenough to warrant investment in new technologies. One argumentagainst intervention is essentially ideological: namely, that it wouldinterfere with the working of the market. Another is thatintervention would create uncertainty: investors would come to fearthat the Commission would interfere in the market whenever it wasunhappy about the price of carbon. Both fears are exaggerated. Thecarbon market, like many others, is the product of regulation, soaltering the frame of that regulation in the light of changedcircumstances should not be considered problematic.
Price incentives on their own will not suffice to bring about theneeded investment in low-carbon technologies; the EU also needs toput in place stronger regulatory signals. The Commission was wrongto rule out including carbon dioxide in the EU’s forthcomingIndustrial Emissions Directive (IED). Including CO2 in the IED wouldhave effectively set maximum CO2 limits for power stations andother industrial plants. The Commission’s argument against doing so– that it would undermine the effectiveness of the carbon market – isunconvincing. First, it is far from clear that the ETS will work asdesired; in the absence of intervention in the market it is just aslikely that carbon prices will remain too low to stimulate investmentin low carbon technologies. Second, it is unclear why settingemissions standards for industrial plants would undermine the ETS,whereas the EU’s existing targets for renewable electricity apparentlydo not. The Commission’s opposition to member-states going it aloneand setting more stringent emissions standards for industrial plantson the grounds that it would distort competition is similarlyproblematic. It makes no sense that California has the right to set anEmissions Performance Standard but an individual EU member-statedoes not. EU governments need to challenge the legality of this.
88 The Lisbon scorecard X
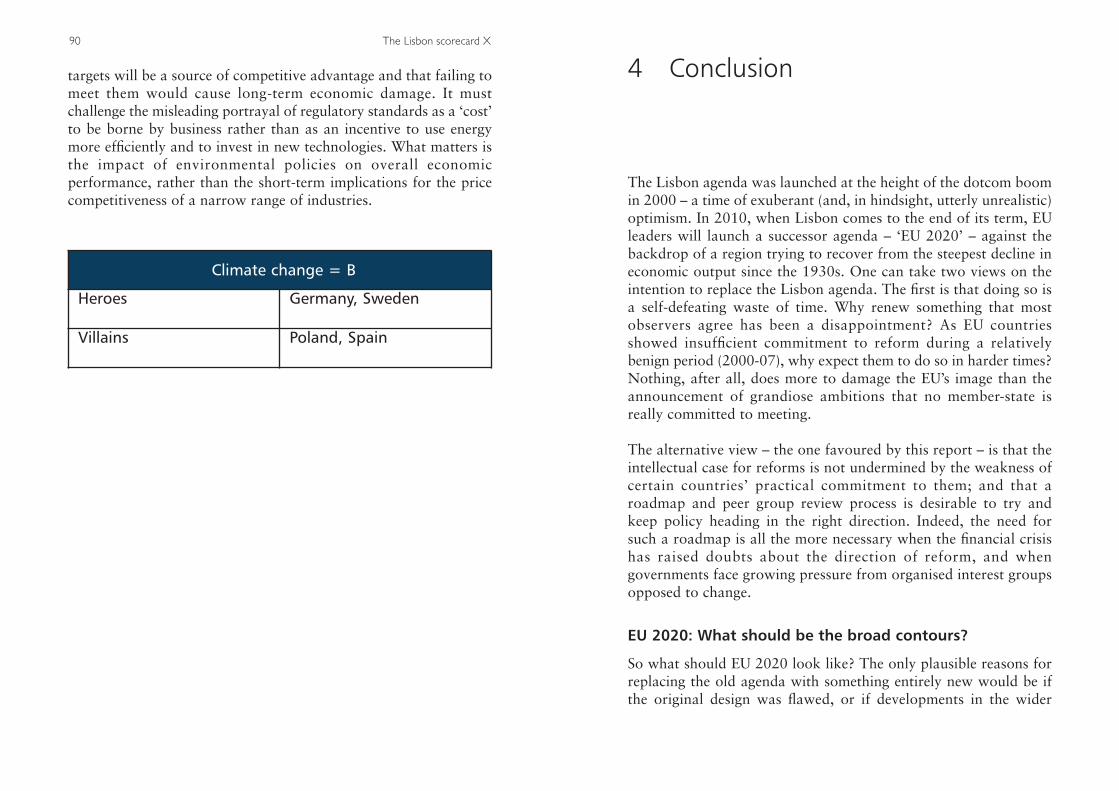
4 Conclusion
The Lisbon agenda was launched at the height of the dotcom boomin 2000 – a time of exuberant (and, in hindsight, utterly unrealistic)optimism. In 2010, when Lisbon comes to the end of its term, EUleaders will launch a successor agenda – ‘EU 2020’ – against thebackdrop of a region trying to recover from the steepest decline ineconomic output since the 1930s. One can take two views on theintention to replace the Lisbon agenda. The first is that doing so isa self-defeating waste of time. Why renew something that mostobservers agree has been a disappointment? As EU countriesshowed insufficient commitment to reform during a relativelybenign period (2000-07), why expect them to do so in harder times?Nothing, after all, does more to damage the EU’s image than theannouncement of grandiose ambitions that no member-state isreally committed to meeting.
The alternative view – the one favoured by this report – is that theintellectual case for reforms is not undermined by the weakness ofcertain countries’ practical commitment to them; and that aroadmap and peer group review process is desirable to try andkeep policy heading in the right direction. Indeed, the need forsuch a roadmap is all the more necessary when the financial crisishas raised doubts about the direction of reform, and whengovernments face growing pressure from organised interest groupsopposed to change.
EU 2020: What should be the broad contours?
So what should EU 2020 look like? The only plausible reasons forreplacing the old agenda with something entirely new would be ifthe original design was flawed, or if developments in the wider
targets will be a source of competitive advantage and that failing tomeet them would cause long-term economic damage. It mustchallenge the misleading portrayal of regulatory standards as a ‘cost’to be borne by business rather than as an incentive to use energymore efficiently and to invest in new technologies. What matters isthe impact of environmental policies on overall economicperformance, rather than the short-term implications for the pricecompetitiveness of a narrow range of industries.
90 The Lisbon scorecard X
Climate change = B
Heroes Germany, Sweden
Villains Poland, Spain
division of responsibilities: in many policy areas, theCommission cannot enforce compliance for the simple reasonthat it has no authority to do so. Barring an extension of EUcompetence to areas like education or pensions – which willnot happen – EU 2020 will suffer from similar constraints.Does this condemn EU 2020 to failure? Not necessarily. ‘Softlaw’ need not be weaker than ‘hard law’: the OECD’s PISAtests, after all, have arguably had a greater influence oncountries’ education policies than the EU’s Stability andGrowth Pact has had on their fiscal policies.
So how can governance mechanisms be improved upon in EU2020? To start with, the EU should have the courage of itsconvictions and agree to turn EU 2020 into a properbenchmarking exercise. One reason the OECD’s PISA tests hadsuch a galvanising effect was that their results were published,shocking many governments into action. If governments donot want the Commission to ‘name andshame’ (or even to ‘name and praise’),responsibility for carrying out thebenchmarking could be given to anindependent council of experts.12 The EU could also give itselfa better instrument if it reformed the EU budget, so that lessmoney is spent on agriculture and more on policies thatpromote innovation (a change that admittedly cannot enterinto force before 2014, even if its agreed). Finally, EU 2020could eschew Lisbon’s crude, ‘one size fits all’ approach and setdifferent priorities to reflect individual countries’ specificchallenges and starting positions.
★ Provide renewed impetus to the single market
The single market remains one of the EU’s great achievements.It ensures that trade is freer within the EU than between the EUand third countries. Its existence, moreover, almost certainlydampened protectionism during the brutal downturn of 2008-
Conclusion 93
world had rendered it obsolete. Developments since 2000 call formodifications to the Lisbon agenda, but they do not justify a root-and-branch overhaul of it. The global financial crisis, for example,may have raised questions about the way in which the financialsector is regulated. But it has not strengthened the case for subjectingEuropean labour markets to even more regulatory burdens. Theweakness of the Lisbon agenda was not its underlying diagnosis ofthe economic challenges facing EU countries, so much as its lack offocus and the dearth of instruments available to meet the objectivesthat it set. EU 2020 needs to be given a sharper focus than theLisbon agenda, as well as better instruments.
A credible reform programme cannot be an inventory of everythingthe EU happens to do. The central focus of EU 2020 must be ongrowth, jobs and sustainability (social and environmental). TheEU’s traditional answer to ‘Eurosclerosis’ is to deepen the singlemarket. This should remain an important objective. But it will notbe enough: it will be largely irrelevant, for example, to theincreasingly urgent, and largely national, task of improvingEuropean workers’ education levels. EU 2020 will also need toembrace a more sophisticated conception of innovation than thatwhich informed the Lisbon agenda – with less emphasis onmisleading input measures like R&D spending. Finally, if the EU2020 programme is to exert a greater influence on member-states’reform efforts than the Lisbon agenda, the EU will need to equipitself with a better method of governance.
★ Improve the method of governance
The relative failure of the Lisbon agenda is often ascribed toshortcomings in process – particularly to its reliance on the‘open method of co-ordination’ (broadly speaking, a peergroup review system) and to the absence of any mechanismsto ensure that member-states take their commitmentsseriously. While there is some truth in this criticism, theweaknesses in governance merely reflect the ‘constitutional’
92 The Lisbon scorecard X
12 Joachim Fritz-Vannahmeet al, ‘Lisbon – a secondshot’, Bertelsmann Stiftung,February 2010.
human capital will suffer from lower productivity andemployment, as well as increased income inequality and socialtensions. The Lisbon agenda rightly exhorted EU countries toimprove the quality of their human capital. But the objectivenever quite received the prominence that it deserved: thoughvastly more important, it attracted less attention than, say, theobjective of meeting the target for R&D spending. Educationmust therefore occupy a far more prominent role in EU 2020than it did in the Lisbon agenda.
It will be hard to improve human capital when governmentswill be facing acute budgetary pressures. The pressures to cutspending, particularly in the short term, will be acute – not leastas the economic and social costs of doing so will only becomeapparent in the distant future. To ensure that the supply side ofthe economy is not sacrificed to short-run considerations, itmight help if EU leaders committed themselves to discussing theissue of human capital at least once a year at one of theirsummits. The task of raising educational standards is notstraightforward, irrespective of budgetary pressures. But it iscritical that education policy over the next decade be guided bytwo lessons. The first is that modest improvements in apopulation’s education levels can have a largeimpact on economic growth further down theline.13 The second is that society gets a farbetter return on its investment if it educatespeople earlier, rather than later, in their lives.
★ Base reforms on broader understanding of innovation
Because they are already close to the ‘technological frontier’,the EU’s wealthier countries cannot rely on ‘catch-up’ growth –that is, advances in productivity driven by the adoption ofideas, technologies and working practices developed elsewhere.They must rely on innovation at home. The Lisbon agendarightly recognised the importance of innovation. But it placed
Conclusion 95
09. But the single market is not in rude health. Member-states’commitment to extending it was flagging well before thefinancial crisis – as is illustrated by the reluctance of somecountries to extend the single market to services, or to live upto their obligations in notionally liberalised sectors like energy.The crisis has dealt further blows to the single market. Thearrangements for cross-border banking have been exposed asunworkable without root-and-branch reform. And publicsupport for open markets and competition has been dented,making it harder for reticent governments to extend the singlemarket to new areas, or simply to comply with existing rules.
The EU’s single market will never be complete so long asmember-states prevent goods, services, people and capital frommoving as freely across their borders as they do within them.Strengthening the single market must therefore be a priority forEU 2020. A report on the single market will be submitted to theEuropean Commission by Mario Monti in April 2010. Itshould recommend three tasks. The first is to carry out urgentrepair work to the single market for cross-border banking. Thesecond is to extend the single market to new areas such as e-commerce. The third is to secure a political commitment fromthe member-states to support the European Commission’s rolein enforcing the commitments that they enter into. Maintainingthe integrity of the single market will be a challenging task at atime when anxious workers are likely to see increasedcompetition as a threat to their jobs.
★ Place a greater emphasis on improving human capital
Modern economies – under the twin influences of globalisationand technological change – are placing a growing premium onskilled labour relative to unskilled labour. Yet too many EUcountries are not adequately equipping their populations withthe skills that they need to thrive in the modern world. Thestakes are high. EU member-states that fail to improve their
94 The Lisbon scorecard X
13 OECD, ‘The high cost oflow educational performance’, Programmefor International StudentAssessment, 2010.
should help on both counts. But as it overhauls the way thefinancial sector is regulated and supervised, it must keep an eyeon the end-goal. The objective of reforming prudential rules isnot to abolish risk or to legislate all future crises out ofexistence. Such a goal could probably only be achieved byneutering the financial system’s ability to fulfil the task forwhich it is designed (which would be absurd). The objective ofreform must be to contain the scale of future crises (which areprobably inevitable); and to ensure, as far aspossible, that the risks are borne by thosewho take them, rather than offloaded on tothe taxpayer.15
So the EU must reform the financial system to make it moreresponsible and to increase its resilience to future shocks.However, since there is a trade-off between safety and economicgrowth, it is vital that policy-makers strike the right balance. Asthey redesign the way the financial sector is regulated andsupervised, they should not lose sight of the importance offinance in supporting the EU’s growth agenda. Well before thecrisis, for example, few EU countries had financial systems thatwere practised at funding start ups – one of the many reasonswhy innovative firms have struggled to grow as rapidly as theyhave done in the US. The need for EU countries to improve theway that start-ups were funded attracted surprisingly littleattention in the Lisbon agenda (none of the integratedguidelines for growth and jobs dealt with the issue). Thisoversight should be rectified in EU 2020.
★ Promote a broader conception of sustainability
EU 2020 would perform an invaluable function if it helpedEuropeans to accept the responsibilities that they owe toyounger (and future) generations – and provided some impetusin discharging such responsibilities. The two greatest inter-generational issues are environmental (making sure that the
Conclusion 97
too much emphasis on R&D. European politicians oftenconflate R&D with innovation. R&D is a key driver ofinnovation in manufacturing sectors such as pharmaceuticalsand automotive. But it is a poor proxy for innovation in theservice sector, which is less research-intensive (and accountsfor some three-quarters of EU GDP). In many sectors, the sortsof innovation that drive productivity growth are notdetermined by discoveries in research laboratories, but by lesstangible changes (such as the way in which businesses andgovernments organise themselves to work more efficiently).
EU 2020 should not neglect R&D. But it must move beyondLisbon’s obsessive focus with numerical R&D targets andembrace a broader conception of innovation. The mostimportant things that the EU and its member-states can do topromote innovation are to encourage greater competition,reduce support for national champions and improve thebusiness environment for start-ups. A harder question iswhether the EU should replace the Lisbon agenda’s R&Dtarget with something else, such as a broader range ofinnovation indicators. The best argument in favour of targets
is that they can encourage a degree ofcompetitive emulation among countries.14
But the limitations of targets in areas likeinnovation must be recognised: they shouldnot give governments the illusion that they
have more control than they do in practice over outputmeasures like productivity growth.
★ Repair the financial sector without damaging its ability to fundgrowth
Europe needs a less leveraged and more stable financial sector.It also needs major improvements to the way cross-borderbanks are supervised if the single market in financial services isto survive. The EU is pushing through a raft of measures that
96 The Lisbon scorecard X
14 Ann Mettler, ‘Innovatingindicators: Choosing theright targets for EU 2020’,The Lisbon Council,04/2009.
15 Philip Whyte, ‘How torestore financial stability’,CER report, January 2010.

climate is still tolerable a few decades hence) and social (makingsure that future generations are not saddled with unbearablepension liabilities built up by those currently in work). In theirminds at least, Europeans have made great headway over thepast decade in accepting the first responsibility. Even if theystruggle to meet them, governments have at least felt able to setchallenging targets on emissions reductions which theirpopulations support (in principle, at any rate). What manyEuropeans still seem reluctant to accept is the second dimensionof sustainability: the social one.
Europeans often think of ‘social rights’ as sacred cows thatcannot be touched. The trouble is that some of these rights areeffectively exercised at others’ expense. A large number ofpeople currently in work, for example, think of their pensionentitlements as ‘acquired’ social rights – despite the fact thatthese impose huge unfunded liabilities on future generationswho will certainly never enjoy comparable rights. EU 2020should help to spread a more responsible and sustainableconception of social justice which recognises the crucialimportance of the inter-generational dimension. Interest groupswho present themselves as spokesmen for social justice shouldbe made to explain the consequences of their positions forfuture generations. And those who cannot provide asatisfactory answer to the question should not be allowed tooccupy the moral high ground.
Overall assesment of results: C
★
98 The Lisbon scorecard X
The scorecard table
★
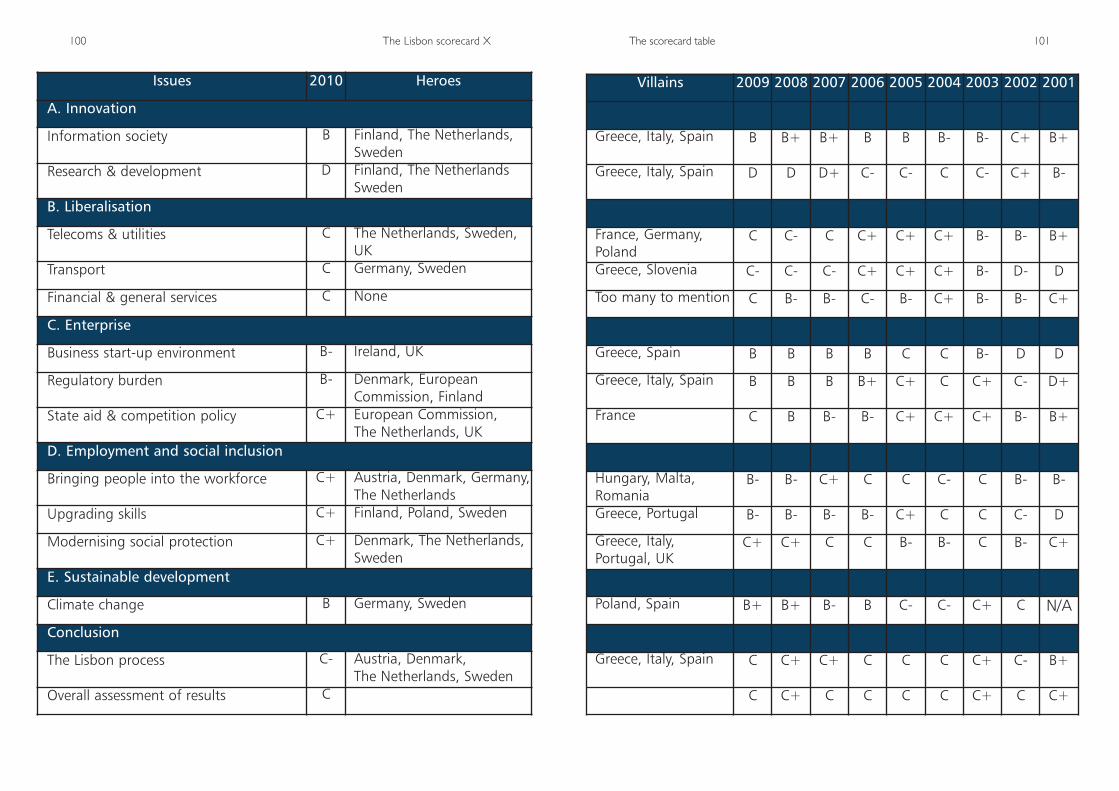
The scorecard table 101100 The Lisbon scorecard X
Issues 2010 Heroes
A. Innovation
Information society B Finland, The Netherlands,Sweden
Research & development D Finland, The NetherlandsSweden
B. Liberalisation
Telecoms & utilities C The Netherlands, Sweden,UK
Transport C Germany, Sweden
Financial & general services C None
C. Enterprise
Business start-up environment B- Ireland, UK
Regulatory burden B- Denmark, EuropeanCommission, Finland
State aid & competition policy C+ European Commission, The Netherlands, UK
D. Employment and social inclusion
Bringing people into the workforce C+ Austria, Denmark, Germany,The Netherlands
Upgrading skills C+ Finland, Poland, Sweden
Modernising social protection C+ Denmark, The Netherlands,Sweden
E. Sustainable development
Climate change B Germany, Sweden
Conclusion
The Lisbon process C- Austria, Denmark, The Netherlands, Sweden
Overall assessment of results C
Villains 2009 2008 2007 2006 2005 2004 2003 2002 2001
Greece, Italy, Spain B B+ B+ B B B- B- C+ B+
Greece, Italy, Spain D D D+ C- C- C C- C+ B-
France, Germany,Poland
C C- C C+ C+ C+ B- B- B+
Greece, Slovenia C- C- C- C+ C+ C+ B- D- D
Too many to mention C B- B- C- B- C+ B- B- C+
Greece, Spain B B B B C C B- D D
Greece, Italy, Spain B B B B+ C+ C C+ C- D+
France C B B- B- C+ C+ C+ B- B+
Hungary, Malta,Romania
B- B- C+ C C C- C B- B-
Greece, Portugal B- B- B- B- C+ C C C- D
Greece, Italy,Portugal, UK
C+ C+ C C B- B- C B- C+
Poland, Spain B+ B+ B- B C- C- C+ C N/A
Greece, Italy, Spain C C+ C+ C C C C+ C- B+
C C+ C C C C C+ C C+
★ Carbon capture and storage: What the EU needs to do Report by Stephen Tindale with Simon Tilford (February 2010)
★ Can and should the EU and Russia reset their relationship? Policy brief by Katinka Barysch (February 2010)
★ The new Commission’s economic philosophy Policy brief by Katinka Barysch, Charles Grant, Simon Tilford and Philip Whyte(February 2010)
★ Can Turkey combine EU accession and regional leadership? Policy brief by Katinka Barysch (January 2010)
★ How to restore financial stabilityReport by Philip Whyte (January 2010)
★ Cameron’s Europe: Can the Conservatives achieve their EU objectives?Essay by Charles Grant (December 2009)
★ NATO, Russia and Europe’s securityWorking paper by Tomas Valasek (November 2009)
★ Making choices over China: EU-China co-operation on energy and climatePolicy brief by Nick Mabey (November 2009)
★ Rebalancing the Chinese economyPolicy brief by Simon Tilford (November 2009)
★ How strong is Russia’s economic foundation?Policy brief by Pekka Sutela (October 2009)
★ How to meet the EU’s 2020 renewables targetPolicy brief by Stephen Tindale (September 2009)
★ Intelligence, emergencies and foreign policy: The EU’s role in counter-terrorismEssay by Hugo Brady (July 2009)
★ Is Europe doomed to fail as a power?Essay by Charles Grant (July 2009)
★ Medvedev and the new European security architecturePolicy brief by Bobo Lo (July 2009)
★ Multilateralism light: The rise of informal international governanceEssay by Risto Penttila (July 2009)
Available from the Centre for European Reform (CER), 14 Great College Street, London, SW1P 3RXTelephone +44 20 7233 1199, Facsimile +44 20 7233 1117, [email protected], www.cer.org.ukCOVER IMAGE: STEVE CHADBURN: [email protected]

THE LISBON SCORECARD XThe road to 2020
Simon Tilford and Philip Whyte
The EU’s Lisbon agenda has failed to deliver what it promised.Although most member-states have made some progress towardsthe targets they set themselves in 2000, their commitment toreform has been half-hearted. This leaves few EU countries well-placed to thrive economically. With public finances in a parlousstate following the financial crisis, population ageing kicking in,and strains emerging in the eurozone, the EU must provide newimpetus to supply-side reforms. The new EU 2020 agenda needsa stronger method of governance – with public rankings ofcountries’ performance – and should pay greater attention toskills and innovation.
Simon Tilford is chief economist and Philip Whyte is a seniorresearch fellow at the Centre for European Reform.
ISBN 978 1 901229 96 7 ★ £10/G16