Embed Size (px)
Citation preview
NBER WORKING PAPER SERIES
THE LONG-TERM COGNITIVE AND SCHOOLING EFFECTS OF CHILDHOOD VACCINATIONS IN CHINA
Hamid R. OskorouchiAlfonso Sousa-Poza
David E. Bloom
Working Paper 27217http://www.nber.org/papers/w27217
NATIONAL BUREAU OF ECONOMIC RESEARCH1050 Massachusetts Avenue
Cambridge, MA 02138May 2020
Research reported in this working paper was supported by the National Institute on Aging of the National Institutes of Health (Award Number P30AG024409) and also by the Value of Vaccination Research Network (VoVRN), which is funded by a grant from the Bill & Melinda Gates Foundation (Grant OPP1158136). The content is solely the responsibility of the authors and does not necessarily reflect the official views of the National Institutes of Health, the VoVRN, or the Bill & Melinda Gates Foundation. We are also grateful to Arindam Nandi and Silvio Traverso for their comments and suggestions on an earlier version of this manuscript. The views expressed herein are those of the authors and do not necessarily reflect the views of the National Bureau of Economic Research.
NBER working papers are circulated for discussion and comment purposes. They have not been peer-reviewed or been subject to the review by the NBER Board of Directors that accompanies official NBER publications.
© 2020 by Hamid R. Oskorouchi, Alfonso Sousa-Poza, and David E. Bloom. All rights reserved. Short sections of text, not to exceed two paragraphs, may be quoted without explicit permission provided that full credit, including © notice, is given to the source.
The Long-Term Cognitive and Schooling Effects of Childhood Vaccinations in ChinaHamid R. Oskorouchi, Alfonso Sousa-Poza, and David E. BloomNBER Working Paper No. 27217May 2020JEL No. I12,I18,I21
ABSTRACT
By exploiting rich retrospective data on childhood immunization, socioeconomics, and health status in China (the China Health and Retirement Longitudinal Study), we assess the long-term effects of childhood vaccination on cognitive and educational outcomes in that country. To do so, we apply various techniques (e.g., propensity score and coarsened exact matching and correlated random effects) to different sets of conditioning variables and subsamples to estimate the average treatment on the treated effect of childhood vaccination. Our results confirm that vaccinations before the age of 15 have long-term positive and economically meaningful effects on nonhealth outcomes such as education and cognitive skills. These effects are relatively strong, with vaccinated individuals enjoying about one more year of schooling and performing substantially better later in life on several cognitive tests.
Hamid R. OskorouchiInternational Food Economics and Rural DevelopmentUniversity of GöttingenGermanyand University of [email protected]
Alfonso Sousa-PozaInstitute for Health Care & Public ManagementUniversity of Hohenheim Germanyand Xi’an Jiaotong [email protected]
David E. BloomHarvard T.H. Chan School of Public HealthDepartment of Global Health and Population665 Huntington Ave.Building 1, Suite 1202Boston, MA 02115and [email protected]
2
1. Introduction
A review of 108 studies from 51 low- and middle-income countries amply demonstrates the economic benefits
of vaccinations (Ozawa et al. 2012), estimating the cost of such immunization benefits as disease prevention
and herd immunity to be less than USD1,000 per averted DALY. In addition, a growing number of
epidemiological, immunological, and clinical studies indicate positive vaccine effects well beyond the intended
disease protection (Benn et al. 2013, Saadatian-Elahi et al. 2016), including heterologous nonspecific
protection via immune system training or induction of cross-reactive T-cells (Andersen et al. 2018). Because
these nonspecific effects may be relatively substantial, they are just as—or even more—important for child
mortality than specific vaccine effects (Benn et al. 2013). Hence, in assessing the effects of childhood
vaccination on cognitive and schooling outcomes in late adulthood, we define as indirect any that affect
nonhealth status outcomes (i.e., education and cognitive abilities) regardless of whether induced via targeted
disease prevention (specific effects) or immune system boosting (nonspecific effects). The primary channel
through which childhood vaccinations influence cognition and schooling is improved child health, which can
raise educational outcomes through increased school attendance and achievement (Nandi, Shet, et al. 2019).
The latter, in turn, can enhance cognitive skills not only in childhood, but also in later life, as the well-
documented association between schooling and old-age cognitive outcomes suggests (e.g., memory disorders;
Glymour et al. 2008). A more direct effect of childhood health on cognitive skills relates to the detrimental
effects of illnesses and stress on the hippocampus, which can negatively affect episodic memory performance
in later life (Evans and Schamberg 2009, Hassevoort et al. 2016).
Our selected research setting of China provides a unique opportunity to assess childhood vaccination effects
on late adulthood cognitive and educational outcomes because before Mao and the Chinese Communist Party
assumed state power in 1949 (commonly termed the “Liberation”), immunization was extremely limited,
infectious diseases extremely serious and difficult to control (Liang and Liu 2019a), and preventive medicine
almost nonexistent in most of the country (Sidel and Sidel 1975). In 1950, however, the Ministry of Health
oversaw a free smallpox vaccination campaign that achieved around 90% coverage nationwide within 3 years,
followed in 1953 and 1954 by child vaccination directives against diphtheria toxoid and tuberculosis,
respectively, together with accelerated research on vaccine development for all high-mortality infections. A
key factor in the success of these campaigns was mass mobilization (World Bank 1984) driven by a Party
policy that medicine should serve the needs of workers, peasants, and soldiers alike (Sidel and Sidel 1975),
with preventive intervention prioritized over therapeutic. During the Cultural Revolution (1965–1975),
however, immunization campaigns broke down because of a seriously depleted number of health technicians
and lagging immunization oversight, resulting in poor or disrupted vaccination management (Liang and Liu
2019b). As a result, unlike vaccination practices in Europe and the United States, childhood immunization
among older adults in China is nowhere near universal, providing the treatment variation necessary for the
implementation of econometric techniques. The Chinese setting is doubly interesting in that its older
populations often lack the high levels of cognitive ability inherently necessary for sound financial (and health)
3
outcomes, while also having no access to specialist advice on such topics (Lei et al. 2014). At the same time,
the threat to eldercare provision posed by past fertility reductions and migration patterns that increasingly
separate parents geographically from their adult children make the promotion of cognitive health in China
particularly important (Smith, Strauss, and Zhao 2014).
Our analysis, which draws on the China Health and Retirement Longitudinal Study (CHARLS), is to our
knowledge the first comprehensive examination of the long-lasting effects of childhood vaccination on
educational and cognitive outcomes in later adulthood. To measure these effects, we exploit a rich set of
cognitive ability and schooling completion variables together with retrospective information on individual life
histories, including vaccinations, and socioeconomic and health status during childhood. In estimating the
average treatment on the treated effect (ATT) of childhood vaccination, we apply various techniques
(propensity score and coarsened exact matching and correlated random effects) to different sets of conditioning
variables and subsamples. Our results confirm that early life vaccination has long-term positive and
economically meaningful effects on nonhealth outcomes such as educational achievement and cognitive skills.
These effects are relatively strong, with vaccinated individuals enjoying about one more year of schooling and
performing substantially better in later life on cognitive tests.
2. Literature Review
Whereas most literature on the effects of childhood vaccination focuses on child mortality rather than other
outcomes, some recent studies do address the effects on cognitive and schooling outcomes. For example, in
addition to inducing a 7.4 percentage point increase in male school enrollment probability in Bangladesh—
albeit with no apparent effect for females (Driessen et al. 2015)—age-appropriate measles vaccination
improves school grades in South Africa and enhances child anthropometry, cognition, and schooling outcomes
in Ethiopia, India, and Vietnam relative to nonvaccinated children (Nandi, Shet, et al. 2019). Likewise, a study
of the associations among these three outcomes and Hib vaccination in India documents significantly higher
scores for vaccinated children on English, mathematics, reading, the Peabody Picture Vocabulary tests, and
school grades, and higher z-scores for height-for-age (HAZ) and BMI-for-age (BMIZ; Nandi, Deolalikar, et
al. 2019). This same pattern is observable among Filipino children given full childhood vaccination against
measles; polio; tuberculosis (TB); and diphtheria, pertussis, and tetanus (DPT) (Bloom, Canning, and Shenoy
(2011). Nandi et al. (2020) show that schooling attainment among young adults was improved (by about 0.25
grades) by exposure to India’s Universal Immunization Programme (UIP), which took place between 1985
and 1990. Similarly, Anekwe et al. (2015) show that immunization increases years of schooling of young South
Africans (6–11 years old) by 0.20 grades.
Not only do the aforementioned findings underscore vaccination’s potential long-term benefits for cognition
and schooling, but a large body of economics literature documents the financial benefits of good childhood
health (e.g., Case, Fertig, and Paxson 2005, Smith 2009). For example, Case, Fertig, and Paxson (2005) show
that even after they control for parental socioeconomic characteristics, those who experience poor health as
4
children not only have poorer health as adults but also have significantly lower educational attainment and
lower social status. Given the strength of these predominantly beneficial vaccine effects (both specific and
nonspecific) on child health, such benefits could be expected to last the lifetime. Yet aside from the already
cited studies, we know of no studies that assess the longer-lasting effects of vaccines, particularly those on
nonhealth outcomes like cognitive ability and educational achievement. The only exception is the study of
Nandi et al. (2020), which assesses how a specific vaccine affects adult education (adults aged between 20 and
49 years), but it neither investigates the effects on cognitive abilities, nor does focus on elderly individuals.
Even the studies already referenced adopt a relatively short-term perspective by focusing primarily on
outcomes in late childhood up to early adolescence rather than assessing the potential long-term effects in late
adulthood.
Although this lack of empirical evidence on vaccination’s long-term effects is no doubt related to the
methodological challenges of identifying causal relations between childhood vaccines and later life outcomes,
the randomized trials that should ideally be used to assess such effects are often very difficult to implement,
especially many years after the original exposure (Barnighausen et al. 2014). Even the potential alternative of
observational studies may suffer from selection bias if vaccine recipients differ from nonrecipients in ways
that relate to the outcome variable independent of vaccination (Fine et al. 2009), prompting several researchers
to mitigate this problem by using quasi-experimental propensity score matching (PSM; (e.g., Nandi, Shet, et
al. 2019, Nandi, Deolalikar, et al. 2019, Bloom, Canning, and Shenoy 2011). Another way to avoid selection
bias is to exploit natural experiments such as the introduction of universal vaccination programs, which
guarantee that access to vaccines is independent of such bias-inducing factors as household wealth, parental
education, and health insurance coverage (Andersen et al. 2018). An additional challenge when assessing
vaccination’s long-term implications is the widespread unavailability of precise childhood vaccination data for
older adults. Our analysis thus makes a valuable contribution to the literature, not only by being one of the first
to document the long-lasting effects of childhood vaccination on educational and cognitive outcomes, but also
by applying a combination of techniques to limit possible biases. Our combination of several matching
techniques with correlated random effects (CRE) regression, in particular, exploits the panel data structure to
limit any possible skewing from time-invariant individual-level unobserved heterogeneity.
3. Materials and Methods
3.1 Data
Our data are drawn from CHARLS, a longitudinal survey representative of the Chinese population over age
45, which in addition to basic demographics collects information on the socioeconomic determinants of aging,
including physical and physiological health. Our analysis uses both the three standard CHARLS waves (2011,
2013, and 2015) and a 2014 retrospective wave that provides family information; work history; and data on
childhood education, health, and wealth status. In the main analysis of this study we retain only the
observations for those aged less than or equal to 80 years old, but we report the results using the full sample in
the Appendix. Excluding the so-called “super healthy” individuals from the sample is common in studies on
5
elderly populations (c.f. Abeliansky and Strulik 2018), and it is done to limit selective mortality-related biases.
In fact, especially for the case of China individuals older than 90 years old in our sample surpassed their life
expectancy at birth.
Dependent variables. To estimate the long-term effects of childhood vaccination on cognitive abilities and
education, we exploit episodic memory, mental status, and years of schooling as reflected by the cognitive
ability measures in the three regular waves of the CHARLS panel data (see Table A.1 for the corresponding
survey items). Specialized personnel collect these cognition measures, which match those used in
internationally comparable surveys of older adults (e.g., Survey of Health and Retirement in Europe, also
known as SHARE), with individual daily life reasoning abilities captured by episodic memory in the form of
immediate and delayed recall. For these two variables, an enumerator reads a list of 10 Chinese nouns and then
counts how many words on the list an individual can recall immediately and then four minutes later,
respectively. For the purposes of our study, we transform these measures from count to quasi-normally
distributed variables by computing the share of correctly recalled nouns out of the total listed (with the
corresponding ATTs interpreted as the probability of correctly recalling all 10).
The second set of CHARLS cognitive ability measures, which comprises items from the Telephone Interview
of Cognitive Status (TICS) study, proxies mental status by the ability to (i) name the day’s date (year, month,
day, and day of the week), (ii) redraw a picture, and (iii) count down from 100 by sevens up to five times
(serial 7 subtraction, as a proxy for numeracy). Our econometric models employ this set of mental status
variables (except for serial 7) in their original dichotomous form with a value of one indicating individual
success on a specific task (zero otherwise). We then aggregate the episodic memory and mental status variables
into two indicators representing the number of successfully accomplished tasks over the entire cognitive ability
test (cf. McArdle, Smith, and Willis 2009). Lastly, because CHARLS specifies only a categorical variable for
highest educational level achieved rather than exact years of formal education, we compute years of schooling
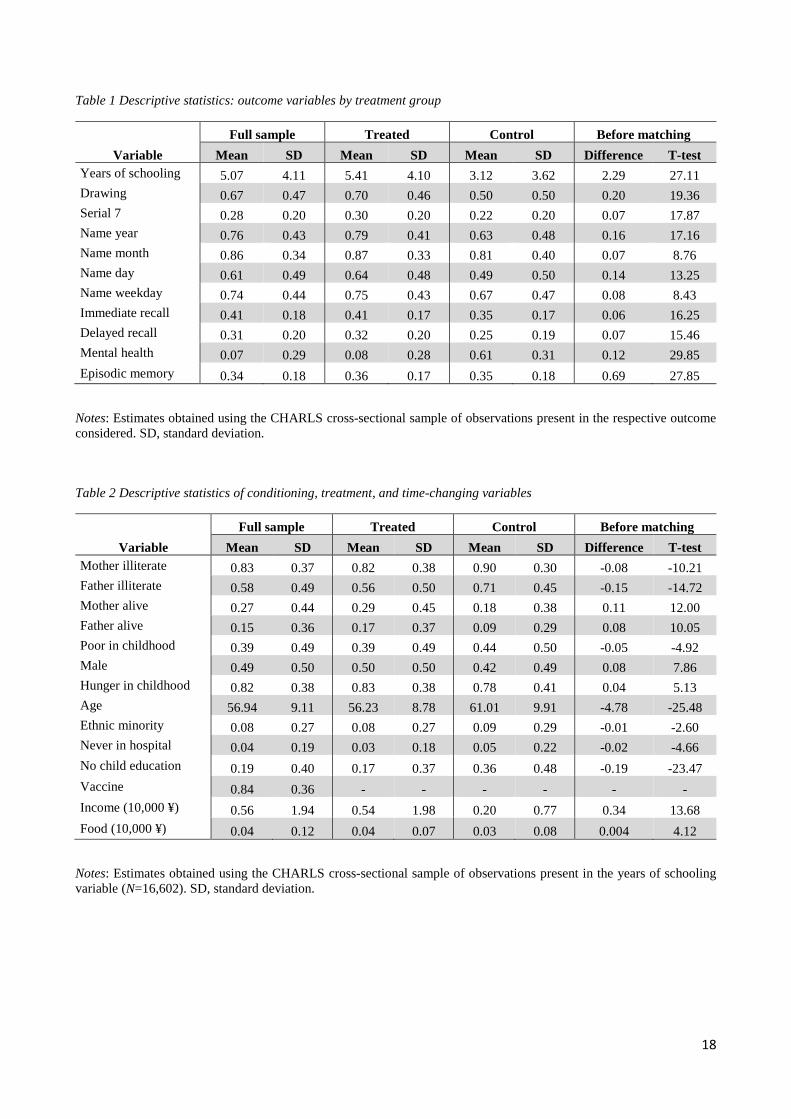
by converting this level into actual years (cf. Molina 2016). According to Table 1, which reports the descriptive
statistics for all the outcome variables measured, the treated respondents are always better off in terms of years
of schooling, numeracy, episodic memory, and general mental status.
[Table 1 about here]
Main independent variable. The treatment in our models is childhood vaccination (i.e., before age 15),
determined based on a corresponding item in the 2014 CHARLS retrospective wave, coded as one for
vaccinated individuals (before age 15) and zero for unvaccinated, of which the latter comprise 36% of our
sample (see Table 2). Unfortunately, because CHARLS provides no information on vaccination type and exact
timing, we cannot construct variables that proxy vaccine-specific exposure, which would have allowed us to
disentangle the biological mechanisms underlying our results. Nonetheless, knowing the timeline of vaccine
introduction in China and exploiting the representativeness of our sample for older adults, we are able to
narrow the pool of vaccines responsible for any positive effects on education and cognitive abilities. That is,
given China’s vaccine licensure timeline (Zheng et al. 2018) and our youngest respondent’s 1970 birth year,
6
the treatment group primarily received the antitubercular bacillus Calmette-Guérin (BCG, 1937); vaccines
against plague (1946), yellow fever (1954), poliovirus (OPV, 1961), and measles (ML-L, 1965); and possibly
the combined DTP immunization (1973).
[Table 2 about here]
Conditioning variables for PSM. For our PSM conditioning variables, we select a set of predictors of childhood
vaccination probability whose vector includes demographic and childhood socioeconomic measures and
parental characteristics (see Table A.2 for the corresponding CHARLS life history questions). These variables,
together with their descriptive statistics and exogeneity with respect to the treatment variable, are detailed in
the following Methods subsection.
Time-variant controls. To estimate the CRE models, we employ individual income and household food
expenditure (per capita) as time-variant controls (in addition to age), derived from the CHARLS personal
income and wealth and household expenditure modules, respectively, of which the latter include both
purchased and self-produced food consumption. We correct both variables for inflation levels using the
consumer price index (base year = 2010).
3.2 Methods
The challenge in disentangling childhood vaccinations’ long-term nonspecific effects on later life outcomes is
that the parental attributes, of which childhood vaccination status is a function, might also determine better
human and health capital in adulthood. Specifically, because the treatment (i.e., vaccination) is not randomly
assigned, a naïve OLS model would produce upwardly biased estimates of the vaccination effect on the
outcome variables studied. To avoid this bias, we employ a PSM technique that ensures the potential outcome’s
conditional independence by minimizing prevaccination background differences between the treatment and
control groups to enable estimation of a causal ATT of childhood vaccination on human capital and later-life
cognition. Although most Chinese in our sample were probably vaccinated in one of the nationwide
immunization campaigns, two methodological considerations prevent us from exploiting these events as quasi-
natural experiments. First, because household socioeconomics and parental beliefs determine vaccination
probability even when access is universally provided and incentivized, an empirical model unable to rely on
random treatment assignment will produce biased estimates. Second, if the survey provides no precise
information on immunization campaign enrollment, the timing of these events alone will not allow precise
identification of the treated units (e.g., by exploiting birth year) because inoculation is not mandatory and
applies to different age groups depending on the specific vaccine type and related campaign design.
Our PSM strategy thus first estimates vaccination probability on a set of regressors that proxy treatment
probability while being exogenous to the treatment (e.g., household demographics and socioeconomic status
in childhood). Then, retaining only those individuals who share a common support region, we estimate the
ATT by alternatively applying k-nearest neighbor (k-NN), kernel, and Mahalanobis distance algorithms or by
running OLS regressions that correct for potential bias via inverse probability of treatment weighting. In
7
addition to PSM, we also estimate the childhood vaccination effect on educational and cognitive outcomes
using an exact matching technique and exploit CHARLS’s longitudinal structure by applying a correlated
random effects model. Lastly, we test the robustness of our matching strategies through a series of placebo
tests using outcome variables that are impervious to the treatment but strongly related to parental investment
in children and adult attitudes toward health risk behaviors.
3.3 Matching Strategy
For a matching technique to produce unbiased ATT estimates, three assumptions must hold: First, to meet the
balancing property (eq. 1), the groups of treated (D=1) and control (D=0) observations with the same
propensity score e(x) must be similar in their distribution of observable covariates x (Rosenbaum and Rubin
1983):
Pr{𝑥|𝐷 = 1, 𝑒(𝑥)} = Pr{𝑥|𝐷 = 0, 𝑒(𝑥)} (1)
Second, the matching must satisfy the conditional independence assumption (CIA) that given a set of
explanatory variables x that the treatment does not affect, the potential outcomes Y(0) and Y(1) are independent
of treatment assignment D=0,1 (Caliendo and Kopeinig 2008):
𝑌(0), 𝑌(1) ⫫ 𝐷|𝑥 = 𝑌(0), 𝑌(1) ⫫ 𝐷|𝑒(𝑥) (2)
In the case of one continuous or multiple conditioning variable(s), the CIA (eq. 2, left side) is equally satisfied
when the potential outcomes are independent of the treatment conditional on the propensity score (eq. 2, right
side) (Rosenbaum and Rubin 1983). Lastly, for each treated observation a control observation with a similar x
or e(x) must exist (Heckman, Ichimura, and Todd 1998), and if the analysis includes individuals outside the
common support, the difference between the observed outcomes of the treatment and control groups are likely
to be biased.
0 < Pr(𝐷 = 1|𝑥) < 1
Because the aforementioned constraints imply that the choice of propensity score conditioning variables is
crucial to producing unbiased ATT estimates, we carefully select a set of explanatory variables that are
impervious to the vaccination treatment while simultaneously determining the probability of immunization.
This choice relies on a combination of the extant applied literature on vaccination determinants (e.g., Bloom,
Canning, and Shenoy 2011) and the variables that best describe the Chinese context. We then estimate the
propensity score by first running a set of probit regressions and then limiting any potential selection issue
related to missing values by performing an independent PSM procedure for each outcome variable.
The explanatory variables selected are parental characteristics (both mother and father being illiterate and alive
at the time of the most recent interview), demographic characteristics (gender, age, member of an ethnic
minority group, and fixed effects for birth year), and health care access and socioeconomic status during
childhood, as reflected by perceived socioeconomic status, experience of hunger, and no education before age
8
15 (see Tables 2 and A.2 for variable descriptions). Although the original data characterize parental education
by the highest formal schooling completed, more than 90% of the parents sampled have zero education or
completed no primary schooling at all, prompting us to instead construct a dummy variable for literacy. We
also construct a probit model that includes all possible interactions between the aforementioned regressors,
except for birth year dummies. Because no probit conditioning variables (except age and mother and father
being alive) vary in time, using the pooled panel sample for the propensity score computations has no
advantage. In fact, given the slightly unbalanced nature of this panel dataset, all propensity score estimations
use cross-sectional data that include each individual only once regardless of the number of waves in which the
respondent was interviewed. The matching-based ATT estimations, in contrast, employ the full (pooled or
longitudinal) sample.
Three aspects of our methodology give us confidence in the goodness of the conditioning variables, the first
being our use of the predictive power of characteristics imbued at birth and not subsequently modifiable (e.g.,
age, gender, and ethnic minority membership) or impervious to the effects of childhood vaccination
(mother/father literacy and mortality). The second is our use of variables that proxy socioeconomic status
(poverty and hunger) under age 15, a period of probable economic inactivity, meaning that childhood
vaccinations would not affect the family’s economic status. The last is our proxying of both parental investment
in child education and access to health care at the extensive margin (i.e., no education before age 15 and never
seen by a doctor).
Although we can safely assume that childhood immunization status cannot be the cause of never having seen
a doctor (especially in a sample of older adults), the exogeneity of the variable proxying childhood education
must be carefully assessed. That is, some extant research suggests that certain vaccines (e.g., anti-influenza)
improve school attendance (Pannaraj et al. 2014) and measles vaccine could increase the probability of school
enrollment (Driessen et al. 2015), so even though we know of no studies demonstrating a vaccination effect
on adult literacy, in rare cases of chronic disease (especially at the start of primary school), a lack of
immunization could hypothetically translate into no formal education at all. Note also that 3% of those having
no formal education before age 15 reported receiving 1−9 years of schooling in adulthood. The direction of
the bias caused by including the potentially endogenous child education proxy among the set of conditioning
variables would only lead to understated effects of childhood vaccination. Hence, to avoid any violation of the
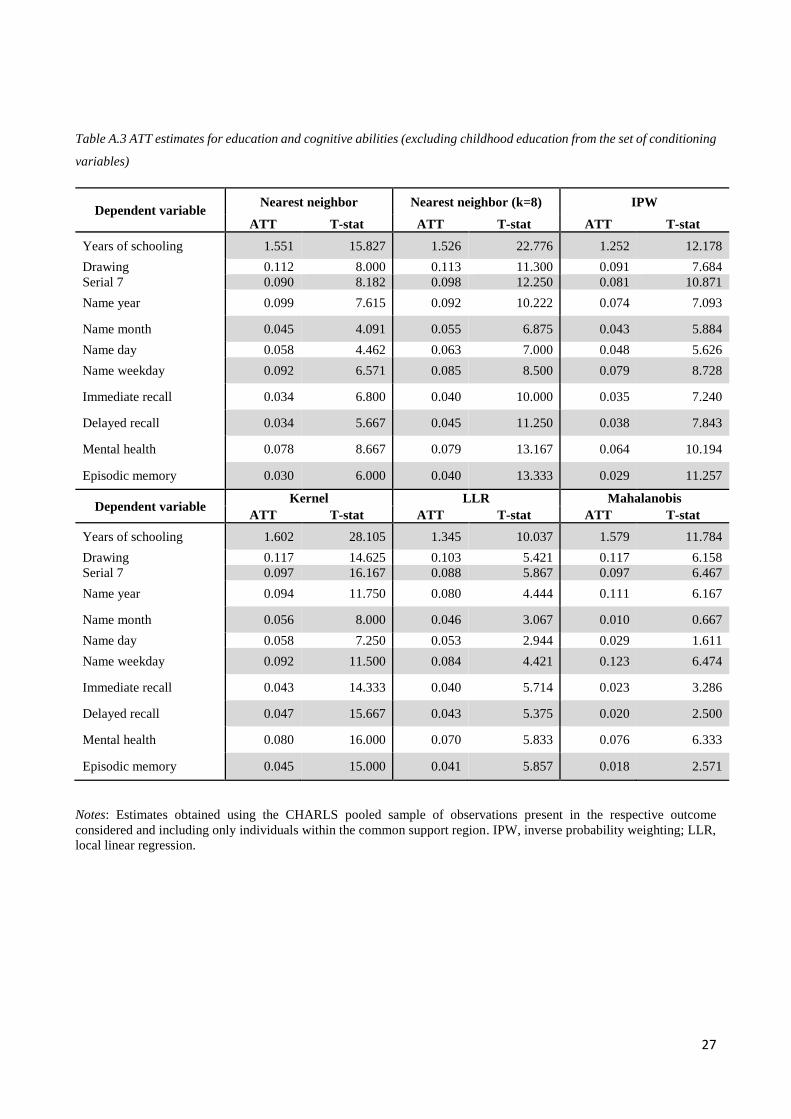
conditional exogeneity assumption, we replicate our analysis with the education variable excluded from the
set of conditioning regressors, which yields estimates (Table A.3) that are virtually equivalent in statistical
significance and magnitude to the main analytical findings reported in the Results section.
3.4 Matching Algorithms
Nearest neighbor matching (NN). To estimate the difference in observed outcomes, we use one-to-one NN
propensity score to match each treated unit to the closest untreated control, permitting replacement to avoid
biased estimates induced by the untreated pool representing only 15% of the total sample (i.e., having low
9
matching quality). To ensure matching estimate precision, we then apply an oversampled k-NN that uses
propensity score to pair each treated individual with the unweighted average of the eight closest controls.
Inverse probability weighting (IPW). The purpose of IPW is to balance the treatment and control groups by
assigning larger weights to each treated (control) individual whose pretreatment characteristics are more likely
to also occur in the set of controls (treated). That is, although the actual (inverse) treatment probability is
unknown, it can be proxied by using a probit regression to compute a propensity score from which to construct
a weighting system in which 𝑤(𝑥) =1
𝑒(𝑥) for treated individuals and 𝑤(𝑥) =
1
1−𝑒(𝑥) for controls. ATT
estimates can then be calculated using a regression model whose original estimator corrects for selection into
treatment via the propensity score–based weights.
Kernel matching. Instead of building a counterfactual from equally weighted control individual(s), we adopt a
kernel matching technique that enables the construction of a (nonparametrically) synthetic counterfactual by
using a control set based on propensity score distance whose closest control is assigned greater weight. Our
kernel matching estimations using an Epanechnikov (parabolic) weight system (see the Results section) yield
very similar outcomes to (unreported) robustness checks based on a Gaussian kernel.
Local linear regression matching (LLR). By locally fitting a line instead of a kernel constant, a nonparametric
local linear regression solves two problems common to the latter approach: namely, bias dependency on the
density of the propensity score distribution and bias boundary problems. Not only is LLR free of such
dependency, but the potential bias is identical at both the interior points and boundaries of the distribution,
thereby eliminating biases when the underlying model is truly linear (Fan 1992, 1993).
Mahalanobis metric matching. This matching technique uses a Mahalanobis geometric distance to pair treated
units with control candidates. Unlike PSM procedures, which standardize the variables by exploiting the
diagonal matrix of variances (Euclidian distance), the Mahalanobis metric matching uses the full variance–
covariance matrix, meaning that it considers how the variables relate to each other (Rubin 1980). Such pair-
matching methods are thus far more robust than mean-matching approaches (e.g., k-NN and kernel) in case of
nonlinearities between the treatment and conditioning variables (Rubin 1979).
3.5 Matching Quality Tests
The descriptive statistics for the conditioning variables, reported in Table 2 for the full sample and treatment
and control groups separately, are based on the largest subsample in the analysis: that used to estimate the
effect of childhood vaccination on years of education. Applying multiple techniques to test the balance between
these two groups (using Stata psmatch2 for all but stratification; (Leuven and Sianesi 2003)) reveals a
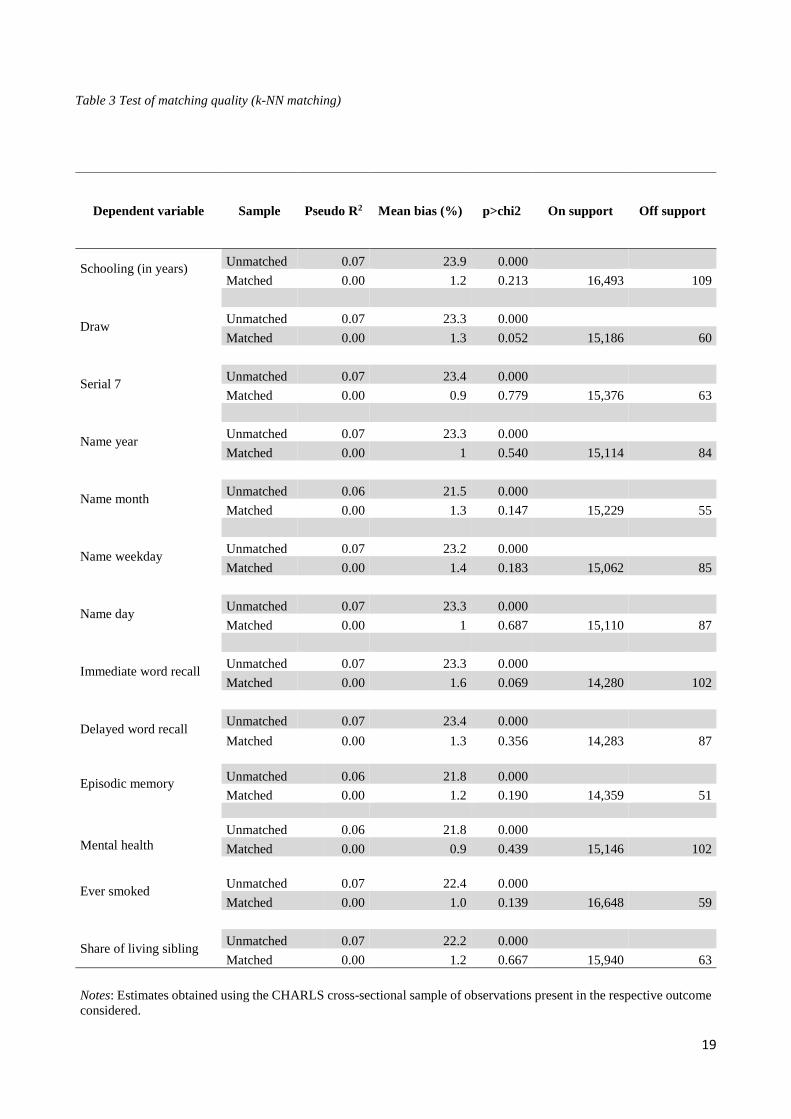
considerable degree of imbalance. Hence, in Table 3, we report the pseudo-R2, the overall standardized
percentage mean bias and its statistical significance for each outcome variable and for the unmatched and
matched samples. These results, based on our preferred matching specification using an oversampled k-NN
algorithm (K=8), first reveal that relatively few observations are dropped for being outside the common support
10
region (20–109). They also show that just as the predictive power of our set of conditioning variables, as
measured by the pseudo-R2, equals 7% before matching but drops to zero after matching, the standardized
mean bias is always statistically significant and large in magnitude (24%) before matching, but ranges between
1% and 2% after matching (albeit always statistically insignificant at α=5%).
[Table 3 about here]
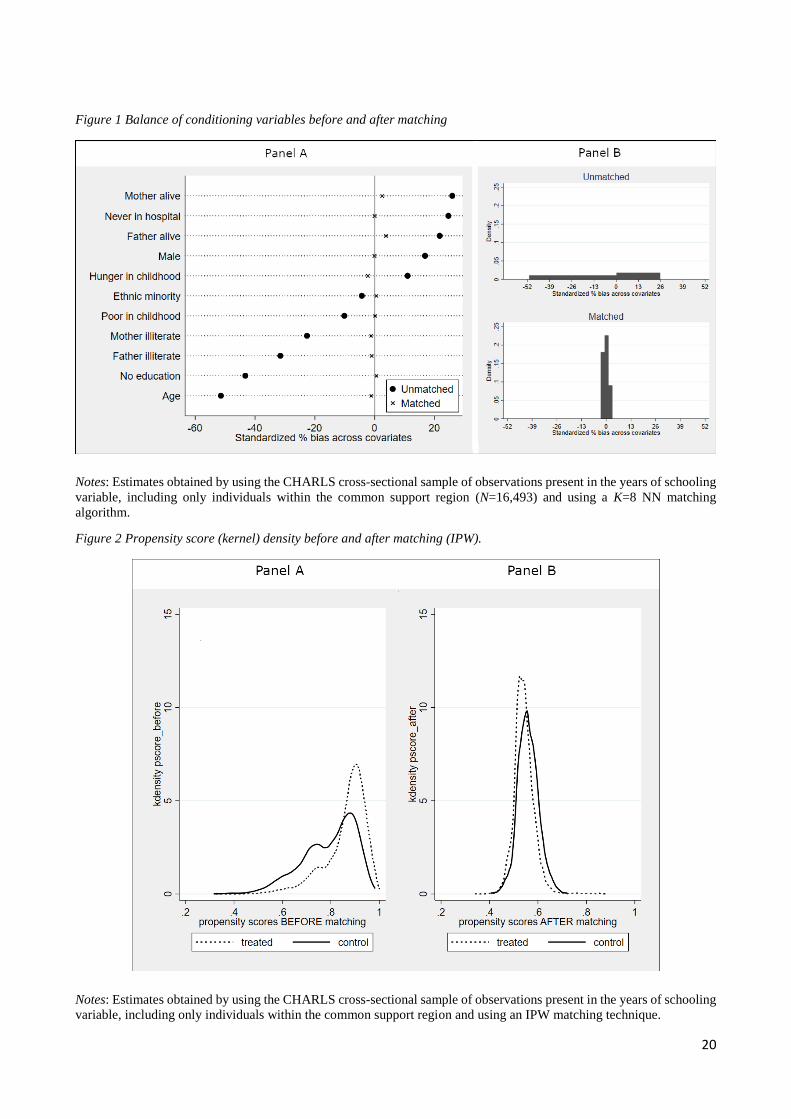
In support of these conclusions, Figure 1 graphs the matching quality for the subsample with no missing
observations for years of schooling (N=16,493), with Figure 1A depicting the standardized percentage bias
broken down at the covariate level before and after matching (dots and crosses, respectively) and Figure 1B
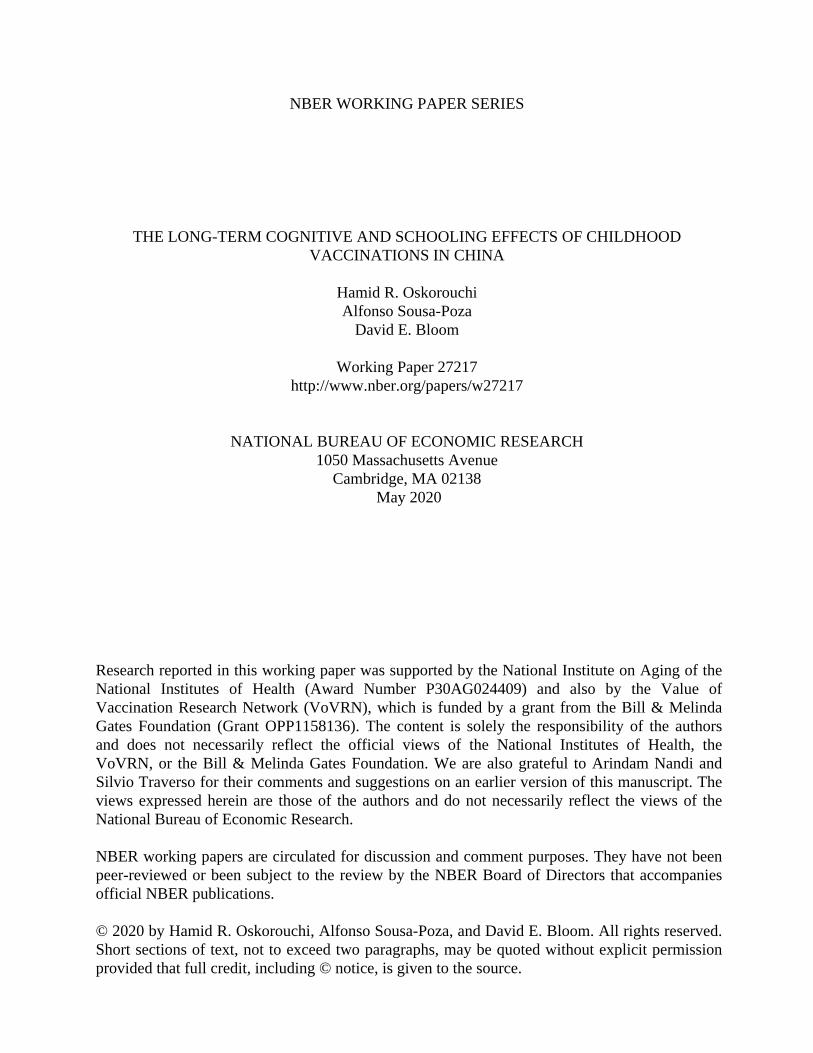
outlining these same results as the averages of the full set of conditioning variables. Figure 2 then plots the
CDF of the propensity score before and after matching (Figure 2A and B, respectively) for our least
conservative approach, the IPW. Comparing these distributions confirms our matching strategy’s ability to
balance pretreatment variables. Nevertheless, as an alternative test of this balancing ability, we conduct PS-
stratified t-tests (Dehejia and Wahba 2002), which calculate the propensity score by (probit) regressing the
treatment variable on the full set of conditioning regressors, restricting the analysis to observations inside the
common support region, and using a t-test to estimate the balance of each conditioning variable by propensity
score block. The underlying assumption is that treatment and control group observations with similar
propensity scores must also be similar in conditioning variable distribution (eq. 1). The number of blocks may
be defined subjectively or by using the Stata pscore package to compute the optimal number of blocks and
automatically running regression-based balancing t-tests (α = 5%) for each conditioning variable across all PS-
blocks (Becker and Ichino 2002). Not only do all subsamples pass the balancing test, but when we consider
only the main conditioning variables (i.e., excluding interactions and birth year dummies), all show perfect
balance (zero percent unbalance), meaning no rejection of the null hypothesis of intergroup equality by block.
Conversely, if we perform a balance test on the full set of 174 conditioning variables (including all possible
interactions and birth year dummies) across all PS-blocks (12−15), the imbalance detected ranges only between
0.1% and 1%, far below the 5% minimum threshold suggested in the literature.
[Figures 1 & 2 about here]
3.6 Coarsened Exact Matching
As an alternative to PSM, we estimate the effect of childhood vaccination on education and cognitive abilities
using exact matching and coarsened exact matching techniques. For the former estimation strategy, we limit
our set of conditioning variables to only those that are dichotomous (i.e., the original set of regressors except
for age) and then exactly match each treated observation with a control unit. Alternatively, in line with some
recent applied economics studies (e.g., Rellstab et al. 2020), we employ a coarsened exact matching technique
to transform the age variable from continuous to categorical, using Stata cem to select an optimal number of
categories (Blackwell et al. 2009). In these models, we exclude birth year fixed effects from the conditioning
variable set to avoid a substantial loss of observations. We derive the final ATT using IPW cem-based
11
regressions that exploit the weighting obtained from either the exact or the coarsened exact matching strategies.
Because by construction no difference exists in pretreatment characteristics between treatment and control
groups, both these methods automatically fulfil the balancing property. Admittedly, a frequent drawback of
(coarsened) exact matching is smaller sample size; however, in our case, once the treated individuals are
matched exactly with their control counterparts, we are able to retain an acceptable number of observations.
3.7 Correlated Random Effects
To limit any possible bias from time-invariant individual-level unobserved heterogeneity, we exploit the
longitudinal nature of our dataset by estimating CRE regressions in an IPW framework. We do so not only
because our treatment variable, being fixed in time, precludes the use of a fixed effects model, but because in
a random effects framework, the CRE approach controls for the average of the time-variant independent
variables, meaning that in a balanced panel setting, the CRE estimator of the time-variant variables is
equivalent to the within-estimator (Mundlak 1978). We apply this method by first using the cross-sectional
sample to estimate a propensity score, computing the inverse treatment probability, and then running a CRE
model (in Stata xtregre2; (Merryman 2005)) that accounts for these weights plus a set of time-variant and fixed
control variables. The only caveat is that the time-invariant nature of our schooling proxy prevents estimation
of the childhood vaccination effect on education. However, CRE models use a smaller sample than pooled
PSM, not only because the CRE list-wise approach to data preparation for the time-variant controls causes the
loss of some observations (1,004), but because it drops all individuals not interviewed at least twice.
4. Results
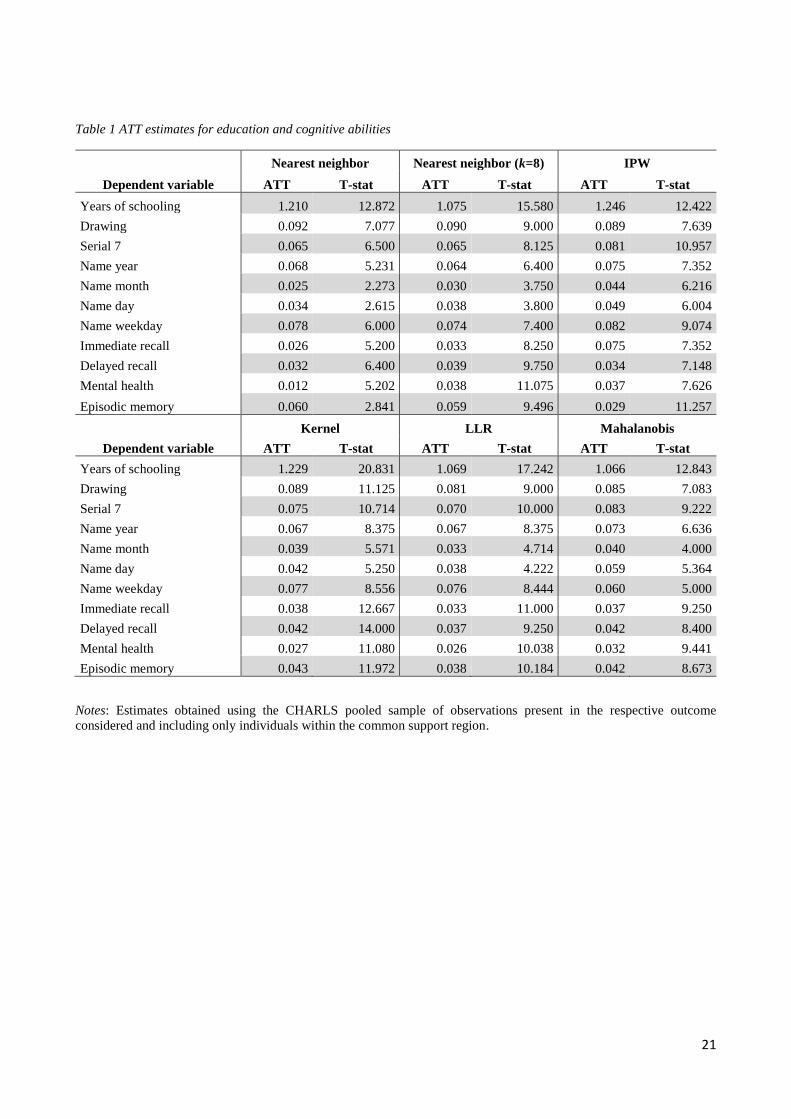
According to Tables 4 and 5, which report the PSM and exact matching estimations for the childhood
vaccination effect on schooling and cognitive abilities among older Chinese, neither the magnitude nor the
statistical significance vary substantially regardless of matching strategy employed. Nonetheless, k-NN
matching (k=8) proves the preferred method because it assures the highest degree of balance between the
conditioning variables. All ATT estimates, independent of matching strategy, are positive and statistically
significant at the 5% level. The estimates reported as follows must be interpreted as probabilities for all the
dichotomous variables, as points of scores ranging from zero to one for the numeracy, episodic memory, and
mental status, and as years of schooling for the education variable.
Not only do we estimate the extensive margin of the childhood vaccination effect on schooling to be
approximately one extra year, but we show that the treatment considerably increases the numeracy score by
0.06 points, as measured by the serial 7 test, and the ability to redraw a geometric figure (9% higher
probability). As regards the variables that proxy mental status, correctly naming the current year and day of
the week show the largest effects at 6.4% and 7.4% higher probabilities, respectively, whereas those for month
and day of the month are only around 3%. These results are in line with the expectation that childhood
vaccinations contribute not only to better mental status in late adulthood, but also to a more active life: active
individuals, regardless of mental status, are more likely to know the day of the week. The aggregate indicators
12
for mental health and episodic memory further confirm these results, pointing respectively to a 0.04 points
treatment-induced increase in the mental status score and a 0.06 points improvement in episodic memory. This
latter holds irrespective of whether assessed by immediate or delayed recall, reflecting 0.03 and 0.04 points
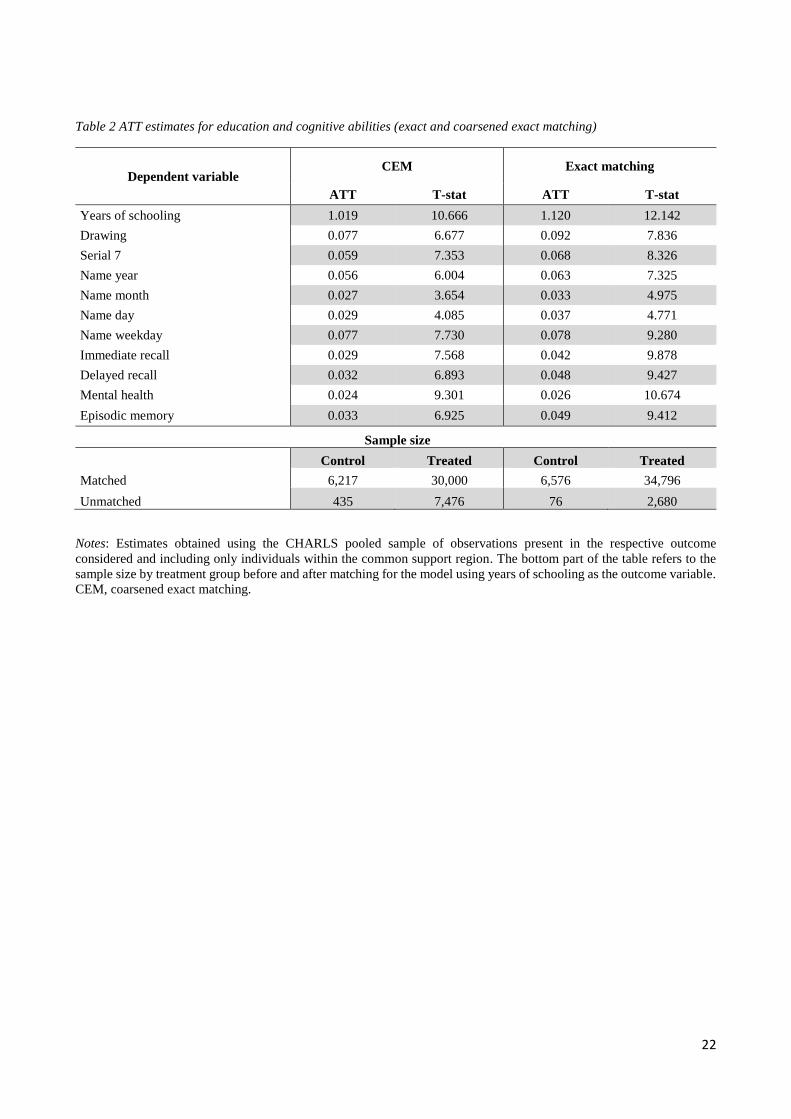
higher episodic memory scores, respectively. Nonetheless, when comparing the PSM ATTs (Table 4) to those
obtained via (coarsened) exact matching (Table 5), the need to drop 6–17% of the original sample dependent
on matching strategy raises the possibility of sample selection (see the bottom of Table 5 for dropped
observations by treatment group). Despite this drawback, these estimates remain virtually equivalent to the
PSM ATTs in terms of both statistical significance and magnitude, while also being consistent with those from
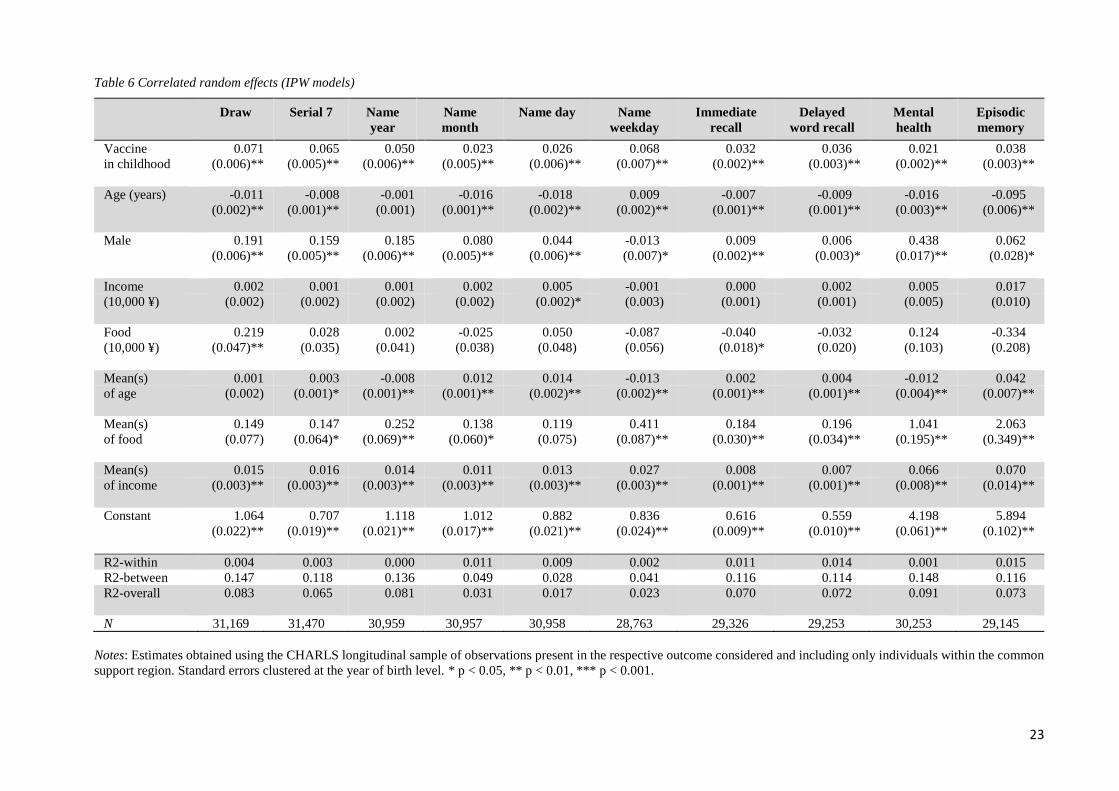
our CRE model for longitudinal data weighted by inverse treatment probability reported in Table 6. This latter
is particularly relevant given the CRE estimator’s ability to account for time-invariant unobserved
heterogeneity, a problem that the matching strategies cannot solve. Moreover, because we directly control for
meaningful time-variant predictors of cognitive ability at the time of interview (i.e., personal income and
household food consumption), we can claim that the degree of bias originating from time-variant heterogeneity
is probably minimal.
[Tables 4, 5 & 6 about here]
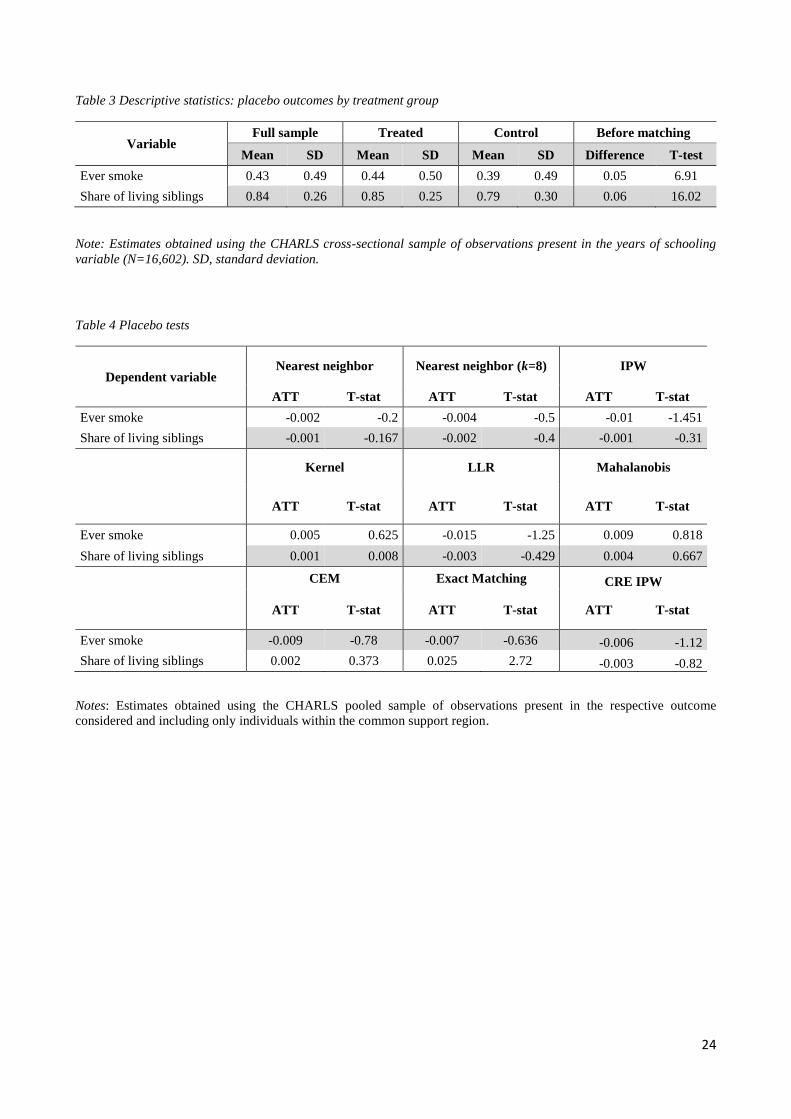
To confirm the robustness of our estimates, we perform a series of placebo tests using variables based on
individual smoking history and number of living biological siblings (excluding individuals who never had
siblings). According to the outcome summary statistics (see Table 7), which include the mean difference
between treatment and control groups and its statistical significance, control group members are 5% more
likely to be or have been smokers and 6% less likely to have living biological siblings. We thus consider these
two variables ideal measures for placebo testing. Because childhood vaccination should not affect the
individual probability of ever having been a smoker and is unlikely to have strongly affected sibling health
status (e.g., premature death), any statistically significant effect detected by the placebo tests would suggest
that our strategy inadequately corrects for parental background characteristics and/or adult health risk behavior.
In fact, as Table 8 shows, the results—obtained using all eight of our methodological approaches—not only
yield ATTs of very small magnitude (especially compared with the biased intergroup mean differences in
Table 7), but also coefficients that remain statistically insignificant even at α = 10%.
[Tables 7 & 8 about here]
Although our estimation strategy is admittedly limited by its inability to address the bias from excluding those
who suffered premature death due to lack of immunization, because the treatment considered is beneficial, this
exclusion should at worst lead to underestimation of vaccination’s true positive effect on education and
cognitive abilities. In fact, in our setting, because the nonimmunized dead, had they lived, would presumably
have been less healthy and more disadvantaged in terms of schooling year completion, they would have
belonged to—and lowered the variable mean for—the control group, causing our ATTs to underestimate the
true vaccination effect. Finally, the PSM results remain virtually unchanged when using the full sample of
13
individuals (i.e., including those up to 90 years of age) or excluding the childhood education proxy from the
set of conditioning variables. Tables A.3 and A.4 report these additional results respectively. As expected,
although the ATT estimates in Table A.3 do not change either in terms of sign or statistical significance, their
magnitude is on average larger than the main results reported in Table 4. We cannot state with certainty if the
exclusion of the (possibly endogenous) childhood education proxy from the set of conditioning PSM variables
corrects a downward bias in the main results (Table 4), or if its inclusion allows us to construct a better PS-
based control group. In any case, in the main text we present the most conservative estimates. Finally, the
results using the sample of individuals up to 90 years of age reported in Table A.4 confirm the robustness of
our main results. Unsurprisingly, the inclusion of older individuals slightly reduces the effect of childhood
vaccination on schooling. However, these results are more likely to suffer from selective mortality-related
biases because of the inclusion of the super healthy. Finally, the statistical significance of our results holds for
every estimation strategy and dependent variable considered even when we correct the p-values for multiple
testing. Results of a Benjamini and Hochberg (1995) procedure alternatively using 0.05 and 0.25 false
discovery rates are available on request.
5. Discussion and Conclusions
By analyzing data from the China Health and Retirement Longitudinal Study, we find that adults over age 45
who were vaccinated before the age of 15 tend to perform better on standardized cognitive tests and complete
more years of schooling than similar unvaccinated individuals. These effects are relatively strong, with
vaccinated individuals having enjoyed about one more year of schooling and performing substantially better
on several cognitive tests, including 0.06 points higher numeracy and episodic memory scores. These findings,
which remain robust and statistically significant regardless of matching algorithm even after we account for
vaccination’s possible confounding effects, reinforce the existing evidence on vaccination’s health, cognition,
and schooling effects in myriad countries, such as the additional 0.2–0.3 school grade by age 12 among Indian
children age-appropriately vaccinated for measles (Nandi, Shet, et al. 2019). In particular, our analysis
highlights that such benefits, which in China translate into approximately one more year of schooling, are long
lasting and persistent into older age. These results are in line with a recent study demonstrating that childhood
infections (more likely to occur among non-immunized individuals) decrease earnings and years of
employment in adulthood (Viinikainen et al. 2020).
In addition, by comparing the effect size of our results with those in other studies that use the CHARLS survey
and assessing how other conditions or shocks measured at their extensive margin affect the episodic memory
and mental status of older Chinese adults, we demonstrate that early vaccination’s positive effects on cognitive
outcomes are substantial.
In a study of widowhood’s effect on cognitive functions in older Chinese, Zhang and colleagues conclude that
continual widowhood status (i.e., across every data wave) decreases the episodic memory score by 0.15 points,
while having any functional physical limitation lowers it by 0.17 points (Zhang, Li, et al. 2019). In this present
study, by constructing a similar index for comparative purposes (i.e., the actual number of recalled words
14
instead of their share), we show that early vaccination increases the score by 0.30–0.43 points, thereby
offsetting the joint negative effect of widowhood status and functional limitation by 93–134%. In another
cross-sectional study for China, Zhang, Yang, et al. (2019), after adjusting for sociodemographics and
cardiovascular diseases, identify a negative association between untreated diabetes and episodic memory, with
a decrease of 0.19 and 0.47 for the full and 45–69 year old samples, respectively. The magnitude of our results
can also be considered significant when compared with findings on factors that positively affect cognitive
abilities; for example, a 0.18 higher serial 7 numeracy score induced by playing Mahjong or chess (Kesavayuth,
Liang, and Zikos 2018), compared with our finding of a 0.065–0.085 (38–47%) improvement from childhood
vaccination. By comparing the size of the vaccination effect on memory status in our study with the results
reported by Pan and Chee (2019), we can infer that among older Chinese, childhood vaccination is twice as
beneficial as engaging in one extra social activity (e.g., voluntary work, interaction with friends, educational
courses, or sports). Lastly, our results on education relate to the findings of Nandi et al. (2020) on the effect of
childhood exposure to the Indian UIP on schooling of young adults. In their paper, these effects range from
0.18 to 0.29 more schooling grades, depending on the econometric specification. In our study, the same results
are comparatively larger (approximately one extra year of schooling). This difference in magnitude can be
justified only marginally by the treatment heterogeneity between the studies. In fact, the treatment group in
Nandi et al. (2020) was exposed to a similar set of vaccines as the treatment group in this study (i.e., ML-L,
BCG, OPV, DPT), but likely with different timings and doses. Rather, the greater magnitude found in our
analysis of Chinese elderly might be explained by convergence in schooling. That is, as with income growth,
countries with lower average education would experience faster schooling growth than in relatively highly
educated countries. This implies that the potential (in years of schooling) of a given investment in education
is greater in less educated populations. Currently China and India do not diverge much in terms of gross
secondary schooling enrollment. However, the average years of schooling in the Indian study treatment sample
equals 10.29 years, whereas the same figure for the sample of treated Chinese in our study is only 5.41, a
divergence that can be explained by the different cohorts analyzed in the two studies.
Despite such significant effects, however, we consider our effects conservative, not only because we do not
account for herd immunity—the indirect protection from infectious disease provided by treated individuals to
untreated controls—but also because we cannot control for the selective mortality that would dilute childhood
vaccination’s beneficial effects. The CRE model, unlike the PSM, allows us to address time-invariant
unobserved heterogeneity, but the possibility of time-variant unobserved heterogeneity remains a limitation of
our analysis. Despite these limitations, however, we believe that our application of several matching techniques
to such a rich set of child and household covariates represents the most viable—perhaps even the only—way
of accurately assessing the effects of childhood experiences on later life outcomes.
Given the approximately 8% increase in earnings induced by each extra year of schooling in China (Giles,
Park, and Wang 2019), the vaccination effect on cognitive abilities and educational outcomes could imply
economic benefits, particularly if, as our results suggest, childhood vaccines improve cognitive aging, thereby
15
preventing or postponing cognitive decline into dementia (Petersen et al. 2009). Childhood vaccination may
also help to reduce dementia’s economic burden while reducing wealth and health inequities by lowering
morbidity and mortality (Andre et al. 2008). In fact, according to our results, the beneficial effects of vaccines
on cognition and educational outcomes may even amplify inequality reduction, especially in the face of 19
million children worldwide who in 2018 received no routine immunizations (WHO 2019). We thus hope that,
at a time when growing public vaccination hesitancy is lowering herd immunity in both high- and middle-low-
income countries (Vaccine hesitancy 2019), the robust evidence provided here of vaccination’s long-term
beneficial effects will mitigate reluctance and increase the demand for immunization.
References
Abeliansky, A. L., and H. Strulik. 2018. "Hungry children age faster." Econ Hum Biol 29:211-220. doi: 10.1016/j.ehb.2018.03.005.
Andersen, Andreas, Ane Baerent Fisker, Amabelia Rodrigues, Cesario Martins, Henrik Ravn, Najaaraq Lund, Sofie Biering-Sørensen, Christine Stabell Benn, and Peter Aaby. 2018. "National immunization campaigns with oral polio vaccine reduce all-cause mortality: a natural experiment within seven randomized trials." Frontiers in public health 6:13.
Andre, F. E., R. Booy, H. L. Bock, J. Clemens, S. K. Datta, T. J. John, B. W. Lee, S. Lolekha, H. Peltola, T. A. Ruff, Mathuram Santosham, and H. J. Schmitt. 2008. "Vaccination greatly reduces disease, disability, death and inequity worldwide." Bulletin of the World Health Organization 86 (2):140-146. doi: 10.2471/BLT.07.040089.
Anekwe, Tobenna D., Marie-Louise Newell, Frank Tanser, Deenan Pillay, and Till Bärnighausen. 2015. "The causal effect of childhood measles vaccination on educational attainment: A mother fixed-effects study in rural South Africa." Vaccine 33 (38):5020-5026. doi: 10.1016/j.vaccine.2015.04.072.
Barnighausen, T., D. E. Bloom, E. T. Cafiero-Fonseca, and J. C. O'Brien. 2014. "Valuing vaccination." Proc Natl Acad Sci U S A 111 (34):12313-9. doi: 10.1073/pnas.1400475111.
Benjamini, Yoav, and Yosef Hochberg. 1995. "Controlling the false discovery rate: a practical and powerful approach to multiple testing." Journal of the Royal statistical society: series B (Methodological) 57 (1):289-300.
Becker, S. O., and A. Ichino. 2002. "Estimation of average treatment effects based on propensity scores." Stata Journal 2 (4):358-377. doi: Doi 10.1177/1536867x0200200403.
Benn, C. S., M. G. Netea, L. K. Selin, and P. Aaby. 2013. "A small jab - a big effect: nonspecific immunomodulation by vaccines." Trends Immunol 34 (9):431-9. doi: 10.1016/j.it.2013.04.004.
Blackwell, M., S. Iacus, G. King, and G. Porro. 2009. "cem: Coarsened exact matching in Stata." Stata Journal 9 (4):524-546. doi: Doi 10.1177/1536867x0900900402.
Bloom, David E., David Canning, and Erica S. Shenoy. 2011. "The effect of vaccination on children's physical and cognitive development in the Philippines." Applied Economics 44 (21):2777-2783. doi: 10.1080/00036846.2011.566203.
Caliendo, Marco, and Sabine Kopeinig. 2008. "Some practical guidance for the implementation of propensity score matching." Journal of economic surveys 22 (1):31-72.
Case, A., A. Fertig, and C. Paxson. 2005. "The lasting impact of childhood health and circumstance." J Health Econ 24 (2):365-89. doi: 10.1016/j.jhealeco.2004.09.008.
Dehejia, R. H., and S. Wahba. 2002. "Propensity score-matching methods for nonexperimental causal studies." Review of Economics and Statistics 84 (1):151-161. doi: Doi 10.1162/003465302317331982.
Driessen, J., A. Razzaque, D. Walker, and D. Canning. 2015. "The effect of childhood measles vaccination on school enrolment in Matlab, Bangladesh." Applied Economics 47 (55):6019-6040. doi: 10.1080/00036846.2015.1061647.
16
Evans, G. W., and M. A. Schamberg. 2009. "Childhood poverty, chronic stress, and adult working memory." Proc Natl Acad Sci U S A 106 (16):6545-9. doi: 10.1073/pnas.0811910106.
Fan, J. Q. 1992. "Design-Adaptive Nonparametric Regression." Journal of the American Statistical Association 87 (420):998-1004. doi: Doi 10.2307/2290637.
Fan, J. Q. 1993. "Local Linear-Regression Smoothers and Their Minimax Efficiencies." Annals of Statistics 21 (1):196-216. doi: DOI 10.1214/aos/1176349022.
Fine, P. E., T. N. Williams, P. Aaby, K. Kallander, L. H. Moulton, K. L. Flanagan, P. G. Smith, C. S. Benn, and Working Group on Non-specific Effects of Vaccines. 2009. "Epidemiological studies of the 'non-specific effects' of vaccines: data collection in observational studies." Trop Med Int Health 14 (9):969-76. doi: 10.1111/j.1365-3156.2009.02301.x.
Giles, John, Albert Park, and Meiyan Wang. 2019. "The Great Proletarian Cultural Revolution, Disruptions to Education, and the Returns to Schooling in Urban China." Economic Development and Cultural Change 68 (1):131-164. doi: 10.1086/700568.
Glymour, M. M., I. Kawachi, C. S. Jencks, and L. F. Berkman. 2008. "Does childhood schooling affect old age memory or mental status? Using state schooling laws as natural experiments." J Epidemiol Community Health 62 (6):532-7. doi: 10.1136/jech.2006.059469.
Hassevoort, K. M., N. A. Khan, C. H. Hillman, and N. J. Cohen. 2016. "Childhood Markers of Health Behavior Relate to Hippocampal Health, Memory, and Academic Performance." Mind Brain and Education 10 (3):162-170. doi: 10.1111/mbe.12108.
Heckman, J. J., H. Ichimura, and P. Todd. 1998. "Matching as an econometric evaluation estimator." Review of Economic Studies 65 (2):261-294. doi: Doi 10.1111/1467-937x.00044.
Kesavayuth, D., Y. Liang, and V. Zikos. 2018. "An active lifestyle and cognitive function: Evidence from China." Journal of the Economics of Ageing 12:183-191. doi: 10.1016/j.jeoa.2018.05.001.
Lei, X., J. P. Smith, X. Sun, and Y. Zhao. 2014. "Gender Differences in Cognition in China and Reasons for Change over Time: Evidence from CHARLS." J Econ Ageing 4:46-55. doi: 10.1016/j.jeoa.2013.11.001.
PSMATCH2: Stata module to perform full Mahalanobis and propensity score matching, common support graphing, and covariate imbalance testing S432001, revised 01 Feb 2018. College Department of Economics, Boston.
Liang, Xiaofeng, and Yanmin Liu. 2019a. "My Experience as Director of the National Immunization Program (Historical Review)." In Immunization Program in China, edited by Xiaofeng Liang, 1-14. Singapore: Springer Singapore.
Liang, Xiaofeng, and Yanmin Liu. 2019b. "My Experience as Director of the National Immunization Program (Historical Review)." In Immunization Program in China, 1-14. Springer.
McArdle, John J, James P Smith, and Robert Willis. 2009. Cognition and economic outcomes in the Health and Retirement Survey. In NBER Working Papers: National Bureau of Economic Research.
XTREGRE2: Stata module to estimate random effects model with weights S456514. Boston College Department of Economics.
Molina, T. 2016. "Reporting Heterogeneity and Health Disparities Across Gender and Education Levels: Evidence From Four Countries." Demography 53 (2):295-323. doi: 10.1007/s13524-016-0456-z.
Mundlak, Yair. 1978. "On the pooling of time series and cross section data." Econometrica: journal of the Econometric Society 46 (1):69-85.
Nandi, A., A. B. Deolalikar, D. E. Bloom, and R. Laxminarayan. 2019. "Haemophilus influenzae type b vaccination and anthropometric, cognitive, and schooling outcomes among Indian children." Ann N Y Acad Sci 1449 (1):70-82. doi: 10.1111/nyas.14127.
Nandi, A., A. Shet, J. R. Behrman, M. M. Black, D. E. Bloom, and R. Laxminarayan. 2019. "Anthropometric, cognitive, and schooling benefits of measles vaccination: Longitudinal cohort analysis in Ethiopia, India, and Vietnam." Vaccine 37 (31):4336-4343. doi: 10.1016/j.vaccine.2019.06.025.
Nandi, Arindam, Santosh Kumar, Anita Shet, David E Bloom, and Ramanan Laxminarayan. 2020. "Childhood vaccinations and adult schooling attainment: Long-term evidence from India's Universal Immunisation Programme." Social Science & Medicine:112885.
17
Ozawa, S., A. Mirelman, M. L. Stack, D. G. Walker, and O. S. Levine. 2012. "Cost-effectiveness and economic benefits of vaccines in low- and middle-income countries: a systematic review." Vaccine 31 (1):96-108. doi: 10.1016/j.vaccine.2012.10.103.
Pan, X., and K. H. Chee. 2019. "The power of weak ties in preserving cognitive function: a longitudinal study of older Chinese adults." Aging Ment Health:1-8. doi: 10.1080/13607863.2019.1597015.
Pannaraj, P. S., H. L. Wang, H. Rivas, H. Wiryawan, M. Smit, N. Green, G. M. Aldrovandi, A. N. El Amin, and L. Mascola. 2014. "School-located influenza vaccination decreases laboratory-confirmed influenza and improves school attendance." Clin Infect Dis 59 (3):325-32. doi: 10.1093/cid/ciu340.
Petersen, R. C., R. O. Roberts, D. S. Knopman, B. F. Boeve, Y. E. Geda, R. J. Ivnik, G. E. Smith, and C. R. Jack, Jr. 2009. "Mild cognitive impairment: ten years later." Arch Neurol 66 (12):1447-55. doi: 10.1001/archneurol.2009.266.
Rellstab, S., P. Bakx, P. Garcia-Gomez, and E. van Doorslaer. 2020. "The kids are alright - labour market effects of unexpected parental hospitalisations in the Netherlands." J Health Econ 69:102275. doi: 10.1016/j.jhealeco.2019.102275.
Rosenbaum, P. R., and D. B. Rubin. 1983. "The Central Role of the Propensity Score in Observational Studies for Causal Effects." Biometrika 70 (1):41-55. doi: DOI 10.1093/biomet/70.1.41.
Rubin, D. B. 1979. "Using Multivariate Matched Sampling and Regression Adjustment to Control Bias in Observational Studies." Journal of the American Statistical Association 74 (366):318-328. doi: Doi 10.2307/2286330.
Rubin, D. B. 1980. "Bias Reduction Using Mahalanobis-Metric Matching." Biometrics 36 (2):293-298. doi: Doi 10.2307/2529981.
Saadatian-Elahi, M., P. Aaby, F. Shann, M. G. Netea, O. Levy, J. Louis, V. Picot, M. Greenberg, and W. Warren. 2016. "Heterologous vaccine effects." Vaccine 34 (34):3923-30. doi: 10.1016/j.vaccine.2016.06.020.
Sidel, Victor W, and Ruth Sidel. 1975. "The health care delivery system of the People's Republic of China." World Development, 3 (7-8):539-549.
Smith, J. P. 2009. "The Impact of Childhood Health on Adult Labor Market Outcomes." Rev Econ Stat 91 (3):478-489. doi: 10.1162/rest.91.3.478.
Smith, J. P., J. Strauss, and Y. Zhao. 2014. "Healthy Aging in China." J Econ Ageing 4:37-43. doi: 10.1016/j.jeoa.2014.08.006.
Vaccine hesitancy. 2019. "Vaccine hesitancy." The Lancet Child & Adolescent Health 3 (5):281. Viinikainen, Jutta, Alex Bryson, Petri Böckerman, Marko Elovainio, Nina Hutri-Kähönen, Markus Juonala,
Terho Lehtimäki, Katja Pahkala, Suvi Rovio, and Laura Pulkki-Råback. 2020. "Do childhood infections affect labour market outcomes in adulthood and, if so, how?" Economics & Human Biology 37:100857.
WHO. 2019. "Immunization coverage." accessed 31.03.2020. https://www.who.int/news-room/fact-sheets/detail/immunization-coverage.
World Bank. 1984. The Health Sector in China. Washington, DC: Population, Health and Nutrition Department, World Bank.
Zhang, L., J. Yang, Z. Liao, X. Zhao, X. Hu, W. Zhu, and Z. Zhang. 2019. "Association between Diabetes and Cognitive Function among People over 45 Years Old in China: A Cross-Sectional Study." Int J Environ Res Public Health 16 (7):1294. doi: 10.3390/ijerph16071294.
Zhang, Zhenmei, Lydia W Li, Hongwei Xu, and Jinyu Liu. 2019. "Does widowhood affect cognitive function among Chinese older adults?" SSM-population health 7:100329.
Zheng, Y., L. Rodewald, J. Yang, Y. Qin, M. Pang, L. Feng, and H. Yu. 2018. "The landscape of vaccines in China: history, classification, supply, and price." BMC Infect Dis 18 (1):502. doi: 10.1186/s12879-018-3422-0.
18
Table 1 Descriptive statistics: outcome variables by treatment group
Variable
Full sample Treated Control Before matching
Mean SD Mean SD Mean SD Difference T-test
Years of schooling 5.07 4.11 5.41 4.10 3.12 3.62 2.29 27.11
Drawing 0.67 0.47 0.70 0.46 0.50 0.50 0.20 19.36
Serial 7 0.28 0.20 0.30 0.20 0.22 0.20 0.07 17.87
Name year 0.76 0.43 0.79 0.41 0.63 0.48 0.16 17.16
Name month 0.86 0.34 0.87 0.33 0.81 0.40 0.07 8.76
Name day 0.61 0.49 0.64 0.48 0.49 0.50 0.14 13.25
Name weekday 0.74 0.44 0.75 0.43 0.67 0.47 0.08 8.43
Immediate recall 0.41 0.18 0.41 0.17 0.35 0.17 0.06 16.25
Delayed recall 0.31 0.20 0.32 0.20 0.25 0.19 0.07 15.46
Mental health 0.07 0.29 0.08 0.28 0.61 0.31 0.12 29.85
Episodic memory 0.34 0.18 0.36 0.17 0.35 0.18 0.69 27.85
Notes: Estimates obtained using the CHARLS cross-sectional sample of observations present in the respective outcome
considered. SD, standard deviation.
Table 2 Descriptive statistics of conditioning, treatment, and time-changing variables
Variable
Full sample Treated Control Before matching
Mean SD Mean SD Mean SD Difference T-test
Mother illiterate 0.83 0.37 0.82 0.38 0.90 0.30 -0.08 -10.21
Father illiterate 0.58 0.49 0.56 0.50 0.71 0.45 -0.15 -14.72
Mother alive 0.27 0.44 0.29 0.45 0.18 0.38 0.11 12.00
Father alive 0.15 0.36 0.17 0.37 0.09 0.29 0.08 10.05
Poor in childhood 0.39 0.49 0.39 0.49 0.44 0.50 -0.05 -4.92
Male 0.49 0.50 0.50 0.50 0.42 0.49 0.08 7.86
Hunger in childhood 0.82 0.38 0.83 0.38 0.78 0.41 0.04 5.13
Age 56.94 9.11 56.23 8.78 61.01 9.91 -4.78 -25.48
Ethnic minority 0.08 0.27 0.08 0.27 0.09 0.29 -0.01 -2.60
Never in hospital 0.04 0.19 0.03 0.18 0.05 0.22 -0.02 -4.66
No child education 0.19 0.40 0.17 0.37 0.36 0.48 -0.19 -23.47
Vaccine 0.84 0.36 - - - - - -
Income (10,000 ¥) 0.56 1.94 0.54 1.98 0.20 0.77 0.34 13.68
Food (10,000 ¥) 0.04 0.12 0.04 0.07 0.03 0.08 0.004 4.12
Notes: Estimates obtained using the CHARLS cross-sectional sample of observations present in the years of schooling
variable (N=16,602). SD, standard deviation.
19
Table 3 Test of matching quality (k-NN matching)
Dependent variable Sample Pseudo R2 Mean bias (%) p>chi2 On support Off support
Schooling (in years) Unmatched 0.07 23.9 0.000
Matched 0.00 1.2 0.213 16,493 109
Draw Unmatched 0.07 23.3 0.000
Matched 0.00 1.3 0.052 15,186 60
Serial 7 Unmatched 0.07 23.4 0.000
Matched 0.00 0.9 0.779 15,376 63
Name year Unmatched 0.07 23.3 0.000
Matched 0.00 1 0.540 15,114 84
Name month Unmatched 0.06 21.5 0.000
Matched 0.00 1.3 0.147 15,229 55
Name weekday Unmatched 0.07 23.2 0.000
Matched 0.00 1.4 0.183 15,062 85
Name day Unmatched 0.07 23.3 0.000
Matched 0.00 1 0.687 15,110 87
Immediate word recall Unmatched 0.07 23.3 0.000
Matched 0.00 1.6 0.069 14,280 102
Delayed word recall Unmatched 0.07 23.4 0.000
Matched 0.00 1.3 0.356 14,283 87
Episodic memory Unmatched 0.06 21.8 0.000
Matched 0.00 1.2 0.190 14,359 51
Mental health
Unmatched 0.06 21.8 0.000
Matched 0.00 0.9 0.439 15,146 102
Ever smoked Unmatched 0.07 22.4 0.000
Matched 0.00 1.0 0.139 16,648 59
Share of living sibling Unmatched 0.07 22.2 0.000
Matched 0.00 1.2 0.667 15,940 63
Notes: Estimates obtained using the CHARLS cross-sectional sample of observations present in the respective outcome
considered.
20
Figure 1 Balance of conditioning variables before and after matching
Notes: Estimates obtained by using the CHARLS cross-sectional sample of observations present in the years of schooling
variable, including only individuals within the common support region (N=16,493) and using a K=8 NN matching
algorithm.
Figure 2 Propensity score (kernel) density before and after matching (IPW).
Notes: Estimates obtained by using the CHARLS cross-sectional sample of observations present in the years of schooling
variable, including only individuals within the common support region and using an IPW matching technique.
21
Table 1 ATT estimates for education and cognitive abilities
Dependent variable
Nearest neighbor Nearest neighbor (k=8) IPW
ATT T-stat ATT T-stat ATT T-stat
Years of schooling 1.210 12.872 1.075 15.580 1.246 12.422
Drawing 0.092 7.077 0.090 9.000 0.089 7.639
Serial 7 0.065 6.500 0.065 8.125 0.081 10.957
Name year 0.068 5.231 0.064 6.400 0.075 7.352
Name month 0.025 2.273 0.030 3.750 0.044 6.216
Name day 0.034 2.615 0.038 3.800 0.049 6.004
Name weekday 0.078 6.000 0.074 7.400 0.082 9.074
Immediate recall 0.026 5.200 0.033 8.250 0.075 7.352
Delayed recall 0.032 6.400 0.039 9.750 0.034 7.148
Mental health 0.012 5.202 0.038 11.075 0.037 7.626
Episodic memory 0.060 2.841 0.059 9.496 0.029 11.257
Dependent variable
Kernel LLR Mahalanobis
ATT T-stat ATT T-stat ATT T-stat
Years of schooling 1.229 20.831 1.069 17.242 1.066 12.843
Drawing 0.089 11.125 0.081 9.000 0.085 7.083
Serial 7 0.075 10.714 0.070 10.000 0.083 9.222
Name year 0.067 8.375 0.067 8.375 0.073 6.636
Name month 0.039 5.571 0.033 4.714 0.040 4.000
Name day 0.042 5.250 0.038 4.222 0.059 5.364
Name weekday 0.077 8.556 0.076 8.444 0.060 5.000
Immediate recall 0.038 12.667 0.033 11.000 0.037 9.250
Delayed recall 0.042 14.000 0.037 9.250 0.042 8.400
Mental health 0.027 11.080 0.026 10.038 0.032 9.441
Episodic memory 0.043 11.972 0.038 10.184 0.042 8.673
Notes: Estimates obtained using the CHARLS pooled sample of observations present in the respective outcome
considered and including only individuals within the common support region.
22
Table 2 ATT estimates for education and cognitive abilities (exact and coarsened exact matching)
Dependent variable CEM Exact matching
ATT T-stat ATT T-stat
Years of schooling 1.019 10.666 1.120 12.142
Drawing 0.077 6.677 0.092 7.836
Serial 7 0.059 7.353 0.068 8.326
Name year 0.056 6.004 0.063 7.325
Name month 0.027 3.654 0.033 4.975
Name day 0.029 4.085 0.037 4.771
Name weekday 0.077 7.730 0.078 9.280
Immediate recall 0.029 7.568 0.042 9.878
Delayed recall 0.032 6.893 0.048 9.427
Mental health 0.024 9.301 0.026 10.674
Episodic memory 0.033 6.925 0.049 9.412
Sample size
Control Treated Control Treated
Matched 6,217 30,000 6,576 34,796
Unmatched 435 7,476 76 2,680
Notes: Estimates obtained using the CHARLS pooled sample of observations present in the respective outcome
considered and including only individuals within the common support region. The bottom part of the table refers to the
sample size by treatment group before and after matching for the model using years of schooling as the outcome variable.
CEM, coarsened exact matching.
23
Table 6 Correlated random effects (IPW models)
Notes: Estimates obtained using the CHARLS longitudinal sample of observations present in the respective outcome considered and including only individuals within the common
support region. Standard errors clustered at the year of birth level. * p < 0.05, ** p < 0.01, *** p < 0.001.
Draw Serial 7 Name
year
Name
month
Name day Name
weekday
Immediate
recall
Delayed
word recall
Mental
health
Episodic
memory
Vaccine 0.071 0.065 0.050 0.023 0.026 0.068 0.032 0.036 0.021 0.038
in childhood
(0.006)** (0.005)** (0.006)** (0.005)** (0.006)** (0.007)** (0.002)** (0.003)** (0.002)** (0.003)**
Age (years) -0.011 -0.008 -0.001 -0.016 -0.018 0.009 -0.007 -0.009 -0.016 -0.095
(0.002)** (0.001)** (0.001) (0.001)** (0.002)** (0.002)** (0.001)** (0.001)** (0.003)** (0.006)**
Male 0.191 0.159 0.185 0.080 0.044 -0.013 0.009 0.006 0.438 0.062
(0.006)** (0.005)** (0.006)** (0.005)** (0.006)** (0.007)* (0.002)** (0.003)* (0.017)** (0.028)*
Income 0.002 0.001 0.001 0.002 0.005 -0.001 0.000 0.002 0.005 0.017
(10,000 ¥)
(0.002) (0.002) (0.002) (0.002) (0.002)* (0.003) (0.001) (0.001) (0.005) (0.010)
Food 0.219 0.028 0.002 -0.025 0.050 -0.087 -0.040 -0.032 0.124 -0.334
(10,000 ¥)
(0.047)** (0.035) (0.041) (0.038) (0.048) (0.056) (0.018)* (0.020) (0.103) (0.208)
Mean(s) 0.001 0.003 -0.008 0.012 0.014 -0.013 0.002 0.004 -0.012 0.042
of age
(0.002) (0.001)* (0.001)** (0.001)** (0.002)** (0.002)** (0.001)** (0.001)** (0.004)** (0.007)**
Mean(s) 0.149 0.147 0.252 0.138 0.119 0.411 0.184 0.196 1.041 2.063
of food
(0.077) (0.064)* (0.069)** (0.060)* (0.075) (0.087)** (0.030)** (0.034)** (0.195)** (0.349)**
Mean(s) 0.015 0.016 0.014 0.011 0.013 0.027 0.008 0.007 0.066 0.070
of income
(0.003)** (0.003)** (0.003)** (0.003)** (0.003)** (0.003)** (0.001)** (0.001)** (0.008)** (0.014)**
Constant 1.064 0.707 1.118 1.012 0.882 0.836 0.616 0.559 4.198 5.894
(0.022)** (0.019)** (0.021)** (0.017)** (0.021)** (0.024)** (0.009)** (0.010)** (0.061)** (0.102)**
R2-within 0.004 0.003 0.000 0.011 0.009 0.002 0.011 0.014 0.001 0.015
R2-between 0.147 0.118 0.136 0.049 0.028 0.041 0.116 0.114 0.148 0.116
R2-overall
0.083 0.065 0.081 0.031 0.017 0.023 0.070 0.072 0.091 0.073
N 31,169 31,470 30,959 30,957 30,958 28,763 29,326 29,253 30,253 29,145
24
Table 3 Descriptive statistics: placebo outcomes by treatment group
Variable Full sample Treated Control Before matching
Mean SD Mean SD Mean SD Difference T-test
Ever smoke 0.43 0.49 0.44 0.50 0.39 0.49 0.05 6.91
Share of living siblings 0.84 0.26 0.85 0.25 0.79 0.30 0.06 16.02
Note: Estimates obtained using the CHARLS cross-sectional sample of observations present in the years of schooling
variable (N=16,602). SD, standard deviation.
Table 4 Placebo tests
Dependent variable Nearest neighbor Nearest neighbor (k=8) IPW
ATT T-stat ATT T-stat ATT T-stat
Ever smoke -0.002 -0.2 -0.004 -0.5 -0.01 -1.451
Share of living siblings -0.001 -0.167 -0.002 -0.4 -0.001 -0.31
Kernel LLR Mahalanobis
ATT T-stat ATT T-stat ATT T-stat
Ever smoke 0.005 0.625 -0.015 -1.25 0.009 0.818
Share of living siblings 0.001 0.008 -0.003 -0.429 0.004 0.667
CEM Exact Matching CRE IPW
ATT T-stat ATT T-stat ATT T-stat
Ever smoke -0.009 -0.78 -0.007 -0.636 -0.006 -1.12
Share of living siblings 0.002 0.373 0.025 2.72 -0.003 -0.82
Notes: Estimates obtained using the CHARLS pooled sample of observations present in the respective outcome
considered and including only individuals within the common support region.

25
Table A.1 Outcome variables survey questions
Dependent Variables
Variable Survey Question
Type
(original) Type (final) Description
Year of schooling
What is the highest level of education you
have completed? categorical continuous
transformation
based on Chinese
education system
Draw
Do you see this picture? Please draw that
picture on this paper. dummy dummy
1 if drew the
picture
Serial 7
Let’s try some subtraction of numbers this
time. What does 100 minus 7 equal? …and 7
from that? (5 times) count share
mean of correct
answers
Name year Please tell me today’s date. dummy dummy 1 if year is correct
Name month Please tell me today’s date. dummy dummy
1 if month is
correct
Name weekday Please tell me today’s date. dummy dummy
1 if weekday is
correct
Name day Please tell me today’s date. dummy dummy 1 if day is correct
Immediate work recall
We are going to read a list consisting of 10
words, and we would like you to memorize as
many as you can. count share
share of recalled
words
Delayed word recall
Please tell me any of the words that you
remember now (4 minutes after). count share
share of recalled
words
Episodic memory
Aggregates immediate and delayed work
recall variables count share
mean of recalled
words (20 words)
Mental health
Aggregates drawing and today’s date
questions count share
share of correct
answers (5
dichotomous
items)
Placebo Variables
Variable Survey Question
Type
(original) Type (final) Description
Drinking (habitually)
How often did you drink liquor, including
white liquor, whisky, and others per month in
the last year? categorical dummy
1 if every day or
more
Ever smoke
Have you ever chewed tobacco, smoked a
pipe, smoked self-rolled cigarettes, or smoked
cigarettes/cigars? dummy dummy 1 if yes
Share of living siblings
How many of your biological siblings are still
alive? How many of your biological siblings
have died? count continuous
share of living
siblings over the
total (it excludes
observations
without any
sibling)

26
Table A.2 Conditioning variables survey questions
Variable Survey Question
Type
(original) Type (final) Description
Mother
alive Is your biological mother alive? dummy dummy 1 if mother alive
Father alive Is your biological father alive? dummy dummy 1 if father alive
Mother
illiterate
What is the highest level of education your biological
mother completed? categorical dummy
1 if no formal
education (vs. any
other)
Father
illiterate
What is the highest level of education your biological
father completed? categorical dummy
1 if no formal
education (vs. any
other)
Ethnic
minority What ethnicity is [the name of the respondent]? categorical dummy
Han (vs. any
other)
Poor in
childhood
When you were a child before age 17, compared with
the average family in the same
community/village at that time, how was your family’s
financial situation? categorical dummy
1 if worse or a lot
worse off than
others
No child
education
Did you ever miss school for a month or more because
of a health condition before you were 15 years old? categorical dummy
1 if never had any
education before
subject was 15
years old
Hunger in
childhood
At what age ranges did this (your family had no
enough food to eat) happen? categorical dummy
1 if hunger before
age 17
Never been
in hospital
Can you remember the first time you got to see a
doctor? What was the type of the
doctor? categorical dummy
1 if never seen a
doctor
Age Imputed age from exact date of birth continuous continuous Age in years
27
Table A.3 ATT estimates for education and cognitive abilities (excluding childhood education from the set of conditioning
variables)
Dependent variable Nearest neighbor Nearest neighbor (k=8) IPW
ATT T-stat ATT T-stat ATT T-stat
Years of schooling 1.551 15.827 1.526 22.776 1.252 12.178
Drawing 0.112 8.000 0.113 11.300 0.091 7.684
Serial 7 0.090 8.182 0.098 12.250 0.081 10.871
Name year 0.099 7.615 0.092 10.222 0.074 7.093
Name month 0.045 4.091 0.055 6.875 0.043 5.884
Name day 0.058 4.462 0.063 7.000 0.048 5.626
Name weekday 0.092 6.571 0.085 8.500 0.079 8.728
Immediate recall 0.034 6.800 0.040 10.000 0.035 7.240
Delayed recall 0.034 5.667 0.045 11.250 0.038 7.843
Mental health 0.078 8.667 0.079 13.167 0.064 10.194
Episodic memory 0.030 6.000 0.040 13.333 0.029 11.257
Dependent variable Kernel LLR Mahalanobis
ATT T-stat ATT T-stat ATT T-stat
Years of schooling 1.602 28.105 1.345 10.037 1.579 11.784
Drawing 0.117 14.625 0.103 5.421 0.117 6.158
Serial 7 0.097 16.167 0.088 5.867 0.097 6.467
Name year 0.094 11.750 0.080 4.444 0.111 6.167
Name month 0.056 8.000 0.046 3.067 0.010 0.667
Name day 0.058 7.250 0.053 2.944 0.029 1.611
Name weekday 0.092 11.500 0.084 4.421 0.123 6.474
Immediate recall 0.043 14.333 0.040 5.714 0.023 3.286
Delayed recall 0.047 15.667 0.043 5.375 0.020 2.500
Mental health 0.080 16.000 0.070 5.833 0.076 6.333
Episodic memory 0.045 15.000 0.041 5.857 0.018 2.571
Notes: Estimates obtained using the CHARLS pooled sample of observations present in the respective outcome
considered and including only individuals within the common support region. IPW, inverse probability weighting; LLR,
local linear regression.
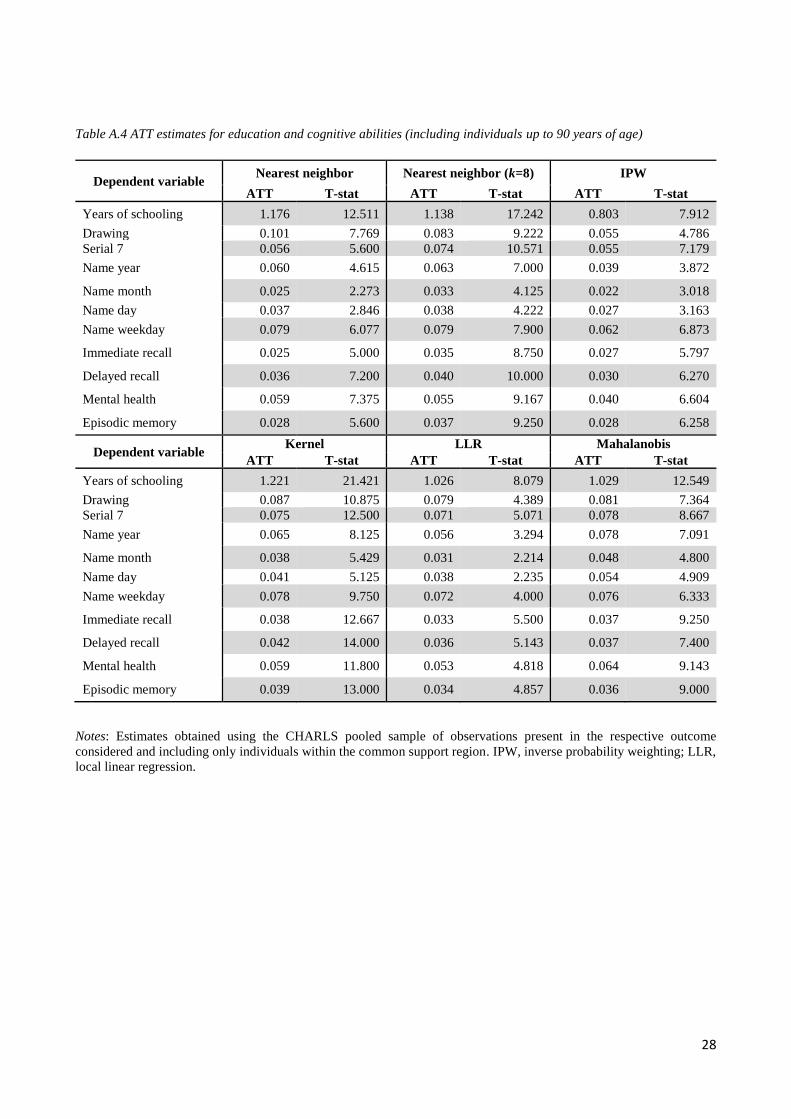
28
Table A.4 ATT estimates for education and cognitive abilities (including individuals up to 90 years of age)
Dependent variable Nearest neighbor Nearest neighbor (k=8) IPW
ATT T-stat ATT T-stat ATT T-stat
Years of schooling 1.176 12.511 1.138 17.242 0.803 7.912
Drawing 0.101 7.769 0.083 9.222 0.055 4.786
Serial 7 0.056 5.600 0.074 10.571 0.055 7.179
Name year 0.060 4.615 0.063 7.000 0.039 3.872
Name month 0.025 2.273 0.033 4.125 0.022 3.018
Name day 0.037 2.846 0.038 4.222 0.027 3.163
Name weekday 0.079 6.077 0.079 7.900 0.062 6.873
Immediate recall 0.025 5.000 0.035 8.750 0.027 5.797
Delayed recall 0.036 7.200 0.040 10.000 0.030 6.270
Mental health 0.059 7.375 0.055 9.167 0.040 6.604
Episodic memory 0.028 5.600 0.037 9.250 0.028 6.258
Dependent variable Kernel LLR Mahalanobis
ATT T-stat ATT T-stat ATT T-stat
Years of schooling 1.221 21.421 1.026 8.079 1.029 12.549
Drawing 0.087 10.875 0.079 4.389 0.081 7.364
Serial 7 0.075 12.500 0.071 5.071 0.078 8.667
Name year 0.065 8.125 0.056 3.294 0.078 7.091
Name month 0.038 5.429 0.031 2.214 0.048 4.800
Name day 0.041 5.125 0.038 2.235 0.054 4.909
Name weekday 0.078 9.750 0.072 4.000 0.076 6.333
Immediate recall 0.038 12.667 0.033 5.500 0.037 9.250
Delayed recall 0.042 14.000 0.036 5.143 0.037 7.400
Mental health 0.059 11.800 0.053 4.818 0.064 9.143
Episodic memory 0.039 13.000 0.034 4.857 0.036 9.000
Notes: Estimates obtained using the CHARLS pooled sample of observations present in the respective outcome
considered and including only individuals within the common support region. IPW, inverse probability weighting; LLR,
local linear regression.