Embed Size (px)
Citation preview
The Longitudinal Course of Adolescent Bipolar Disorder as Revealed Through Weekly Self-
Report, Using Internet and Text-Messaging-Based Mood Monitoring
by
Jedediah M. Bopp
B.A., Earlham College, Richmond, IN, 1999
M.A., University of Colorado, Boulder, 2009
A thesis submitted to the
Faculty of the Graduate School of the
University of Colorado in partial fulfillment
of the requirement for the degree of
Doctor of Philosophy
Department of Psychology and Neuroscience
2014
This thesis entitled: The Longitudinal Course of Adolescent Bipolar Disorder as Revealed Through Weekly Self-
Report, Using Internet and Text-Messaging-Based Mood Monitoring written by Jedediah Michael Bopp
has been approved for the Department of Psychology and Neuroscience
David Miklowitz, Ph.D.
Sona Dimidjian, Ph.D.
Erik Willcutt, Ph.D.
Gregory Carey, Ph.D.
Roger King, Ph.D.
Date: December 19, 2013
The final copy of this thesis has been examined by the signatories, and we find that both the content and the form meet acceptable presentation standards
of scholarly work in the above mentioned discipline.
University of Colorado IRB protocol # 0805.18 McLean Hospital IRB protocol # ____2012P001799____

iii
Bopp, Jedediah, M (Ph.D., Clinical Psychology, Department of Psychology and Neuroscience)
The Longitudinal Course of Adolescent Bipolar Disorder as Revealed Through Weekly Self-
Report, Using Internet and Text-Messaging-Based Mood Monitoring
Thesis directed by Dr. David Miklowitz.
BACKGROUND: Most longitudinal research in adolescent and adult bipolar populations relies
on the memory of participants recalling historical moods spanning months or even years. Asking
people to recall these historical mood episodes subjects resulting data to recall biases. The
current study aims to examine the feasibility and validity of a method for collecting course of
illness data in real-time, from adolescents with bipolar I and II disorder using the TrueColours
Self-Management System (TCSMS), a text-message and Internet-based mood monitoring system
for individuals with bipolar disorder.
METHODS: A total of 18 adolescents (male = 6 , female = 12; mean age = 17) with bipolar
disorder (BPI = 12, BPII = 6) and 22 (male = 12, female = 10; mean age = 15) adolescents
without any mood disorder, provided mood ratings in response to weekly cell phone text-
message or email prompts (Text = 15, Email = 3) for 3 months. Participants provided weekly
ratings on the Altman Self-Rating Mania Scale and the Quick Inventory of Depressive
Symptoms Self-Report. Comparisons on time spent with mood symptoms were made between
the bipolar and control groups.
RESULTS: Control participants were significantly more adherent to the TCSMS weekly
protocol than bipolar participants. By TCSMS ratings, bipolar participants differed from controls
both the average severity of depressive symptoms and in the variability of depressive symptoms
over time. Bipolar subjects reported the majority of weeks with depressive symptoms; of

iv
depressed weeks, the majority were spent with mild symptoms. Bipolar and control participants
did not differ on average severity of reported mania symptoms, variability of these symptoms
over, or number of polarity switches. Among the bipolar participants, higher mania ratings were
associated with more polarity switches over time. More time with manic symptoms predicted
more time spent with mixed manic and depressive symptoms.
CONCLUSIONS: The TCSMS may be a reliable alternative to clinician-gathered, retrospective
data in the longitudinal course of adolescent bipolar disorder. However, the study is limited by
shorter follow-up duration, that may not have allowed sufficient time for manic symptoms to
present themselves, resulting in lack of differentiation between bipolar and control participants

DEDICATION
For Grace
vi
ACKNOWLEDGEMENTS
I am incredibly grateful for the guidance and mentorship of my graduate adviser, David
Miklowitz, who very early on, believed in me. His commitment to my development as a
researcher and clinician has been unwavering. From his decision to welcome me in to his lab
during my first graduate year, to his encouragement and collaboration in writing numerous grant
proposals to fund my dissertation research, he has shown dedication to my career that has been
immeasurably supportive. With equal parts humor and toughness, Dr. Miklowitz has expertly
shepherded me through the often-bewildering process of graduate school.
I have been lucky to work with the members of my dissertation committee, Drs.
Gregory Carey, Sona Dimidjian, Roger King, and Erik Willcutt throughout my graduate career.
It was with their support, insight and thoughtful feedback that I have completed this dissertation
project. I must also specifically thank Dr. Donald Weatherly for his support throughout my time
at the University of Colorado. Without this I would not be where I am today. I am also grateful
for the support of my labmates at the Colorado Family Project. I could not have done this work
without the masterful assistance of Chris Hawkey, Zachary Millman, Jessica Lunsford, and
Dawn Taylor.
I have been blessed with a family that has supported me throughout this process. My
wife, Becky, has provided the bedrock of support. Without her, this train would have left the rails
long ago. My parents have gotten me here. My grandparents were the catalyst. My friends…my
friends have made the entire process bearable and even fun. Thank you.
vii
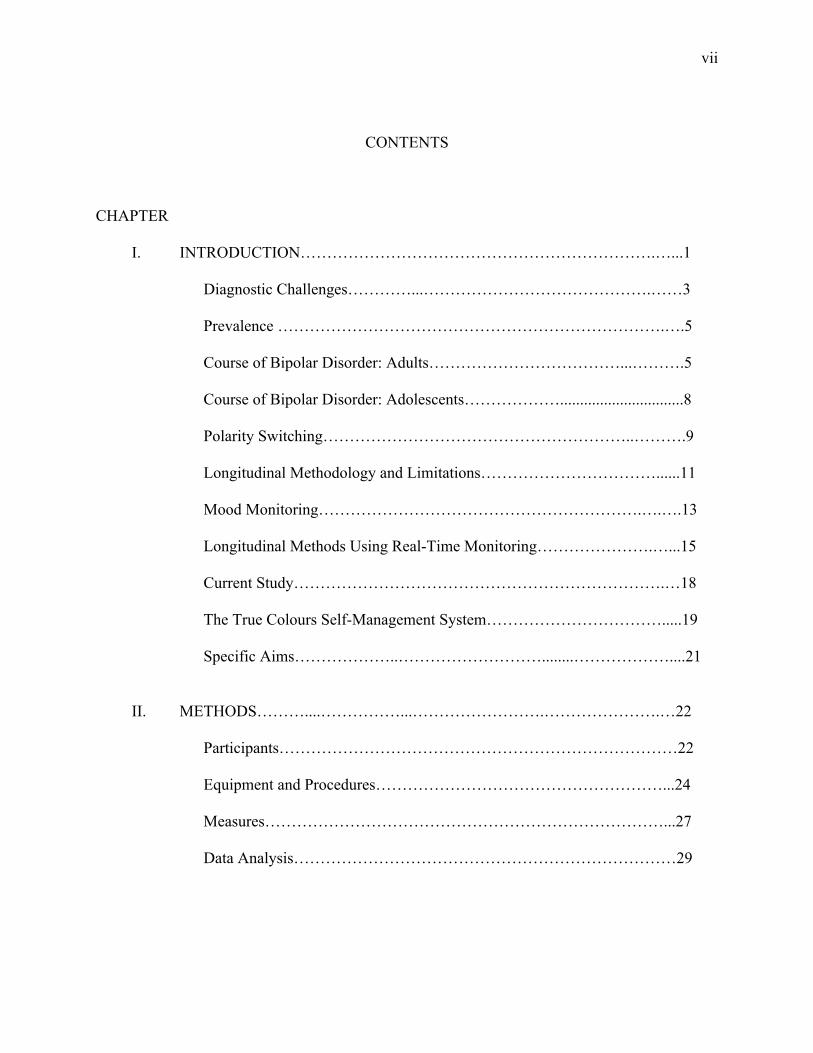
CONTENTS
CHAPTER I. INTRODUCTION………………………………………………………….…...1 Diagnostic Challenges…………...…………………………………….……3 Prevalence ……………………………………………………………….….5
Course of Bipolar Disorder: Adults………………………………...……….5 Course of Bipolar Disorder: Adolescents………………...............................8
Polarity Switching…………………………………………………..……….9 Longitudinal Methodology and Limitations……………………………......11 Mood Monitoring…………………………………………………….….….13 Longitudinal Methods Using Real-Time Monitoring………………….…...15 Current Study…………………………………………………………….…18 The True Colours Self-Management System…………………………….....19 Specific Aims………………..………………………........………………....21
II. METHODS………....……………...…………………….………………….…22 Participants…………………………………………………………………22 Equipment and Procedures………………………………………………...24 Measures…………………………………………………………………...27 Data Analysis………………………………………………………………29
viii
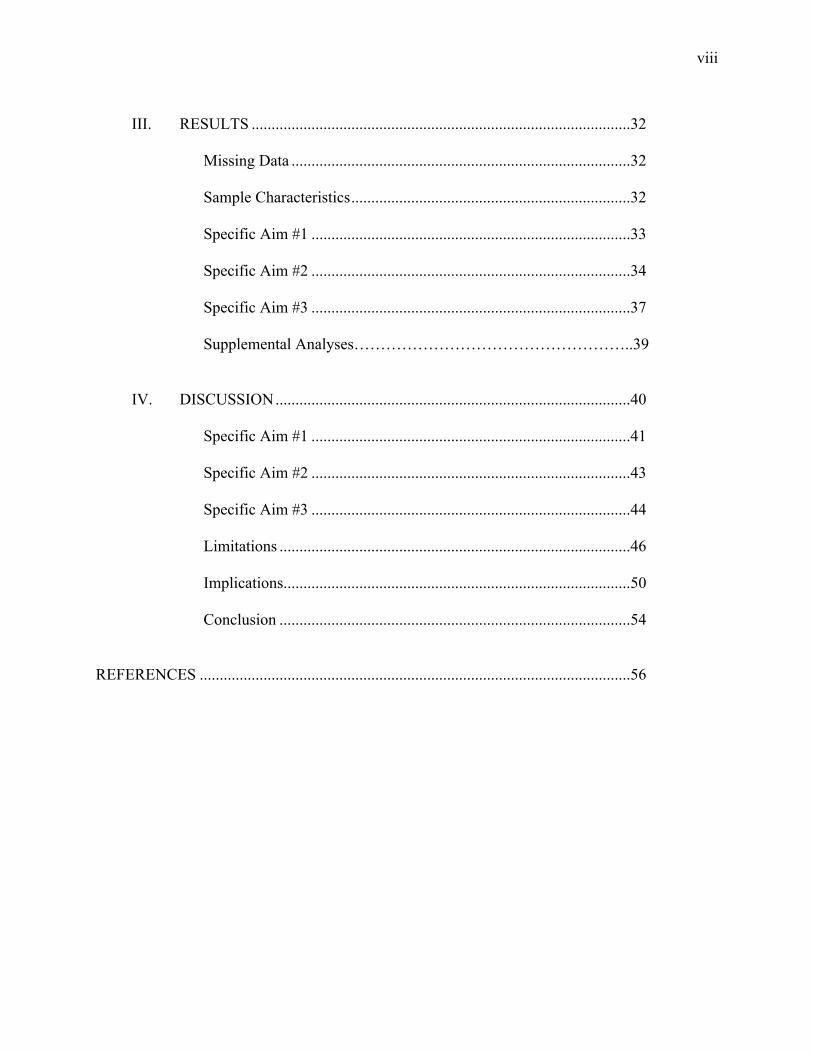
III. RESULTS ...............................................................................................32
Missing Data .....................................................................................32
Sample Characteristics ......................................................................32 Specific Aim #1 ................................................................................33 Specific Aim #2 ................................................................................34 Specific Aim #3 ................................................................................37 Supplemental Analyses……………………………………………..39 IV. DISCUSSION .........................................................................................40 Specific Aim #1 ................................................................................41 Specific Aim #2 ................................................................................43 Specific Aim #3 ................................................................................44 Limitations ........................................................................................46 Implications .......................................................................................50 Conclusion ........................................................................................54 REFERENCES ............................................................................................................56
ix
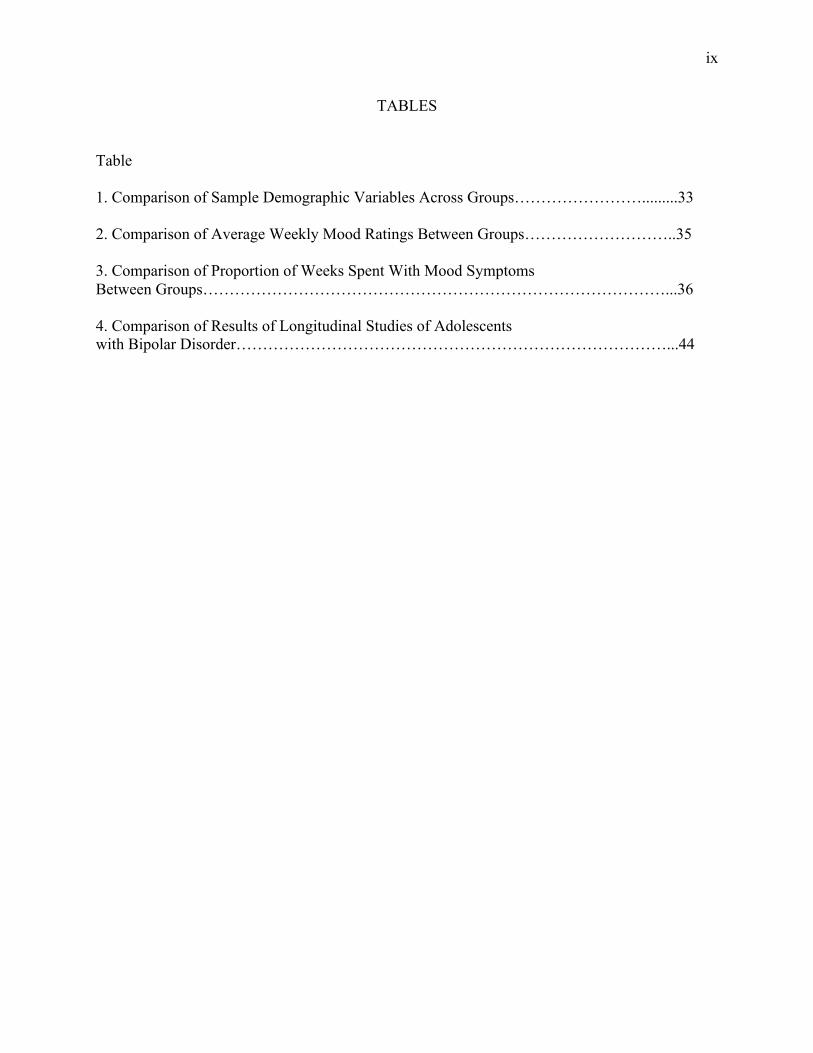
TABLES
Table
1. Comparison of Sample Demographic Variables Across Groups…………………….........33
2. Comparison of Average Weekly Mood Ratings Between Groups………………………..35
3. Comparison of Proportion of Weeks Spent With Mood Symptoms Between Groups……………………………………………………………………………...36 4. Comparison of Results of Longitudinal Studies of Adolescents with Bipolar Disorder………………………………………………………………………...44
x
FIGURES
Figure
1. TCSMS Single Subject Data For 11 Months………………..…………………………20
2. The TrueColours Self-Management System International Computer-to-Text Interface………………………………..…….…………………….25
3. Average Weekly Mood Ratings Over Time Between Bipolar and Control
Subjects………………………………………………….………….………………....37
4. Proportion of Time Spent in Mood States Within Bipolar Participants…………….....38
5. Depression Severity Over Time Within Bipolar Participants…………...……………..39

1
CHAPTER I
INTRODUCTION
Methods to efficiently and accurately distinguish between normal adolescent moodiness
and bipolar disorder are integral to early intervention. Adolescent-onset bipolar disorder is a
debilitating illness with a chronic course and generally poor outcome (Biederman, Mick,
Faraone, Van Patten, Burback, & Wozniak 2004). Adolescent bipolar disorder is a serious public
health problem (Faedda, et al., 1995) and children and adolescents with bipolar disorder account
for a significant number of emergency home visits and psychiatric hospitalizations and suffer
from one of the most impairing forms of psychopathology (Biederman, 1998). In a sample of
529 adults with early (ages 13 to 18) onset bipolar disorder, Post et al. (2010) found an inverse
correlation between age at onset and initial diagnosis. This delay in diagnosis and treatment was
associated with a more severe and chronic illness course. Given the lag in symptom onset and
accurate diagnosis and treatment, early detection and treatment is essential in mitigating harmful
and potentially fatal outcomes.
Bipolar disorder exacts a significant toll on the health and well being of diagnosed
individuals, their caregivers, and family members. Bipolar disorder is associated with increased
risk for serious health problems. Individuals with bipolar disorder are at risk for developing heart
disease and diabetes mellitus (Kupfer, 2005). An individual with bipolar disorder is at
significantly higher risk for both attempted suicide as well as completed suicide than an
individual without such a diagnosis (Tondo Isacsson, & Baldessarini, 2003).
In an analysis of over 300,000 employees across six companies, Goetzel, Hawkins,
Ozminkowski, and Wang (2003) found that the expenses associated with the maintenance
treatment of bipolar disorder were more costly to employers than major depression, alcoholism

2
or anxiety disorders. Begley, Annengers, Swann, Lewis, Coan, Schnapp, and Bryant-Coomstock
(2001) estimated the total lifetime cost of treating individuals with bipolar disorder in the United
States in 1998 to be approximately 24 billion dollars. They estimated the lifetime cost of treating
a single bipolar individual to range from approximately eleven thousand dollars for an individual
with a single manic episode, to over six hundred thousand dollars for the treatment of a
chronically ill individual. Identification and treatment of bipolar disorder at an early age could
mitigate many of these devastating personal and financial consequences of the disorder. While
there are no studies directly examining cost-savings related to early intervention, hospitalization
does account for a substantial portion of direct costs associated with treatment of individuals
with bipolar disorder (Begley, et al. 2001). Peele, Xu and Kupfer (2003) analyzed insurance
claims for over 1.5 million individuals over the course of one year, and found that for every
dollar spent on the outpatient treatment of bipolar disorder, $1.80 was spent on inpatient
hospitalization. Goldberg and Ernst (2002) found that delay in the onset of affective symptoms to
the identification and treatment if bipolar disorder resulted in an increase in frequency of
inpatient hospitalizations. It is therefore reasonable to conclude that early intervention would in
fact, defray direct costs via reduction in hospitalization and indirect costs via decreased financial
burdens on caregivers.
The long-term prognosis for individuals diagnosed with bipolar disorder in adolescence is
poor relative to prognosis for individuals diagnosed in early adulthood or later. Compared with
adult-onset bipolar disorder, adolescent-onset bipolar is associated with more cycling between
mood states, more chronic depression, and more lifetime manic and hypomanic episodes
(Leverich, Post, Keck, Altshuler, Frye, et al., 2007). Individuals with onset of bipolar disorder
between the ages of 13 and 18 are more likely that those who experience onset in adulthood, to
3
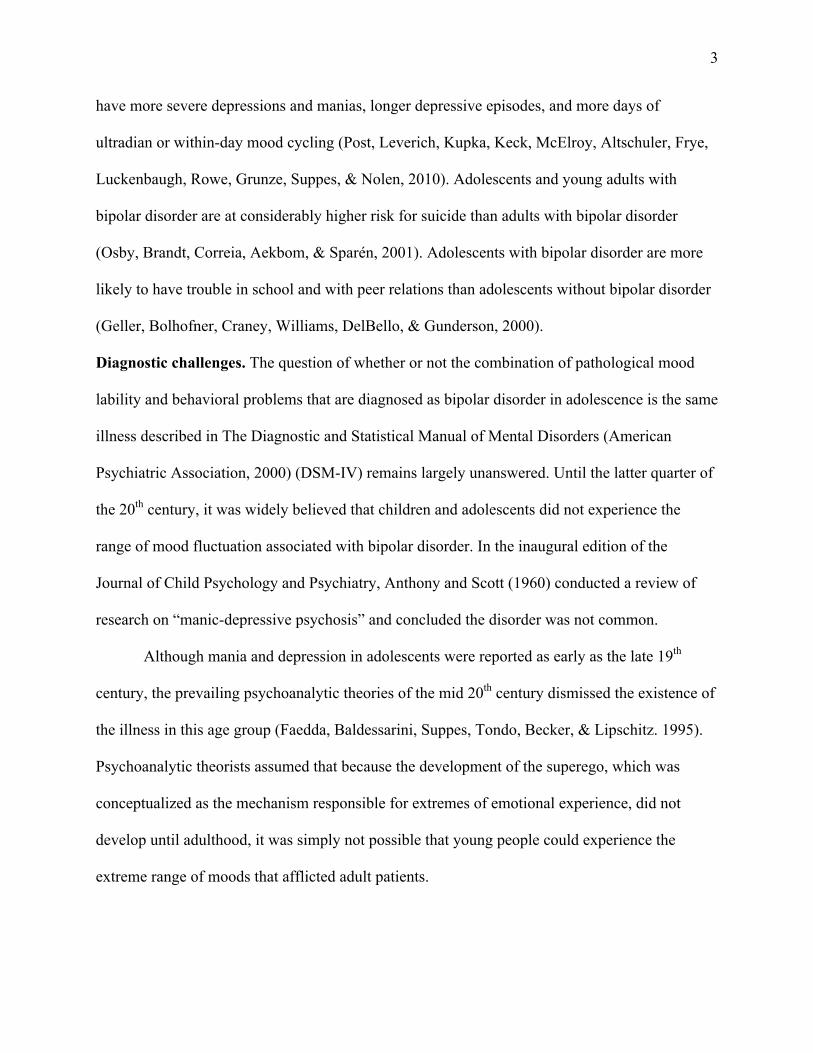
have more severe depressions and manias, longer depressive episodes, and more days of
ultradian or within-day mood cycling (Post, Leverich, Kupka, Keck, McElroy, Altschuler, Frye,
Luckenbaugh, Rowe, Grunze, Suppes, & Nolen, 2010). Adolescents and young adults with
bipolar disorder are at considerably higher risk for suicide than adults with bipolar disorder
(Osby, Brandt, Correia, Aekbom, & Sparén, 2001). Adolescents with bipolar disorder are more
likely to have trouble in school and with peer relations than adolescents without bipolar disorder
(Geller, Bolhofner, Craney, Williams, DelBello, & Gunderson, 2000).
Diagnostic challenges. The question of whether or not the combination of pathological mood
lability and behavioral problems that are diagnosed as bipolar disorder in adolescence is the same
illness described in The Diagnostic and Statistical Manual of Mental Disorders (American
Psychiatric Association, 2000) (DSM-IV) remains largely unanswered. Until the latter quarter of
the 20th century, it was widely believed that children and adolescents did not experience the
range of mood fluctuation associated with bipolar disorder. In the inaugural edition of the
Journal of Child Psychology and Psychiatry, Anthony and Scott (1960) conducted a review of
research on “manic-depressive psychosis” and concluded the disorder was not common.
Although mania and depression in adolescents were reported as early as the late 19th
century, the prevailing psychoanalytic theories of the mid 20th century dismissed the existence of
the illness in this age group (Faedda, Baldessarini, Suppes, Tondo, Becker, & Lipschitz. 1995).
Psychoanalytic theorists assumed that because the development of the superego, which was
conceptualized as the mechanism responsible for extremes of emotional experience, did not
develop until adulthood, it was simply not possible that young people could experience the
extreme range of moods that afflicted adult patients.

4
Attitudes changed considerably toward the latter half of the 20th century (Pavuluri,
Birhamer and Naylor, 2005). While the existence of bipolar disorder in adolescence is no longer
controversial per se (Miklowitz and Johnson, 2006), considerable debate exists about very basic
questions related to prevalence and course of illness.
Lack of consensus on the etiology of adolescent-onset bipolar disorder creates substantial
challenges in interpreting the current body of research, and in the development of clinical tools.
Bipolar disorder appeared in 1952 in the first edition of The Diagnostic and Statistical Manual of
Mental Disorders as “manic depressive reaction,” In the subsequent editions of DSM, II, III, III-
R, IV, IV-TR published in 2000, a total of 48 years, and seven editions of the manual, there is no
mention of a child or adolescent analog.
The recently published DSM-5 (American Psychiatric Association, 2013) provides a new
diagnosis of “Disruptive Mood Regulation Disorder,” (DMDD). This additional diagnosis was
borne out of attempts of the Childhood and Adolescent Disorders DSM-5 working group to
delineate presentations of pediatric and adolescent bipolar disorder that did not fit the exact
diagnostic parameters of the adult illness as described in prior editions. The final product,
however would appear to be more of a “horse designed by committee” than a useful and precise
tool to provide guidance in diagnosing bipolar disorder in adolescence.
DSM-5 does not resolve the issue by creating a set of diagnostic criteria for children and
adolescents with bipolar disorder. This may result from the lack of consistency among results of
longitudinal research, and a lack of longer-term studies that follow children diagnosed with
bipolar disorder through to adulthood. We still do not have a satisfying answer to the oft-asked
question: “what happens to these kids when they grow up?”

5
While adults typically experience euphoric and grandiose mania, adolescents more often
experience severe emotional dysregulation, aggression, and irritability (Biederman, 2006).
Typical presentation of mania in adolescents involves severe irritability, emotional lability, and
violent and aggressive outbursts or “affective storms” (Davis, 1979). Compared with the more
common episodic mood fluctuations seen in adult bipolar disorder, adolescents tend to cycle
rapidly even within a single day, or to have mixed states (a combination of depression and
mania, best conceptualized of as a highly agitated and energized combination of depression and
irritability). Additionally the course of the illness over the lifespan is more chronic for those with
illness-onset in adolescence than it is for individuals with bipolar disorder that appears later
(Biederman, Faraone, Mick, Wozniak, Chen, et al., 1996, Kim & Miklowitz, 2002).
Prevalence. In a review of the last 10 years of research on adolescent bipolar disorder, Pavuluri
et al. (2005) reported prevalence rates for adolescent bipolar disorder of less than 2% in the
general population. Using consensus scores on the Washington University Kiddie Schedule for
Affective Disorders and Schizophrenia mania and rapid cycling and depression sections
(KSADS-MRS and DRS) and the Children’s Interview for Psychiatric Symptoms (ChIPS) to
determine bipolar disorder diagnoses in a group of 391 adolescents admitted to an inpatient
psychiatric hospital, Hunt and colleagues found significantly higher prevalence rates of up to
20% (Hunt, Armstrong, Litvin, Sheeran & Spirito, 2006). The discrepancy in prevalence rates
between general and hospitalized populations indicates the disorder is severe enough to require
hospitalization for a significant number of individuals and that bipolar disorder accounts for a
significant number of psychiatric hospitalizations in juvenile inpatient units. In a sample of 50
youth aged 11 to 17 in a juvenile detention facility, 22% of subjects met criteria for mania
(Pliszka, Sherman, Barrow, & Irick, 2000). High prevalence rates in hospitalized and

6
incarcerated populations suggest bipolar disorder in adolescent populations is associated with
significant functional impairment and developmental disruption.
Bipolar disorder is typically diagnosed in young adulthood, with a mean age of onset of
18 years (Merikangas, Akiskal, Anheygst, Greenberg, Hirschfeld, Petukhova, et al., 2007). It
appears however, that many individuals present symptoms of bipolar disorder significantly
earlier. Perlis and colleagues (2004) interviewed individuals diagnosed with bipolar disorder and
based on these interviews, found that of nearly 1000 individuals diagnosed with bipolar disorder,
over 27% would have qualified for a diagnosis of bipolar disorder at or before age 13, and over
37% would have qualified for diagnosis at or before age 18. Chang, Steiner, and Ketter (2000)
found 44% of adult bipolar participants had a mean age of onset of 14.8 years, suggesting a large
population of children likely remain undiagnosed or misdiagnosed during a time when bipolar-
specific interventions could positively impact future outcomes.
Course of Bipolar Disorder: Adults
Bipolar disorder is fundamentally conceptualized of in terms of fluctuation and change in
mood over time. Therefore, nearly all research on bipolar disorder must be longitudinal in nature.
Adult bipolar tends to be a chronic, recurrent illness. The predominant mood polarity is
depressive, and more time is spent either depressed or manic/hypomanic than euthymic.
Using self-reported data gathered daily over the course of one year, Kupka and
colleagues (2007) followed 507 adults diagnosed with bipolar disorder. Subjects spent three
times more days depressed than manic or hypomanic and were euthymic approximately 50% of
assessed weeks. Participants in this study made daily ratings using the National Institute of
Mental Health (NIMH) Life Chart, which were evaluated by clinicians during weekly or monthly
7
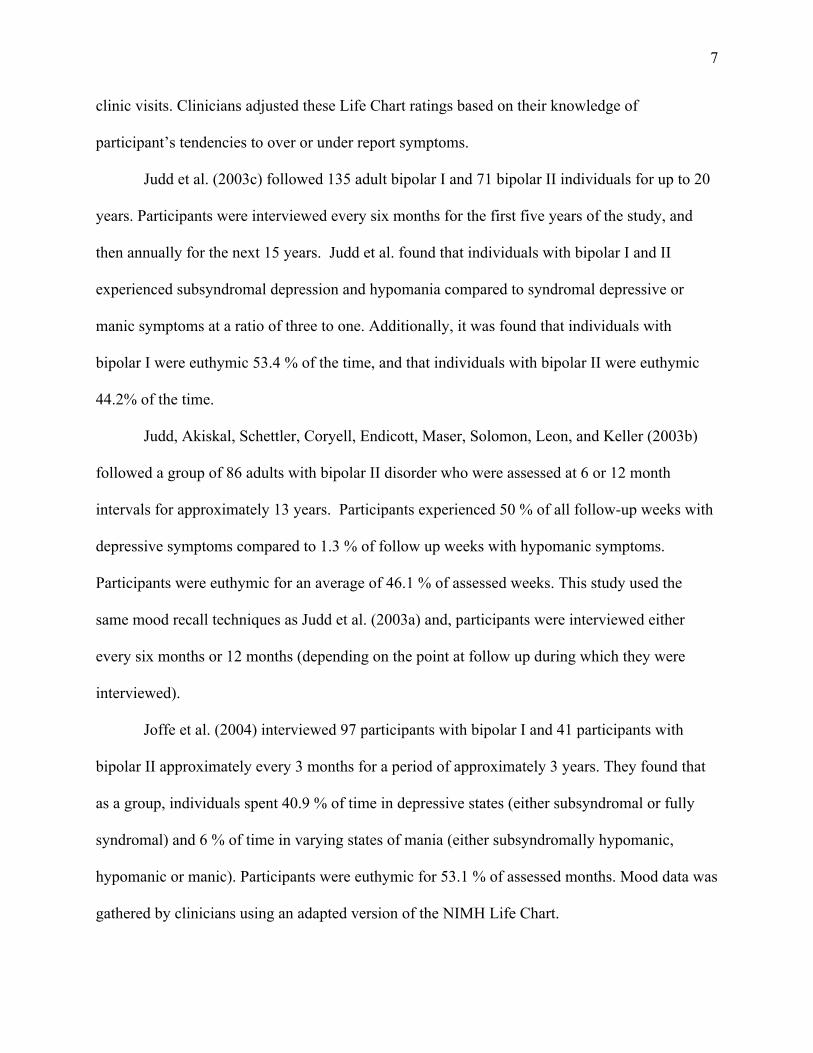
clinic visits. Clinicians adjusted these Life Chart ratings based on their knowledge of
participant’s tendencies to over or under report symptoms.
Judd et al. (2003c) followed 135 adult bipolar I and 71 bipolar II individuals for up to 20
years. Participants were interviewed every six months for the first five years of the study, and
then annually for the next 15 years. Judd et al. found that individuals with bipolar I and II
experienced subsyndromal depression and hypomania compared to syndromal depressive or
manic symptoms at a ratio of three to one. Additionally, it was found that individuals with
bipolar I were euthymic 53.4 % of the time, and that individuals with bipolar II were euthymic
44.2% of the time.
Judd, Akiskal, Schettler, Coryell, Endicott, Maser, Solomon, Leon, and Keller (2003b)
followed a group of 86 adults with bipolar II disorder who were assessed at 6 or 12 month
intervals for approximately 13 years. Participants experienced 50 % of all follow-up weeks with
depressive symptoms compared to 1.3 % of follow up weeks with hypomanic symptoms.
Participants were euthymic for an average of 46.1 % of assessed weeks. This study used the
same mood recall techniques as Judd et al. (2003a) and, participants were interviewed either
every six months or 12 months (depending on the point at follow up during which they were
interviewed).
Joffe et al. (2004) interviewed 97 participants with bipolar I and 41 participants with
bipolar II approximately every 3 months for a period of approximately 3 years. They found that
as a group, individuals spent 40.9 % of time in depressive states (either subsyndromal or fully
syndromal) and 6 % of time in varying states of mania (either subsyndromally hypomanic,
hypomanic or manic). Participants were euthymic for 53.1 % of assessed months. Mood data was
gathered by clinicians using an adapted version of the NIMH Life Chart.
8
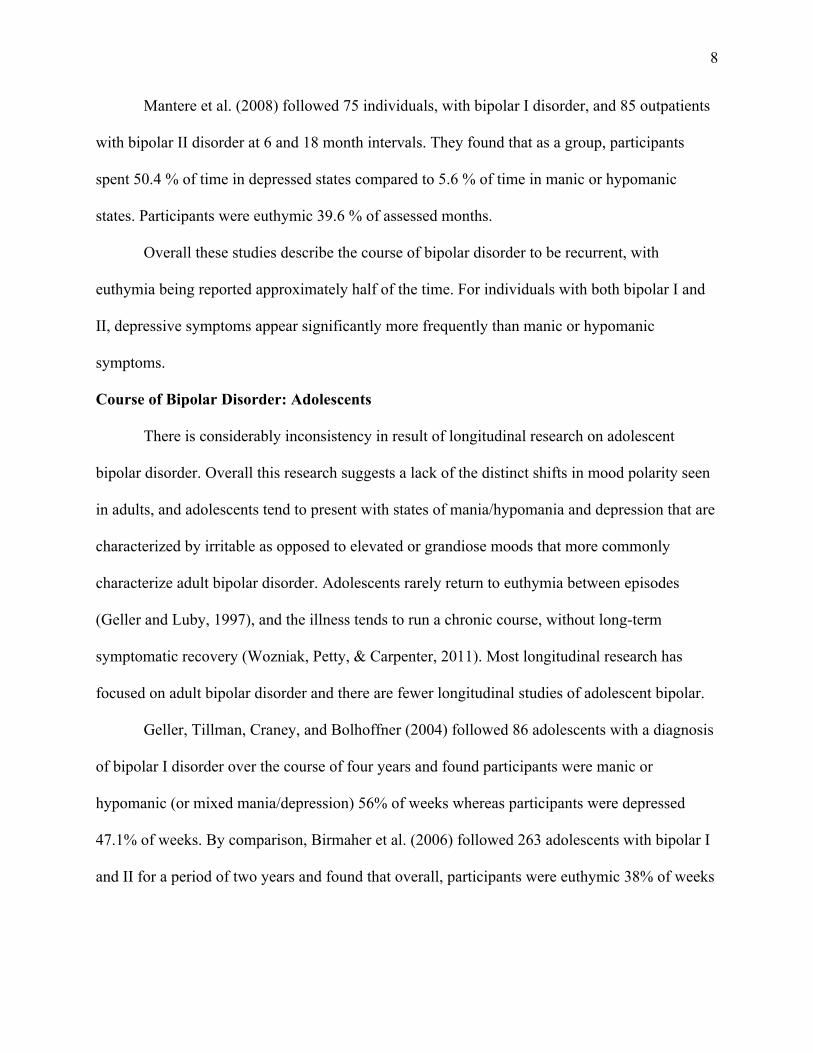
Mantere et al. (2008) followed 75 individuals, with bipolar I disorder, and 85 outpatients
with bipolar II disorder at 6 and 18 month intervals. They found that as a group, participants
spent 50.4 % of time in depressed states compared to 5.6 % of time in manic or hypomanic
states. Participants were euthymic 39.6 % of assessed months.
Overall these studies describe the course of bipolar disorder to be recurrent, with
euthymia being reported approximately half of the time. For individuals with both bipolar I and
II, depressive symptoms appear significantly more frequently than manic or hypomanic
symptoms.
Course of Bipolar Disorder: Adolescents
There is considerably inconsistency in result of longitudinal research on adolescent
bipolar disorder. Overall this research suggests a lack of the distinct shifts in mood polarity seen
in adults, and adolescents tend to present with states of mania/hypomania and depression that are
characterized by irritable as opposed to elevated or grandiose moods that more commonly
characterize adult bipolar disorder. Adolescents rarely return to euthymia between episodes
(Geller and Luby, 1997), and the illness tends to run a chronic course, without long-term
symptomatic recovery (Wozniak, Petty, & Carpenter, 2011). Most longitudinal research has
focused on adult bipolar disorder and there are fewer longitudinal studies of adolescent bipolar.
Geller, Tillman, Craney, and Bolhoffner (2004) followed 86 adolescents with a diagnosis
of bipolar I disorder over the course of four years and found participants were manic or
hypomanic (or mixed mania/depression) 56% of weeks whereas participants were depressed
47.1% of weeks. By comparison, Birmaher et al. (2006) followed 263 adolescents with bipolar I
and II for a period of two years and found that overall, participants were euthymic 38% of weeks

9
followed, depressed 6.3% of weeks, and manic or hypomanic 3.9% of weeks. Participants were
subsyndromally symptomatic 37% of weeks.
Birmaher et al. (2009) followed a group of 413 youths between the age of 7 and 17 with
diagnoses of Bipolar I, II and NOS, for four years and found them to be symptomatic 60% of
weeks, with depression and states of “mixed polarity” or mood symptoms in a combination of
both elevated and depressed states, most commonly reported. These participants showed very
high rates of clinical recovery and relapse, which indicate a course of illness that fluctuates often.
They also found, however, that these subjects also had high rates of subsyndromal symptoms,
even when they were considered “recovered” because they did not meet full symptom
requirements for a diagnosis of a true mood episode. This suggests that although “recovery” as
measured by clinical symptom reduction to sub-threshold levels does occur, these patients
continue to suffer from functional impairment and distress related to sub-clinical mood states, for
a significant portion of “recovered” time.
These results do not present a consistently described course of illness. Overall it is clear
that despite differences in observed proportions of time spent in episode, the adolescent
phenotype of bipolar disorder is more chronic, with less time spent euthymic than with
subsyndromal or syndromal symptoms levels, and less episodic in nature than the adult
presentation.
Polarity Switching
While fluctuating moods are the hallmark of bipolar disorder, few studies actually
explicitly attempt to quantify the phenomenon of switching between elevated and depressed
mood without a significant period of recovery. Studies that describe “rapid cycling” bipolar
disorder, defined by at least 4 distinct episodes of mania, hypomania or depression, may not
10
capture the typically adolescent phenotype in which mood states can fluctuate day-to-day, or
week-to-week. Because a central goal of any treatment for bipolar disorder is to stabilize mood,
switching between mood states may suggest differing prognosis or treatment.
Maj, Pirozzi, Magliano, and Bartoli (2002) found that in an adult population, polarity
shifts predict poor outcomes and longer time spent in episode. Identifying patients that tend to
switch mood states more than others could allow providers to intervene more effectively,
possibly stabilizing the switching process, leading to less functional impairment.
Judd et al. (2003a) found that 19.8 % of individuals experienced one polarity switch per
year in the 13 years they were followed, and that 24.4 % switched polarities more than 5 times
per year.
In a comparison of adults with bipolar I and bipolar II, Judd et al. (2003c) found
individuals with bipolar I experienced an average of 5.9 switches per year, and individuals with
bipolar II experienced an average of 3.8 switches per year.
Switching data for adolescents are both inconsistent and limited. In a four-year analysis
of 82 juveniles with bipolar I disorder Geller, et al. (2004) found an average of 1.1 polarity
switches per year. By comparison, Birmaher et al. (2009) followed 413 adolescents with bipolar
I and II disorder for two years and found that 38.7% of participants switched polarity more than
10 times per year and that 23.7% switched polarity more than 20 times per year. There was no
significant difference in the number of switches between participants with bipolar II and I. Both
adolescent studies used retrospective, clinician-gathered ratings of week-to-week symptom
severity to determine weekly mood polarity shifts.
In sum, there remains little consistency in observed numbers of polarity shifts over time
in populations of adolescents with bipolar disorder, with a range of one to more than 20 switches
11
per year. These discrepancies may be attributed to different definitions of a polarity switch (i.e.
only counting changes between fully symptomatic vs, subsyndromal symptom levels). The
question of how often switches occur remains.
Longitudinal Methodology and Limitations
In their seminal paper, “Diagnostic Criteria For Use in Psychiatric Research,” Feighner et
al. (1972), suggest that in order to differentiate illnesses that share fully or partially overlapping
diagnostic criteria, efforts must be made to understand an illness over time in order to determine
change in presentation, which itself may be diagnostic. Researching mood disorders presents
major methodological challenges, not least of which is ensuring participants accurately report
their mood.
Recall bias and compliance. In diagnostic interviews and in most studies of longitudinal
course of bipolar disorders, individuals are asked to retrospectively recall affective states, their
duration and specific behaviors that did or did not occur during preceding months or years (e.g. ,
Goldberg et al., 2004, Judd, et al. 2003, Judd et al., 2003a, Judd et al., 2003b, Mantere et al.,
2008, & Rosa et al., 2008). Accurately recalling historical moods presents challenges to healthy
individuals, and presents unique problems for individuals with mood disorders.
Memory of past events is significantly affected not only by the emotional state
experienced during the historical episode being recalled, but by the emotional state being
experienced by the individual during the interview. Burt, Zember, and Niederehe (1995)
conducted a meta-analysis of research related to mood and memory and found recall of positive
events by depressed individuals to be impaired, and recall of negative events to be enhanced.
Depressed people remember fewer positive events, and more negative events.

12
Similarly, Burt (1992) induced pleasant or unpleasant mood in participants and asked
them to recall pleasant and unpleasant events over the course of the past several weeks. They
found that participants induced to positive mood recalled more pleasant events, and participants
induced to negative mood recalled more negative events.
Simon and Rutter (2007) compared retrospective recall of manic and hypomanic
symptoms over three months with telephone interview assessments conducted between each 3-
month follow-up. They found sensitivity for recalling symptoms of mania to be 63% and
sensitivity for recalling absence of manic symptoms to be 76%. For both diagnostic and
treatment purposes, the rates of agreement between weekly assessment and three month recall of
manic symptoms is only marginally acceptable.
Ben-Zeev, Young and Madsen (2009) compared a group of depressed individuals to a
group of non-depressed controls. Both groups were given personal digital assistants (PDAs) that
were programmed to ask participants to complete a depression rating every 1.5 hours for one
week. At the end of the week, participants were asked to complete ratings of positive and
negative affect for the previous week. When compared with the contemporaneously collected
data, both groups overestimated both positive and negative affect, and depressed participants
were less accurate than control participants when retrospectively recalling both mood states.
This research suggests that individuals who fluctuate significantly in mood may likely
experience difficulty accurately recalling moods states that occurred in the past. Given the fact
that individuals with bipolar disorder tend to be symptomatic near 50% of the time (e.g., Judd, et
al., 2003b) it is particularly difficult to feel confident that retrospectively recalled mood ratings
are accurate.

13
Mood Monitoring
Beginning in 1915, Emil Kraepelin, widely acknowledged as having formalized the
current conceptualization of bipolar disorder, used “life-charts” to document mood changes in
individuals who met criteria for what he then called “manic-depressive insanity” (Horn, Scharer,
Walser, Scherer-Klabunde, Biedermann, & Walden, 2002). Clinicians used different colors and
shading patterns to indicate shifts in mood. Kraepelin’s developed these life-charts in order to
gain a better understanding of the course of bipolar disorder over time. Interestingly, Kraepelin
recorded instances of mania with onset in adolescence using this very technique, and reported as
much in his 1921, Manic Depressive Insanity and Paranoia. Unfortunately this objective
evidence was not enough to challenge the current prevailing theories of mind, which did not
acknowledge the existence of extremes of mood in adolescence.
In addition to gathering longitudinal data for research, most modern treatments for
bipolar disorder use self-reported mood charts as an integral part of patient psychoeducation
(Miklowitz, 2008). Kraepelin’s life-charts are analogous to modern mood monitoring or charting,
in which patients record daily moods on paper for treatment purposes. Mood charts serve to
educate both the patient as well as treatment providers about the course of mood fluctuations for
individual patients. Mood charts can serve to inform patients, family members, and treatment
providers about potential mood changes, allowing for early pharmacological or
psychotherapeutic intervention. Mood charts also allow researchers to use self-report data to
further understand course of illness for individuals with bipolar disorder and to track changes
based on specific treatments and interventions.
Although both clinicians and researchers have traditionally relied on “pen and paper”
methods for mood monitoring, these methods may introduce another set of potential problems

14
and opportunities for errors in mood data. In order to ensure an accurate representation of
longitudinal change in moods, it is essential that patients do not make entries after they are
requested or complete entries ahead of time. Entries completed after they are requested are
subject to recall bias and entries completed in advance are clearly fabrications. Anecdotally,
many clinicians report that clients often complete weekly mood charts just before sessions, often
while sitting in the waiting room.
Stone, Shiffman, Schwartz, Borderick, and Hufford (2003) name these phenomena
“backfilling,” “forward-filling,” and “hoarding”. In an attempt to measure the frequency with
which clients completed diary entries when assigned, Stone and colleagues equipped 40
individuals with paper diary notebooks to record levels of chronic pain over the course of 21
days. Unbeknownst to the participants, the diaries were equipped with light sensors connected to
a device that recorded the date and time the diary was opened (the assumption was made that the
diary would only be opened when entries were made). Participants were asked to make entries
three times per day at predetermined times over the course of three weeks. When asked to rate
their protocol compliance, participants claimed to be adherent to time requirements on 90% of
diary entries. In reality, compliance was a mere 11%. Even more striking was the finding that on
over 30% of the days in question clients never even opened their diaries, but claimed to be
compliant for 90% of those days.
When the researchers gave participants electronic diaries, which prompted for entries at
the same intervals requested of clients using paper diaries, compliance jumped to nearly 95%.
This impressive difference in compliance rates indicates that even with a simple electronic
reminder, electronic mood monitoring is not only feasible, but appears to increase protocol
adherence.

15
Longitudinal Methods Using Real-Time Mood Monitoring One of the earliest adopters of the experience sampling method of data collection was
Mihaly Csikszentmihalyi (Csikszentmihalyi, Larson & Prescott, 1977). Csikszentmihalyi argues
that collecting information in vivo provides more accurate and “real” information than data
gathered after the fact in the lab. Csikszentmihalyi et al. (1977) used then new personal pager or
“beeper” technology to gather information on the daily behavior of a group of 25 adolescents.
The pager was activated from a centrally located radio transmitter that could reach pagers within
a radius of 50 miles. Each participant carried a personal pager that prompted him or her to record
mood and the particular activity in which he or she was engaged.
Technological advances have made monitoring devices less cumbersome, less expensive
and more ubiquitous. There is an established body of research showing that using new
technologies such as computers and smartphones to effectively monitor behaviors is feasible. For
example, studies have shown computer based, daily emotional and behavior monitoring can be
employed when following adults with schizophrenia (Kimhy et al. 2005), children aged 7 to 12
years with attention-deficit/hyperactivity disorder and their mothers (Whalen et al. 2006;
Whalen, et al. 2006), smokers recording the relationship between smoking and mood (Delfino,
Jamner, & Whalen 2001), and individuals with eating disorders tracking mood and binge/purge
behavior (Smythe et al. 2007). All of these studies used personal digital assistants (PDAs), in
which participants entered information multiple times over 24 hour periods.
Jahng, Wood, and Trull (2008) used PDAs to compare mood fluctuations in 46
individuals with borderline personality disorder (a hallmark of which is extreme affective
instability) and 38 individuals with major depressive disorder who did not report mood
instability. Participants were supplied with electronic diaries that prompted them for ratings on
scales of positive and negative affect six times per day for four weeks. It was hypothesized that
16
patients with borderline personality disorder would exhibit more fluctuations in negative affect
relative to patients with major depressive disorder. Both participants with borderline personality
disorder and major depressive disorder had very good compliance rates (.86 and .87
respectively). These researchers reported more instability in negative affect among the
individuals with borderline personality disorder compared to individuals with major depressive
disorder.
Of the studies that directly address mood monitoring for mood disorders, most only
report pilot data and feasibility findings, however, these initial results appear quite promising.
Scharer et al. (2002) adapted the NIMH prospective Life-Chart Form for use on a handheld
computer and found that patients preferred the device to paper and pencil charting, felt a reduced
stigma when using the device to record mood in public, reported gaining improved knowledge
about their disorder, and enjoyed playing a more active role in their treatment.
Chinman, Alexander, Schell, Hassell, and Mintz (2004) compared in-clinic, computer-
assisted self report data provided by 45 individuals with bipolar disorder to mood data gathered
by trained interviewers. They found very high correlations between self-report and interviewer-
gathered data (r = 0.97) indicating that self-report data entered on a computer by bipolar
individuals was similar to data gathered in an in-person interview by a trained mental health
professional. Taken together, these data indicate that self-reported mood ratings provided by
bipolar individuals via handheld or desktop computer appear to be as reliable as data gathered in
person by trained clinicians, and that these individuals readily adapt to technology-assisted data
collection.
Bauer et al. (2005) recruited 80 individuals to use the ChronoRecord software system,
developed specifically for monitoring mood in affective disorders installed on their home

17
computers to record mood, medication and sleep data. They found good adherence to the
protocol (daily entries for 3 months). Out of the 114 days for which data entry was requested,
participants only missed 6.1% of days, or the equivalent of 7.3 days. Thus, the method of data
collection using computer software appeared to result in very good compliance.
Data provided by participants using the ChronoRecord software has allowed researchers
to reconsider diagnostic rules for bipolar disorder. For example, Bauer et al. (2006) found that
decreasing the number of days required for diagnosis of a hypomanic episode from the required
four days to two days, doubled the proportion of days spent in hypomanic episode from 4% to
8%. This demonstrates the important role that modern self-report technologies can play in
reifying and redefining conceptualizations of bipolar disorder.
Bauer, Rasgon, Sasse, Glenn, and Neuhaus (2005) compared self-reported mania and
depression ratings provided by participants using the ChronoRecord software to clinician-
gathered mood data and found no significant difference between severity ratings. These results
suggest self-report data gathered via this method is equivalent to data gathered in-person.
Reilly-Harrington et al. (2010) compared ratings provided by individuals with bipolar I or
II on the Interactive Computer Interview for Mania to in-person assessments of the same
individuals. They found a strong correlation between the two methods, suggesting the computer
system is a viable alternative to in person diagnostic interviews for mania. They also found that
the computer system was more sensitive to manic symptoms than the in-person interviewer.
Faurholt-Jepsen et al. (2013) developed the MONARCA trial protocol (MONitoring,
treAtment and pRediCtion of bipolAr disorder episodes), an app for Android-equipped
smartphones that allows patients with bipolar disorder to provide ratings of mood, stress, social
functioning etc. The system is currently undergoing a randomized, single-blind trial comparing
18
outcomes in a group of bipolar patients using MONARCA and a group using smart phones
without the app.
Data supplied by a group of adult bipolar patients used the TrueColours system to report
their elevated and depressed moods once a week via text message (Bopp et al. 2010). These self-
report mood ratings reflected results similar to previously published data gathered using
traditional retrospectively gathered mood ratings. Specifically, participants spent more time
symptomatic than euthymic, and more time depressed than manic or hypomanic. There was also
very good compliance with study protocol. Participants replied with weekly mood ratings 75% of
the weeks they were requested, and proportion of time spent in mood states was consistent with
previously published research (e.g, Judd et al. 2003; Kupka et al. 2007).
Current Study
For researchers, time and cost-effective methodology to facilitate the identification and
long-term follow-up of young people with bipolar disorder, is essential to any effort to answer
these and other questions about this damaging and costly illness. For clinicians, the same kind of
diagnostic and monitoring system could provide invaluable data for the treatment of adolescent
mood disorders. In this paper, we introduce, describe, test, and validate such a methodology: the
TrueColours Self-Management System (TCSMS), a text-message and Internet-based mood
monitoring system.
The current study uses two novel self-report methods that may address some of the
limitations to more commonly used methods for collection of mood data for clinical and research
purposes. 14 adolescents with bipolar disorder used a text-message based system for reporting
weekly depressive and manic or hypomanic symptoms, and 3 adolescents with bipolar disorder

19
used an identical web-based version of the same system. A group of 22 healthy controls also
provided weekly mood ratings. Participants were followed an average of 24 weeks.
In this study, we examine the feasibility of collecting course of illness data from
adolescents with bipolar I and II disorder and a group of non-mood disordered controls, using the
TrueColours Symptom Monitoring System (TCSMS). We examine the reliability of TCSMS by
comparing the bipolar and control groups on average mood ratings, polarity switches, proportion
of time spent with reported symptoms and variability in mood ratings over time.
This method of data collection may address issues of recall bias in retrospective studies,
and may increase compliance with contemporaneous mood monitoring protocols, compared to
traditional pencil-and-paper methods. Finally, this methodology may reduce reporting errors
generated when patients or participants do not complete measures when requested, and engage in
hoarding, backfilling and forward-filling.
The True Colours Self-Management System
The TCSMS system for obtaining weekly mood ratings was developed at the Department
of Psychiatry, Warneford Hospital, Oxford, UK and has been used successfully there for several
years (Simon et al., 2011; Miklowitz et al., 2012). The TCSMS allows individuals diagnosed
with bipolar disorder to report their mood each week via text message, or a secure website. The
TCSMS allows both patients and their care providers to access these weekly ratings, and to
observe mood changes over time. System users can monitor overall symptom severity, and
individual symptom changes over time. This allows users not only to observe overall changes in
mood, but also to see how individual symptoms may fluctuate within individual patients.
20
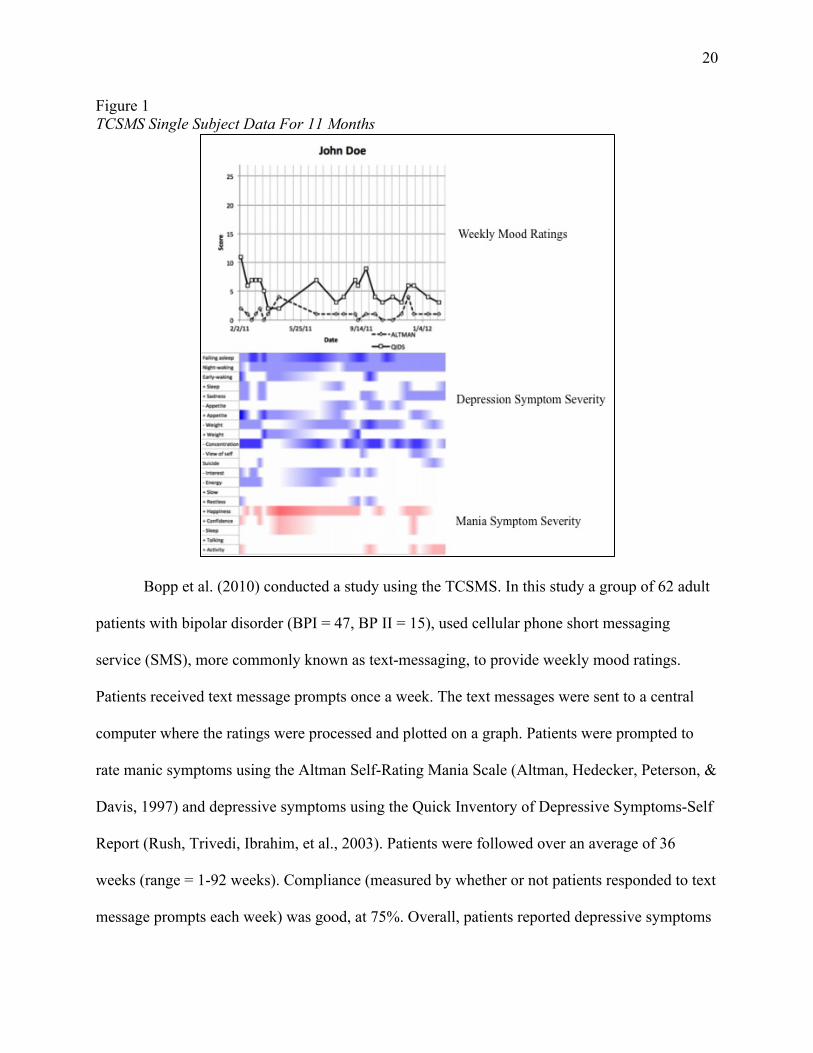
Figure 1 TCSMS Single Subject Data For 11 Months
Bopp et al. (2010) conducted a study using the TCSMS. In this study a group of 62 adult
patients with bipolar disorder (BPI = 47, BP II = 15), used cellular phone short messaging
service (SMS), more commonly known as text-messaging, to provide weekly mood ratings.
Patients received text message prompts once a week. The text messages were sent to a central
computer where the ratings were processed and plotted on a graph. Patients were prompted to
rate manic symptoms using the Altman Self-Rating Mania Scale (Altman, Hedecker, Peterson, &
Davis, 1997) and depressive symptoms using the Quick Inventory of Depressive Symptoms-Self
Report (Rush, Trivedi, Ibrahim, et al., 2003). Patients were followed over an average of 36
weeks (range = 1-92 weeks). Compliance (measured by whether or not patients responded to text
message prompts each week) was good, at 75%. Overall, patients reported depressive symptoms

21
47% of the time. Participants reported manic symptoms 7% of the time, and reported mixed
symptoms 8.8% of the time. Patients reported euthymia 36.5% of the time. These results were
similar to those of other longitudinal studies of bipolar disorder that use traditional retrospective,
clinician- gathered mood data (e.g, Judd et al., 2003; Kupka et al., 2007).
Specific aims
Specific Aim #1: To examine the feasibility of using the Oxford University True Colours Self-
Management System (TCSMS), previously used to collect data from only adult bipolar patients,
as a method of collecting mood data in real-time from a group of 18 adolescents with bipolar
disorder and a group of 22 adolescents without any diagnosis of a mood disorder.
Hypothesis # 1. Adolescents with and without bipolar will respond to weekly prompts
75% of weeks as demonstrated in a previous trial of the SMS system with bipolar adults
(Bopp et al., 2010).
Specific Aim #2: To demonstrate the validity of the TCSMS by determining the degree to which
the SMS system distinguishes between adolescents with and without bipolar disorder.
Hypothesis #2. Adolescents diagnosed with bipolar disorder will report more polarity
changes over time than non-bipolar controls.
Hypothesis #3. Bipolar adolescents will report higher average ratings of depressive and
manic symptoms than non-bipolar controls.
Hypothesis #4. Bipolar adolescents will report more fluctuation in ratings of depressive
and manic symptoms over time than non-bipolar controls.
Specific Aim #3: To compare proportion of time spent in mood states reported via TCSMS, with
previously published longitudinal data using retrospectively gathered mood ratings.

22
Hypothesis #5. We hypothesize that consistent with previously published research,
adolescents with bipolar disorder will report more weeks with depressive symptoms than
with manic or hypomanic symptoms.
CHAPTER 2
METHODS
Participants
The full sample of 18 bipolar participants was recruited from two sites: The University of
Colorado, Boulder (N=15), and McLean Hospital in Belmont, MA (N=3). Participants from
University of Colorado, Boulder site were already enrolled in a treatment study with the
Colorado Family Project, and participated in the SMS study as an additional component to that
study. The parent project was the NIMH funded R01 grant, “Effectiveness of Family-Focused
Treatment Plus Pharmacotherapy for Bipolar Disorder in Adolescents” (R01MH073871). This
study examined the effectiveness of a 21-session Family Focused Treatment for adolescents with
bipolar disorder and their families, compared to a 3-session control condition. Participants were
in a variety of clinical states, were recruited from experimental and control treatment conditions
within the study, and were pharmacologically managed by a study psychiatrist. All of the
participants (N=14) at the Colorado site used the SMS texting system to report weekly moods.
Participants recruited at the McLean Hospital site were recruited from inpatient and
partial hospitalization units, were informed of the project via flyers placed around the hospital
grounds, or were informed of the study by Partners-affiliated providers at Massachusetts General
Hospital. These participants were also actively engaged in treatment (cognitive behavioral
therapy and psychopharmacological management),and were in a variety of clinical states at the
time of enrollment. The three participants used the web-based version of the SMS system.
23
Adolescents assessed for the experimental condition were eligible to participate if they:
(1) met the DSM-IV criteria, based on the KSADS Mania and Depression rating scales for
Bipolar I or II disorder and were willing and able to give written informed consent or assent to
participate.
An additional 22 non-bipolar participants were recruited at the University of Colorado,
Boulder to serve as a control group. Participants were recruited via an interdepartmental email
listserve that is distributed to students, faculty and staff in the psychology department at the
University. Participants recruited for the control condition were screened for mood disorders
using The Kiddie SADS Depression Rating Scale (DRS; Kaufman et al 1997) and the K-SADS
Mania Rating Scale (MRS; Axelson et al. 2003).
Participants were excluded from the control group if they met diagnostic criteria for any
DSM-IV mood disorder (major depressive disorder, bipolar I, II, or NOS). Participants were not
screened for other DSM-IV disorders. Participants and control participants were excluded from
either condition if, based on parent report or medical records, they (1) had mental retardation (IQ
< 70), autism, or organic CNS disorder, (2) were characterized by severe, unremitting psychosis
that was neuroleptic-unresponsive and lasted more than 3 months. Participants were not screened
for other DSM-IV Axis I or II disorders.
Participants could receive $3.00 per week for completing the two rating scales.
Depending on how long adolescents participated in the project, they could earn up to $78 for
sending weekly mood ratings over the course of the 6-month study. Colorado participants also
received $20 for the initial interview, and $20 for each of two follow-up interviews. Participants
could earn a total of $138 for the duration of the study. Due to funding constraints, McLean
subjects were reimbursed $10 for the three assessment interviews, and could therefore earn a

24
total of $108 for full participation in the study. Control participants received $20 for the initial
interview, and were not assessed at 3 and 6 months, and therefore could earn a total of $98 for
full participation in the study.
Equipment and Procedures
The TrueColours SMS Texting System. The TCSMS for obtaining weekly mood
ratings was developed at the Department of Psychiatry, Warneford Hospital, Oxford, UK and has
been used successfully there for several years. Pilot and feasibility data were published by Bopp,
et al. (2010) and are discussed previously. The text-portion of the current study used that
technology with modification to allow it to be used in the US. Specifically, because the SMS
system database is housed in the UK, devising a method of transmitting data between the two
countries was necessary.

25
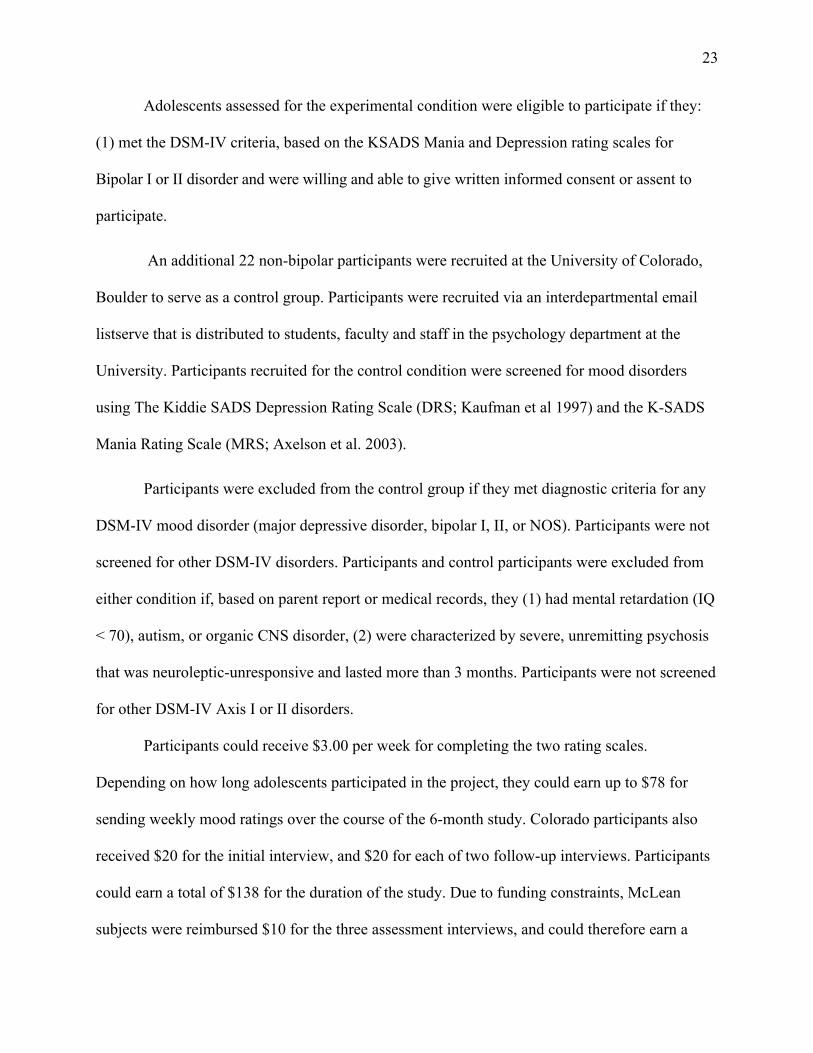
Figure 2 The TrueColours Self-Management System International Computer-to-Text Interface
In the US, a desktop computer was programmed as an “SMS gateway” using the open-
source Kannel software (The Kannel Group 2009), which runs on a Debian Linux operating
system. An SMS gateway is a computer program that allows multiple pre-programmed text-
messages to be sent from a phone connected to the computer. It also allows for the processing
and storage of received messages. Companies that wish to send and receive bulk text messages,
usually advertising companies, or local emergency information systems typically use these SMS
gateways.
The computer on which the SMS gateway was installed, was connected to an
uninterruptible power supply (UPS) that provided up to an hour of uninterrupted power to the
system in the event of a power outage. Only certain cell phones are compatible with the Kannel
26
SMS gateway. Attached to the computer running Kannel, was a Nokia 6230i cell phone. This
study phone was associated with an unlimited texting plan.
TCSMS-text registration and weekly rating. To register a participant, a researcher sent
a text message to the study phone, indicating the participant identification number, the
participant’s cell phone number, and the day and time of the week the participant wished to
receive his or her prompt to complete mood ratings (e.g., ID1500 3035551234 mon 1400). Once
the study phone received this message, it was transmitted via the SMS gateway to a static IP
address associated with the TCSMS database in Oxford. Text data was transferred to the TCSMS
database via Hypertext Transfer Protocol (HTTP) with Transport Layer Security (TLS) to ensure
data security.
Approximately 2 minutes after the registration text was sent, a mood-rating request was
sent back from the TCSMS database in the UK via the Internet to the SMS gateway, to the study
phone, which then sent this initial prompt to the participant’s cell phone. This allowed the
researcher to demonstrate to the participant, how to complete their weekly mood rating, and to
answer any questions about the self-report measures. Following registration, the participant
began receiving weekly prompts to complete ratings on the ASRM and QIDS-SR scales on the
day and at the time the participant requested. Each week an aggregated dataset of mood ratings
was sent from the Oxford database to the study coordinator.
Participants were supplied with wallet-sized versions of each rating scale. Adolescents
responded to the text prompts first with the letter “A” indicating they were replying to the QIDS-
SR, or with the letter “B” indicating they were replying to the ASRM, and then followed with the
numerical rating for each question. For example, a participant completing the QIDS-SR would
receive a text prompt, look at his or her rating card, and reply to the prompt, “A” with the

27
numerical rating for each of the 16 questions (e.g., A0330200001101111). If the text message
contains errors (too few responses, scores out of range, etc.) the system sends a reply requesting
that the patient re-submit his or her responses. If the adolescent did not reply when first
prompted, a reminder message was sent the following day and again on the third day. All entries
were date-stamped the day they are sent. Provisions were in place to supply phones to
participants who did not have their own phones and were unable to afford text-message fees.
The TrueColours SMS Web System. At the McLean site, due to IRB concerns about
data security, all subjects used the TCSMS web-based mood rating system instead of the text-
message system. Subjects using the web-based system received a weekly email prompt at a
predetermined day and time, in replace of the text-messaged prompt.
These participants were registered via the TrueColours website by a researcher. Once
registered, participants received a “welcome” email with a link to the TrueColours website,
where he or she could log in with a temporary password, change his or her password, and learn
about the TrueColours system. On the day and at the time a participant requested, he or she
would receive an email prompt with a link to the TrueColours website, where he or she would
complete the QIDS-SR and ASRMS mood ratings.
Researchers were able to manage and register multiple participants from the TrueColours
website. Although participants were not consistently involved in study-related treatment, those
participants who were using the web-version of the TrueColours system could also view their
mood ratings for past weeks and months.
Measures
Quick Inventory of Depressive Symptoms – Self Report. The QIDS-SR, is a 16-item measure
of depression severity, which covers the nine diagnostic symptoms related to a DSM-IV-TR
28
major depressive episode The 16 questions are drawn from the larger, 30-item Inventory of
Depressive symptoms (ISR) (Rush et al. 1996). These scales require participants to rate each
symptom on a 0 – 3 scale over the past seven days. Depression scores on the QIDS-SR
correspond to five levels of severity: none, 0-5, mild 6-10, moderate 11-15, severe: 16-20, very
severe: 21-27. Scores below 6 indicate no depressive symptoms. The QIDS-SR has shown high
levels of internal consistency between it and the ISR (c = .81) for rating depressive symptom
severity (Trivedi et al 2004).
Altman Self-Rating Mania Scale. The ASRM is a 5-item measure of manic or
hypomanic mood symptoms. Participants rate their symptoms over the previous week on 5
individual scales ranging from 0 to 4. Scores are aggregated for a final score range of 0-20. Any
aggregate score above 5 points indicates the participant is symptomatic. Because the items do not
measure the duration or functional impairment caused by symptoms, the ASRM does not
distinguish between mania and hypomania. The ASRM has demonstrated high concurrent
validity with the Clinician-Administered Rating Scale for Mania (CARS-M) (Altman et al. 1994)
(r = .78), high test-retest reliability (r = .89) (Altman et al. 1997).
Kiddie Schedule for Affective Disorders Depression and Mania Rating Scales. The
Kiddie SADS Depression Rating Scale (DRS; Kaufman et al 1997), the K-SADS Mania Rating
Scale (MRS; Axelson et al 2003) are semistructured interviews drawn from the full K-SADS
diagnostic interview, but enable one to track individual DSM-IV symptoms of mania and
depression on Likert scales of severity and functional impairment. Published data from the larger
R01 parent project at the Colorado site (Miklowitz, Axelson, Birmaher, et al., 2008) show good
interrater reliability for the MRS (intraclass r, .97) and DRS (intraclass r, .89). Independent
evaluators had at least an MA or psychiatric nursing degree.

29
Data Analyses
Initial analyses used t-tests to compare bipolar and control groups on demographic
(gender, age, race) and mood variables (average QIDS and ASRMS scores, polarity switching).
For demographic variables, where significant between-group differences were observed, these
variables were included as covariates in all analyses. To confirm there was a linear relationship
between dependent variables and time we conducted a curve estimation analysis. This analysis
indicated that a linear curve best represented the change in data over the 13-week period (p < .01,
R2= 2.4%). For the primary analyses, only individuals completing at least 60% of the weekly text
message were included. This resulted in the exclusion of data from 4 bipolar subjects and no
control subjects. Of note, logistic regression analysis indicated that for the present sample, those
who complied versus those who did not comply at a 60% level, did not differ on demographic or
mood variables (all p-values >.42). Given that all of the noncompliers were in the bipolar group,
we also compared compliant bipolar participants to the noncompliant bipolar participants.
Logistic regression analysis indicated that these groups also did not differ (all p-values >.24) on
demographic or mood variables.
Analyses of covariance were used to evaluate the extent to which SMS texts could
capture differential responses in bipolar versus non-bipolar adolescents. More specifically, two
ANCOVAs were run with group (bipolar versus control) and time as independent variables,
within-subject repeated measures QIDS and ASRMS as dependent variables, respectively, and
age as a covariate. We hypothesized that while both bipolar and non-bipolar adolescents would
report fluctuations in mood, bipolar adolescents would report greater severity of scores on the
QIDS and ASRMS, and would report more variability in these ratings over time.

30
As an additional comparison of mood variability, we calculated standard deviations for
each subject’s ASRMS and QIDS scores over the 3-month follow-up. Each subject then had a
single standard deviation for each measure, to represent his or her mood variability over weeks in
the study. We then used these standard deviations to conduct t-tests to compare within-subject
mood variability between bipolar and control participants on both measures. In addition we
hypothesized that bipolar participants would report more polarity switches (switches from
symptomatic scores of 6 or above on one mood scale, to symptomatic scores of 6 or above on the
other mood scale constituted a single polarity change) over the follow-up period than adolescents
in the non-bipolar group.
To further test our prediction of significantly higher ratings over time of symptoms of
depression and mania among participants in the bipolar group as compared to those in the control
condition over the 13-week period, we used hierarchical linear models to measure effects of
time, bipolar vs. control group, and the interaction between group and time on QIDS and
ASRMS scores. The intercept and linear slope of time were allowed to vary across individuals.
Analyses are based on data collected at 13 time points. We treated ASRM and QIDS scores as
continuous variables to examine degree of change over time. For the first level of the multilevel
model, we estimated the mean ASRM (or QIDS) score: ASRMti = β0i + εii, where ASRMti is a
participant’s mania score at time t. For the second level, we created a dichotomous variable for
group (bipolar vs. control), αGroup. Next, we included variables for the interactions between
group and week: β0i = α0 + αiGroup + αiWeek +αiGroup* αiWeek + εi..
Following between-group comparisons, we next conducted within-group (i.e., within
bipolar participants) analyses to characterize the mood fluctuations. Here, we were interested in
assessing three characteristics of this group: 1) amount of time spent in each episode, 2) the

31
predictive importance of various mood states on mood fluctuations, and 3) the comparison of
retrospective, clinician-based mood ratings versus in-moment (i.e., text) mood self-ratings. For
all of these analyses we conducted t-tests and ANOVAs. With regard to the first two points, we
hypothesized that, consistent with previous studies, adolescents with bipolar disorder would
report more weeks with depressive symptoms than with manic or hypomanic symptoms or in
periods of euthymia (e.g., Birmaher, Axelson, Goldstein, Strober, Gill, et al. 2009; Geller,
Tillman, Craney and Bolhoffner, 2004). For each participant, we calculated the mean percentage
of time that QIDS and ASRM scores indicated euthymia (no symptoms of depression or mania),
depression, mania or mixed states, defined as reporting symptomatic scores on both scales
simultaneously, using total weeks in which ratings were supplied as the denominator. Scores of 6
or greater on both scales indicate clinically significant symptoms.
Exploratory Models. Following from our results with adults, exploratory multilevel
models were calculated using gender or bipolar I/II status as predictors of symptom trajectories.
These analyses can generate hypotheses for future research on factors that moderate the course of
adolescent bipolar disorder under experimental treatment conditions. We used multilevel
modeling (PROC MIXED function in SAS; Ger and Everitt 2001) to examine the relations
between bipolar subtype and gender to changes in ASRM and QIDS scores. For both the ASRM
and QIDS variables, separate multilevel models were estimated. We treated ASRM and QIDS
scores as continuous variables to examine degree of change over time. For the first level of the
multilevel model, we estimated the mean ASRM (or QIDS) score: ASRMti = β0i + εii, where
ASRMti is a participant’s mania score at time t. For the second level, we created dichotomous
variables for bipolar subtype (type I vs type II), αDiag, and gender, αGender. Next, we included
variables for the interactions between subtype and day, gender and day, and subtype and gender:
32
β0i = α0 + αiDiag + αiGender + αiWeek + αiDiag* αiWeek + αiWeek* αiGender + αiDiag*
αiGender εi.
In summary, we hypothesized that 1) bipolar adolescents would report higher average
rates of depression and mania using the TCSMS over the course of the 13-week follow-up than
non-mood-disordered controls; 2) bipolar adolescents would report more change (mood
fluctuation) on both measures over the 13 weeks than the control group; 3) bipolar participants
would report more switches between mood polarity than healthy controls; 4) within the bipolar
group, participants would report the majority of weeks with depressive symptoms compared to
weeks with mania/hypomania and without symptoms altogether; 5) within the bipolar group,
there would be more variability (fluctuation) in weekly TCSMS mood ratings when compared to
weekly mood ratings gathered by clinicians at the 13 week follow-up.
CHAPTER 3
RESULTS Missing Data
While the protocol asks participants to submit mood ratings for 6 months, time
constraints dictated that the first 3 months of data were used for these analyses. While not
included in these results, data collection did continue for these subjects, and will be included in
future publications.
After receiving several weeks of identical mood reports, two bipolar subjects were
contacted and asked if they had been submitting identical ratings each week, without actually
rating individual items on the QIDS and ASRMS. Both subjects were given the option of re-
starting the protocol. One subject did not respond, and this subject’s data were not used in any
33
analyses. One subject responded and agreed to restart the protocol. The data up until this point
for this subject were not included in the final analyses.
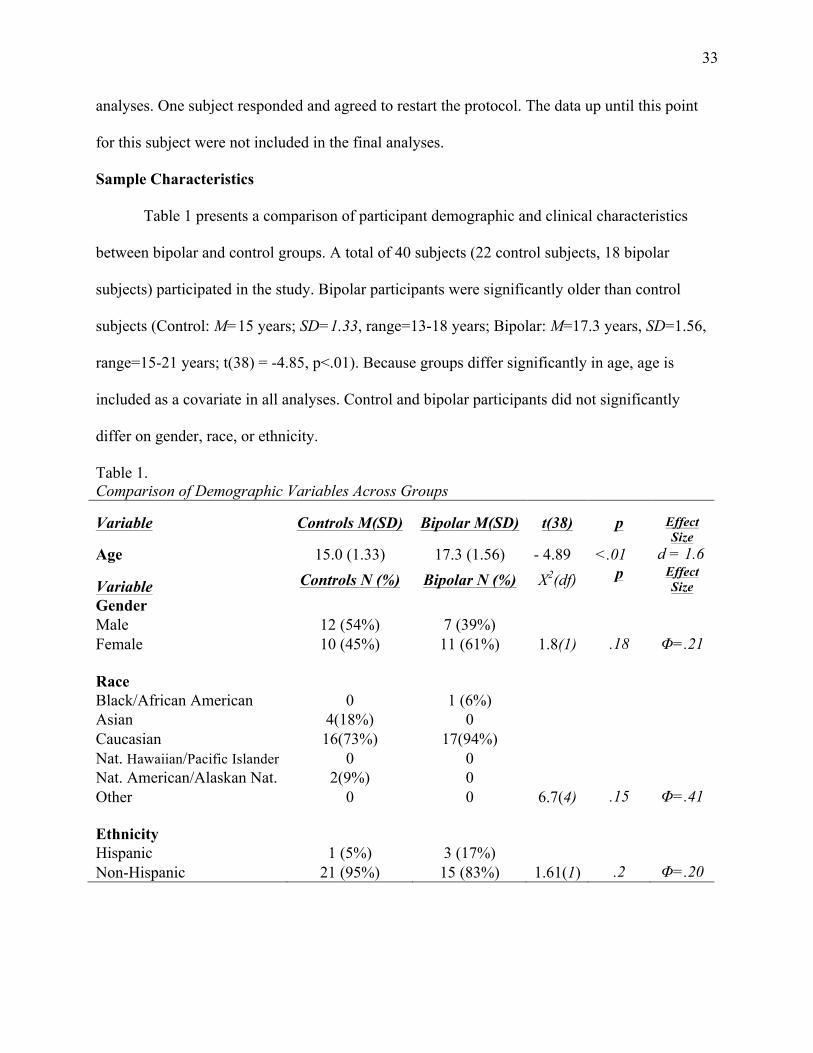
Sample Characteristics
Table 1 presents a comparison of participant demographic and clinical characteristics
between bipolar and control groups. A total of 40 subjects (22 control subjects, 18 bipolar
subjects) participated in the study. Bipolar participants were significantly older than control
subjects (Control: M=15 years; SD=1.33, range=13-18 years; Bipolar: M=17.3 years, SD=1.56,
range=15-21 years; t(38) = -4.85, p<.01). Because groups differ significantly in age, age is
included as a covariate in all analyses. Control and bipolar participants did not significantly
differ on gender, race, or ethnicity.
Table 1. Comparison of Demographic Variables Across Groups
Variable Controls M(SD) Bipolar M(SD) t(38) p Effect Size
Age 15.0 (1.33) 17.3 (1.56) - 4.89 <.01 d = 1.6
Variable Controls N (%) Bipolar N (%) X2(df) p Effect Size
Gender Male 12 (54%) 7 (39%) Female 10 (45%) 11 (61%) 1.8(1) .18 Φ=.21 Race
Black/African American 0 1 (6%) Asian 4(18%) 0 Caucasian 16(73%) 17(94%) Nat. Hawaiian/Pacific Islander 0 0 Nat. American/Alaskan Nat. 2(9%) 0 Other 0 0 6.7(4) .15 Φ=.41 Ethnicity
Hispanic 1 (5%) 3 (17%) Non-Hispanic 21 (95%) 15 (83%) 1.61(1) .2 Φ=.20
34
Specific Aim #1: Testing the feasibility of using the Oxford University True Colours Self-
Management System with adolescents
Hypothesis 1: Adolescents with and without bipolar will respond to weekly prompts in 75%
of weeks as demonstrated in a previous trial of the SMS system with adults. On average, all
participants complied with the TCSMS protocol on 84% of weeks during the 13-week follow-up.
Bipolar and control subjects differed significantly on protocol adherence (Control compliance:
M=94%, SD=.08; Bipolar compliance: M=76%, SD=.21; t(38)=3.65, p< .01). There were four
bipolar subjects who complied with the weekly TCSMS protocol less than 60% of weeks. These
subjects were considered non-compliers and were not included in primary analyses.
Tests of differences in demographic and clinical characteristics between compliers and
non-compliers were examined using logistic regression. There were no significant differences in
baseline scores on QIDS and ASRMS or demographic variables (age, race, ethnicity) between
compliers and non-compliers. Moreover, even though all of the noncompliers were in the bipolar
group, there was no significant difference between group (bipolar versus controls) on the
likelihood of completing the study or not (p=.99).
To determine if compliance rates may have differed depending on the TCSMS text or
web option, we compared the McLean group who used the web option, and the Colorado group
who used the text option, on compliance, and found no significant differences (Mclean mean
compliance = 87% (SD=.22), Colorado mean compliance = 73% (.22); t(16) = 1.02, p=.32).
Specific Aim #2: Validity of the TCSMS – Bipolar vs. Healthy Controls
Hypothesis 2: Bipolar participants will report more polarity changes over time than
non-bipolar controls. Bipolar participants did not report more polarity changes (switches from
symptomatic scores on one mood rating, to symptomatic scores on another constituted a single
35
polarity change) over the course of the 13-week follow-up than did control participants, (t(38)=-
.99, p=.33).
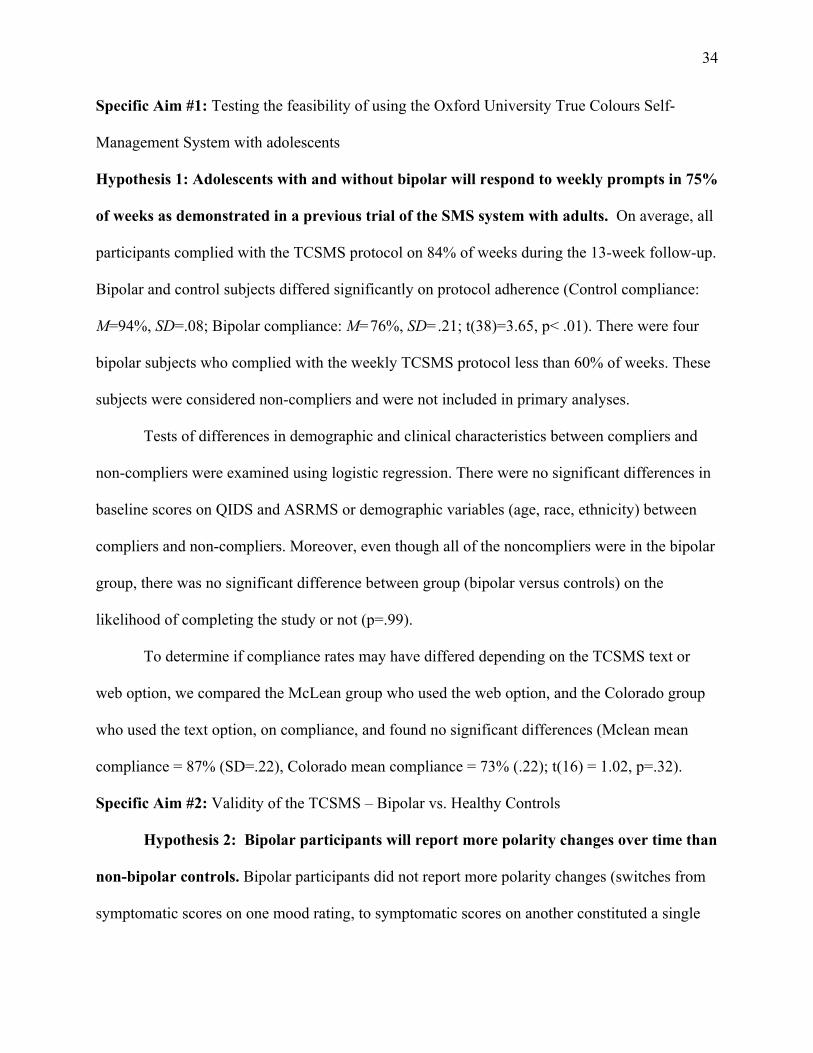
Hypothesis 3: Bipolar adolescents will report higher average ratings of depressive
and manic symptoms than non-bipolar controls. On average, bipolar participants reported
higher average depressive symptoms as reported on the QIDS than non-bipolar controls (Control
QIDS: M=2.48, SD=2.1, range=0-8.89; Bipolar QIDS: M=7.2 SD=5.46, range=.38-22.78;
t(38)=-3.73, p<.01). Bipolar and non-bipolar controls did not differ on average mania scores as
reported via the ASRSMS (t(38)=-1.24 p =.22). These results are summarized below in Table 2.
Table 2. Comparison of Mean Mood Ratings Between Groups Over 13 Weeks Variable Controls M(SD) Bipolar M(SD) F(1,38) d P QIDS* 2.47(2.1) 7.18(5.46) 7.48 1.25 .001 ASRMS** 1.61(1.6) 2.38(2.3) 2.39 .45 .22 Polarity Switches*** .23(.53) .50(1.15) 4.29 .32 .33 * QIDS-SR scores correspond to five levels of depression severity: none, 0-5, mild 6-10, moderate 11-15, severe: 16-20, very severe: 21-27. Scores below 6 on both scales indicate no clinically significant symptoms. ** ASRMS scores above 5 points indicate the participant is symptomatic, but the scale does not differentiate between mania and hypomania. *** switches from symptomatic scores on one mood rating, to symptomatic scores on another constituted a single polarity change (e.g. a participant reports a score above 5 on the QIDS one week, and the following week, reports a score above 5 on the ASRMS).
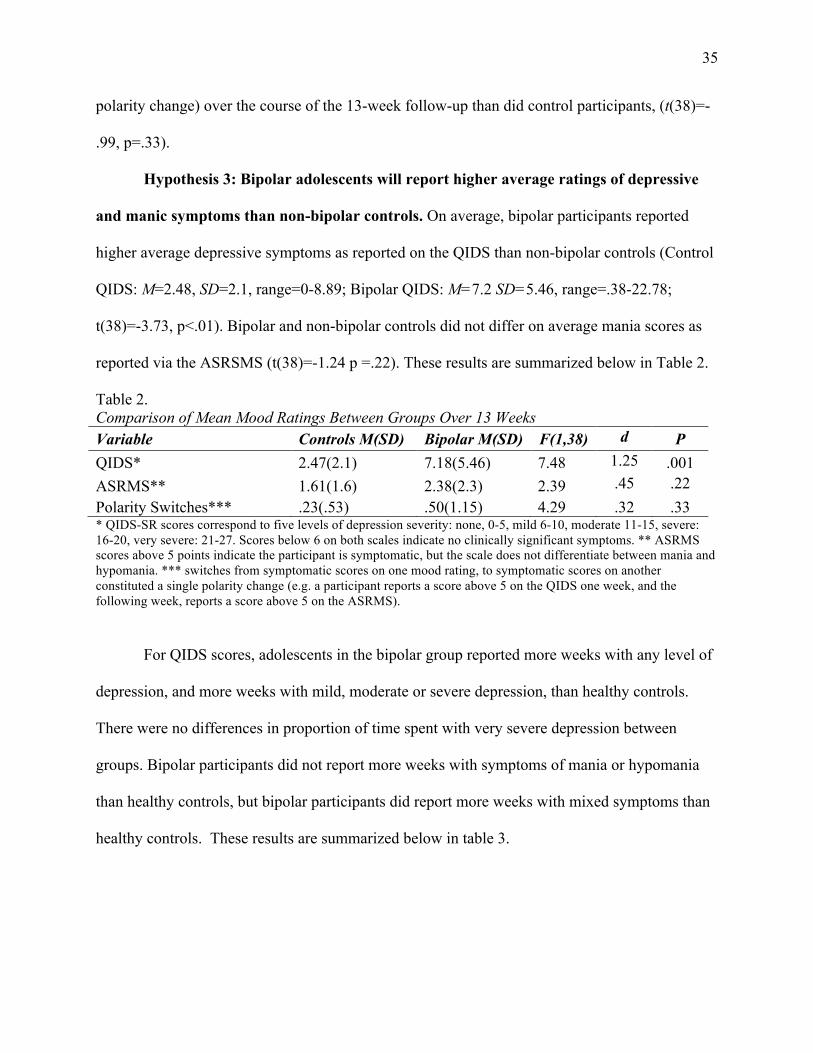
For QIDS scores, adolescents in the bipolar group reported more weeks with any level of
depression, and more weeks with mild, moderate or severe depression, than healthy controls.
There were no differences in proportion of time spent with very severe depression between
groups. Bipolar participants did not report more weeks with symptoms of mania or hypomania
than healthy controls, but bipolar participants did report more weeks with mixed symptoms than
healthy controls. These results are summarized below in table 3.

36
Table 3. Comparison of Proportion of Weeks Spent With Mood Symptoms Between Groups Variable Control % (SD) Bipolar %(SD) t(34) p Depression (any) 10 (23) 49 (39) -3.81 .001 Mild 8 (17) 29 (32) -2.56 .02 Moderate 2 (7) 10 (14) -2.44 .02 Severe 0 (0) 2 (4) -2.36 .02 Very Severe 0 (0) 7 (21) -1.65 .11 No depressive symptoms 87 (23) 51 (39) 3.81 .001 Hypo/Mania 6 (14) 13 (25) -.99 .33 No manic symptoms 93 (14) 87 (25) Both Manic and Depressive Symptoms 1 (5) 9 (13) 2.37 .02
No Manic or Depressive Symptoms 22 (30) 19 (37) -.32 .75
Note: Values are presented in percentages of weeks reported Hypothesis 4. Bipolar adolescents will report more fluctuation in ratings of depressive and
manic symptoms over time than non-bipolar controls. For QIDS scores, there was a
significant main effect of group (F(1,408)=50.58, p<.001, ηp2=.11) and week
(F(1,408)=14.39, p<.001, ηp2=.03) in an ANCOVA. For these analyses group (bipolar versus
control) and time were independent variables, within-subject repeated measures QIDS and
ASRMS were dependent variables, respectively, and age was included as a covariate. Moreover,
the group by time interaction was significant, such that bipolar participants reported greater
change (i.e., depressive fluctuation) over weeks in the study in depressive symptoms as reported
on the QIDS than non-bipolar controls (F(1,408)=6.40, p=.012, ηp2=.015). However, bipolar and
non-bipolar participants did not differ in average severity of mania scores by group,
(F(1,409)=.02, p=.89, ηp2=.00), or in change (i.e., manic fluctuation) in mania scores over weeks
in the study (the interaction of weeks and mania score) (F(1,409)=.01, p=.94, ηp2=.00).
T-test comparisons using each subject’s standard deviation on the QIDS as a measure of
variability revealed significant differences between bipolar and control participants (Control

37
QIDS SD: M=1.36, SD=.82, range= 0 – 3.44 Bipolar QIDS SD: M=2.83 SD=2.04, range= .96-
8.42; t(34)=-3.02, p<.005; d = 1.02). T-test comparisons using each subject’s standard deviation
on the ASRMS as a measure of variability did not yield significant differences between bipolar
and control participants (Control ASRMS SD: M=1.24, SD=.82, range= 0 – 3; Bipolar ASRM
SD: M=1.52 SD=1.31, range= 0-5.68; t(34)=-.79, p = .81; d = .26).1 Average weekly mood
ratings for bipolar and control participants over the course of the 13 week follow-up are
illustrated in Figure 3.
Figure 3. Average Weekly Mood Ratings Over Time Between Bipolar and Control Subjects
Specific Aim #3: Proportion of time spent in mood states
Hypothesis 5: Adolescents with bipolar disorder will report more weeks with
depressive symptoms than with manic or hypomanic symptoms or euthymia. Bipolar
1 When analyses include the 4 bipolar participants who were considered non-compliers, the differences in variability on QIDS remained significant, however the ASRMS differences became significant where they were not with the smaller sample (Control ASRMS SD: M=1.24, SD=.82, range= 0 – 3; Bipolar ASRMS SD: M=1.9 SD=1.69, range= 0 – 5.68; t(34)=-1.63, p < .05; d = .52).
Altman Score – Control QIDS Score -‐ Control Altman Score – Bipolar QIDS Score -‐ Bipolar
p < .05
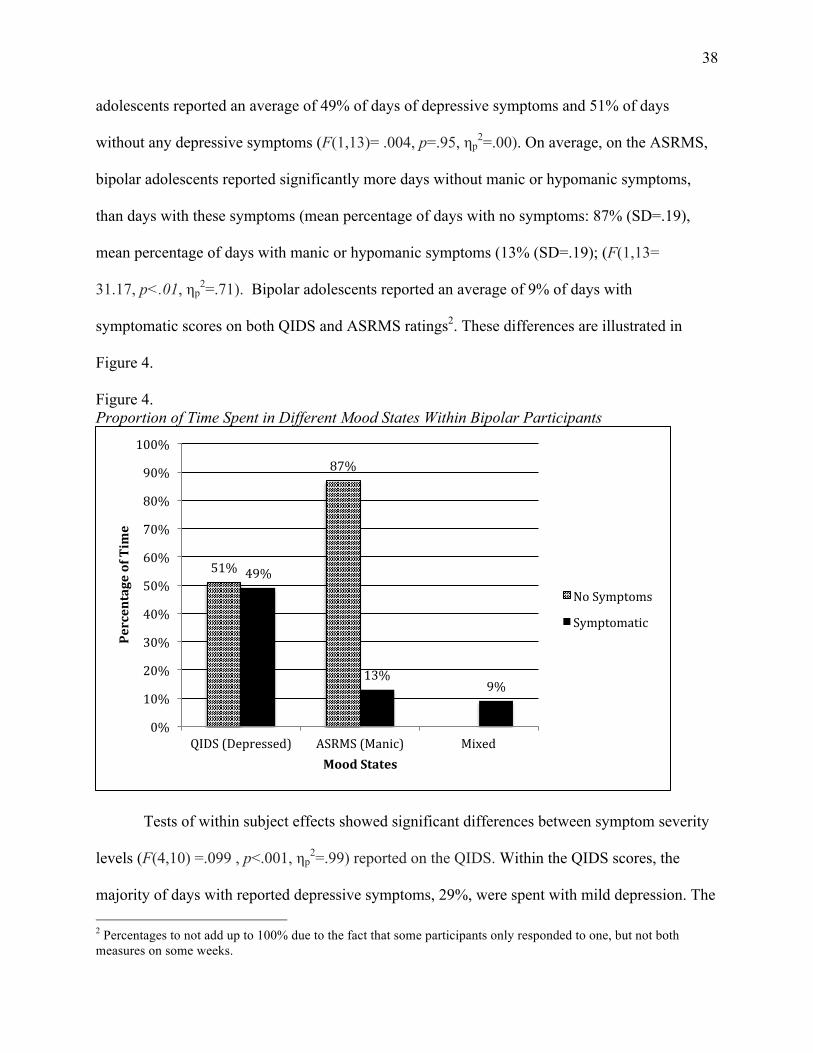
38
adolescents reported an average of 49% of days of depressive symptoms and 51% of days
without any depressive symptoms (F(1,13)= .004, p=.95, ηp2=.00). On average, on the ASRMS,
bipolar adolescents reported significantly more days without manic or hypomanic symptoms,
than days with these symptoms (mean percentage of days with no symptoms: 87% (SD=.19),
mean percentage of days with manic or hypomanic symptoms (13% (SD=.19); (F(1,13=
31.17, p<.01, ηp2=.71). Bipolar adolescents reported an average of 9% of days with
symptomatic scores on both QIDS and ASRMS ratings2. These differences are illustrated in
Figure 4.
Figure 4. Proportion of Time Spent in Different Mood States Within Bipolar Participants
Tests of within subject effects showed significant differences between symptom severity
levels (F(4,10) =.099 , p<.001, ηp2=.99) reported on the QIDS. Within the QIDS scores, the
majority of days with reported depressive symptoms, 29%, were spent with mild depression. The 2 Percentages to not add up to 100% due to the fact that some participants only responded to one, but not both measures on some weeks.
51%
87%
49%
13% 9%
0%
10%
20%
30%
40%
50%
60%
70%
80%
90%
100%
QIDS (Depressed) ASRMS (Manic) Mixed
Percentage of Time
Mood States
No Symptoms
Symptomatic

39
next most frequently reported states of depression were moderate (10%), very severe (7%), and
severe (2%) respectively. These differences are shown in Figure 5.
Figure 5. Depression Severity Over Time Within Bipolar Participants
Mood-State Severity as a Predictor of Polarity Switching.
Pearson product moment correlations were conducted to determine whether average
mood state severity was correlated with the number of polarity switches among bipolar
participants. This allowed us to determine if greater mood symptom severity is correlated with
greater symptomatic instability. There was a strong, positive correlation between the two
variables, such that higher ASRMS scores during the 13-week follow-up were associated with
higher frequency of of polarity switches in the bipolar group (r = .64, n =14, p <.05). Depression
ratings as reported on the QIDS were not associated with number of polarity switches (r = -.12, n
= 14, p = .71).
50%
29%
11%
2%
7%
0%
10%
20%
30%
40%
50%
60%
None Mild Moderate Severe Very Severe
Percentage of Time
QIDS Severity

40
Multilevel models of within-subject course predictors.
Some researchers suggest that when data include a nested structure and scores over time,
HLM is most appropriate (e.g., Willet & Sayer, 1984). Hierarchical linear models indicated no
significant interaction between diagnosis (bipolar vs control) and time on QIDS scores (F(1,35)
= 3.67, p =.06) or ASRMS scores (F(1,38) = .061, p =.81).
Hierarchical linear models indicated no significant differences between the bipolar I and
II subgroups on average QIDS or ASRMS scores (ASRMS, F(1,17) = 2.73, p =.12; QIDS:
(F(1,15) = .31, p =.59) or changes in week-to-week mood scores over time (the interaction of
subtype and week) (ASRMS: F(1,14) = .63, p =.44; QIDS: (F(1,14) = .165, p =.69).
CHAPTER 4
DISCUSSION
The study examined the feasibility of using a novel method of self-report, the
TrueColours Self-Management System, to collect weekly mood ratings from a group of
adolescents diagnosed with bipolar disorder, and a group of non-mood-disordered adolescents.
We aimed to first determine if adolescents would use the TCSMS to provide weekly mood
ratings, and adherence ratings indicate the TCSMS was generally used as requested. In addition,
our analyses examined differences on average weekly mood symptom severity, and changes over
13 weeks in these mood ratings between the bipolar and control groups in order to determine the
validity of the TCSMS in differentiating bipolar and healthy adolescents. Bipolar and control
participants differed on average weekly depression ratings, as well as on changes in depression
ratings over weeks, but there were no differences on mania ratings. Within the bipolar group,
analyses examined proportions of time spent with different mood symptoms in order to
determine if the TCSMS produced results similar to those found in other studies (i.e. more time
41
spent in depressive mood states than with manic symptoms or without any mood symptoms).
Bipolar adolescents spent the majority of weeks with depressive symptoms, and the fewest
number of weeks without any mood symptoms at all.
Specific Aim #1: Feasibility of the TCSMS
Based on rates protocol compliance, our findings suggest that using TCSMS with
adolescent bipolar patients is feasible. While compliance in both bipolar and control groups was
consistent with our hypothesized expectations, there was a significant difference in rates of
compliance between bipolar and control subjects. Control subjects were significantly more
compliant with the TCSMS protocol than bipolar subjects. This is not an unexpected result,
given the challenges of protocol adherence in bipolar populations (Colom, Vieta, Martinez-Aran,
Reinares, Benabarre, & Gasto, 2000, Keck, et al., 1996 ).
There are few studies that specifically examine treatment compliance in adolescent
bipolar patients, and these studies describe medication compliance. Coletti, Leigh, Gallelli, and
Kafantaris (2005) found that in a group of 37 adolescents with bipolar disorder, only 34% were
fully compliant with prescribed medication protocols over a one-month period. Drotar, et al.
(2007) examined adherence to a lithium protocol in a group of over the course of an average of
11 weeks. They found adherence rates of 66% based on lithium serum levels. It is notable that in
the Colletti et al (2005) study, low reported adherence was in direct contrast to parent’s
perceptions of their child’s adherence.
While these studies of medication compliance are not entirely analogous to
psychotherapeutic interventions broadly, or mood-monitoring specifically, it is notable that rates
of compliance with TCSMS among the bipolar participants (76% of weeks on average) are
higher than medication compliance over similar time periods. It is also important to note that to

42
our knowledge, TCSMS participants did not use mood ratings in treatment, and no participants
actively engaged with study staff over the course of the 13-week follow-up. It may be argued
that these higher rates of compliance may be driven by the fact that participants were only paid
when they provided mood ratings. Future research with the TCSMS may produce more
generalizable compliance data if subjects are not paid when using TCSMS for clinical purposes.
Given the well-documented positive effects of therapist-patient rapport (Beck, Rush,
Shaw, & Emery, 1979; Leach, 2005; Joe, Simpson, Dansereau, & Rowan-Salz, 2001; Kaplan,
Greenfield, & Ware, 1989) on treatment compliance and other factors associated with positive
outcomes, it is reasonable to expect that compliance rates for the TCSMS would likely improve
even more, if patients were using the system to monitor their mood as part of an active and
ongoing treatment, with a competent clinician.
Three subjects who used the web-based version of TCSMS provided feedback at the 3-
month follow-up (subjects who used the texting version of TCSMS were sent an online survey
and none replied). All subjects replied they found the system easy to use and that it was helpful
to track their moods each week. Asked if they would use the system if it were not part of a study,
two stated they would. Another participant stated he would likely not, as he rarely uses email.
One participant, an 18 year old female stated, “It was really helpful, I don't look back at my daily
journal unless I am in therapy, so this gave me the chance to see [how my mood changes each
week]… Daily on paper is a little more difficult. Weekly [online tracking] is better.” Overall
these compliance data and usability feedback suggest that TCSMS is a system that adolescents
diagnosed with bipolar disorder are willing to use.
The participant who reported he rarely uses email is likely part of a larger trend of young
people decreasing reliance on the use of email to communicate. According to the digital
43
marketing research firm ComScore, the use of email by adolescents aged 12 to 17 decreased by
30% between 2010 and 2011 (ComScore, 2012).
Specific Aim #2: Validity of the TCSMS – Bipolar vs. Healthy Controls
Based on our findings, it is early to conclude that the TCSMS effectively differentiates
the short-term course of mood variability in bipolar and non-bipolar adolescents. While bipolar
adolescents did report significantly higher rates of depression, and greater changes in depression
over time, the same did not hold for ratings of mania and hypomania. Bipolar adolescents also
did not report more polarity switches over time than non-bipolar controls.
In addition to examining the severity of manic and depressive symptoms between bipolar
and non-bipolar controls, we explored whether or not certain mood states were predictive of
other mood states, or polarity switches within the bipolar group. We found that bipolar
adolescents with higher reported manic symptoms reported more polarity switches between
manic and depressed states. One potential benefit of the TCSMS system is that it may ultimately
be useful as a predictive device. In this case, with a small sample and limited follow-up time, we
were able to determine that for this group, there is an increased risk for polarity switching among
adolescents who report higher mania scores at baseline. By its very nature, mania involves
increased risky behavior, poor judgment and disruptions in functioning, and the addition of
polarity switching confers additional risks and poor outcomes (Maj, et al. 2002). Thus, the
TCSMS could be used as a low-cost, method of continuously monitoring adolescents for
potentially problematic mood changes.
Specific Aim #3: Proportion of time spent in mood states
When reporting depressive symptoms on the QIDS, bipolar adolescents reported
approximately half of the 13 weeks of follow-up with any level of depression, and half of the

44
weeks without depressive symptoms. When reporting manic or hypomanic symptoms on the
ASRMS, participants reported no symptoms during the vast majority of weeks. When reporting
both QIDS and ASRMS scores, participants reported 9 percent of weeks with both elevated and
depressed symptoms, and 19% of weeks without symptoms of either mania or hypomania, or
depression.
While longitudinal research with adolescent bipolar populations has not provided
particularly consistent results when describing duration of time spent in various mood states,
these results are similar to previously published findings (e.g., Birmaher et al. 2009; Birmaher et
al., 2006; Geller, Tillman, Craney and Bolhoffner, 2004), which suggests the TCSMS may be a
valid measure of time spent in episode for bipolar adolescents. Results of these studies compared
with our results, are summarized below in Table 4.
Table 4. Comparison of Results of Longitudinal Studies of Adolescents with Bipolar Disorder
Authors
N Age BP
Subtype Follow-up % Depressed % Manic % Mixed % Euthymic
Geller, Tillman, Craney and Bolhoffner (2004)
86 10.8±2.7 I
4 years
47.1
56
Birmaher, Axleson, Strober, Gill, Valeria, et al. (2006)*
263 13 I, II
2 years
6.3
3.9
38
Birmaher, Axelson, Goldstein, Strober, Gill et al. (2009)
413 7-17 I, II, NOS
4 years
6.3** 9.4
3.9 15.7
2.9 12.8
39.7
Bopp, et al. (Current Study) 18 17 I, II
13 weeks
49
13
9
19 *Subjects were “subsyndromally symptomatic 37% of weeks. ** Upper value represents syndromal symptoms, lower value represents subsyndromal symptoms
Within the bipolar group, we found that the most common depressive state was mild, or
subsyndromal. Bipolar adolescents reported mild depression on 29% of reported weeks, which
was significantly higher than average rates of mild depression among the non-bipolar control
45
condition. According to these results, bipolar adolescents experience more periods of low-grade
depression than their non mood-disordered compatriots.
Although bipolar disorder is formally conceptualized as a disorder of episodes, this and
prior research suggest a significant amount of time is spent between episodes with symptoms that
do not meet duration or severity requirements for the diagnosis of major depressive disorder.
While this level of depression does not warrant clinical diagnosis, subsyndromal depression can
be debilitating. Periods of subthreshold symptomatology are significantly debilitating but are
often untreated. Altshuler et al. (2006) found that subsyndromal depression is significantly
correlated with impairment at work, at home, and in relationships with family members and
friends. Tohen, Bowden, Calabrese, Lin, Forrester, Sachs, et al., (2006) found that subsyndromal
depression predicts the likelihood of major depressive relapse.
The most common mood state for bipolar in adults, appears to be subsyndromal
depression. For example, Judd et al. (2003) found that 135 bipolar individuals experienced sub-
syndromal depression at a frequency three times that of syndromal depression. Individuals are
more than twice as likely to develop subsyndromal depressive symptoms than hypomanic
symptoms between acute mood episodes (Keller et al., 1992). Vieta, Sanchez Moreno, Lahuerta,
and Zaragoza (2008) found that bipolar individuals, who are considered clinically to be in
remission, actually have significantly higher scores on the Hamilton Depression Rating Scale
than non-bipolar control participants.
Findings for bipolar adolescents are similar. Birmaher et al. (2009) found that bipolar
youth were subsyndromally symptomatic 41% of recorded weeks. Birmaher et al. (2006) found
that bipolar adolescents were subsyndromally symptomatic 37.9% of recorded weeks. We found

46
that adolescents reported mild and moderate levels of depressive symptoms an average of 40% of
weeks (compared with an average of 9% of weeks with severe and very severe depression).
In addition to findings related to proportions of time spent in different mood states, we
explored whether or not these proportions were predictive of any other mood states. We found a
positive correlation between time spent with symptoms of mania or hypomania, and time spent
with symptoms of both mania and depression simultaneously. The combination of agitation and
hopelessness that defines mixed states is profoundly impairing and distressing, but more
troubling, confers greater risk for suicide attempts (Goldstein et al. 2012; Algorta, et al. 2011,
Balázs, Benazzi, Rihmer, Rihmer, Akiskal, & Akiskal, 2006). Any method of effectively
monitoring patients for this risk should be explored.
Limitations
A potentially serious limitation is the fact that the ASRMS has not been validated for use
with adolescents. Additionally mania fundamentally impairs judgment, and adolescents may be
poor reporters of their psychiatric symptoms when compared to parents and treatment providers
(Achenbach, McConaughy, & Howell, 1987). There is therefore some possibility that TCSMS
cannot reliably detect differences between bipolar and non-bipolar adolescents.
Collecting ratings each week during treatment sessions could address the issue of
accuracy in self-reported symptoms. In fact it was initially planned to collect observer ratings
using the Adolescent Longitudinal Interval Follow-up Evaluation (A-LIFE), derived from the
well-validated adult LIFE interview (Keller et al., 1987), a structured interview that provides a
cross-sectional and longitudinal picture of an adolescent’s mood symptoms. Unfortunately, there
were errors in gathering these data. Specifically, we expected A-LIFE date ranges and TCSMS
date ranges to overlap, but the majority of A-LIFE data was collected before most participants

47
began reporting weekly mood via TCSMS, which resulted in too few overlapping scores on each
rating. Therefore these analyses were not completed, and remain a goal of future research.
There may be other explanations for the lack of differentiation in mania symptoms
between groups. Due to time constraints, only 3 months of data were analyzed for this study, as
opposed to the intended 6. It may be the case that lack of differentiation between bipolar and
control participants, particularly with regard to manic symptoms may result from lack of
adequate follow-up duration. In other words, bipolar subjects simply may not have had enough
time to experience manic or hypomanic symptoms. Stringaris et al. (2010) followed 93
adolescents with bipolar disorder for an average of two years, and found that 62% of these
subjects experienced at least one manic, hypomanic, or mixed episode during the follow-up
period. Birmaher and colleagues (2006) found bipolar adolescents spent only 3.9% of weeks
with manic or hypomanic symptoms over a similar time period. Given the relatively small
percentage of time adolescents spend with manic or hypomanic symptoms, it may be the case
that a larger sample, followed for a full 6 months, would reveal more manic and hypomanic
symptoms in the bipolar group.
There were also significant challenges in recruiting bipolar adolescents from both the
Colorado and McLean sites, which resulted in a smaller-than expected N in the bipolar group,
and subsequently reduced statistical power. Initially we intended to recruit 22 subjects in both
groups, but ultimately recruited 18 bipolar subjects, and of those, four were noncompliant with
the protocol, resulting in an N of 14 for primary analyses. The resulting reduction in power may
have decreased our ability to find statistical differences.
Power analysis conducted with the pwr package in R (R Development Core Team, 2009)
indicated that, the full sample size, including the 4 bipolar non-compliers, provided low power,
48
at 35% to detect a medium effect size (d= .5; Cohen, 1992) for the 1 degree of freedom contrasts
with a two-tailed alpha of .05 for comparisons on both QIDS and ASRMS ratings. Excluding the
four noncompliers reduced power to 31%. For the ANOVAs, power with the full sample of 18
participants was 67% to detect a medium effect size (d=.5), and 62% when the four
noncompliers were excluded. Recruitment for the TCSMS project is ongoing, and ultimately we
plan to recruit 22 bipolar subjects and analyze data for a full 6 months.
In addition, the recruited samples may have been more stable and less symptomatic than
a sample more representative of average bipolar adolescents. Both control and bipolar samples
were samples of convenience. The control group was recruited via an email listserve at the
University of Colorado at Boulder. While this listserve is often used to recruit control and
research samples for research at the University, it is limited in several ways. First, the majority of
subjects (n=37) were recruited in Boulder, Colorado, a fairly racially, ethnically, and
socioeconomically homogenous area. According to the Boulder Economic Council’s 2013
Market Profile, 40% of residents hold an advanced degree, and 93% of the population identifies
as white. In comparison, national averages are 27% and 78% respectively (US Census Bureau,
2012). A recent longitudinal analysis of adults and adolescents in Denver, Colorado showed a
correlation between lower income, poverty, and symptoms of depression and anxiety (Santiago,
Wadsworth, and Stump, 2011). It is therefore possible that including a sample that is more
representative of national averages of race, ethnicity, and socioeconomic status, may have
resulted in more separation between bipolar and control participants, and an increase in both
reported mood symptoms, as well as mood variability in the control group.
Another limitation related to sampling is that a significant number of the bipolar group
were recruited from the larger University of Colorado project, “Effectiveness of Family-Focused

49
Treatment Plus Pharmacotherapy for Bipolar Disorder in Adolescents.” This study examined the
effectiveness of a 21-session Family Focused Treatment for adolescents with bipolar disorder.
This presents a potential selection bias, as participants’ positive or negative feelings about the
larger study may have influenced their decision to participate in TCSMS. For every subject
enrolled in the TCSMS study, one potential participant either declined to participate, or did not
return recruitment phone calls. Parents and adolescents who were contacted gave a number of
reasons for declining participation. Several parents had cut off or limited their child’s ability to
send and receive text messages due to behavioral problems. A number of adolescents were
hospitalized or in boarding schools and did not have access to their cell phones. Another group
of adolescents were simply “not interested.” One adolescent, perhaps echoing the sentiment of
others, stated that she was “just tired of doing research.” After participating in 21 months of
treatment, plus additional months of follow-up, refusers may have been suffering from “research
fatigue” (Clark, 2012). For this reason, bipolar subjects who agreed to participate may have been
less symptomatic, more stable, have had a more positive experience in the larger study, and have
been more compliant than a sample that had no previous experience with The Colorado Family
Project.
In addition, all subjects recruited for this study were either actively receiving treatment or
had undergone comprehensive treatment for their illness. A sample recruited independently of
any other research project may have reported more significant mood symptoms, and greater
variability in mood fluctuation.
Implications
We expect that the continued TCSMS trial with this adolescent population will reveal
differences between bipolar and control participants. If this is indeed the case, there are positive

50
implications for using this technology both clinically and in research as a method for
contemporaneous mood monitoring. Researchers are supplied with data as soon as they are
entered making frequent follow-up assessments with participants less necessary. Text-message
responses are immediately stored on computers, reducing data-entry burden, reducing lost paper
data and reducing data-entry errors. The relatively low cost and ubiquity of cell phones and
smartphones make this data collection method potentially more feasible and cost-effective than
traditional methods.
A significant portion of the adolescent population owns cell phones, and uses text-
messaging regularly. According to a recent Nielsen Company report (Nielsen Company, 2010), a
typical adolescent aged 13 to 17 sends an average of 3,339 text messages per month. There is
also no proprietary software to be installed or maintained on participants’ cell phones. While
there were costs associated with system development, setup, and maintenance, once the system
was up and running, data was automatically collected and organized for each patient and costs
were limited to Internet fees and an unlimited texting plan. Participants who use the web-based
version of the TCS must have access to the Internet, which could exclude some individuals.
According to the 2010 US Census, over 70% of US households have Internet access. According
to the International Telecommunications Union, in 2012, 81% of Americans had Internet access
either in or outside of the home.
The increasing ubiquity of smart phones does not make TCSMS obsolete, in fact, the
web-based TCSMS system is optimized for cell phone use, and allows patients to see their
weekly mood fluctuations charted on a graph, which may improve adherence due to feedback
about their input, and which may provide useful psychoeducational material in between sessions.
Because there is no software or app to be installed, patients do not run the risk of revealing that
51
they are participating in research of psychotherapy when they inevitably share their phones with
others.
Perhaps the most striking finding in this study is the high rate of compliance in spite of
the fact that participants were not using TCSMS as part of active treatment, which could be
assumed to be a major factor in reducing compliance from reaching even higher levels. While
there is not a shortage of research on compliance with weekly homework assigned by therapists,
there is so little methodological consistency across studies (Kazantzis, Deana, and Ronin, 2004),
that is it difficult to truly know what the true picture of compliance is across the spectrum of
psychotherapeutic intervention. Kazentzis, et al’s (2004) meta-analysis reviewed 32 studies of
homework compliance and found very little consistency in rater (e.g. patient, clinician,
independent rater), definition of “compliance” (e.g., some vs. all homework, amount of time
spent on homework or quality of homework). Nonetheless there is ample anecdotal evidence to
suggest that there are significant challenges to consistent follow through with assigned
homework. Patients “forget” homework at home, or “in the car.” Patients complete daily
homework in the waiting room.
Although diagnostically, the symptoms of bipolar disorder are conceptualized as either
present or absent, the reality appears to be considerably more complex. Not only are patients
very often subsyndromally symptomatic, but subsyndromal symptoms and depression in
particular, are quite impairing. Further exploration of this phenomenon can contribute to
improved diagnostic and etiological understanding of bipolar disorder. TCSMS offers a new
method of collecting these data that can potentially contribute to this body of research.
Monitoring patients for subsyndromal symptoms is an essential part of treatment and
should be considered in longitudinal research as well. With long-term monitoring of mood and
52
related patterns, for certain individuals, hypomania and subsyndromal depression could serve as
predictors of more damaging manic and major depressive episodes, allowing early
pharmacological or psychotherapeutic intervention. The TCSMS provides the unique advantage
of tracking mood between sessions, and if these mood-state predictors are accurate, they may
provide more definitive assessment of risk for suicide, self-harm or risky behaviors than
traditional clinical assessment.
A new iteration of TCSMS allows patients to add events (e.g. medication changes) and to
track behavioral patterns (e.g. sleep and exercise) which can facilitate a better understanding of
antecedents to mood changes. Future iterations of the TCSMS may be even more customizable
for each patient, allowing for the monitoring of variables such as hours slept, quality of sleep,
stress, medication adherence, exercise and food intake. Correlations within each individual
between these behaviors and mood change could then be determined. Moreover more frequent
assessments may facilitate the examination of predictors of individual response, moderators of
treatment effects, and the mechanisms/active ingredients associated with improvement or
destabilization in pharmacological or psychosocial treatment. In turn, these findings may help us
to understand when and how to intervene more efficiently to prevent recurrence. For example, if
a patient is reporting an increase in depression, a clinician may more aggressively pursue an
intervention that targets the specific symptoms of depression the particular patient is endorsing
on the QIDS. If a patient endorses higher scores on items one through four, which relate to sleep,
and TCSMS trends have suggested this particular patient is particularly susceptible to worsening
depression when sleep begins to become disrupted, a clinician may implement a brief CBT-I
(cognitive behavioral therapy for insomnia) (Edinger & Carney, 2008), thus potentially
mitigating a worsening depressive episode. Conversely if a patient reports high scores on item

53
three of the ASRMS, which relates to decreased need for sleep, a clinician might prescribe a
higher dose of a particular mood-stabilizer as a “rescue medication” to avert a potentially
damaging escalation.
Ultimately this technology could be used to help patients better understand the course of
their illness, and to allow treatment providers to intervene either medically or
psychotherapeutically where appropriate. Patients who regularly monitor their mood are able to
notice shifts in mood that are often lost to memory, or clouded by current mood
symptomatology. Clinicians can use mood and behavior charting to show patients that certain
psychosocial stressors such as irregular sleep and substance use may contribute to mood
instability. Mood charting can also help patients track mood trends after medication changes or
cognitive behavioral interventions. Again, mood-dependent recall biases can often pose a
challenge to recognizing that a particular intervention is having a desired or undesired effect, so
it is necessary to track these events and behaviors in real time. These kinds of insights are often
challenging to elicit without the objective evidence provided by these kinds of regular self-
reports.
Future development of the TCSMS could also include alerts to patients and care
providers if a particular behavior (e.g. changes in sleep patterns) that is known to precede
destabilization is reported. It may ultimately be possible, given enough data, to predict
destabilization for a certain individual. Before such data are collected however, it would be
possible to set alerts when behaviors that are already known to indicate or potentially precede
destabilization in the average patient with bipolar disorder. For example, Leibenluft, Albert,
Rosenthal, and Wher (1996) have shown than decreases in sleep duration predict mania.
Johnson, et al. (2000) have shown that goal attainment can predict manic episodes. As each

54
individual’s unique patterns become evident, however, additional alert paradigms can be added
to that patient’s profile. In a sense, the system could “learn” each patient’s patterns and
predictors, creating a truly customized monitoring, tracking and alert system.
Conclusion
In summary, the TrueColours Self-Management system is a feasible alternative to
traditional pencil-and-paper mood monitoring methods, and may be a reliable and valid
alternative to more formal diagnostic and assessment tools. Participants demonstrated high levels
of compliance with the weekly protocol. Results also demonstrated TCSMS differentiated
bipolar and non-bipolar participants on levels and variability of depression over time. Similar to
previously published research, adolescents with bipolar disorder reported more depressive than
manic or hypomanic symptoms and minimal symptomatic remission. Within the bipolar group
results suggested an increased risk for polarity switching and mixed mood states with increased
ratings of weekly manic and hypomanic symptoms. To our knowledge this is the first study using
text messaging as primary means for adolescents diagnosed with bipolar disorder to report
weekly moods. With longer follow-up, we anticipate the less common symptoms of mania and
hypomania to appear, and to demonstrate the ability of TCSMS to more fully differentiate
bipolar and non-bipolar adolescents. TCSMS offers promise as an alternative to traditional
longitudinal data collection methods in bipolar research, and the possibility of predictive ability
that may assist in anticipating and mitigating the potentially destructive effects of the extremes of
mood and behavior that characterize adolescent bipolar disorder
55
REFERENCES
Achenbach, T. M., McConaughy, S. H., & Howell, C. T. (1987). Child/adolescent behavioral
and emotional problems: implications of cross-informant correlations for situational
specificity. Psychological bulletin, 101(2), 213.
Algorta, G. P., Youngstrom, E. A., Frazier, T. W., Freeman, A. J., Youngstrom, J. K., &
Findling, R. L. (2011). Suicidality in pediatric bipolar disorder: predictor or outcome of
family processes and mixed mood presentation?. Bipolar disorders, 13(1), 76-86.
Altman, E. G., Hedeker, D., Peterson, J. L., & Davis, J. M. (1997). The altman self-rating mania
scale. Biological Psychiatry, 42(10), 948-955.
Altman, E. G., Hedeker, D. R., Janicak, P. G., Peterson, J. L., & Davis, J. M. (1994). The
clinician-administered rating scale for mania (CARS-M): development, reliability, and
validity. Biological Psychiatry, 36(2), 124-134.
Altman, E. (1998). Rating scales for mania: Is self-rating reliable? Journal of Affective
Disorders, 50(2-3), 283-286.
Altshuler, L. L., Post, R. M., Black, D. O., Keck, P. E., Jr., Nolen, W. A., Frye, M. A., Suppes,
T., Grunze, H., Kupka, R. W., Leverich, G. S., McElroy, S. L., Walden, J., & Mintz, J.
(2006). Subsyndromal depressive symptoms are associated with functional impairment in
patients with bipolar disorder: Results of a large, multisite study. Journal of Clinical
Psychiatry, 67(10), 1551-1560.
American Psychiatric Association. (2000). Diagnostic and statistical manual of mental disorders
(4th ed.text revision). Washington, DC: American Psychiatric Publishing
56
American Psychiatric Association. (2013). Diagnostic and statistical manual of mental disorders
(5th ed.). Arlington, VA: American Psychiatric Publishing
Axelson D, Birmaher BJ, Brent D, Wassick S, Hoover C, Bridge J, et al (2003): A preliminary
study of the Kiddie Schedule for Affective Disorders and Schizophrenia for School-Age
Children mania rating scale for children and adolescents. Journal of Child and
Adolescent Psychopharmacology 13:463-470.
Axelson, D., Birmaher, B., Strober, M., Gill, M. K., Valeri, S., Chiapetta, L., Ryan, N., Leonard,
H., Hunt, J., Iyenger, S., Bridge, J., & Keller, M. (2006). Phenomenology of children and
adolescents with bipolar spectrum disorders. Archives of General Psychiatry, 63(10),
1139-1148.
Balázs, J., Benazzi, F., Rihmer, Z., Rihmer, A., Akiskal, K. K., & Akiskal, H. S. (2006). The
close link between suicide attempts and mixed (bipolar) depression: implications for suicide
prevention. Journal of affective disorders,91(2), 133-138.
Baldessarini, R. J., Perry, R., & Pike, J. (2008). Factors associated with treatment nonadherence
among US bipolar disorder patients. Human Psychopharmacology: Clinical and
Experimental, 23(2), 95-105.
Bauer, M., Grof, P., Rasgon, N., Gyulai, L., Glenn, T., & Whybrow, P. (2005). New computer
based tool for the longitudinal study of bipolar disorder. Aspects of Affect, 1(2), 101-108.
Bauer, M., Grof, P., Rasgon, N., Sasse, J., Glenn, T., Neuhaus, K., . . . Whybrow, P. C. (2005).
New technology for longitudinal studies of patients with bipolar disorder. Clinical
Approaches in Bipolar Disor- ders, 4, 4–10.
57
Beesdo , K. , Hofler , M. , Leibenluft , E. , Lieb , R. , Bauer , M. , & Pfennig , A. ( 2009 ). Mood
episodes and mood disorders: patterns of incidence and conversion in the first three
decades of life . Bipolar Disorders , 11 , 637 – 649.
Begley, C., Annengers, J., Swann, A., Lewis, C., Coan, S., Schnapp, W., & Bryant-Coomstock,
L. (2001). The Lifetime Cost of Bipolar Disorder in the US: An Estimate for New Cases
in 1998. Pharmacoeconomics, 19(5), 483-495.
Ben-Zeev, D., Young, M. A., & Madsen, J. W. (2009). Retrospective recall of affect in clinically
depressed individuals and controls. Cognition and Emotion, 23(5), 1021-
Biederman, J. (1998). Resolved: Mania is mistaken for ADHD in prepubertal children. Journal
of the American Academy of Child & Adolescent Psychiatry, 37(10), 1091-1093.
Biederman, J. (2006). The evolving face of pediatric mania. Biological Psychiatry.S pecial Issue:
The Clinical and Neural Phenotype of Mood Disturbance in Children and Adults, 60(9),
901-902.
Biederman, J., Mick, E., Faraone, S. V., Van Patten, S., Burback, M., & Wozniak, J. (2004). A
prospective follow-up study of pediatric bipolar disorder in boys with attention-
deficit/hyperactivity disorder. Journal of Affective Disorders, 82(Suppl1), S17-S23.
Biederman, J., Faraone, S., Mick, E., & Wozniak, J. (1996). Attention-deficit hyperactivity
disorder and childhood BD: An overlooked comorbidity? Journal of the American
Academy of Child & Adolescent Psychiatry, 35(8), 997-1008.
Birmaher, B., Axelson, D., Goldstein, B., Strober, M., Gill, M. K., Hunt, J., Houck, P., Ha, W.,
Iyengar, S., Kim, E., Yen, S., Hower, H., Esposito-Smythers, C., Goldstein, T., Ryan, N.,
& Keller, M. (2009). Four-year longitudinal course of children and adolescents with
58
bipolar spectrum disorders: The course and outcome of bipolar youth (COBY) study. The
American Journal of Psychiatry, 166(7), 795-804.
Bopp, J. M., Miklowitz, D. J., Goodwin, G. M., Stevens, W., Rendell, J. M., & Geddes, J. R.
(2010). The longitudinal course of bipolar disorder as revealed through weekly text
messaging: A feasibility study. Bipolar Disorders, 12(3), 327-334.
Burt, D. B., Zembar, M. J., & Niederehe, G. (1995). Depression and memory impairment: A
meta-analysis of the association, its pattern, and specificity. Psychological Bulletin, 117(2),
285-305.
Burt, C. D. (1992). Reconstruction of the duration of autobiographical events. Memory &
Cognition, 20(2), 124-132.
Chang, K. D., Steiner, H., & Ketter, T. A. (2000). Psychiatric phenomenology of child and
adolescent bipolar offspring. Journal of the American Academy of Child & Adolescent
Psychiatry, 39(4), 453-460.
Chinman, M., Young, A. S., Schell, T., Hassell, J., & Mintz, J. (2004). Computer-assisted self-
assessment in persons with severe mental illness. Journal of Clinical Psychiatry, 65(10),
1343-1351.
Clark, T. (2008). 'We're over-researched here!' exploring accounts of research fatigue within
qualitative research engagements.Sociology, 42(5), 953-970.
Cohen, J. (1992). A power primer. Psychological bulletin, 112(1), 155.
ComScore (2012) 2012 U.S. Digital Future in Focus (White paper). ComScore: Reston, VA.
Csikszentmihalyi, Larson, & Prescott (1977). The ecology of adolescent activity and experience.
Journal of Youth and Adolescence, (6)3, 281-294.

59
Davis R, (1979), Manic depressive variant syndrome of childhood: a preliminary report.
American Journal of Psychiatry 136:702-706.
DeCarlo Santiago, C., Wadsworth, M. E., & Stump, J. (2011). Socioeconomic status,
neighborhood disadvantage, and poverty-related stress: Prospective effects on
psychological syndromes among diverse low-income families. Journal of Economic
Psychology, 32(2), 218-230.
Delfino, R. J., Jamner, L. D., & Whalen, C. K. (2001). Temporal analysis of the relationship of
smoking behavior and urges to mood states in men versus women. Nicotine & Tobacco
Research, 3(3), 235-248.
Denicoff, K. D., Leverich, G. S., Nolen, W. A., Rush, A. J., McElroy, S. L., Keck, P. E., Jr., et
al. (2000). Validation of the prospective NIMH-life-chart method (NIMH-LCM-)-p) for
longitudinal assessment of bipolar illness. Psychological Medicine, 30(6), 1391-1397.
Edinger, J, D, & Carney, C.E. (2008). Overcoming Insomnia: A Cognitive-Behavioral Therapy
Approach Therapist Guide. Oxford University Press.
Faedda, G. L., Baldessarini, R. J., Suppes, T., Tondo, L., Becker, I., & Lipschitz, D. S. (1995).
Pediatric-onset bipolar disorder: A neglected clinical and public health problem. Harvard
review of psychiatry, 3(4), 171-195.
Faurholt-Jepsen, M., Vinberg, M., Christensen, E. M., Frost, M., Bardram, J., & Kessing, L. V.
(2013). Daily electronic self-monitoring of subjective and objective symptoms in bipolar
disorder—the MONARCA trial protocol (MONitoring, treAtment and pRediCtion of
bipolAr disorder episodes): a randomised controlled single-blind trial. BMJ open, 3(7).
Geller, B., Bolhofner, K., Craney, J. L., Williams, M., DelBello, M. P., & Gundersen, K. (2000).
Psychosocial functioning in a prepubertal and early adolescent bipolar disorder
60
phenotype. Journal of the American Academy of Child & Adolescent Psychiatry, 39(12),
1543-1548. doi:10.1097/00004583-200012000-00018
Geller B, & Luby J.(1997). Child and adolescent bipolar disorder: a review of the past 10 years.
Journal of The American Academy of Child and Adolescent Psychiatry; 36, 1168–1176.
Geller, B., Tillman, R., Craney, J. L., & Bolhofner, K. (2004). Four-year prospective outcome
and natural history of mania in children with a prepubertal and early adolescent bipolar
disorder phenotype. Archives of General Psychiatry, 61(5), 459-467.
doi:10.1001/archpsyc.61.5.459
Ger D, Everitt BS (2001): Handbook of Statistical Analyses Using SAS, Second Edition London:
CRC Press.
Goetzel, R., Hawkins, K., Ozminkowski, R., Wang, S. (2003). The Health and Productivity Cost
Burden of the "Top 10" Physical and Mental Health Conditions Affecting Six Large U.S.
Employers in 1999. Journal of Occupational and Environmental Medicine, 45(1), 5-14.
Goldberg, J. F., & Ernst, C. L. (2002). Features associated with the delayed initiation of mood
stabilizers at illness onset in bipolar disorder. The Journal of clinical psychiatry, 63(11),
985-991.
Goldberg, J. F., & Harrow, M. (2005). Subjective life satisfaction and objective functional
outcome in bipolar and unipolar mood disorders: A longitudinal analysis. Journal of
Affective Disorders, 89(1-3), 79-89.
Goldstein, T. R., Ha, W., Axelson, D. A., Goldstein, B. I., Liao, M. F., Gill, M. M. K., ... &
Birmaher, B. (2012). Predictors of prospectively examined suicide attempts among youth
with bipolar disorder. Archives of general psychiatry,69(11), 1113.
61
Hörn, M., Schärer, L., Walser, S., Scherer-Klabunde, D., Biedermann, C., & Walden, J. (2002).
Comparison of long-term monitoring methods for bipolar affective disorder.
Neuropsychobiology, 45(1), 27-32.
Hunt, J. I., Dyl, J., Armstrong, L., Litvin, E., Sheeran, T., & Spirito, A. (2005). Frequency of
manic symptoms and bipolar disorder in psychiatrically hospitalized adolescents using
the K-SADS mania rating scale. Journal of child and adolescent psychopharmacology,
15(6), 918-930.
Jahng, S., Wood, P. K., & Trull, T. J. (2008). Analysis of affective instability in ecological
momentary assessment: Indices using successive difference and group comparison via
multilevel modeling. Psychological Methods, 13(4), 354-375.
Joe, G. W., Simpson, D. D., Dansereau, D. F., & Rowan-Szal, G. A. (2001). Relationships
between counseling rapport and drug abuse treatment outcomes.Psychiatric
Services, 52(9), 1223-1229.
Johnson, S. L., Sandrow, D., Meyer, B., Winters, R., Miller, I., Solomon, D., & Keitner, G.
(2000). Increases in manic symptoms after life events involving goal attainment. Journal
of Abnormal Psychology, 109(4), 721.
Judd, L. L., Akiskal, H. S., Schettler, P. J., Coryell, W., Endicott, J., Maser, J. D., et al. (2003a).
A prospective investigation of the natural history of the long-term weekly symptomatic
status of bipolar II disorder. Archives of General Psychiatry, 60(3), 261- 269.
Judd, L. L., Schettler, P. J., Akiskal, H. S., Maser, J., Coryell, W., Solomon, D., et al. (2003c).
Long-term symptomatic status of bipolar I vs. bipolar II disorders. International Journal
of Neuropsychopharmacology, 6(2), 127-137.
62
Judd, L. L., Schettler, P. J., Solomon, D. A., Maser, J. D., Coryell, W., Endicott, J., et al. (2008).
Psychosocial disability and work role function compared across the long-term course of
bipolar I, bipolar II and unipolar major depressive disorders. Journal of Affective
Disorders, 108(1-2), 49-49.
Kaplan, S. H., Greenfield, S., & Ware Jr, J. E. (1989). Assessing the effects of physician-patient
interactions on the outcomes of chronic disease. Medical care, 27(3), S110.
Kaufman, J., Birmaher, B., Brent, D., & Rao, U. (1997). Schedule for affective disorders and
schizophrenia for school-age children-present and lifetime version (K-SADS-PL): Initial
reliability and validity data. Journal of the American Academy of Child & Adolescent
Psychiatry, 36(7), 980-988.
Kazantzis, N., Deane, F. P., & Ronan, K. R. (2004). Assessing compliance with homework
assignments: Review and recommendations for clinical practice. Journal of clinical
psychology, 60(6), 627-641
Keller MB, Lavori PW, Friedman B, et al. (1987): The longitudinal interval follow-up
evaluation: A comprehensive method for assessing outcome in prospective longitudinal
studies. Archives of General Psychiatry 44:540-548.
Keller, M. B., Lavori, P. W., Kane, J. M., & Gelenberg, A. J. (1992). Subsyndromal symptoms in
bipolar disorder: A comparison of standard and low serum levels of lithium. Archives of
General Psychiatry, 49(5), 371-376.
Kim, E. Y., & Miklowitz, D. J. (2002). Childhood mania, attention deficit hyperactivity disorder
and conduct disorder: A critical review of diagnostic dilemmas. Bipolar disorders, 4(4),
215-225.

63
Kimhy, D., Delespaul, P., Corcoran, C., Ahn, H., Yale, S., & Malaspina, D. (2006).
Computerized experience sampling method (ESMc): Assessing feasibility and validity
among individuals with schizophrenia. Journal of Psychiatric Research, 40(3), 221-230.
Kraepelin, E. (1921). Manic Depressive Insanity and Paranoia. Edinburgh: E&S Livingstone
Kupfer, D. J. (2005). Dimensional models for research and diagnosis: A current dilemma.
Journal of Abnormal Psychology, 114, 557-559.
Kupka, R. W., Altshuler, L. L., Nolen, W. A., Suppes, T., Luckenbaugh, D. A., Leverich, G. S.,
et al. (2007). Three times more days depressed than manic or hypomanic.
Leibenluft, E., Albert, P. S., Rosenthal, N. E., & Wehr, T. A. (1996). Relationship between sleep
and mood in patients with rapid-cycling bipolar disorder. Psychiatry Research, 63(2),
161-168.
Leach, M. J. (2005). Rapport: a key to treatment success. Complementary Therapies in Clinical
Practice, 11(4), 262-265.
Maj, M., Pirozzi, R., Magliano, L., & Bartoli, L. (2002). "The prognostic significance of
'switching' in patients with bipolar disorder: A 10-year prospective follow-up study":
Erratum. The American Journal of Psychiatry, 159(12), 2132.
Mantere, O., Suominen, K., Valtonen, H. M., Arvilommi, P., Leppämäki, S., Melartin, T., et al.
(2008). Differences in outcome of DSM-IV bipolar I and II disorders. Bipolar Disorders,
10(3), 413-425.
Merikangas, K. R., Akiskal, H. S., Anheygst, J., Greenberg, P. E., Hirschfeld, R. M. A.,
Petukhova, M., et al. (2007). Lifetime and 12-month prevalence of bipolar spectrum
disorder in the national comorbidity survey replication. Archives of General Psychiatry,
64(5), 543-552.

64
Miklowitz, D. J. (2008). Adjunctive psychotherapy for bipolar disorder: State of the evidence.
The American Journal of Psychiatry, 165(11), 1408-1419.
Miklowitz, D. J., & Johnson, S. L. (2006). The psychopathology and treatment of bipolar
disorder. Annual Review of Clinical Psychology, 2, 199-235.
Miklowitz, D. J., Price, J., Holmes, E. A., Rendell, J., Bell, S., Budge, K., . . . Geddes, J. R.
(2012). Facilitated integrated mood management for adults with bipolar disorder. Bipolar
Disorders, 14(2), 185-197.
Pavuluri, M. N., Birmaher, B., & Naylor, M. W. (2005). Pediatric bipolar disorder: A review of
the past 10 years. Journal of the American Academy of Child & Adolescent Psychiatry,
44(9), 846-871.
Pliszka, S. R., Sherman, J. O., Barrow, M. V., & Irick, S. (2000). Affective disorder in juvenile
offenders: A preliminary study. American Journal of Psychiatry, 157(1), 130-132.
Post, R. M., Leverich, G. S., Kupka, R. W., Keck, P. E., Jr., McElroy, S. L., Altshuler, L. L., . . .
Nolen, W. A. (2010). Early-onset bipolar depression and treatment delay are risk factors
for poor outcome in adulthood. Journal of Clinical Psychiatry, 71(7), 864-872.
R Development Core Team (2011). R: A language and environment for statistical computing. R
Foundation for Statistical Computing, Vienna, Austria.
Reilly-Harrington, N. A., DeBonis, D., Leon, A. C., Sylvia, L., Perlis, R., Lewis, D., & Sachs, G.
S. (2010). The interactive computer interview for mania. Bipolar Disorders, 12(5), 521-
527.
Rosa, A. R., Andreazza, A. C., Kunz, M., Gomes, F., Santin, A., Sanchez-Moreno, J., et al.
(2008). Predominant polarity in bipolar disorder: Diagnostic implications. Journal of
Affective Disorders, 107(1-3), 45-45.
65
Rush, A. J., Gullion, C. M., Basco, M. R., Jarrett, R. B., & Trivedi, M. H. (1996). The inventory
of depressive symptomatology (IDS): psychometric properties. Psychological
medicine, 26(3), 477-486.
Rush AJ, Trivedi MH, Ibrahim HM, Carmody TJ, Arnow B, Klein DN (2003): The 16-item
quick inventory of depressive symptomatology (QIDS), clinician rating (QIDS-C), and self-
report (QIDS-SR): A psychometric evaluation in patients with chronic major depression.
Biological Psychiatry 54:573-583.
Schärer, L. O., Hartweg, V., Valerius, G., Graf, M., Hoern, M., Biedermann, C., et al. (2002).
Life charts on a palmtop computer: First results of a feasibility study with an electronic
diary for bipolar patients. Bipolar Disorders, 4(Suppl1), 107-108.
Simon, J., Budge, K., Foster, J., Bell, S., Goodwin, G., & Geddes, J. (2011). Impact of True
Colours mood monitoring on mental health service utilisation. In BIPOLAR
DISORDERS (Vol. 13, pp. 90-90).
Simon, G. E., & Rutter, C. M. (2008). Accuracy of recall for mania symptoms using a three
month timeline follow-back interview. Journal of Affective Disorders, 107(1-3), 271-274.
Smyth, J. M., Wonderlich, S. A., Heron, K. E., Sliwinski, M. J., Crosby, R. D., Mitchell, J. E., et
al. (2007). Daily and momentary mood and stress are associated with binge eating and
vomiting in bulimia nervosa patients in the natural environment. Journal of Consulting
and Clinical Psychology, 75(4), 629-638.
Stone, A. A., Shiffman, S., Schwartz, J. E., Broderick, J. E., & Hufford, M. R. (2002). Patient
non-compliance with paper diaries. British Medical Journal, 324, 1193–1194.
Stringaris, A., Baroni, A., Haimm, C., Brotman, M., Lowe, C. H., Myers, F., ... & Leibenluft, E.
(2010). Pediatric bipolar disorder versus severe mood dysregulation: risk for manic
66
episodes on follow-up. Journal of the American Academy of Child & Adolescent
Psychiatry, 49(4), 397-405.
The Kannel Group, Kannel Software Version 1.0". www.kannel.org Retrieved 2010-10-01.
Trivedi, M. H., Rush, A. J., Ibrahim, H. M., Carmody, T. J., Biggs, M. M., Suppes, T., et al.
(2004). The inventory of depressive symptomatology, clinician rating (IDS-C) and self-
report (IDS-SR), and the quick inventory of depressive symptomatology, clinician rating
(QIDS-C) and self-report (QIDS-SR) in public sector patients with mood disorders: A
psychometric evaluation. Psychological Medicine, 34(1), 73-82.
Perlis, R. H., Ostacher, M. J., Patel, J. K., Marangell, L. B., Zhang, H., Wisniewski, S. R., Ketter,
T. A., Miklowitz, D. J., Otto, M. W., Gyulai, L., Reilly-Harrington, N. A., Nierenberg, A.
A., Sachs, G. S., & Thase, M. E. (2006). Predictors of recurrence in bipolar disorder:
Primary outcomes from the systematic treatment enhancement program for bipolar disorder
(STEP-BD). The American Journal of Psychiatry, 163(2), 217-224.
Tondo, L., Isacsson, G., & Baldessarini, R. J. (2003). Suicidal behaviour in bipolar disorder:
Risk and prevention. CNS Drugs, 17(7), 491-511.
http://quickfacts.census.gov/qfd/states/00000.html
Ösby, U., Brandt, L., Correia, N., Ekbom, A., & Sparén, P. (2001). Excess mortality in bipolar
and unipolar disorder in sweden. Archives of General Psychiatry, 58(9), 844-850.
doi:10.1001/archpsyc.58.9.844
Vieta, E., Sánchez-Moreno, J., Lahuerta, J., Zaragoza, S., & For the EDHIPO Group
(Hypomania Detection Study Group). (2008). Subsyndromal depressive symptoms in
patients with bipolar and unipolar disorder during clinical remission. Journal of Affective
Disorders, 107(1-3), 169-174.
67
Willett, J. B., & Sayer, A. G. (1994). Using covariance structure analysis to detect correlates and
predictors of individual change over time. Psychological Bulletin, 116(2), 363.
Tohen, M., Bowden, C. L., Calabrese, J. R., Lin, D., Forrester, T. D., Sachs, G. S., Koukopoulos,
A., Yatham, L., & Grunze, H. (2006). Influence of sub-syndromal symptoms after remission
from manic or mixed episodes. British Journal of Psychiatry, 189(6), 515-519.
Whalen, C. K., Henker, B., Jamner, L. D., Ishikawa, S. S., Floro, J. N., Swindle, R., et al. (2006).
Toward mapping daily challenges of living with ADHD: Maternal and child perspectives
using electronic diaries. Journal of Abnormal Child Psychology, 34(1), 115-130.
Wozniak, J., Petty, C. R., Schreck, M., Moses, A., Faraone, S. V., & Biederman, J. (2011). High
level of persistence of pediatric bipolar-I disorder from childhood onto adolescent years: A
four year prospective longitudinal follow-up study. Journal of Psychiatric
Research, 45(10), 1273-1282.