Embed Size (px)
Citation preview

The Low-Cost OPEC Cycle:
The Big Elephant in the Room
Bassam Fattouh
PRESENTED AT THE BANK OF ENGLAND
Oxford Institute for Energy Studies
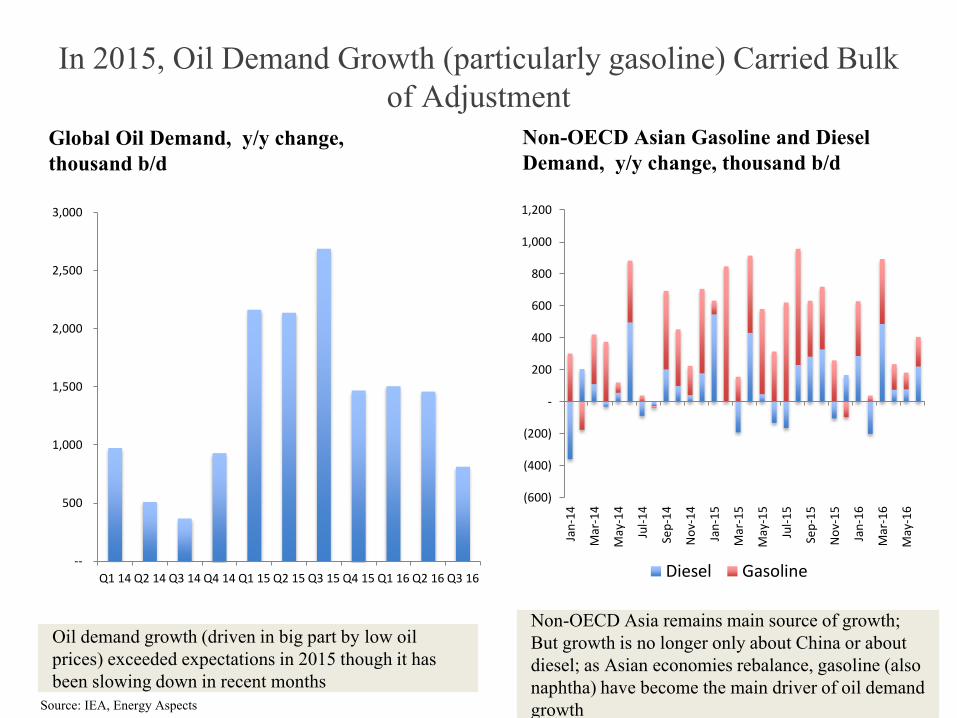
In 2015, Oil Demand Growth (particularly gasoline) Carried Bulk
of Adjustment
Global Oil Demand, y/y change,
thousand b/d
Source: IEA, Energy Aspects
Oil demand growth (driven in big part by low oil
prices) exceeded expectations in 2015 though it has
been slowing down in recent months
--
500
1,000
1,500
2,000
2,500
3,000
Q1 14 Q2 14 Q3 14 Q4 14 Q1 15 Q2 15 Q3 15 Q4 15 Q1 16 Q2 16 Q3 16
(600)
(400)
(200)
-
200
400
600
800
1,000
1,200
Jan
-14
Mar
-14
May
-14
Jul-
14
Sep
-14
No
v-1
4
Jan
-15
Mar
-15
May
-15
Jul-
15
Sep
-15
No
v-1
5
Jan
-16
Mar
-16
May
-16
Diesel Gasoline
Non-OECD Asian Gasoline and Diesel
Demand, y/y change, thousand b/d
Non-OECD Asia remains main source of growth;
But growth is no longer only about China or about
diesel; as Asian economies rebalance, gasoline (also
naphtha) have become the main driver of oil demand
growth

In 2016, Pass on the Baton to Non-OPEC Supply (Particularly US
Shale)
Despite efficiency gains, US shale has been
leading the way and has been the fastest to
respond to the decline in the oil price with growth
turning negative
1265
1035
881
583
44
-150
-318
-480
-681-578 -619
-1000
-500
0
500
1000
1500
(2,000)
(1,500)
(1,000)
(500)
-
500
1,000
1,500
2,000
2,500
3,000
12
Q1
12
Q2
12
Q3
12
Q4
13
Q1
13
Q2
13
Q3
13
Q4
14
Q1
14
Q2
14
Q3
14
Q4
15
Q1
15
Q2
15
Q3
15
Q4
16
Q1
16
Q2
16
Q3
North America South America FSU Europe
Asia-Pacific Middle East Africa
Non-OPEC Supply, y/y change, thousand b/d US Supply, y/y change, thousand b/d
After robust growth in the environment of high oil
prices, the y/y change in non-OPEC supply has
turned negative in almost every part of the world
Source: EIA, Energy Aspects

Middle East OPEC Supply Growth: the Elephant in the Room
Iranian oil Output, mb/dSaudi and Iraq output, y/y change, mb/d
OPEC has been major source of supply growth with
Iraq and Saudi Arabia alone adding more than 1.1 mb/d
in 2015 and more than 700,000 b/d in 2016 (Jan-
August)
In 2016, Iraq and Saudi Arabia were joined by Iran
which ramped up its output to pre-sanction levels
much faster than originally expected
0
200
400
600
800
1,000
1,200
1,400
1,600
1,800
Iraq Saudi Arabia
2.50
2.70
2.90
3.10
3.30
3.50
3.70
3.90
Jan
-10
Au
g-1
0
Mar
-11
Oct
-11
May
-12
Dec
-12
Jul-
13
Feb
-14
Sep
-14
Ap
r-1
5
No
v-1
5
Jun-1
6
Source: OPEC, Energy Aspects

Saudi Oil Policy Based on Fundamental Principle: No Unilateral
Action to Balance the Market on Downside
Source: BP, OPEC
-
2000
4000
6000
8000
10000
12000
14000
Saudi Arabia Oil Production, mb/d Saudi Arabia production vs Quota (kb/d)
Saudi Arabia not willing to cut output unilaterally; shaped
by the mid 1980s events when its attempt to protect the
price resulted in loss of large volumes of production and
market share (and lower revenues)
In response to Venezuela’s increase in output in
the mid 1990s, Saudi Arabia increased its output
beyond its quota contributing to the oil price
collapse
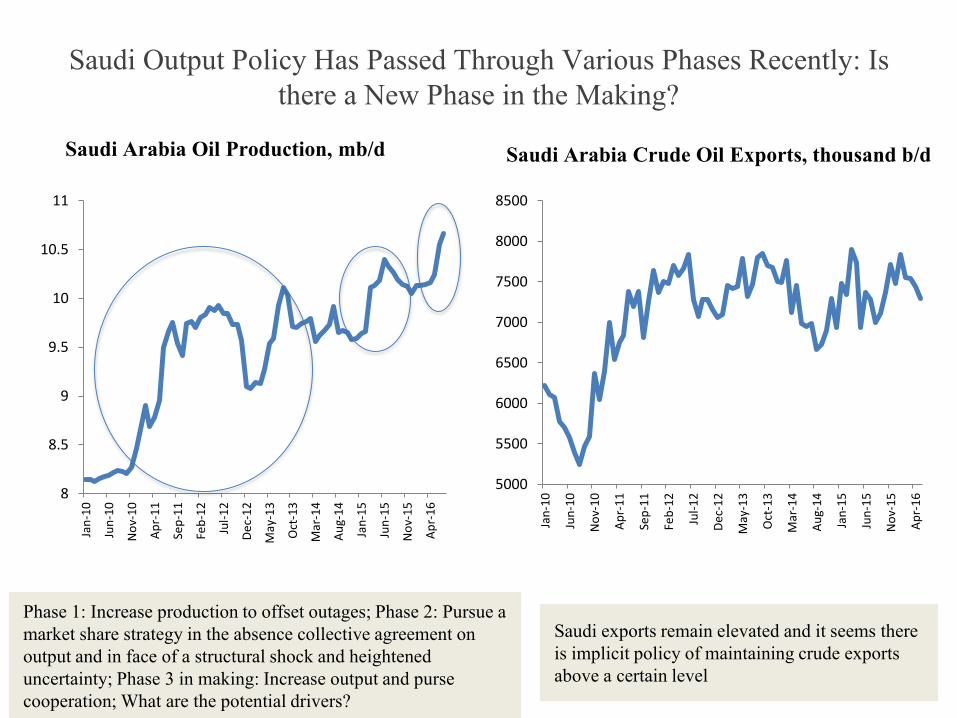
Saudi Output Policy Has Passed Through Various Phases Recently: Is
there a New Phase in the Making?
8
8.5
9
9.5
10
10.5
11
Jan
-10
Jun
-10
No
v-1
0
Ap
r-1
1
Sep
-11
Feb
-12
Jul-
12
De
c-1
2
May
-13
Oct
-13
Mar
-14
Au
g-1
4
Jan
-15
Jun
-15
No
v-1
5
Ap
r-1
6
Saudi Arabia Oil Production, mb/d
Phase 1: Increase production to offset outages; Phase 2: Pursue a
market share strategy in the absence collective agreement on
output and in face of a structural shock and heightened
uncertainty; Phase 3 in making: Increase output and purse
cooperation; What are the potential drivers?
5000
5500
6000
6500
7000
7500
8000
8500
Jan
-10
Jun
-10
No
v-1
0
Ap
r-1
1
Sep
-11
Feb
-12
Jul-
12
De
c-1
2
May
-13
Oct
-13
Mar
-14
Au
g-1
4
Jan
-15
Jun
-15
No
v-1
5
Ap
r-1
6
Saudi exports remain elevated and it seems there
is implicit policy of maintaining crude exports
above a certain level
Saudi Arabia Crude Oil Exports, thousand b/d

Recent Increase in Output Not Only Due To Swing in Summer Oil
Demand
-150
-100
-50
0
50
100
150
Jan14
Mar14
May14
Jul14
Sep14
Nov14
Jan15
Mar15
May15
Jul15
Sep15
Nov15
Jan16
Mar16
May16
Gasoline Diesel
Gasoline and Diesel Demand, thousand b/d
Products demand has weakened in recent months
particularly diesel reflecting an overall slower
economic growth
(250)
(200)
(150)
(100)
(50)
-
50
100
150
200
250
300
Jan14
Mar14
May14
Jul14
Sep14
Nov14
Jan15
Mar15
May15
Jul15
Sep15
Nov15
Jan16
Mar16
May16
Crude Burn, y/y change, thousand b/d
Crude burn compared to last year has also fallen
reflecting in part slower growth of electricity
demand and use of more gas in the power sector
Source: JODI

Saudi Arabia Also Competing in Products Markets
Saudi Arabia Refining Runs, mb/d
Saudi Arabia refining runs at record levels as the
new refineries ramp-up output
Exports of products (particularly diesel) have been
on the rise and Saudi Arabia is competing in
products market
Saudi Arabia Products Exports, mb/d
0
100
200
300
400
500
600
700
Jan
-10
Jun
-10
No
v-1
0
Ap
r-1
1
Sep
-11
Feb
-12
Jul-
12
De
c-1
2
May
-13
Oct
-13
Mar
-14
Au
g-1
4
Jan
-15
Jun
-15
No
v-1
5
Ap
r-1
6
Gasoline Exports Diesel Exports Jet Exports
Source: JODI
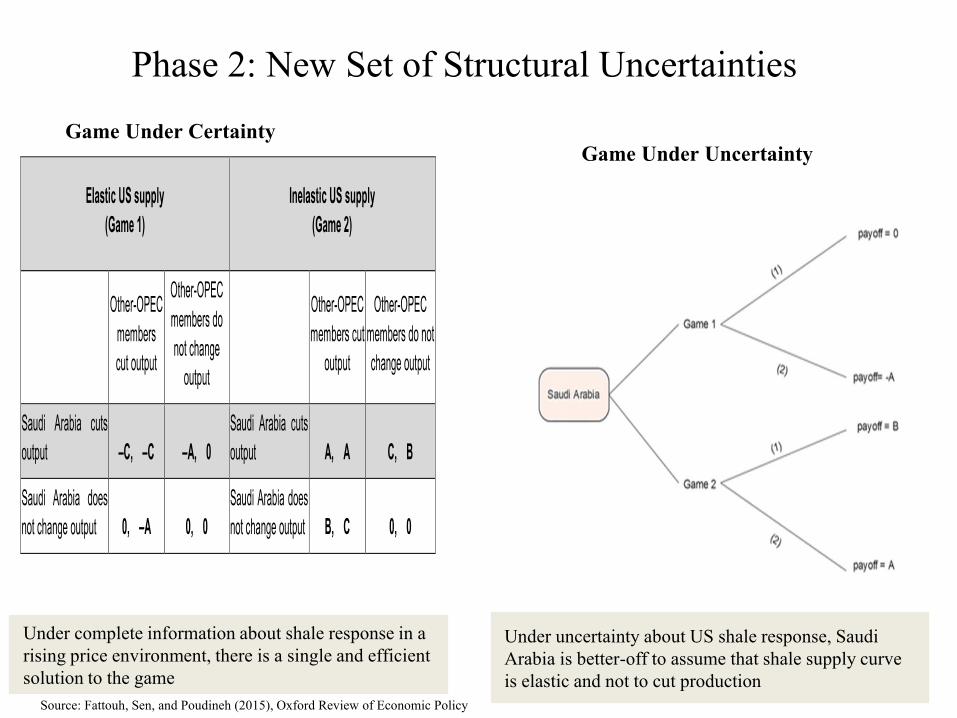
Phase 2: New Set of Structural Uncertainties
Under complete information about shale response in a
rising price environment, there is a single and efficient
solution to the game
Under uncertainty about US shale response, Saudi
Arabia is better-off to assume that shale supply curve
is elastic and not to cut production
Game Under Certainty
The contents of this paper are the author’s sole responsibility. They do not necessarily represent the viewsof the Oxford Institute for Energy Studies or any of its Members.
16
Figure 19: Game under uncertainty
Source: Fattouh et al. (2015).
The quest for market share
For now, Saudi Arabia’s output policy seems to focus on market share. There has been a debate
among economists about the intrinsic value of market share as an economic objective. It is possible to
identify three reasons as to why Saudi Arabia may wish to pursue market share. First, Saudi Arabia
holds 267 billion barrels of proven reserves, with a reserve-to-production ratio of more than 63 years.
Therefore, securing markets for its oil is a key long-term policy objective. In other words, while
revenue maximization constitutes a key policy objective, the time horizon over which revenues should
be maximized also matters. Second, when it is difficult to reach an agreement within OPEC on a
collective cut, Saudi Arabia can maintain or even increase its market share, pushing prices down and
reducing the revenues for all other oil producers in an attempt to get other producers to cooperate.
Third, pursuing market share can act as a deterrent strategy to squeeze high-cost competitors out of
the market. Also consistent with this strategy, Saudi Arabia can abandon its role as market stabilizer
in an over-supplied market, inducing more price volatility and sharper price movements. Increased
volatility, together with the perception that prices could fluctuate within a wide range, might cause
investors to reassess the risks in new energy projects. This would increase the value of the option to
wait and discourage investment in new oil projects.21
The loss of a key feedback mechanism
One of the distinguishing features of the current price fall is the low probability that the market
attaches to any form of cooperation between producers to clear the market. OPEC behaviour over
this cycle has been different from that seen in several previous cycles and this represents a structural
shift in the market adjustment mechanism. In 2008, the global financial crisis resulted in large drop in
oil demand. OPEC reacted to this temporary decline by sharply cutting output, which proved effective:
the V-shaped recovery of the global economy meant that oil demand quickly recovered and OPEC
was able to raise its output and meet the increase in demand. In 1998, the drop in demand due to the
Asian financial crisis and Venezuela’s drive to maximize production posed a major challenge for
OPEC. Both of these factors eventually reversed, with oil demand recovering as Asian economies
emerged from the financial crisis, and Venezuelan production declining after Chavez assumed power.
Although it took a long time for OPEC and non-OPEC members to reach an agreement on an output
cut, the 1998 crisis reasserted OPEC’s role in the market. In contrast, in 1986, the decline in demand,
the increase in non-OPEC supply, and lack of cohesion within OPEC resulted in a collapse of the
OPEC administered pricing system and the emergence of a new pricing structure in which OPEC’s
21 In 2015 the new Saudi Energy Minister Mr Al-Falih noted that ‘the past willingness of Saudi Arabia in particular to limit output
to defend high oil prices was a mistake that had only served to spur high-cost output elsewhere. Such a policy had offered high
cost producers an “insurance policy” of “$100 oil … a guarantee of no risk for investment.” ’
Game Under Uncertainty
Source: Fattouh, Sen, and Poudineh (2015), Oxford Review of Economic Policy

Limited Diversification and Heavy Reliance on Government Revenues
Oil share of government revenues, %
Data on Q1 real GDP growth showed that the economy expanded by 1.5 percent, year-on-year. Growth was mainly due to a positive contribution from the oil sector, while non-oil government GDP contracted for a second consecutive quarter, reflecting the impact of fiscal consolidation. GDP by kind of economic activity points to a general slowdown in most sectors within the non-oil economy.
3
Quarterly GDP Growth
Real GDP growth reached 1.5 percent in Q1 2016, slowing from 1.8 percent in the previous quarter.
The main contribution to GDP growth came from the oil sector, which rose by 5.1 percent, year-on-year.
Most sectors within the non-oil economy saw a slowdown in their growth rates during Q1, with annual growth turning negative in the construction, wholesale & retail, and utilities sectors.
August 2016
Oil Sector GDP Growth (year-on-year change)
Quarterly Real GDP Growth
Real GDP Growth by Kind of Economic Activity (year-on-year change)
-4
-2
0
2
4
6
8
10
12
2013Q1
Q3 2014Q1
Q3 2015Q1
Q3 2016Q1
Non-oil manufacturing ConstructionWholesale & retail TransportFinance Utilities
(p
erc
en
t)
-4
-2
0
2
4
6
8
2013Q1
Q3 2014Q1
Q3 2015Q1
Q3 2016Q1
Non-oil - gov (ppt) Non-oil - pvt. (ppt)Oil (ppt) Real GDP, % y/y
-10
-8
-6
-4
-2
0
2
4
6
8
10
2013Q1
Q3 2014Q1
Q3 2015Q1
Q3 2016Q1
Oil sector GDP Oil production
(p
erc
en
t)
Quarterly Real GDP Growth
Paradox: Vision 2030 is about moving away from oil
but oil revenues constitutes main source of
government revenues and are enabling factor to
transitioning to ‘vibrant’ economy
Fall in oil revenues has had a big on economy
especially on non-oil private sector which still relies
heavily on government spending
Source: Jadwa

Despite fiscal buffers, Saudi Economy Badly Hit By Low Oil Price
In June, the values for both non-oil exports and imports were down, month-on-month. The decline in imports in recent months reflects the slowdown in domestic economic activity so far in 2016. However, one upside from the recent decline in imports is an improvement in the Kingdom’s monthly non-oil trade balance.
7
Trade
Non-oil exports fell by $0.4 billion in June (-10 percent, year-on-year). Meanwhile imports declined at a faster pace, falling by $0.7 billion in June (-24 percent, year-on-year). One upside from the Kingdom’s recent trade performance is an improvement in the monthly non-oil trade balance, which has reached -$7.7 billion in June.
September 2016
Imports
Non-oil Exports
Monthly Non-oil Trade Balance
-40
-30
-20
-10
0
10
20
30
3.0
3.5
4.0
4.5
5.0
5.5
6.0
Jun-14 Dec-14 Jun-15 Dec-15 Jun-16
non-oil exports % change, y/y (RHS)
(p
erc
en
t)
($
billio
n)
-30
-20
-10
0
10
20
30
10
11
12
13
14
15
16
Jun-14 Dec-14 Jun-15 Dec-15 Jun-16
Imports % change, y/y (RHS)
($
b
illio
n)
(p
erce
nt)
-12
-11
-10
-9
-8
-7
-6
Jun-14 Dec-14 Jun-15 Dec-15 Jun-16
($ b
illio
n)
Saudi Imports, $ billion and y/y change (%)
Saudi imports have declined sharply in the last few
months
The absence of any major events or news items related to listed companies, and a downward trend in oil prices towards the end of the month, saw the TASI fall by 3 percent, month-on-month, in August. Volumes also dipped during the month. We expect TASI activity to pick up in mid-September, after the Eid al-Adha break.
TASI
11
Stock Market
A dearth of news events
and a dip in oil prices, towards the end of the month, saw TASI decline by 3 percent month-on-month… ...with a number of regional markets also experiencing a similar decline. The impact was also seen in TASI market turnover,
which dipped to its lowest in exactly five years.
September 2016
Daily Average Stock Market Turnover
Comparative Stock Market Performance (monthly performance from 1st August 2016)
5,200
5,800
6,400
7,000
7,600
8,200
8,800
9,400
10,000
10,600
11,200
Aug-14 Feb-15 Aug-15 Feb-16 Aug-16
-4
-2
0
2
4
6
8
Qa
tar
Ch
ina
Bra
zil
Ge
rm
any
UK
MS
CI
EM
Ja
pa
n
Eg
yp
t
Du
bai
US
Ku
wa
it
Turkey
Ba
hra
in
Om
an
Ab
u D
ha
bi
TA
SI
(p
erce
nt)
0
2
4
6
8
10
12
Aug-11 Aug-12 Aug-13 Aug-14 Aug-15 Aug-16
(S
R b
illi
on
)
Saudi Stock Market Index
Saudi stock market has lost more than half of its value
since the the fall in the oil price
Source: Jadwa

Phase 3: The Power of Signaling
01/09 /2016, 10:38Saudi energy minister hints at ef for t to rebalance oil market - FT.com
Page 1 of 6ht tp:/ /www.f t .com/cms/s/0/86 513a92- 5f9b- 11e6 - ae3f- 77baadeb1c93.html#axzz4Izmg4MER
Share Author alerts Print Clip Comments
August 11, 2016 9:30 am
Anjli Raval, Oil and Gas Correspondent
Saudi energy minister hints at effort torebalance oil market
©Reuters...
Speed the market rebalancing by seeking cooperation with other producers but OPEC output at
historical records; Help improve market sentiment and squeeze shorts out of the market; Serious
barriers remain for a deal in November (Iran-Saudi relations being only one among many barriers)
Source: Financial Times, Reuters
30/09 /2016, 08 :01OPEC agrees modest oil output curbs in f irst deal since 2008 | Reuters
Page 1 of 5ht tp:/ /www.reuters.com/ar t icle/us- opec- meet ing- idUSKCN11Y18K
COMMODITIES | Thu Sep 29, 2016 | 4:29pm EDT
OPEC agrees modest oil output curbs in firstdeal since 2008
OPEC deal bullish for U.S. shale 01:03
By Rania El Gamal , Alex Lawler and Vladimir Soldatkin | ALGIERS
OPEC agreed on Wednesday modest oil output cut s in the first such deal since 2008, with the
group's leader Saudi Arabia softening its stance on arch-rival Iran amid mounting pressure from
low oil prices.
"OPEC made an exceptional decision t oday ... After two and a half years, OPEC reached consensus
to manage the market," said Iranian Oil Minister Bijan Zanganeh, who had repeatedly clashed with
Saudi Arabia during previous meetings.
He and other ministers said the Organization of the Petroleum Exporting Countries would reduce
output to a range of 32.5-33.0 million barrels per day. OPEC estimates its current output at 33.24
million bpd.
ADVERTISING
1 Philippines' Duterte likens himsel f to
Hitler, wants to kill millions of drug
users
2 After military raid, India looks at more
ways to pressure Pakistan
3 NXP Semiconductors explores sale to
Qualcomm: sources
4 U.S. lawmakers may change
September 11 law after rejecting veto
5 Three Chinese fishermen killed in
confrontation with South Korea
coastguard
TRENDING STORIES
Business Markets World Politics Tech Commentary Breakingviews Money Life Pictures Video
EDITION: UNITED STATES
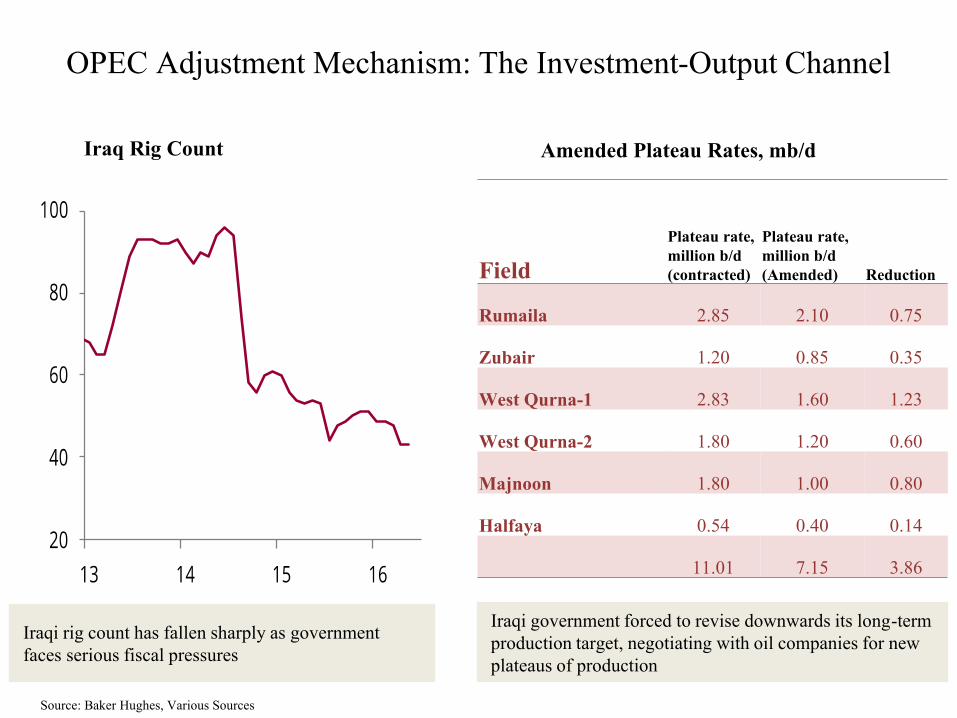
OPEC Adjustment Mechanism: The Investment-Output Channel
Iraq Rig Count
Iraqi rig count has fallen sharply as government
faces serious fiscal pressures
Iraqi government forced to revise downwards its long-term
production target, negotiating with oil companies for new
plateaus of production
Field
Plateau rate,
million b/d
(contracted)
Plateau rate,
million b/d
(Amended) Reduction
Rumaila 2.85 2.10 0.75
Zubair 1.20 0.85 0.35
West Qurna-1 2.83 1.60 1.23
West Qurna-2 1.80 1.20 0.60
Majnoon 1.80 1.00 0.80
Halfaya 0.54 0.40 0.14
11.01 7.15 3.86
Amended Plateau Rates, mb/d
Source: Baker Hughes, Various Sources

OPEC Adjustment Mechanism: The Fiscal Crisis-Output Disruption
Channel
Nigerian oil output, mb/d Venezuela oil output, mb/d
Attacks on oil infrastructure in the Niger Delta
intensifies as government’s ability to pay-off
militants weakens
Poor planning, lack of investment, fall in umber of
rigs, equipment theft, and payment delays to
service companies impacting Venezuela’s output
1
1.2
1.4
1.6
1.8
2
2.2
2.4
Jan
-10
Jul-
10
Jan
-11
Jul-
11
Jan
-12
Jul-
12
Jan
-13
Jul-
13
Jan
-14
Jul-
14
Jan
-15
Jul-
15
Jan
-16
Jul-
16
2
2.05
2.1
2.15
2.2
2.25
2.3
2.35
2.4
2.45
2.5
Jan
-10
Au
g-1
0
Mar
-11
Oct
-11
May
-12
Dec
-12
Jul-
13
Feb
-14
Sep
-14
Ap
r-1
5
No
v-1
5
Jun-1
6
Source: Energy Aspects

The Low-Cost OPEC Cycle
• OPEC adjustment mechanisms– Collective agreement on cuts (Long-time to achieve consensus especially when many producers have
aspirations to increase production; highly uncertain)
– Impact on investment and on output (Longer lags than high non-OPEC cost producers; in stable OPEC countries, drive to invest continues even in a low price environment; the drive to maximize output in an attempt to maximize short-term revenues)
– Fiscal crisis and output disruptions (highly unpredictable)
• OPEC current behavior represents a fundamental difference from some of the past cycles (absence of a key feedback mechanism to balance the market)
• Saudi oil policy shaped by multiple considerations (Internal: limited diversification; External: Nature of the shock; OPEC dynamics: Ability to forge a deal with other producers and implement it)
• As these factors change and/or as new information becomes available, Saudi oil policy will also change
• Potential shifts in Saudi oil policy and/or signals about these shifts will continue to shape oil market outcomes