Embed Size (px)
Citation preview

LETTER Earth Planets Space, 62, 875–879, 2010
The Mw 7.9, 12 May 2008 Sichuan earthquake rupture measured by sub-pixelcorrelation of ALOS PALSAR amplitude images
Marcello de Michele1, Daniel Raucoules1, Cecile Lasserre2, Erwan Pathier2, Yann Klinger3,Jerome Van Der Woerd4, Julia de Sigoyer5, and Xiwei Xu6
1French Geological Survey (BRGM), Land Use Planning and Natural Risks Division, Orleans, France2Laboratoire de Geophysique Interne et Tectonophysique, CNRS, Universite Joseph Fourier, Grenoble, France
3Institut de Physique du Globe de Paris, Laboratoire de Tectonique, Paris, France4Institut de Physique du Globe, Strasbourg, France
5Ecole Normale Superieure, Laboratoire de Geologie, Paris, France6China Earthquake Administration, Institue of Geology, Beijing, China
(Received October 9, 2008; Revised April 20, 2009; Accepted May 23, 2009; Online published January 26, 2011)
PALSAR L-band spaceborne Synthetic Aperture Radar (SAR) amplitude images are used to map the Sichuanearthquake rupture (China, Mw 7.9, 12 May 2008) and to identify the faults activated by the earthquake. Asub-pixel correlation method is used to retrieve the coseismic displacement field projected into the line of sightof the satellite and the horizontal along-track direction, and to map the surface rupture. The earthquake broke∼270 km of the Beichuan fault and ∼70 km of the Guanxian fault, with a complex thrust-dextral slip mechanism.Along the southwestern part of the rupture, slip seems to be partitioned into a dextral-dominant component onthe Beichuan fault and a thrust-dominant component on the Guanxian fault. Dextral slip may also be dominant atthe northeastern tip of the Beichuan ruptured fault. Coseismic surface displacements reach on average 3 to 4 min both measured directions. The SAR rupture mapping has proven complementary to field studies extending thezone of co-seismic displacements and identifying other possible co-seismic rupture strands.Key words: Sichuan, earthquake, rupture, PALSAR, amplitude offsets.
1. IntroductionThe Sichuan earthquake, Mw 7.9, struck the western
Sichuan province on 12 May 2008. It represents one ofthe most disastrous earthquakes in Chinese history, severelyaffecting an area where little historical seismicity is re-ported (Gu et al., 1989; Chen et al., 1994) and a smallconvergence rate is measured (e.g., Gan et al., 2007). Thehypocentre is located within the Longmen Shan at 19 kmdepth (USGS, 2008) between two major faults of the Long-men Shan thrust system, the Wenchuan and Beichuan faults(Fig. 1). The Longmen Shan thrust system bounds the east-ern margin of the Tibetan plateau and is considered as amajor thrust zone that was reactivated during the India-Asiacollision (e.g., Tapponnier and Molnar, 1977; Avouac andTapponnier, 1993; Chen and Wilson, 1996; Arne et al.,1997). However, contrasting geological evidence of sparsethrusting and marked dextral strike-slip faulting during theQuaternary (Burchfiel et al., 1995; Densmore et al., 2007)have led to models of dynamically sustained topography orcrustal channel flow (Royden et al., 1997) limiting the roleof earthquakes in mountain building and leaving the mech-anism of long term strain distribution in this area as an openquestion. In this paper we use L-band spaceborne SyntheticAperture Radar (SAR) from the PALSAR sensor onboard
Copyright c© The Society of Geomagnetism and Earth, Planetary and Space Sci-ences (SGEPSS); The Seismological Society of Japan; The Volcanological Societyof Japan; The Geodetic Society of Japan; The Japanese Society for Planetary Sci-ences; TERRAPUB.
doi:10.5047/eps.2009.05.002
the ALOS satellite to map the Sichuan earthquake ruptureand to identify the faults activated by the earthquake. Bymeasuring the co-seismic offsets field in both the line ofsight (i.e., slant range) and along track (i.e., azimuth) direc-tions of the sensor, we gain an understanding of the rupturegeometry, segmentation and sense of displacement. Our re-sults complement field observations since parts of the rup-tured areas are inaccessible impeding detailed field studies(Dong et al., 2008; Xu et al., 2009).
2. Data AnalysisA SAR system sends radar pulses to the ground and mea-
sures the amplitude and the phase of the backscattered sig-nal. Each radar return is sampled at the base of an az-imuth/slant range grid so that each echo corresponds to ageographic location, after geometric transformation. If be-tween two radar acquisitions the position of a target changeswe can precisely measure its corresponding offset by sub-pixel correlation analysis (e.g., Michel et al., 1999; Barbotet al., 2008). We use PALSAR amplitude images acquiredbefore and after the Sichuan earthquake and measure theoffset field generated by the earthquake in the range andazimuth directions by using the subpixel correlation rou-tine implemented in the GAMMA software (Werner et al.,2005). We calculate offsets based on a 64 pixel window sizeon PALSAR fine beam single polarisation mode (FBS) dataacquired during six parallel overlapping ascending tracks(Table 1).
Range offsets may suffer from limitations due to stereo-
875

876 M. DE MICHELE et al.: THE SICHUAN EARTHQUAKE FROM PALSAR AMPLITUDE IMAGES
Fig. 1. The study area struck by the Sichuan earthquake. Quaternary active faults and their kinematics are plotted in red (modified from Tapponnier andMolnar, 1977). BF = Beichuan fault; WF = Wenchuan Fault; GF = Guanxian Fault. The dotted rectangle corresponds to the location of Figs. 2 and3.
Table 1. PALSAR data used in this study.
Track Date Mode Pixel size range/azimuth (m)
471 29/02/2008 Ascending 4.68/3.15
31/05/2008
472 31/01/2008 Ascending 4.68/3.15
17/06/2008
473 17/02/2008 Ascending 4.68/3.15
19/05/2008
474 05/04/2008 Ascending 4.68/3.15
05/06/2008
475 21/12/2007 Ascending 4.68/3.15
22/06/2008
476 08/04/2008 Ascending 4.68/3.15
24/05/2008
scopic effects. We reduce the stereoscopic contributions tocoseismic range offset by adapting the methodology basedon Principal Component Analysis presented in de Micheleet al. (2008) to SAR amplitude images. We use the DigitalElevation Model (DEM) from the Shuttle Radar Topogra-phy Mission (SRTM) projected into radar geometry to esti-mate and reduce for the stereoscopic effect. Azimuth offsetsmay be affected by the influence of ionospheric electrondensity fluctuation occurring during the synthetic aperture(Gray et al., 2000). For an L-band SAR, this phenomenonresults in deca-km scale modulation in the position of opti-mum azimuth registration, which appears as oblique bandsor ‘azimuth streaks’ in the offset image. Based on the ob-
servation that the azimuth streaks have a constant preferen-tial orientation that does not coincide with the strike of thefault, we reduce this effect by an adaptive de-stripe filteroriginally developed by Leprince et al. (2007). It yielded a∼56% average ionospheric correction on the azimuth off-sets. The corrected offsets maps are then orthorectified andassembled (Figs. 2, 3).
3. ResultsFigures 2 and 3 present maps of the range and azimuth
offsets. We interpret steep offset gradients as the surfaceexpressions of the earthquake rupture. The clearest offsetsindicate that the rupture broke a 270 km-long major seg-

M. DE MICHELE et al.: THE SICHUAN EARTHQUAKE FROM PALSAR AMPLITUDE IMAGES 877
Fig. 2. Offsets in the range direction. Our interpretation of the rupture is plotted in white. Dark dashed lines represent possible rupture segments notyet observed in the field. The ∼10 km rupture segment striking NW-SE (perpendicular to BF and GF ruptures) is presented in bold black (here andin Fig. 3). The inset represents the average location of profiles used in the stack to retrieve the offset plots in Fig. 4. See the inset of Fig. 3 for thesatellite acquisition geometry.
Fig. 3. Offsets in the azimuth direction (azimuth streaks reduced). Our interpretation of the rupture is plotted in white. Dark dashed lines representpossible rupture segments not yet observed in the field. The inset represents the PALSAR acquisition geometry relative to our case study. Colourscaled arrows indicate the slant range and azimuth direction of the measured offset relative to the rupture position. This is a key to interpret the senseof displacement in Figs. 2 and 3. γ = sight angle (34◦), θ = angle between the rupture strike and azimuth direction (∼65◦).
878 M. DE MICHELE et al.: THE SICHUAN EARTHQUAKE FROM PALSAR AMPLITUDE IMAGES
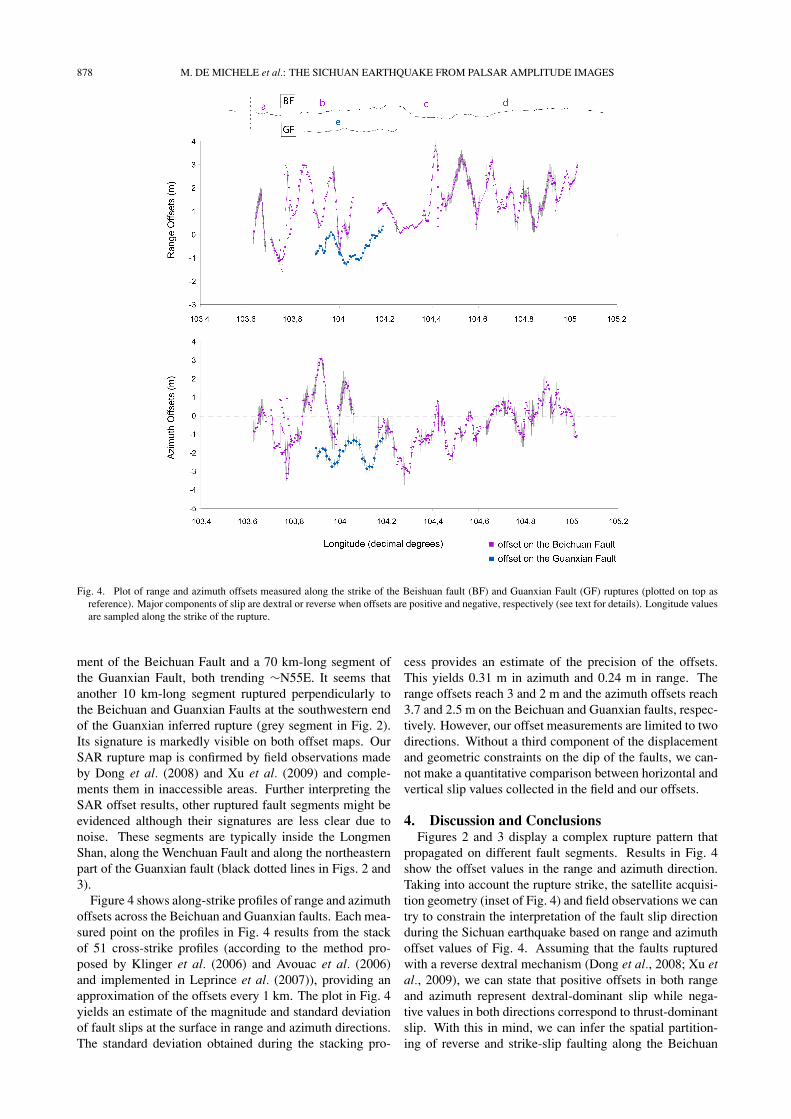
Fig. 4. Plot of range and azimuth offsets measured along the strike of the Beishuan fault (BF) and Guanxian Fault (GF) ruptures (plotted on top asreference). Major components of slip are dextral or reverse when offsets are positive and negative, respectively (see text for details). Longitude valuesare sampled along the strike of the rupture.
ment of the Beichuan Fault and a 70 km-long segment ofthe Guanxian Fault, both trending ∼N55E. It seems thatanother 10 km-long segment ruptured perpendicularly tothe Beichuan and Guanxian Faults at the southwestern endof the Guanxian inferred rupture (grey segment in Fig. 2).Its signature is markedly visible on both offset maps. OurSAR rupture map is confirmed by field observations madeby Dong et al. (2008) and Xu et al. (2009) and comple-ments them in inaccessible areas. Further interpreting theSAR offset results, other ruptured fault segments might beevidenced although their signatures are less clear due tonoise. These segments are typically inside the LongmenShan, along the Wenchuan Fault and along the northeasternpart of the Guanxian fault (black dotted lines in Figs. 2 and3).
Figure 4 shows along-strike profiles of range and azimuthoffsets across the Beichuan and Guanxian faults. Each mea-sured point on the profiles in Fig. 4 results from the stackof 51 cross-strike profiles (according to the method pro-posed by Klinger et al. (2006) and Avouac et al. (2006)and implemented in Leprince et al. (2007)), providing anapproximation of the offsets every 1 km. The plot in Fig. 4yields an estimate of the magnitude and standard deviationof fault slips at the surface in range and azimuth directions.The standard deviation obtained during the stacking pro-
cess provides an estimate of the precision of the offsets.This yields 0.31 m in azimuth and 0.24 m in range. Therange offsets reach 3 and 2 m and the azimuth offsets reach3.7 and 2.5 m on the Beichuan and Guanxian faults, respec-tively. However, our offset measurements are limited to twodirections. Without a third component of the displacementand geometric constraints on the dip of the faults, we can-not make a quantitative comparison between horizontal andvertical slip values collected in the field and our offsets.
4. Discussion and ConclusionsFigures 2 and 3 display a complex rupture pattern that
propagated on different fault segments. Results in Fig. 4show the offset values in the range and azimuth direction.Taking into account the rupture strike, the satellite acquisi-tion geometry (inset of Fig. 4) and field observations we cantry to constrain the interpretation of the fault slip directionduring the Sichuan earthquake based on range and azimuthoffset values of Fig. 4. Assuming that the faults rupturedwith a reverse dextral mechanism (Dong et al., 2008; Xu etal., 2009), we can state that positive offsets in both rangeand azimuth represent dextral-dominant slip while nega-tive values in both directions correspond to thrust-dominantslip. With this in mind, we can infer the spatial partition-ing of reverse and strike-slip faulting along the Beichuan

M. DE MICHELE et al.: THE SICHUAN EARTHQUAKE FROM PALSAR AMPLITUDE IMAGES 879
and Guanxian faults. We can argue that the Beichuan faultruptured with a complex thrust-dextral mechanism whilethe Guanxian fault seems to have ruptured as an almostpure thrust. Dextral-reverse slip on segment a of the Be-ichuan fault becomes partitioned into a dextral dominantcomponent on segment b of the Beichuan fault and thrust-dominant component on segment e of the Guanxian fault(Fig. 4). From segments c to d of the Beichuan fault, slipseems to evolve from dextral-reverse to dextral-dominant.This is not totally in agreement with field data, which showmostly thrust on the Guanxian fault, though equivalent re-verse and dextral motion on the Beichuan fault.
In conclusion, sub pixel correlation of ALOS PALSARamplitude images allowed us to map and measure the co-seismic rupture of the Sichuan earthquake. Our results com-plement field observations and thus allow a broader view ofthe rupture extension and segmentation.
Acknowledgments. The data used in this study were provided bythe Japanese Space Agency (JAXA) through the CIEST agreement(Cellule d’Intervention et d’Expertise Scientifique et Technique)and the International Charter on Space and Major Disasters. M deMichele and D. Raucoules are funded by the research programs ofBRGM.
ReferencesArne, D., B. Worley, C. Wilson, S. F. Chen, D. Foster, Z. L. Luo, S. G. Liu,
and P. Dirks, Differential exhumation in response to episodic thrustingalong the eastern margin of the Tibetan Plateau, Tectonophysics, 280,239–256, 1997.
Avouac, J. P. and P. Tapponnier, Kinematic model of active deformation incentral Asia, Geophys. Res. Lett., 20, 895–898, 1993.
Avouac, J. P., F. Ayoub, S. Leprince, O. Konca, and D. V. Helmberger, The2005, Mw 7.6 Kashmir earthquake: Sub-pixel correlation of ASTERimages and seismic waveforms analysis, Earth. Planet. Sci. Lett., 249,514–528, 2006.
Barbot, S., Y. Hamiel, and Y. Fialko, Space geodetic investigation of thecoseismic and postseismic deformation due to the 2003 Mw7.2 Altaiearthquake: Implications for the local lithospheric rheology, J. Geophys.Res., 113, B03403, doi:10.1029/2007JB005063, 2008.
Burchfiel, B. C., Z. Chen, Y. Liu, and L. H. Royden, Tectonics of theLongmen Shan and adjacent regions, Int. Geol. Rev., 37, 661–735, 1995.
Chen, S. F. and C. J. L. Wilson, Emplacement of the Longmen ShanThrust-Nappe Belt along the eastern margin of the Tibetan Plateau, J.Struct. Geol., 18, 413–430, 1996.
Chen, S., C. J. L. Wilson, Q. Deng, X. Zhao, and Z. Luo, Active faultingand block movement associated with large earthquakes in the Min Shanand Longmen Mountains, northeastern Tibetan Plateau, J. Geophys.Res., 99, 24,025–24,038, 1994.
de Michele, M., D. Raucoules, H. Aochi, N. Baghdadi, and C. Carnec,Measuring coseismic deformation on the northern segment of the Bam-Baravat escarpment associated with the 2003 Bam (Iran) earthquake, bycorrelation of very-high-resolution satellite imagery, Geophys. J. Int.,173(2), 459–464, 2008.
Densmore, A. L., M. A. Ellis, Y. Li, R. Zhou, G. S. Hancock, andN. Richardson, Active tectonics of the Beichuan and Guanxian faultsat the eastern margin of the Tibetan Plateau, Tectonics, 26, TC4005,doi:10.1029/2006TC001987, 2007.
Dong, S., Y. Zhang, Z. Wu, N. Yang, Y. Ma, W. Shi, Z. Chen, C. Long,and M. An, Surface rupture and co-seismic displacement produced bythe Ms 8.0 Wenchuan earthquake of May 12th, 2008, Sichuan, China:Eastward growth of the Qinghai-Tibet plateau, Acta Geologica Sinica(English Version), 82(5), 938–948, 2008.
Gan, W., P. Zhang, Z.-K. Shen, Z. Niu, M. Wang, Y. Wan, D. Zhou,and J. Cheng, Present-day crustal motion within the Tibetan Plateauinferred from GPS measurements, J. Geophys. Res., 112, B08416,doi:10.1029/2005JB004120, 2007.
Gray, A. L., K. E. Mattar, and G. Sofko, Influence of ionospheric elec-tron density fluctuations on satellite radar interferometry, Geophys. Res.Lett., 27(10), 1451–1454, 2000.
Gu, G., T. Lin, and Z. Shi, Catalogue of Chinese Earthquakes (1831 B.C.–1969 A.D.), Science Press, Beijing, China, 1989.
Klinger, Y., R. Michel, and G. C. P. King, Evidences for an earthquakebarrier model from Mw 7.8 Kokoxili (Tibet) earthquake slip distribution,Earth Planet. Sci. Lett., 242, 354–364, 2006.
Leprince, S., S. Barbot, F. Ayoub, and J. P. Avouac, Automatic and preciseorthorectification, coregistration, and subpixel correlation of satelliteimages, application to ground deformation measurements, IEEE Trans.Geosci. Remote Sens., 45, 1529–1558, 2007.
Michel, R., J. P. Avouac, and J. Taboury, Measuring ground displacementsfrom SAR amplitude images: Application to the Landers earthquake,Geophys. Res. Lett., 26, 875–878, 1999.
Royden, L. H., B. C. Burchfiel, R. W. King, E. Wang, Z. Chen, F. Shen,and Y. Liu, Surface deformation and lower crustal flow in eastern Tibet,Science, 276, 788–790, 1997.
Tapponnier, P. and P. Molnar, Active faulting and tectonics in China, J.Geophys. Res., 82(B20), 2905–2930, 1977.
USGS, http://earthquake.usgs.gov/eqcenter/recenteqsww/Quakes/us2008ryan.php, 2008.
Werner, C., U. Wegmuller, T. Strozzi, and A. Wiesmann, Precision esti-mation of local offsets between pairs of SAR SLCs and detected SARimages, Proceedings of the Geoscience and Remote Sensing Symposium(IGARSS), 25–29 July 2005, IEEE International Volume 7, 4803–4805,2005.
Xu, X., X. Wen, G. Yu, G. Chen, Y. Klinger, J. Hubbard, and J. Shaw,Co-seismic reverse- and oblique-slip surface faulting generated by the2008 Mw 7.9 Wenchuan earthquake, China, Geology, 37(6), 515–518,doi:10.1130/G25462A.1, 2009.
M. de Michele (e-mail: [email protected]), D. Raucoules, C.Lasserre, E. Pathier, Y. Klinger, J. Van Der Woerd, J. de Sigoyer, and X.Xu