Embed Size (px)
Citation preview
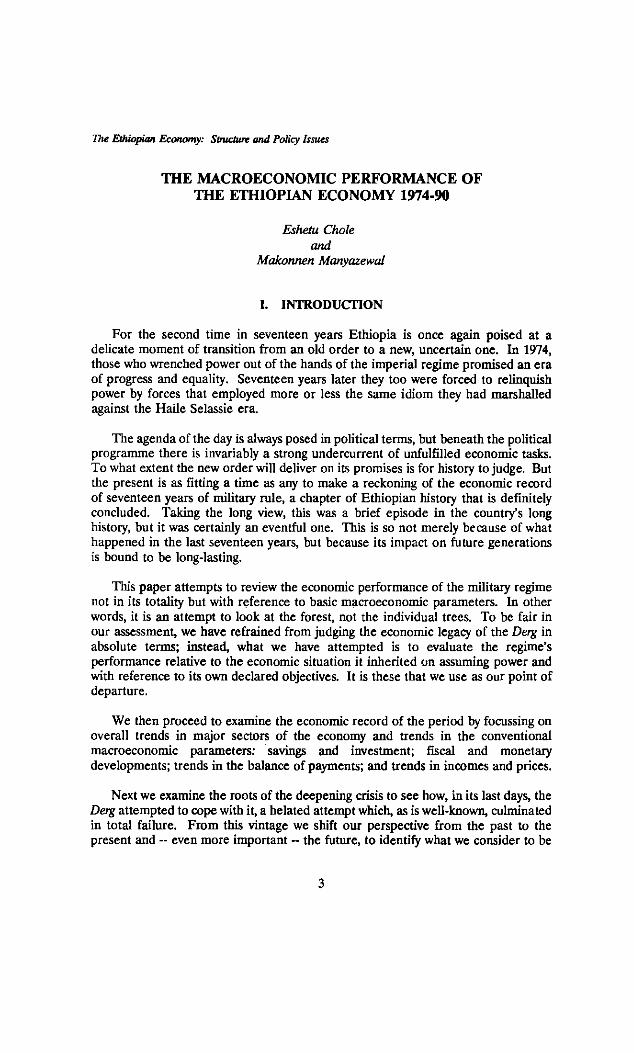
The Ethiopian Economy: Structure and Policy Issues
THE MACROECONOMIC PERFORMANCE OF THE ETHIOPIAN ECONOMY 1974-90
Eshetu Chole and
Makonnen Manyazewal
I. INTRODUCTION
For the second time in seventeen years Ethiopia is once again poised at a delicate moment of transition from an old order to a new, uncertain one. In 1974, those who wrenched power out of the hands of the imperial regime promised an era of progress and equality. Seventeen years later they too were forced to relinquish power by forces that employed more or less the same idiom they had marshalled against the Haile Selassie era.
The agenda of the day is always posed in political terms, but beneath the political programme there is invariably a strong undercurrent of unfulfilled economic tasks. To what extent the new order will deliver on its promises is for history to judge. But the present is as fitting a time as any to make a reckoning of the economic record of seventeen years of military rule, a chapter of Ethiopian history that is definitely concluded. Taking the long view, this was a brief episode in the country's long history, but it was certainly an eventful one. This is so not merely because of what happened in the last seventeen years, but because its impact on future generations is bound to be long-lasting.
This paper attempts to review the economic performance of the military regime not in its totality but with reference to basic macroeconomic parameters. In other words, it is an attempt to look at the forest, not the individual trees. To be fair in our assessment, we have refrained from judging the economic legacy of the Derg in absolute terms; instead, what we have attempted is to evaluate the regime's performance relative to the economic situation it inherited on assuming power and with reference to its own declared objectives. It is these that we use as our point of departure.
We then proceed to examine the economic record of the period by focussing on overall trends in major sectors of the economy and trends in the conventional macroeconomic parameters: savings and investment; fiscal and monetary developments; trends in the balance of payments; and trends in incomes and prices.
Next we examine the roots of the deepening crisis to see how, in its last days, the Derg attempted to cope with it, a belated attempt which, as is well-known, culminated in total failure. From this vintage we shift our perspective from the past to the present and -- even more important — the future, to identify what we consider to be
3
Eshetu Chole & Makonnen Manyazewal: Macroeconomic Performance 1974-1990
the major immediate and long-term development issues the country has to grapple with as it faces the twenty-first century.
II. THE ECONOMY ON THE EVE OF THE REVOLUTION
A. Overall Trends
On the eve of the revolution of February 1974 Ethiopia was in the final year of the implementation of the Third Five Year Plan (TFYP) and wrapping up the preparation of the Fourth Five Year Plan. This section attempts to provide an overview of the macroeconomy during the five years before the revolution.
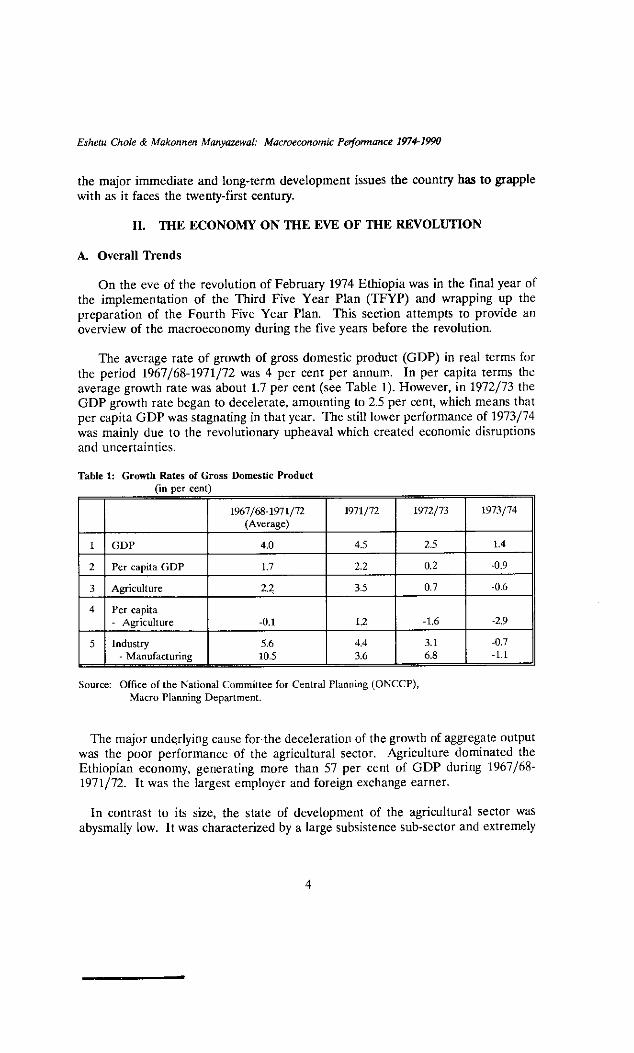
The average rate of growth of gross domestic product (GDP) in real terms for the period 1967/68-1971/72 was 4 per cent per annum. In per capita terms the average growth rate was about 1.7 per cent (see Table 1). However, in 1972/73 the GDP growth rate began to decelerate, amounting to 2.5 per cent, which means that per capita GDP was stagnating in that year. The still lower performance of 1973/74 was mainly due to the revolutionary upheaval which created economic disruptions and uncertainties.
Table 1: Growth Rates of Gross Domestic Product n per cen
1967/68-1971/72 (Average)
1971/72 1972/73 1973/74
1 GDP 4.0 4.5 2.5 1.4
2 Per capita GDP 1.7 2.2 0.2 -0.9
3 Agriculture 2.2 3.5 0.7 -0.6
4 Per capita - Agriculture -0.1 1.2 -1.6 -2.9
5 Industry 5.6 4.4 3.1 -0.7 - Manufacturing 10.5 3.6 6.8 -1.1
Source: Office of the National Committee for Central Planning (ONCCP), Macro Planning Department.
The major underlying cause for: the deceleration of the growth of aggregate output was the poor performance of the agricultural sector. Agriculture dominated the Ethiopian economy, generating more than 57 per cent of GDP during 1967/68-1971/72. It was the largest employer and foreign exchange earner.
In contrast to its size, the state of development of the agricultural sector was abysmally low. It was characterized by a large subsistence sub-sector and extremely
4
The Ethiopian Economy: Structure and Policy Issues
low productivity. These basic features, coupled with backward agricultural practices, an archaic land tenure system and drought, caused agricultural output to stagnate.
Value added in agriculture grew at an average annual rate of 2.2 per cent during 1967/68-1971/72. In per capita terms this translates into an average rate of decline of 0.1 per cent. 1971/72 was an exceptional year for agriculture, and the sector's output grew by a respectable rate of 3.5 per cent. But in 1972/73 growth in agricultural output stagnated, showing a mere 0.7 per cent increase -- thus implying a 1.6 per cent decline in per capita terms. The depressed state of agriculture, aggravated by the drought, continued into 1973/74. During that year, agriculture showed a marginal decline of about 0.6 per cent, but per capita agricultural output declined at a quite sizeable rate of 2.9 per cent.
A great constraint to agricultural development was the archaic land tenure system. It too often left tenants with little incentive to adopt output-increasing technologies. It also limited the majority of farmers to holdings not sufficient enough to fully engage a family for much of the year, while leaving large cultivable areas underutilized. It was obvious that a comprehensive land reform programme was a critical factor in increasing output, employment and income equality in agriculture. This was precisely what was underscored by the Third Five Year Plan of Haile Selassie's government. Although a number of measures had been planned towards land reform, they were repeatedly blocked by Parliament.
The distressed state of agriculture had a serious impact on the dynamics of the industrial sector. True, the industrial sector showed relatively rapid growth during 1967/68-1971/72, its growth rate having averaged about 6 per cent per annum. This was particularly driven by accelerated growth in manufacturing, electricity and water as well as small-scale industries and handicrafts. However, in 1972/73 industrial growth slowed to 3.1 per cent, the main factor being the growing weakness in manufacturing. During 1967/68-1971/72, manufacturing registered a rapid rate of growth, averaging 10.5 per cent per annum. This was primarily based on import substitution. In 1972/73 the growth rate declined to 6.8 per cent.
This situation may be explained by the depressed state of rural incomes, which weakened the stimulus for manufacturing sales. It may also indicate that the easy stage of import substitution had come to a close and that further sustained industrial development largely depended on policies pursued in agriculture, notably in the area of land reform and peasant agriculture.
B. Expenditure on GDP
Aggregate demand at current market prices grew at an average annual rate of 5.7 per cent during 1967/68-1971/72. In 1972/73 its growth rate was 5.5 percent.
Of the components of GDP, total consumption grew at an average annual rate of about 6 per cent during 1967/68-1971/72. This was dominated by private
5
Eshetu Chole & Makonnen Manyazewal: Macroeconomic Performance 1974-1990
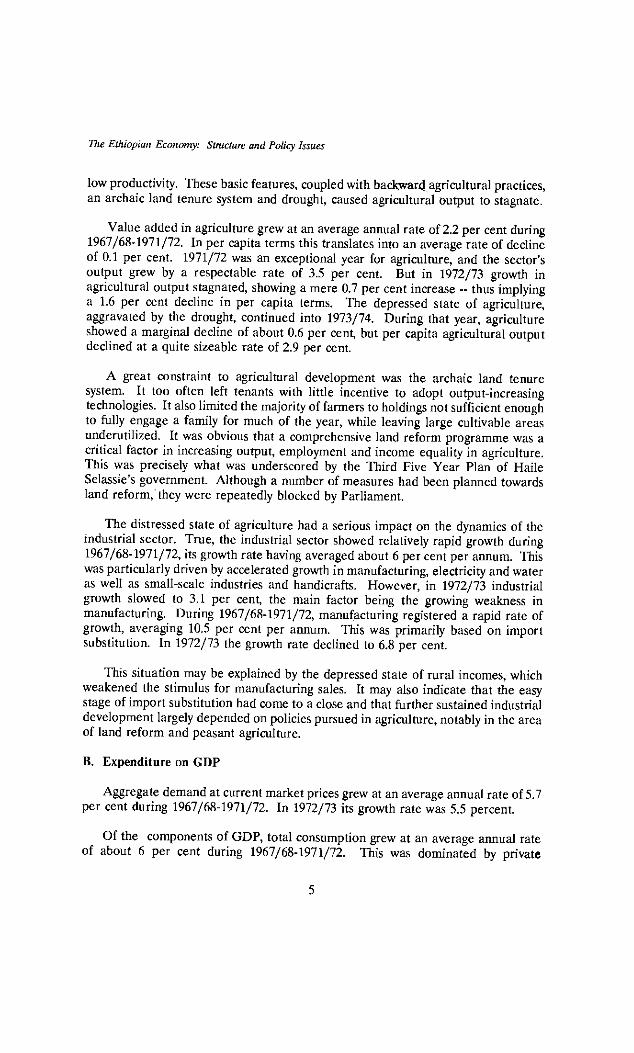
consumption, which accounted for about 79 per cent of GDP (see Table 2). The share of public consumption remained at about 10 per cent during the whole period.
Gross fixed capital formation (GFCF) grew at an average annual rate of 3.3 per cent during 1967/68-1971/72. As a share of GDP, GFCF averaged about 12.6 per cent per annum. In 1972/73 GFCF experienced a decline of 5.6 per cent; its share of GDP declined to 11.3 per cent.
On the financing side, domestic savings grew at an average annual rate of 4.4 per cent during 1967/68-1971/72. As a share of GDP, they averaged 11 per cent. In 1972/73 domestic savings showed positive developments in contrast to GFCF. In that year, domestic savings grew at 30 per cent, and their share in GDP averaged about 13 per cent.
Table 2: Percentage Distribution of GDP at market prices
7/68-1971/72 (Average) 1972/73 1973/74
1 Total consumption 89.0 86.7 87.1
- Private 78.8 76.0 76.6
- Public 10.2 10.7 10.5
2 Gross fixed capital formation
12.6 11.3 9.8
3 Domestic savings 11.0 13.3 12.9
4 Resource balance -1.6 2.0 3.1
5 Exports of goods and non-factor services
10.3 13.0 14.8
6 Imports of goods and non-factor services
11.9 11.0 11.7
Source: ONCCP, Macro Planning Department.
When one compares the developments in GFCF and domestic savings, there is a clear picture that emerges. The resource gap, which averaged 1.6 per cent of GDP during 1967/68-1971/72, moved into surplus during 1972/73 and 1973/74. It reached 2 and 3 per cent of GDP, respectively. This positive development was fueled by the export boom that began in 1972/73.
During 1967/68-1971/72, exports of goods and non-factor services grew at an average rate of 4.7 per cent per year. In 1971/72, 1972/73 and 1973/74 the growth rates were 4.6, 33.2, and 26.7 per cent, respectively. On the other hand, imports of goods and non-factor services, which grew, on average, at 3.4 per cent per annum in 1971/72, declined by 4.5 per cent in 1972/73. In 1973/74, however, they registered
6
The Ethiopian Economy: Sin:caste and Policy Issues
a rapid growth rate of 18.7 per cent. Overall, however, their rate of growth was lower than that of exports and very much reflected the deceleration in GFCF.
As a ratio of GDP, imports of goods and non-factor services averaged 11.9 per cent during 1967/68-1971/72. In 1972/73 their share declined marginally to 11 per cent, while in 1973/74 it rose to 11.7 per cent. The corresponding ratio for exports of goods and non-factor services, on the other hand, showed a contrasting picture. It rose from the period average of 10.3 per cent during 1967/68-1971/72 to 13 and 14.8 per cent in 1972/73 and 1973/74, respectively. As a result, Ethiopia was able to build up her foreign exchange reserves. Import cover (in months) of reserves rose from 6.8 in 1970/71 to 12.9 in 1972/73, and to 16.8 in 1973/74.
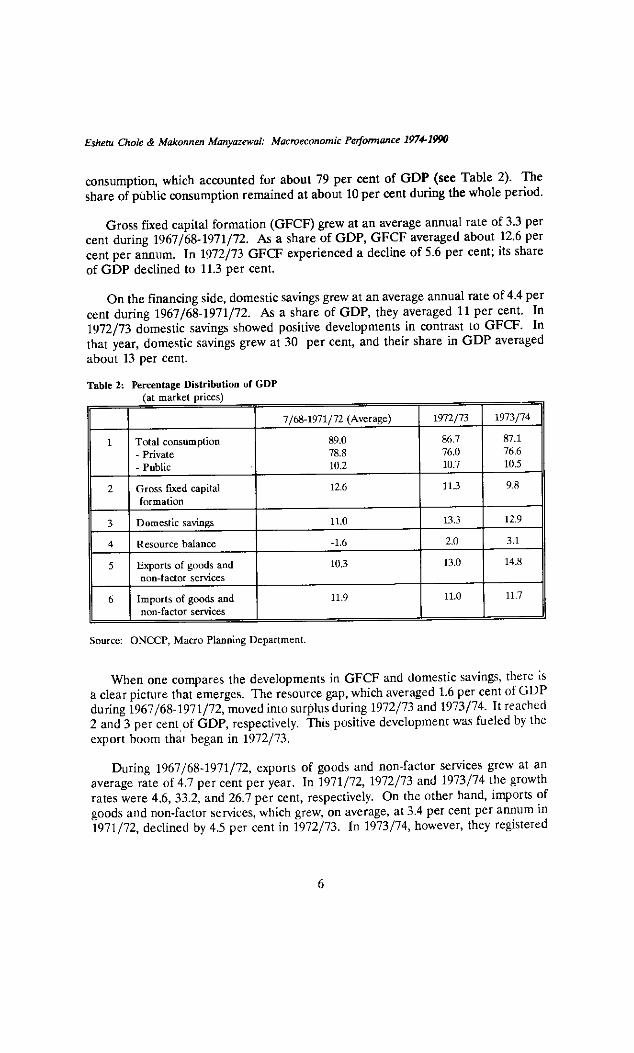
One observation that could be made is that the deceleration in GFCF cannot be explained in terms of domestic savings and balance of payments constraints. This observation is further strengthened by the fiscal operations of the government at the time. One discernible aspect in this regard was the generally low level of domestic bank borrowing. In 1967/68 the share of domestic bank borrowing in GDP was 1.2 per cent. However, in 1972/73 it was a mere 0.2 per cent. In fact, in 1973/74 the government reduced its outstanding debt by repaying. This fiscal stance, in turn, reflects the low level of budget deficits, and hence low capital expenditure.
Table 3: Fiscal Parameters as Ratios of GDP
1967/68 1970/71 1972/73 1973/74 1 Revenue 9.4 9.8 11.1 11.1 2 Recurrent expenditure 11.4 10.7 11.2 10.7 3 Capital expenditure 2.1 2.6 3.0 3.2 4 Overall deficit 4.1 35 3.2 2.8 5 Domestic bank borrowing 1.2 03 0.2 -1.9
6 External financing 2.9 3.2 3.0 2.9
Source ONCCP.
This fiscal stance can be clearly described as overly cautious and shows fiscal conservatism at a time when the world was Keynesian. It meant considerable cost in terms of the growth rate of output, substantially below the growth potential of the economy. In another respect this low level of deficit financing contributed to slow monetary expansion, and hence moderate increases in prices.
One remarkable development in the late 1960s and early 1970s was the apparent existence of price stability, which at least protected the erosion of purchasing power of income. This is observable from the trend in the retail price index for Addis
7
Eshetu Chole & Makonnen Manyazewal: Macroeconomic Performance 1974-1990
Ababa, the only available measure of inflation. The general r tail price index for Addis Ababa showed an average annual growth rate of 0.8 per cent during 1969/70-1972/73. In 1973/74 the trend was reversed. The year experienced a burst of inflationary pressure, most probably triggered by the distressed state of agricultural production. The index for 1973/74 increased by 10.7 per cent over the 1972/73 level.
The general retail index for Addis Ababa is dominated by food. During 1969/70-1972/73 the index for food registered an average decline of 0.1 per cent, thus contributing to price stability during that period. However, this negative trend was discontinued in 1973/74, the change in 1973/74 over the 1972/73 level being about
14 per cent.
To conclude, on the eve of the February 1974 revolution, the state of the Ethiopian economy exhibited respectable moderate rates of growth of GDP and per capita GDP, although it had begun to show signs of deceleration towards the end. Although GFCF showed a decline, the domestic savings ratio was growing and Ethiopia had a comfortable balance of payments position and low inflation.
But the profile of the economy will be incomplete if one does not mention the growing urban unemployment and agrarian crisis which characterized the period. Mention should also be made of the external pressure to which the Ethiopian economy was subjected at the time. The oil price rise of 1973 and the instability in the international monetary system were also critical developments of the period. However, the underlying problem was internal -- i.e., the agrarian crisis.
HI. DEVELOPMENT OBJECTIVES, PRIORITIES AND GOALS OF THE MILITARY GOVERNMENT
A. Early Orientation
The growing agrarian crisis, heightened by the outbreak of famine in 1973/74, and the government's attempt to hide it rather than cope with it, helped release pent up social and political forces that exposed the increasingly eroded social base of the government. Further, the economic pressure generated by the increased oil price also intensified the already heightened social and political contradictions. These forces led to the mass movement of February 1974, which eventually culminated in the seizure of power by the Provisional Military Administrative Council (PMAC), the Derg.
The catch-all motto of the Derg was "Ethiopia Tikdem". The first major step in explaining what it meant and in showing the overall development objectives of the government was the declaration on 20 December 1974 of socialism as the guiding ideology. The formal Declaration stated that "Ethiopia Tikdem" meant equality, self-reliance, the dignity of labor, the supremacy of the common good, and the indivisibility of Ethiopia's unity [PMGE 1974].
8
The Ethiopian Economy: &facture and Policy Issues
In the economic sphere, the Declaration further stated that:
Those resources that are either crucial for economic development or are of such a character that they provide an indispensable service to the community will have to be brought under government control or ownership. Essential economic activities which are not amenable to centralized public management will, though outside the public sector, be subject to public monitoring to ensure that the public interest is properly served. Activitiesan the private sector which are not harmful to the interests of society will be left in private sands in so far as they do not impede the objectives of "Ethiopia Tikdem" [PMGE 1974].
This Declaration was further clarified and strengthened by the Declaration on Economic Policy of Socialist Ethiopia of February 1975. The essence of the Economic Policy was to delineate and indicate economic sectors and activities where the state sector, private sector and foreign capital could invest and operate in the country's economic development.
The government's aims in taking over the commanding heights of the economy were:
1) to ensure that social justice and equity are promoted; 2) to generate more resources required to accelerate economic development for
improving the living standard of the people; and 3) to expedite the construction and the management of the economy through
planning and in a resource allocation system that would ensure a steady progress in economic and social development.
In line with these intentions, the first major economic measure came at the beginning of 1975. All banks, insurance companies, and industrial and commercial firms were nationalized. Then came the Land Reform Proclamation of March 1975, which made all rural land the collective property of the Ethiopian people. At a stroke it terminated feudal relations of agricultural production -- a widely recognized impediment to economic development in Ethiopia. The proclamation called for the formation of Peasant Associations (PM) with provisions for self-administration and the defense of the reforms as well as to ensure mass participation in the development process.
The other measure taken during the first year of the Deg was the nationalization of urban land and extra houses on July 26, 1975. The Urban Land Proclamation allowed each family to retain only a single dwelling for its own occupation and transferred all rented-out houses to the state. Rent reductions were made ranging from 15 to 50 per cent, with the percentage reduction biased in favor of low-income groups, with a view to passing on some of the benefits to them. The Proclamation also called for the establishment of Urban Dwellers Associations (kebeles). The
kebeles were to administer rents below 100 Birr per month and serve as basic units for urban administration and carry out political and local development functions.
9
Eshetu C7wle & Makonnen Manyazewal• Macroeconomic Petformance 1974-1990
During its second year the Deg brought further ideological clarification to the December 1974 Declaration of Socialism. This came with the issuance of the Programme of the National Democratic Revolution (NDR) of April 1976. According to the NDR Programme, the guiding ideology of the government was thenceforth to be Marxism-Leninism. The long-term goal was to be the building of socialist society. Since the NDR was an interim programme for the transition period, its economic programme was meant to create the technical and material foundations for socialism.
The NDR Programme was further clarified and incorporated in the Programme of the Workers Party of Ethiopia (WPE) issued in 1987. The economic objectives of the WPE were:
1) to accelerate the growth of the productive forces so as to build a strong and internally self-sustaining national economy free from the influences of the capitalist market and division of labour;
2) to expand, strengthen and ensure the dominance of socialist production relations with a view to creating a conducive environment for the growth of the productive forces, and to expand socialist economic organization and management in order to realize this;
3) to accelerate, through (1) and (2), sustained growth of the standard of living and cultural well-being of the working people.
The NDR Programme and the Programme of WPE provided broad guidelines for the elaboration of the Ten-Year Perspective Plan (TYPP), which was to cover 1984/85-1993/94. The TYPP provides ample evidence on the long-term development objectives, priorities and goals of the government.
B. Objectives of the Ten-Year Perspective Plan (TYPP)
The major objectives, as stated in the TYPP, were:
a) improving gradually the material and cultural well-being of the people; b) accelerating growth of the economy through the expansion of the country's
productive capacity; c) conserving, exploring, and developing the natural resources of the country; d) expanding and strengthening socialist production relations; e) laying down the basis for the development of national science and technology
capability; f) alleviating social and unemployment problems gradually; g) ensuring balanced and proportional development of all regions.
C. Development Priorities
The TYPP took the development of agriculture as the foundation of the country's economy and industry as the leading sector. This generally indicated the broad development priorities.
10
The Ethiopian Economy: Structure and Policy Issues
Within agriculture, the TYPP envisaged giving priority to: (a) the cooperativization of peasants and the expansion of agricultural extension services; (b) the expansion of irrigated farming which would permit the attainment of dependable and adequate domestic food supplies and enhance export capabilities; (c) raising the quality of livestock through expanded veterinary services; (d) forestry development, soil and water conservation.
Industry was the second priority sector in the TYPP and was expected to play a leading and dominant role in the national economy. Much depends on industrial dynamism to effect structural transformation. But industrial development is, in turn, very much dependent on the capacity of power generation and the state of development of the mining sector. Accordingly, increased power generation, and the exploration and exploitation of mineral resources were the other priority areas stipulated in the TYPP. The development of the mining sector is not only essential for industrial development, but also for export diversification. The TYPP also took the development of science and technology as an area of focus with a view to raising output and productivity in the priority sectors of agriculture and industry, thereby creating domestic science and technology capability.
Another area that was to be given particular attention was the task of improving the lives of the nomadic population. The establishment of farm settlements and cattle-raising cooperatives and locating development projects in border regions were expected to contribute towards improving the well-being of the nomadic people.
D. Major Goals of the Ten-Year Perspective Plan (TYPP)
One of the major goals of the TYPP was the attainment of an average annual growth rate of 6.5 per cent in real GDP. In terms of sectoral growth, agricultural GDP was planned to increase at an average annual rate of 4.3 per cent, industrial GDP at 10.8 per cent, and services GDP at 6.9 per cent.
The sectoral growth targets envisaged in the TYPP were expected to entail considerable structural shift in the economy. The share of agriculture in GDP was to decline from about 48 per cent in 1983/84 to about 39 per cent in 1993/94. In contrast, the share of the industrial sector was to rise from 16 per cent in 1983/84 to about 24 per cent in 1993/94, while the services sector was to grow marginally from about 36 per cent to 37 per cent over the same period.
Other major goals were:
a) attainment of self-sufficiency in food, raising per capita calorie intake from its initial estimated level of 1740 to 2580 by 1993/94;
b) health coverage for 80 per cent of the population by 1993/94; c) provision of safe drinking water to about 46 per cent of the population by the
end of the plan period; d) providing literacy education to 12 million people;
11
Eshetu Ovule & Makonnen Manyazewat Macroeconomic Performance 1974-1990
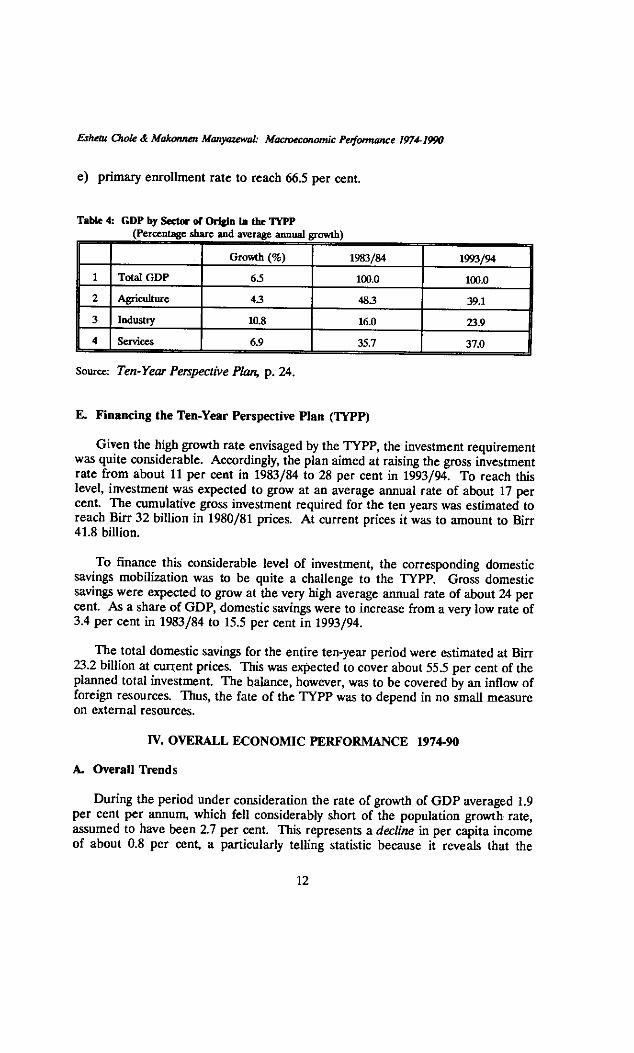
e) primary enrollment rate to reach 66.5 per cent.
Table 4: GDP by Sector of Origin in the TYPP (Percentage share and average annual growth
Growth (%) 1983/84 1993/94
1 Total GDP 6.5 100.0 100.0
2 Agriculture 4.3 483 39.1
3 Industry 10.8 16.0 23.9
4 Services 6.9 35.7 37.0
Source: Ten-Year Perspective Plan, p. 24.
E. Financing the Ten-Year Perspective Plan (TYPP)
Given the high growth rate envisaged by the TYPP, the investment requirement was quite considerable. Accordingly, the plan aimed at raising the gross investment rate from about 11 per cent in 1983/84 to 28 per cent in 1993/94. To reach this level, investment was expected to grow at an average annual rate of about 17 per cent. The cumulative gross investment required for the ten years was estimated to reach Bin 32 billion in 1980/81 prices. At current prices it was to amount to Bin 41.8 billion.
To finance this considerable level of investment, the corresponding domestic savings mobilization was to be quite a challenge to the TYPP. Gross domestic savings were expected to grow at the very high average annual rate of about 24 per cent. As a share of GDP, domestic savings were to increase from a very low rate of 3.4 per cent in 1983/84 to 15.5 per cent in 1993/94.
The total domestic savings for the entire ten-year period were estimated at Bin 23.2 billion at current prices. This was expected to cover about 55.5 per cent of the planned total investment. The balance, however, was to be covered by an inflow of foreign resources. Thus, the fate of the TYPP was to depend in no small measure on external resources.
IV. OVERALL ECONOMIC PERFORMANCE 1974-90
A. Overall Trends
During the period under consideration the rate of growth of GDP averaged 1.9 per cent per annum, which fell considerably short of the population growth rate, assumed to have been 2.7 per cent. This represents a decline in per capita income of about 0.8 per cent, a particularly telling statistic because it reveals that the
12
The Ethiopian Economy: Structure and Policy Issues
standard of living of the average Ethiopian, already one of the lowest in the world, suffered further deterioration during the era of military rule.
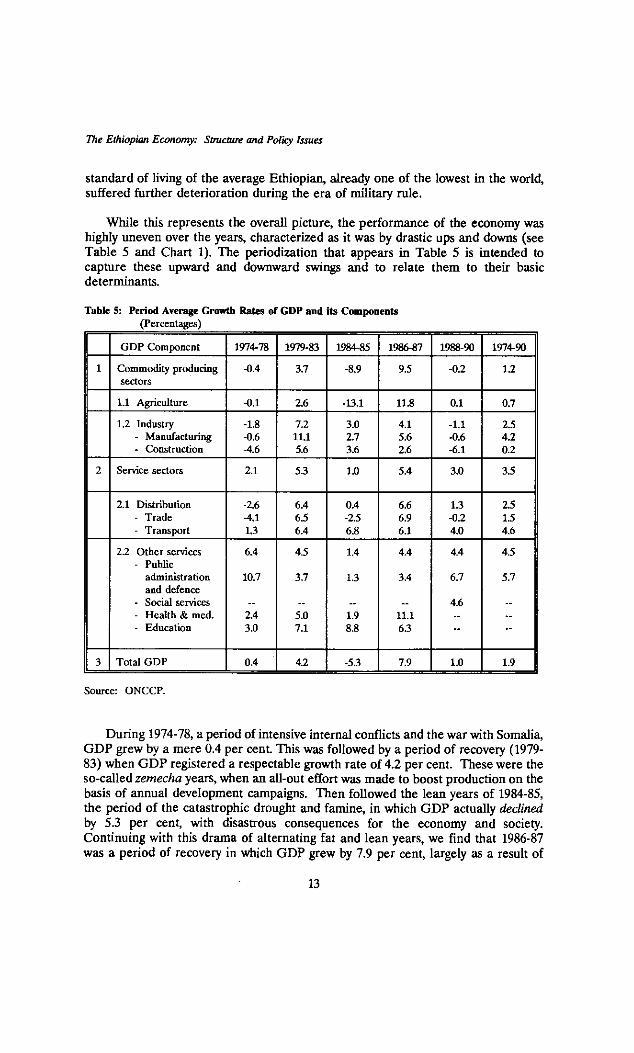
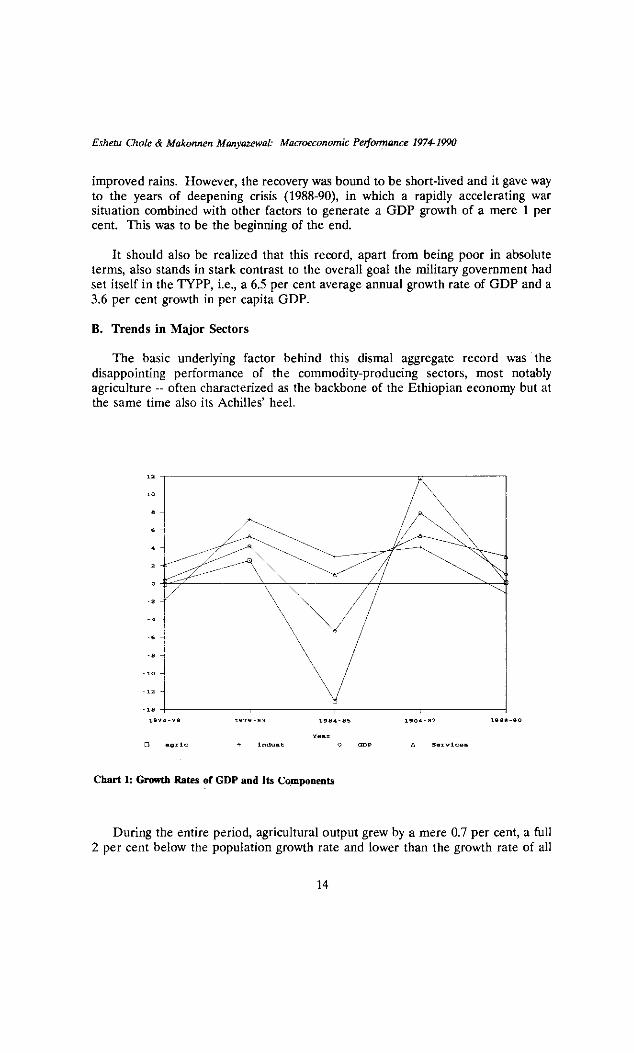
While this represents the overall picture, the performance of the economy was highly uneven over the years, characterized as it was by drastic ups and downs (see Table 5 and Chart 1). The periodization that appears in Table 5 is intended to capture these upward and downward swings and to relate them to their basic determinants.
Table 5: Period Average Growth Rates of GDP and is Components (Percentages)
GDP Component 1974-78 1979-83 1984-85 1986-87 1988-90 197490
1 Commodity producing sectors
-0.4 3.7 -8.9 95 -0.2 1.2
1.1 Agriculture -0.1 2.6 -L3.1 11.8 0.1 0.7
1.2 Industry -1.8 7.2 3.0 4.1 -1.1 2.5 - Manufacturing -0.6 11.1 2.7 5.6 -0.6 4.2 - Construction -4.6 5.6 3.6 2.6 -6.1 0.2
2 Service sectors 2.1 5.3 1.0 5.4 3.0 35
2.1 Distribution -2.6 6.4 0.4 6.6 13 25 - Trade 4.1 6.5 -2.5 6.9 -0.2 1.5 - Transport 1.3 6.4 6.8 6.1 4.0 4.6
2.2 Other services 6.4 4.5 1.4 4.4 4.4 4.5 - Public
administration and defence
10.7 3.7 1.3 3.4 6.7 5.7
- Social services -- -- -- -- 4.6 -- - Health & med. 2.4 5.0 1.9 11.1 -- -- - Education 3.0 7.1 8.8 6.3
3 Total GDP 0.4 4.2 -5.3 7.9 1.0 1.9
Source: ONCCP.
During 1974-78, a period of intensive internal conflicts and the war with Somalia, GDP grew by a mere 0.4 per cent. This was followed by a period of recovery (1979-83) when GDP registered a respectable growth rate of 4.2 per cent. These were the so-called zemecha years, when an all-out effort was made to boost production on the basis of annual development campaigns. Then followed the lean years of 1984-85, the period of the catastrophic drought and famine, in which GDP actually declined by 5.3 per cent, with disastrous consequences for the economy and society. Continuing with this drama of alternating fat and lean years, we find that 1986-87 was a period of recovery in which GDP grew by 7.9 per cent, largely as a result of
13
Eshetu Chole & Makonnen Manyazewal: Macroeconomic Performance 1974-1990
improved rains However, the recovery was bound to be short-lived and it gave way to the years of deepening crisis (1988-90), in which a rapidly accelerating war situation combined with other factors to generate a GDP growth of a mere 1 per cent. This was to be the beginning of the end.
It should also be realized that this record, apart from being poor in absolute terms, also stands in stark contrast to the overall goal the military government had set itself in the TYPP, i.e., a 6.5 per cent average annual growth rate of GDP and a 3.6 per cent growth in per capita GDP.
B. Trends in Major Sectors
The basic underlying factor behind this dismal aggregate record was the disappointing performance of the commodity-producing sectors, most notably agriculture -- often characterized as the backbone of the Ethiopian economy but at the same time also its Achilles' heel.
YOILI
o ears= Indust 0 ma A Service's
Chart 1: Growth Rates of GDP and Its Components
During the entire period, agricultural output grew by a mere 0.7 per cent, a full 2 per cent below the population growth rate and lower than the growth rate of all
14
The Ethiopian Economy: Structure and Policy Issues
other sectors with the exception of construction. As is to be expected, agricultural output was subject to considerable fluctuations, basically following the pattern of rainfall. Thus a drastic fall of 13.1 per cent was registered during the years of the great famine of 1984-85 while the highest growth rate was recorded in the years immediately following the drought. But if this gives the impression of a dramatic boost in agricultural production, the impression is a purely spurious one, since it is a reflection of relative, not absolute performance. Thus, although there was a recovery in 1986-87, output in that year was the lowest in all the ten years since the Deg assumed power. The record of agriculture was therefore one of stagnation and decline.
The performance of industry (here taken to mean manufacturing and construction) was more respectable, but it was confined within perimeters strictly circumscribed by the agricultural sector. The industrial growth rate for our period averaged 2.5 per cent, mostly on account of growth in manufacturing, which was 4.2 per cent. Interestingly, manufacturing output registered negative growth rates at the beginning and end of our period. On the whole, however, its growth pattern closely mirrored that of agriculture, on account of its dependence on the latter for raw materials and foreign exchange, among others. Towards the end of our period, the manufacturing sector was clearly reflecting the adverse impact of war. Thus, output in 1990-91 was lower than what it had been five years earlier. In other words, the overall positive growth rate for the period masks absolute declines in industrial output in the last years of the Derg.
Developments in construction also followed more or less the same pattern, its dubious claim to distinction being that it registered the lowest growth rate of any sector. It is especially revealing that output in this sector in 1990-91 was lower than it had been in 1974-75. The implications of this fact are quite far-reaching, because developments in other sectors are seriously hamstrung by construction capacity. This was especially so in the last years, when most of the country's construction activity was geared to the war effort.
The services on the whole registered a positive growth rate of 3.5 per cent, but this hides considerable variation between sub-sectors. Not surprisingly, the highest rate of growth (5.7 per cent) was registered by public administration and defence, again the highest figures being for the beginning and end of the period, when war expenditure was inordinately high. Another factor is the sprawling government bureaucracy, which, given its essentially unproductive character, had become a millstone round the neck of the economy.
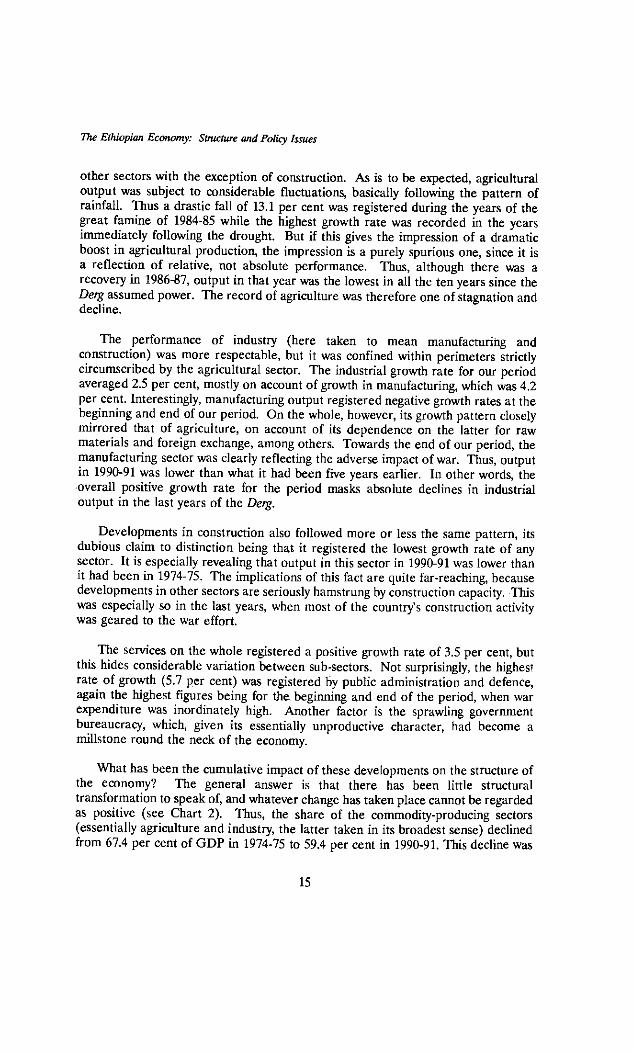
What has been the cumulative impact of these developments on the structure of the economy? The general answer is that there has been little structural transformation to speak of, and whatever change has taken place cannot be regarded as positive (see Chart 2). Thus, the share of the commodity-producing sectors (essentially agriculture and industry, the latter taken in its broadest sense) declined from 67.4 per cent of GDP in 1974-75 to 59.4 per cent in 1990-91. This decline was
15
&helm Chile & Makonnen Manyazewal: Macroeconomic Performance 19741990
matched by an equal rise in the share of services, of which fully half was accounted for by public administration and defence.
Agriculture 43.4%
Agriculture 15.1%
1973/74
Chart 2: GDP Structure, 1973/74 and 1989/90
The share of agriculture declined from 52.5 per cent to 43.6 per cent, but again this is no indication of structural transformation. To begin with, it is interesting that the share of this sector, which had reached an all-time low of 41 per cent in 1984-85, had been steadily rising since then. Secondly and more importantly, the share of industry rose by only 0.9 per cent in seventeen years and it actually declined in the last five years. In other words, changes in the structure of GDP were not related to the kind of structural transformation that has been historically associated with industrialization.
C. Trends in Savings and Investment
From a pre-revolution figure of 13 per cent, Ethiopia's saving rate steadily declined during the Dog era, averaging about 4 per cent in the last years, one of the lowest saving efforts in the entire world.'
This decline is a reflection of the dramatic increase in government consumption during the period, rising from an average of 14.7 per cent of GDP during 1974-78 to 25.2 per cent during 1988-90 (see Table 6). As stated earlier, this is due to drastic increases in military spending and a vastly expanded government bureaucracy. Parallel with the rise in government consumption, there has been a decline in private consumption from 79.8 per cent of GDP during 1974-78 to 70.8 per cent during 1988-90. In other words, what has taken place is not a rise in the share of total consumption but a significant change in its composition.
The combination of a slow growth of GDP and a pronounced increase in government consumption triggered a steady decline in government saving, which was
16
The Ethiopian Economy: Structure and Policy Issues
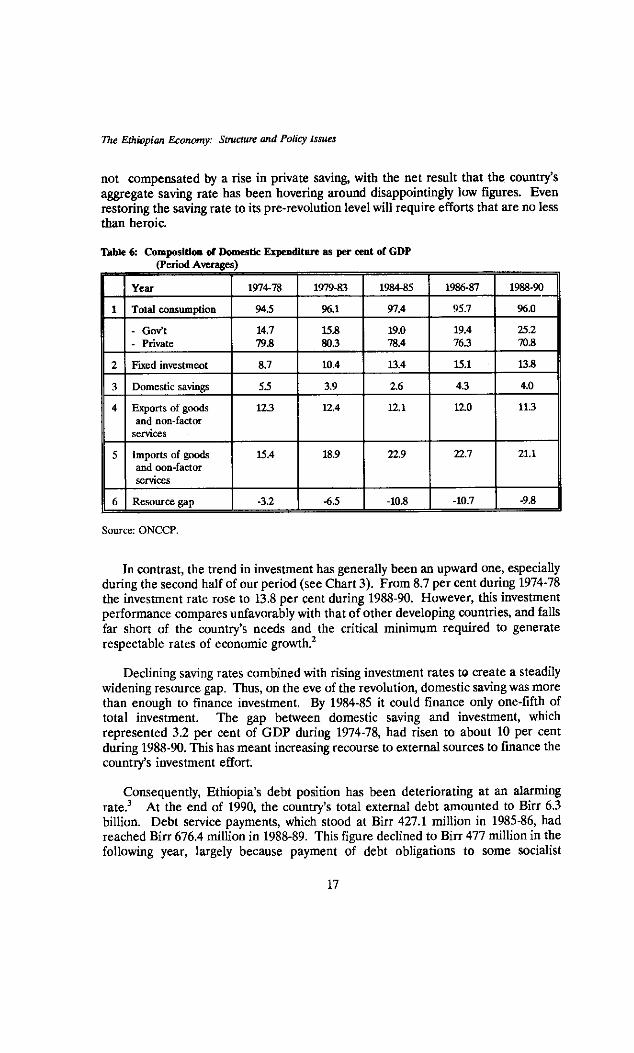
not compensated by a rise in private saving, with the net result that the country's aggregate saving rate has been hovering around disappointingly low figures. Even restoring the saving rate to its pre-revolution level will require efforts that are no less than heroic.
Table 6: Composition of Domestic Expenditure as per cent or GDP (Period Averages)
Year 1974-78 1979-83 1984-85 1986-87 1988-90
1 Total consumption 945 96.1 97.4 95.7 96.0
- Gov't - Private
14.7 79.8
15.8 80.3
19.0 78A
19.4 76.3
25.2 70.8
2 Fixed investment 8.7 10.4 13.4 15.1 13.8
3 Domestic savings 55 3.9 2.6 4.3 4.0
4 Exports of goods and non-factor
services
12.3 12.4 12.1 12.0 11.3
5 Imports of goods and non-factor services
15.4 18.9 22.9 22.7 21.1
6 Resource gap -3.2 -65 -10.8 -10.7 -9.8
Source: ONCCP.
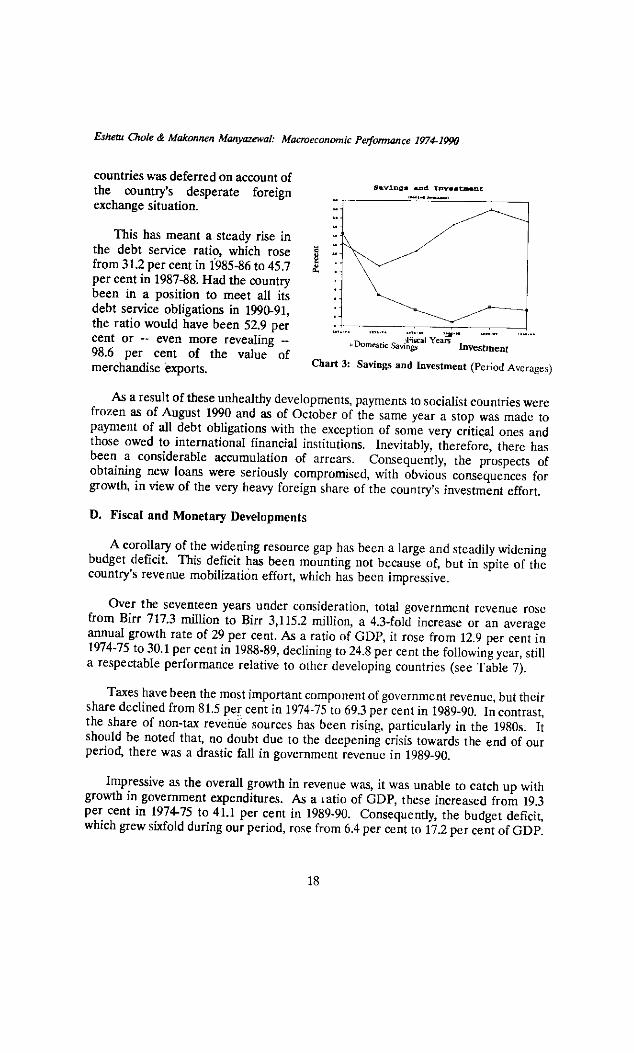
In contrast, the trend in investment has generally been an upward one, especially during the second half of our period (see Chart 3). From 8.7 per cent during 1974-78 the investment rate rose to 13.8 per cent during 1988-90. However, this investment performance compares unfavorably with that of other developing countries, and falls far short of the country's needs and the critical minimum required to generate respectable rates of economic growth?
Declining saving rates combined with rising investment rates to create a steadily widening resource gap. Thus, on the eve of the revolution, domestic saving was more than enough to finance investment. By 1984-85 it could finance only one-fifth of total investment. The gap between domestic saving and investment, which represented 3.2 per cent of GDP during 1974-78, had risen to about 10 per cent during 1988-90. This has meant increasing recourse to external sources to finance the country's investment effort.
Consequently, Ethiopia's debt position has been deteriorating at an alarming rate.3 At the end of 1990, the country's total external debt amounted to Birr 6.3 billion. Debt service payments, which stood at Bin 427.1 million in 1985-86, had reached Birr 676.4 million in 1988-89. This figure declined to Birr 477 million in the following year, largely because payment of debt obligations to some socialist
17
Eshelli Chole & Makonnen Manyazewal• Macroeconomic Performance 1974-1990
countries was deferred on account of the country's desperate foreign exchange situation.
This has meant a steady rise in the debt service ratio, which rose from 31.2 per cent in 1985-86 to 45.7 per cent in 1987-88. Had the country been in a position to meet all its debt service obligations in 1990-91, the ratio would have been 52.9 per cent or -- even more revealing --98.6 per cent of the value of merchandise exports.
Saving, and Innstact
.Domestic Savir Years.Investment
Chart 3: Savings and Investment (Period Averages)
As a result of these unhealthy developments, payments to socialist countries were frozen as of August 1990 and as of October of the same year a stop was made to payment of all debt obligations with the exception of some very critical ones and those owed to international financial institutions. Inevitably, therefore, there has been a considerable accumulation of arrears. Consequently, the prospects of obtaining new loans were seriously compromised, with obvious consequences for growth, in view of the very heavy foreign share of the country's investment effort.
D. Fiscal and Monetary Developments
A corollary of the widening resource gap has been a large and steadily widening budget deficit. This deficit has been mounting not because of, but in spite of the country's revenue mobilization effort, which has been impressive.
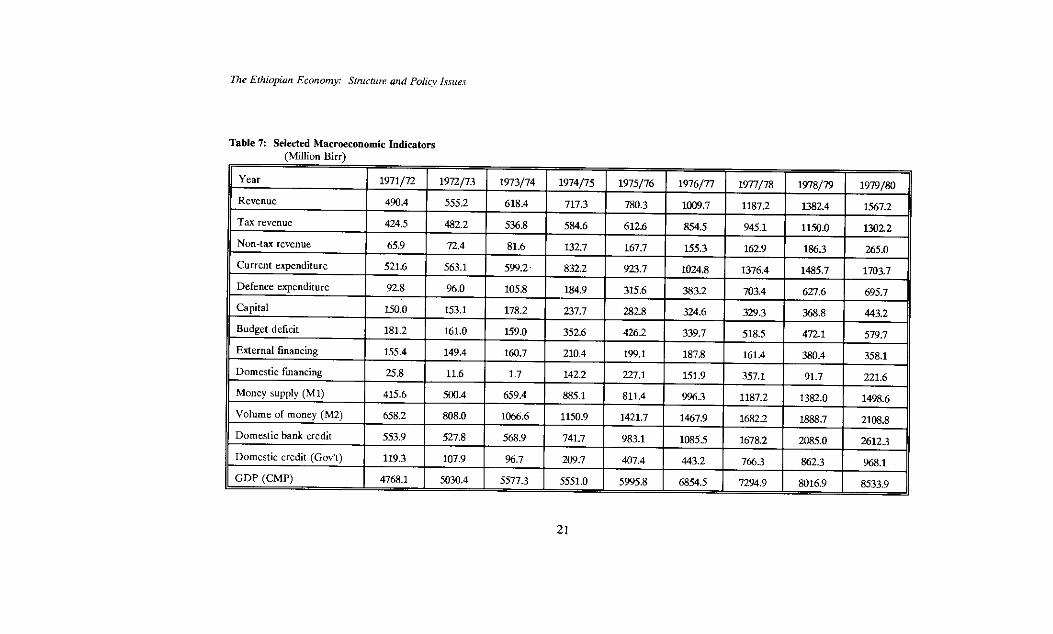
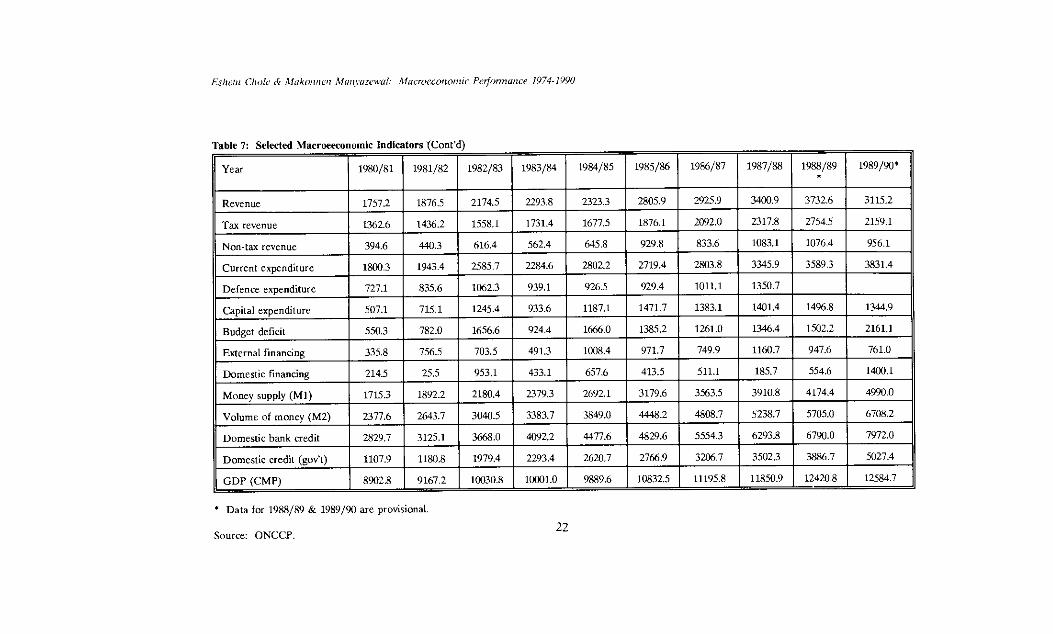
Over the seventeen years under consideration, total government revenue rose from Birr 717.3 million to Birr 3,115.2 million, a 4.3-fold increase or an average annual growth rate of 29 per cent. As a ratio of GDP, it rose from 12.9 per cent in 1974-75 to 30.1 per cent in 1988-89, declining to 24.8 per cent the following year, still a respectable performance relative to other developing countries (see Table 7).
Taxes have been the most important component of government revenue, but their share declined from 81.5 per cent in 1974-75 to 69.3 per cent in 1989-90. In contrast, the share of non-tax revenue sources has been rising, particularly in the 1980s. It should be noted that, no doubt due to the deepening crisis towards the end of our period, there was a drastic fall in government revenue in 1989-90.
Impressive as the overall growth in revenue was, it was unable to catch up with growth in government expenditures. As a ratio of GDP, these increased from 19.3 per cent in 1974-75 to 41.1 per cent in 1989-90. Consequently, the budget deficit, which grew sixfold during our period, rose from 6.4 per cent to 17.2 per cent of GDP.
18
Die Ethiopian Economy: Structure and Policy Issues
How drastic this development was can be seen from the fact that on the eve of the revolution the budget deficit represented merely 2.9 per cent of GDP.
Both current and capital expenditure have had their share to contribute to this alarming development. The share of current expenditure in GDP doubled from 15 per cent to 30.4 per cent, far out of pace of the growth rates of revenue and GDP. Military spending, the major explanatory variable for this development, rose from 3.3 per cent of GDP in 1974-75 to 11.4 per cent in 1987-88.
The rise in capital expenditure was also considerable; its share in GDP increased from 4.3 per cent to 10.7 per cent, having reached a peak of 13.6 per cent in 1985-86. There have, however, been sectoral variations. Mining, industry and transportation seem to have been major beneficiaries, but the share of agriculture declined from 33.4 per cent in 1974-75 to 23.3 per cent in 1987-88. The axe has also clearly fallen on social development; the shares of education and health at the end of the period were less than what they were at the beginning.
How was the budget deficit financed? On the average 59 per cent of it was financed by external sources, but their role had been rising in the last years, reaching a peak of 86 per cent in 1987-88. There was a dramatic reversal in 1989-90, when the share of external sources plummeted to 35 per cent, presumably reflecting a drying up of external finance in the last years of the Derg. Domestic deficit financing mainly took the form of borrowing from the banking system, leading to a drastic increase in money supply.
From 1974-75 to 1989-90 the increase in money supply was 5.6-fold for Ml and 5.8-fold for M2, and their shares in GDP rose from 15.9 per cent to 39.7 per cent, and from 20.7 per cent to 53.3 per cent, respectively. These rates of growth were much faster than that of GDP.
The major factor behind this growth was the unprecedented expansion in domestic bank credit, which increased almost elevenfold during our period, rising from a mere 13.4 per cent of GDP to 63.3 per cent in seventeen years. And this expansion was in turn largely triggered by a 24-fold increase in the government's share of total domestic credit. This share increased from 28.3 per cent in 1974-75 to 63.1 per cent in 1989-90; in absolute terms, it increased from Birr 209.7 million to Birr 5,027.4 million, an unhealthy development in view of the sluggish rate of growth of production.
Not surprisingly, therefore, this has had inflationary consequences, albeit on a much smaller scale than in other similarly placed countries. A stagnant economy, coupled with growing deficit financing from the National Bank, would be expected to generate quite forceful inflationary pressures in the economy. But this has not been so, particularly when compared to inflationary pressures in other African countries. The average annual rate of inflation (as measured by the implicit GDP
19
Eshetu Chole & Makonnen Manyazewal: Macroeconomic Pylon:once 1974-1990
deflator) for sub-Saharan Africa was 19 per cent during 1980-89. For Latin America and the Carribean the inflation rate was 160.7 per cent during the same period.
What, then, were the countervailing forces that helped dampen inflationary pressures in Ethiopia? One can identify the following major factors, among others: i) a steady growth of the money-to-GDP ratio, or inversely the decline of the velocity of circulation of money, known as "monetary deepening"; ii) limits on private sector activities which lessened the sector's credit demand -- leading to 'forced saving'; and iii) growth in saving deposits, partly effected through bank branch expansion [World Bank 1990; Tekle Birhan 1990; ONCCP/ SAATA 1991]. This situation is untenable and harbours potential policy problems in the light of any economic reform programme that may be contemplated. The latent massive inflationary pressures and the lifting of restrictions on the private sector are bound to end the government's easy access to finance its deficit.
E. Trends in the Balance of Payments
In view of the developments reviewed thus far, it is not surprising that the state of the balance of payments has not been healthy. On the eve of the revolution (1973-74) the country had a positive trade balance of Birr 76 million. In every year since then, the balance has been not only negative but also widening, reaching a peak of Bin 1.5 billion in 1987-88.
The major reason for this development has been the very fast growth in imports (largely dominated by fuel and capital goods) in the face of a sluggish growth in export earnings, itself caused by stagnation or decline in the volume of exports and low prices for some of the major export commodities.
In contrast, the services component of the current account has been showing a positive balance, in large part due to the operations of Ethiopian Airlines. Still, the current account balance has been consistently negative, with the exception of 1985-86, when a generous inflow of resources on account of the 1984-85 famine resulted in a positive balance.
A major means of financing the deficit has been public borrowing abroad supplemented by drawing down on foreign exchange reserves. Consequently, the country's debt position has been deteriorating and its import cover drastically declining. In 1973-74 the country had 16.8 months of import cover; by 1989-90 this had dwindled to 0.3 months. In these circumstances, availability of foreign exchange had become a very serious bottleneck, with severe consequences for all sectors of the economy.
20
The Ethiopian Economy: Structure and Policy Issues
8
'----
Fr,
N
N:
N
a No
t-- ri . r_ ,_, h
., .
443.2 II
N
r-- sn
358.1 11
VD tgi
N
CC)
71;*
CIQ 8
Fl
en .2. A
Ni
8533.9
R
-----
ke
.d. N
Q
0
V
I "-i
m
N. V
I
4
627.6
00 --.
380.4
..4 C■
1382.0
N
N.
gi
c
A
m
N
c.:
8
00 N
i-- NI T
----,..
N
,„
945.1
ct
'-' rt°_,
'r.
c
n
703.4
329.3
m
co wo
-a -I c
m m
N
trn m
1187.2 I
N
NI
1678.2 I
7294.9
R
-, 82 a,
.-.
r--: §
el
in 't n
en 2) , °C.' N
.
- N
c
g
m
339.7 I
coo .
c
m
m
§ cr: 4
V
l
443.2
6854.5 [
c
N
re, r-- c
m
w
N
2. v:. rr c
167.7
923.7
.0: n en
00 h.
N
A rt
., 8
,„
227.1 I
-1-
°° r-
rt 11;
983.1
ri: q
c9; &
rn Nri- r-- c
(--- ' - 4 r--
M 584.6
N
N
M
832.2
c
/
m
N
1--- n
c
N
Tr,
V
NO
r4
142.2
6:8'
c: tn
' ,
0
r- C
r r-
209.7 [
5551.0
rt --,. r-- cr. r-4
,r m
c c
c
kr)
c
oo el rr-)
00
o
m
178.2
Q
Fp, 74
h
o
;L-' ,4
659.4 1
'Z''
g
Ci:
tro
N
8
n
r- cr7-. m
1972/73
N vc
,r, tri
482.2
72.4
„
ri c
..-, o
0 ,, ,5
,
in ,...i
a
c ,
149.4 I
c
,-. 'tr
8
in O
co cr, 00
527.8
a r- c. ,-.
rr 4
c, ..,
N
r-- --..... c
P
1-1
rr 8
yr-
424.5
ct ,r; c
'0 -■
et Lei
92.8 . cl c3 in
er --; co
rt vi m
m
25.8
'A ,-, ,--1 rt
N
rec V
i c
c: re) rn
m
rl cc NI I-I
Year
Revenue
Tax revenue
Non-tax revenue
Current expenditure
Defence expenditure
Capital
Budget deficit
External financing
Domestic financing
Money supply (Ml)
Volume of money (M2)
Domestic bank credit
Domestic credit (Gov't)
GDP (CMP)
Eshetu Chafe cF Makom
-0 0 0
0
7
en
Source: ONCCP.
Data for 1988/89 & 1989/90 are provisional.
.
C,
0
0
.0,
T-I
8
in ‘-i In
-
0:
.-i tcc
,
,6
V)
a,
-0, — m
A
1344.9 II
^
.0
1-,
N
0
.-4 a.
r-
4990.0
nc
c
N.
..0
7972.0 II
N
N
CD
00
12584.7 II
0, *
,
3732.6
,....
2754.5 00
r-
cc -
oo
vc e
n
'11. , N
n
i to
tr, „
.0.
N.
".
o,
.0
4
v,
kr)
4174.4
5705.0
C
F
r-
N.
1
m
R
2317.8
1083.1
A
1350.7 4
N
185.7
c N
0
3502.3
cot0mm
r-
oo
__ 0
en a. ,
ol.
n 0,
N
CD
—
N
en en CO
2803.8
-
_
..a
1383.1
._ A -
c,, iee N
"4 —i
4-2 0, ;;ir,i e
n
4808.7
en
Ai. iin in
8
N
en
h
oo
m
,_, ,
Vl
x
ON
‘-i
o:
v,
C.
•-c
,6
N
oc .-1
929.8
2719.4 I
929.4
1471.7
N
in
,--.
t-- ,..;, r- a
td,
ri
—. „I.
0̀
co; .."-, ri
N i ‘0
o,
NI 4
0:
s
r- N
vl
N
al
oo o
tr) 0
0
-...., ,
en C
a .-.
2323.3
V)
tc ,
iir •-■
00
,,-;
A
N
N
0
A
kr,
,
0, N
,,-;
-1
0, 0
. §
"1:
oo 8
657.6
,
0
.0 N
3849.0
4477.6 N:
a
't
wc.' m
0,
1983/84
2293.8
1731.4
at
ai
.0
v-)
2284.6
o:
en
o
•
933.6
e
4
V
491.3
r.e.;
.ven
M
0-:
m
N
N C
l e
n
oo
en
e
n
ni
N
o•
N
N
m
00
--..., a
l en 0 ,
2174.5
,
36
tfl m
-
e
,0 ,
0
Cl vi
CO
n
rel
N
8
-
1245.4
‘q
VZ
in 0 —
703.5
953.1
2180.4
Vi
0
en
g
1979.4
CC C
ra
8
N
co
--..... ,
0. 0, -
1876.5
Cl
.,i a
)
i 't
rd
. -a
... -
835.6
1-4 tri - ,
782.0
V)
.6 C
r , 111
n
1892.2
2CA3.7
Cl
Cr
N
-
rn
CO
c
oo, "
N
N
,c, -
0.,
-
00 ....,
8
0
-
1757.2
00 0; -
‘q
0, e
n
,,i. M
-
727.1 I
'-'
ei.: 0
Cr
Ci
0
in C
r C
C
in m
m
214.5
Cl „, —i r-
-
‘q ,
ti- n
2829.7
C, N
0
—i -
00
ai
8 .
Revenue
Tax revenue
Non-tax revenue
Current expenditure
Defence expenditure
Capital expenditure
Budget deficit
External financing
Domestic financing
Money supply (MI)
Volume of money (M2)
Domestic bank credit
Domestic credit (gov't)
E... 2
Q
0. (7
The Ethiopian Economy: Stmcture and Policy Issues
F. Trends in Incomes and Prices
The woefully inadequate data make it difficult to undertake any meaningful discussion of this crucial topic. But an attempt has been made to piece together whatever information is available to draw some general conclusions.
As shown in the discussion of the overall trends of the economy, in the last seventeen years per capita income has, on average, shown a decline. This means that the living conditions of the people have been deteriorating. Another indicator which lends support to this observation is the state of food availability. In terms of minimum daily calorie requirements, per capita food availability declined from about 82 per cent during 1979/80-1981/82 to 75 per cent during 1986/87-1988/89 [World Bank 1990].
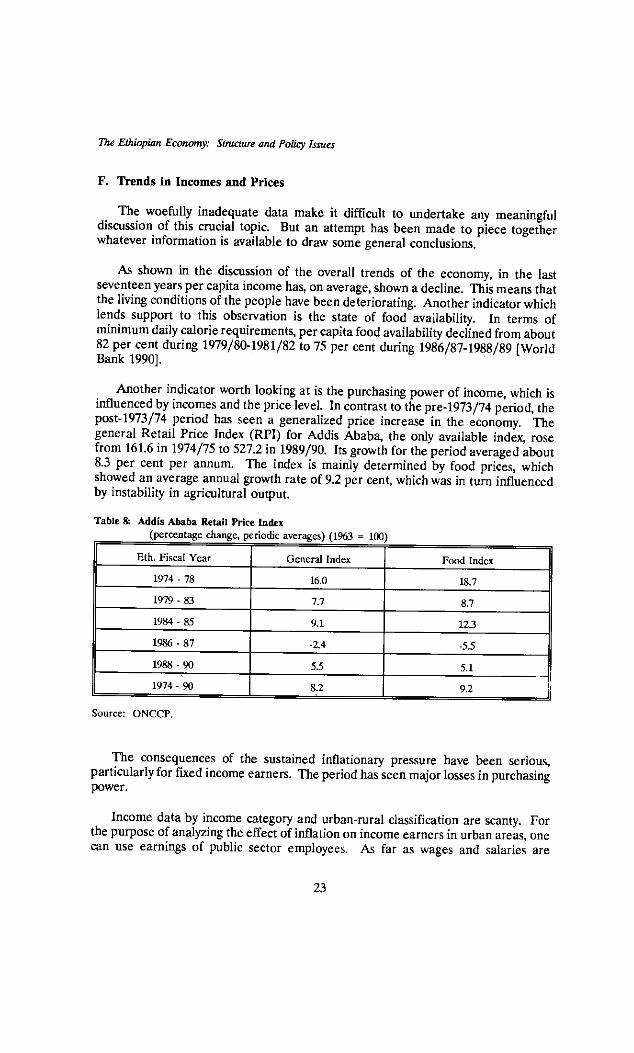
Mother indicator worth looking at is the purchasing power of income, which is influenced by incomes and the price level. In contrast to the pre-1973/74 period, the post-1973/74 period has seen a generalized price increase in the economy. The general Retail Price Index (RPI) for Addis Ababa, the only available index, rose from 161.6 in 1974/75 to 527.2 in 1989/90. Its growth for the period averaged about 8.3 per cent per annum. The index is mainly determined by food prices, which showed an average annual growth rate of 9.2 per cent, which was in turn influenced by instability in agricultural output.
Table 8: Addis Ababa Retail Price Index (percentage change, periodic averages) (1963 = 100
Eth. Fiscal Year General Index Food Index
1974 - 78 16.0 18.7
1979 - 83 7.7 8.7
1984 - 85 9.1 12.3
1986 - 87 -2.4 -5.5
1988 -90 53 5.1
1974 - 90 8.2 9.2
Source: ONCCP.
The consequences of the sustained inflationary pressure have been serious, particularly for fixed income earners. The period has seen major losses in purchasing power.
Income data by income category and urban-rural classification are scanty. For the purpose of analyzing the effect of inflation on income earners in urban areas, one can use earnings of public sector employees. As far as wages and salaries are
23
Eshetu Chole & Makonnen Manyazewal: Macroeconomic Performance 1974-1990
concerned, the government raised the minimum wage from Bin 25 to Birr 50 per month, setting a two-year wage increase for central government employees earning up to Birr 636 per month. A salary freeze has been in effect since 1975/76 above the cut-off point of Birr 636. For employees of public enterprises the salary freeze affects those that earn above Birr 650 per month. The wage and salary increment for those earning below this cut-off point has been governed by what is usually referred to as the 5+ 1+ 1 formula. If output increases, compared to the previous year, employees receive a 5 per cent increase; if productivity and profitability increase they receive a 1 per cent increase for each. Generally, this has been governed by collective agreements.
Given that the Addis Ababa RPI showed an 8.3 per cent average annual growth rate since 1974/75, the real incomes of central government employees who were still getting below Bin 636 by 1990, have shown, on the average, a decline of 4.3 per cent per year [Telde Birhan 1990]. Those earning above Birr 636 have been exposed to the full effect of inflation. True, there are some who have mitigated the effect of inflation through promotion and other modalities for salary increase. By and large, however, the basic conclusion that fixed income earners have sustained considerable declines in real incomes holds.
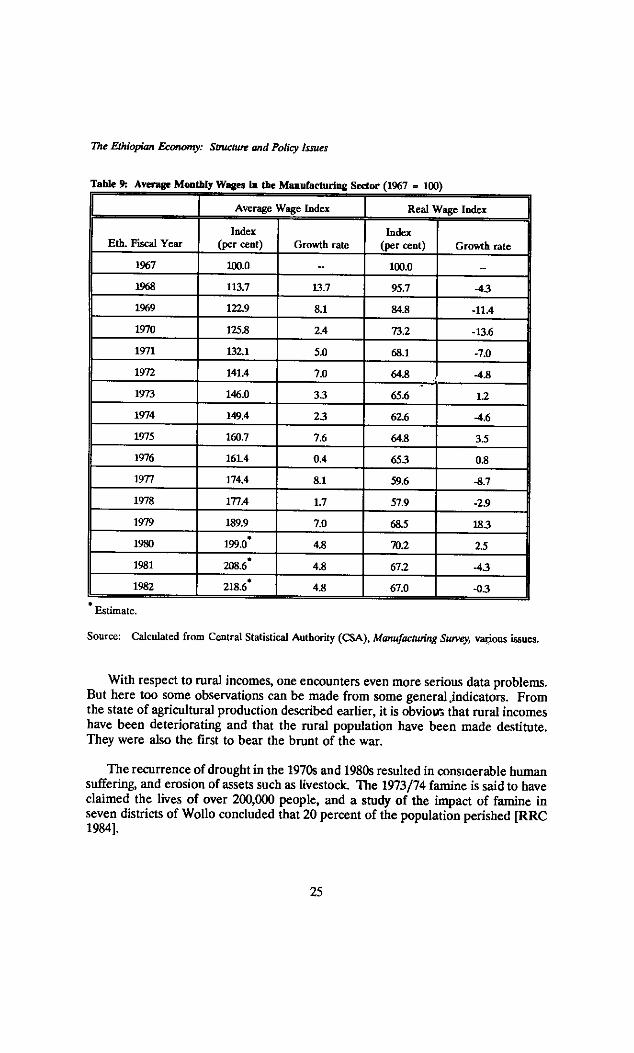
This is further corroborated by the state of real incomes in the manufacturing sector, whose employees have generally received increments every year. In nominal terms, the average wage index for employees of the sector has shown an average annual growth rate of about 5.4 per cent since 1974/75. In real terms (using the Addis Ababa RPI as a deflator), however, average wages in the manufacturing sector declined by about 33 per cent during 1974/75-1989/90. In 1989/90 the index of average industrial wages (1975=-100) amounted to 67. As a very crude estimate, this indicates that average urban real incomes and consumption levels must have fallen quite seriously.
In addition, over the years the government has been collecting funds in many ways to finance drought relief, and military and other emergencies, which amounts to a significant reduction in urban incomes and consumption. Further, income tax as well as indirect tax rates have been repeatedly increased, putting additional pressure on incomes.
One may argue that people get some of their consumption goods from kebele shops and government-run supermarkets at controlled prices, thus mitigating the decline in incomes. True, this does contribute to offsetting some of the inflationary pressure on income. However, given the usual unavailability of goods at the time and in the amount required at these shops, and given that quite a significant volume of these goods is smuggled out to the free market, one cannot argue that government-controlled prices have fully offset the effect of inflation on incomes. Thus, the basic observation that the years of Derg rule have seen a serious erosion of urban real incomes remains valid.
24
The Ethiopian Economy: Structure and Policy Issues
Table 9: Average Monthly Wages In the Manufacturing Sector (1967 = 100
r Average Wage Index Real Wage Index
Eth. Fiscal Year Index
(per cent) Growth rate Index
(per cent) Growth rate
1967 100.0 -- 100.0 --
1968 1117 13.7 95.7 -43
1969 122.9 8.1 84.8 -11.4
1970 125 8 2.4 73.2 -13.6
1971 132.1 5.0 68.1 -7.0
1972 141.4 7.0 64.8 -4.8
1973 146.0 33 65.6 1.2
1974 149.4 23 62.6 -4.6
1975 160.7 7.6 64.8 35
1976 161.4 0.4 653 0.8
1977 174.4 8.1 59.6 -8.7
1978 177.4 1.7 57.9 -2.9
1979 189.9 7.0 683 183
1980 199.0 4.8 702 25
1981 •
208.6 4.8 672 -43
1982 •
218.6 4.8 67.0 -03
Estimate.
Source: Calculated from Central Statistical Authority (CSA), Manufacturing Survey, various issues.
With respect to rural incomes, one encounters even more serious data problems. But here too some observations can be made from some general ,indicators. From the state of agricultural production described earlier, it is obviou; that rural incomes have been deteriorating and that the rural population have been made destitute. They were also the first to bear the brunt of the war.
The recurrence of drought in the 1970s and 1980s resulted in consmerable human suffering, and erosion of assets such as livestock. The 1973/74 famine is said to have claimed the lives of over 200,000 people, and a study of the impact of famine in seven districts of Wollo concluded that 20 percent of the population perished [RRC 1984].
25
Eshetu Chole & Makonnen Manyazewal: Macroeconomic Performance 1974-1990
The great drought of 1984/85 and the consequent famine affected nearly 8 million people. It is estimated that one million people may have died as a result of famine. The repeated famines have left the rural population destitute and eroded their capacity to withstand future crises.
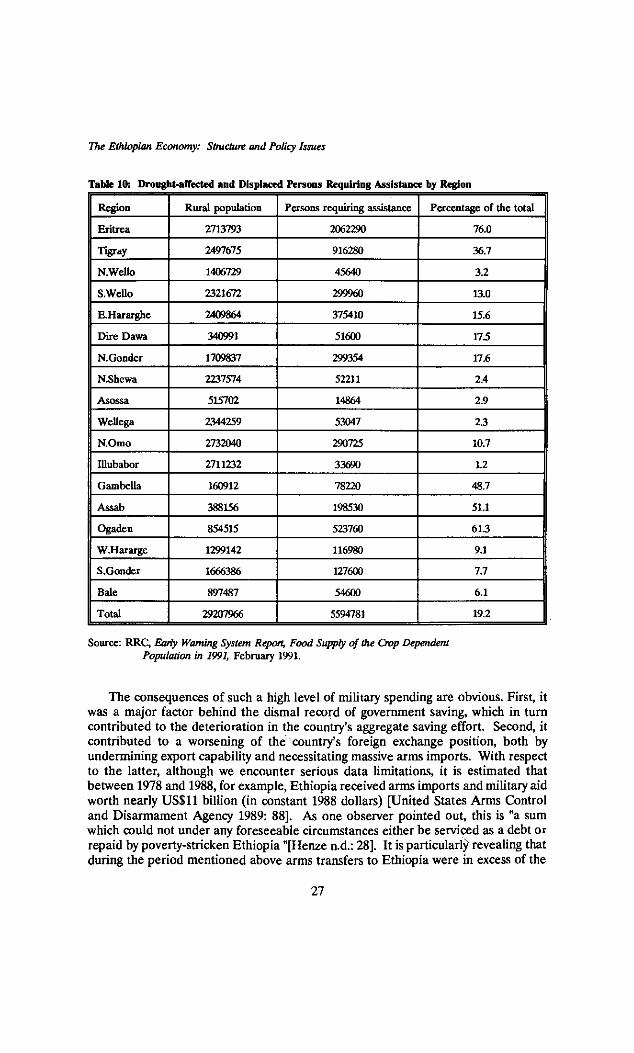
Although not of the scale and intensity of the 1984/85 drought, the country is still facing drought and famine, as Table 10 clearly shows. The Relief and Rehabilitation Commission (RRC) estimates that drought-affected and displaced persons in 1991 are 5.6 million, or 19 per cent of the rural population. What is telling of the depth of rural destitution is the yearly recurrence of drought before the population recovers from the crisis of earlier droughts. In the end, what one should realize is that the statistics do not tell the full depth of the misery of the Ethiopian people, in both urban and rural areas.
V. THE ROOTS OF THE DEEPENING CRISIS
We now turn to an examination of the underlying causes of this deep malaise which culminated in paralyzing the Ethiopian economy and in driving it to the edge of the precipice. Because these factors are closely intertwined and hence mutually reinforcing, they must be viewed as components of a single reality. However, for the sake of analytical convenience, they need to be addressed separately. The factors are war, the policy environment, structural constraints, and external influences.
A. War
Perhaps the overriding characteristic of the Ethiopian economy in the last seventeen years was its unprecedented militarization. This was especially so towards the end of the military regime, when under the slogan of "everything to the war front", the entire economy was geared to the prosecution of war. In every sense, therefore, the economy was a war economy, and the consequences of this were bound to be disastrous.
There are several manifestations of this. First, we consider the impact of the war on the government budget's Growth in military expenditure has been much faster than that of any other category of government expenditure. On the eve of the revolution, defence spending was Birr 105.8 million; by 1986-87 it had exceeded one billion, which represents an almost tenfold increase. It is certain that figures for later years would be much higher. According to one official source, for example, spending by the Ministry of Defence in 1988-89 was Birr 1.8 billion [ONCCP 1988:144]. The growth pattern of military expenditure contrasts with that of spending on the social services such as education and health; as the war continued to impose greater demands on government budgetary resources, it was inevitable for the axe to fall on social spending. Thus, while the share of military spending in recurrent expenditure showed a generally upward trend, the share of education declined and that of health was at best constant.
26
The Ethiopian Economy: Structure and Policy Issues
Table 10: Drought-affected and Displaced Persons Requiring Assistance by Region
Region Rural population Persons requiring assistance Percentage of the total
Eritrea 2713793 2062290 76.0
TigraY 2497675 916280 36.7
N.Wello 1406729 45640 3.2
S.Wello 2321672 299960 13.0
E.Hararghe 2409864 375410 15.6
Dire Dawa 340991 51600 17.5
N.Gonder 1709837 299354 17.6
N.Shewa 2237574 52211 2.4
Asossa 515702 14864 2.9
Wellega 2344259 53047 2.3
N.Omo 2732040 290725 10.7
Illubabor 2711232 33690 1.2
Gambella 160912 78220 48.7
Assab 388156 198530 51.1
Ogaden 854515 523760 61.3
W.Hararge 1299142 116980 9.1
S.Gonder 1666386 127600 7.7
Bale 897487 54600 6.1
Total 29207966 5594781 19.2
Source: RRC, Early Warning System Report Food Supply of the Crop Dependent Population in 1991, February 1991.
The consequences of such a high level of military spending are obvious. First, it was a major factor behind the dismal record of government saving, which in turn contributed to the deterioration in the country's aggregate saving effort. Second, it contributed to a worsening of the country's foreign exchange position, both by undermining export capability and necessitating massive arms imports. With respect to the latter, although we encounter serious data limitations, it is estimated that between 1978 and 1988, for example, Ethiopia received arms imports and military aid worth nearly US$11 billion (in constant 1988 dollars) [United States Arms Control and Disarmament Agency 1989: 88]. As one observer pointed out, this is "a sum which could not under any foreseeable circumstances either be serviced as a debt or repaid by poverty-stricken Ethiopia "[Henze n.d.: 28]. It is particularly revealing that during the period mentioned above arms transfers to Ethiopia were in excess of the
27
:shot Chole & Makonnen Manyazewal: Macroeconomic Performance 1974-1990
value of other imports. We have no information on the terms under which arms were transferred to Ethiopia, but "if they were supplied with the expectation that Ethiopia would at some future point pay for them, the expectation must be illusory, for the cumulative 'indebtedness' would as of 1984 already have amounted to almost two years of Ethiopia's total GNP' [Henze n.d.: 281.
Other effects of war include the disruption of production, which assumed disastrous proportions with the expansion of the war zone; the destruction of infrastructure, including roads, bridges, rails and ports; the frequent disruption of traffic; the destruction of large numbers of schools, health establishments and vehicles; the disruption of trade; adverse effects on the environment; and -- perhaps most important -- its impact on the country's human power: the mobilization of thousands of young people for war and the consequent death and disablement which took place on a massive scale.
In sum, the war socked up resources that could have served the ends of development; devastated already existing infrastructure of all types; and robbed the country of thousands of its youth. It was without doubt one of the major factors that drove the economy to ruins.
B. The Policy Environment
It would, however, be totally misleading to lay the entire blame for the disastrous state of the economy on war alone. Expert opinion is unanimous that the policy environment of the day also seriously undermined the prospects for growth of the Ethiopian economy.
The most basic question in this regard is the role of the state in the economy. Put simply, the state overextended itself, attempted centralized guidance of an economy not amenable to such guidance, pursued strategies that were inimical to growth, stifled private initiative, and in general created an environment that seriously undermined the country's prospects for growth.
The attempt to run a command economy was bound to prove futile in the Ethiopian context, for a number of reasons. In the first place, given the dominant role of agriculture (and subsistence agriculture at that) in the economy, a sector heavily dependent on climatic factors, the scope for policy intervention is limited. Secondly, although the Ethiopian economy was often described as socialist, this was more intention than reality. It is not always recognized that about two-thirds of national income originated from the private sector, indicating that the scope for centralized direction was limited. Thirdly, given the state of war and instability that characterized most of the Dog's rule, economic decision-making in most cases was tantamount to crisis management; as such, it did not permit sober long-term planning. In spite of all these considerations, the government continued to act as if it could manipulate the economy at will, with disastrous consequences.
28
The Ethiopian Economy: Structure and Policy Issues
The government attempted too much, and in doing so engaged in activities in which it had no comparative advantage (e.g., retail trade and the provision of certain services). Particularly illuminating in this context is its dogged determination in support of state farms, in spite of abundant and public knowledge that they were draining the country of resources, including foreign exchange, and showing very little for it.
Because the state attempted to do too much, it inevitably narrowed the space available for the private sector. Saving and investment in this sector declined partly because of the policy environment. Local capital was forced to engage in largely speculative, albeit profitable, activities. And there was not a single instance of new private foreign investment in the country, whatever public investment took place being very limited. Related to this, commercial credits dried up and the country's share of official development assistance was one of the lowest in the world.
The adherence to inappropriate policies and the lack of timely response to the problems created by such policies gradually compounded shortages and drove the economy underground. This is a new phenomenon which was virtually absent during the period of imperial rule. The underground economy offers large trading margins which created a new class of speculators and rent seekers.
Looking around Addis Ababa, for example, it is striking to see the extensive availability of consumer goods (durables and non-durables). Given the absence of official allocation of foreign exchange for such goods, how were they imported? To be sure some of them come through "own foreign exchange" (franco-valuta) which is supplied by relatives or friends abroad. However, it is generally believed that most of these goods are imported through unofficial capital flows which are sustained by the burgeoning unofficial foreign exchange market.
This has exerted considerable pressure on the official exchange rate, leading to the widening of the gap with the parallel market rate. Overall, the booming underground economy entailed greater price distortions; erosion of tax base; and expansion of illegal exports -- aggravating the balance of payments crisis.
The government also relentlessly pursued programs of dubious utility but with considerable adverse consequences, including villagization, resettlement, grain marketing and pricing, and the management of state enterprises.
This review of the policy environment cannot be complete without mention of the process of policy-making, which has also contributed to retarding the country's development. Decisions were often made arbitrarily, either without the benefit or in wanton disregard of serious studies. As is only to be expected, this not only brought about disastrous results in the end but it also alienated those who had expert knowledge and those who were situated in the unenviable position of implementing decisions, regardless of their reservations as professionals.
29
Eshetu Chole & Makonnen Manyazewat Macroeconomic Performance 1974-1990
In these circumstances, loyalty carried more weight than ability or experience. Ultimately, therefore, implementation was jeopardized even when decisions were well-intentioned. Because political considerations always prevailed over economic ones, there was no respect for benefit-cost calculations, and results were judged without reference to costs. Needless to say, the country was badly served at the end of the day.
C. Long-term Structural Constraints
1. The Demographic Dynamics
Up until the 1984 census, there was widespread complacency regarding Ethiopia's demographic situation and prospects. The myth of the breadbasket of the Middle East", although somewhat deflated by the famines of recent memory, had not been quite laid to rest.
At the estimated annual rate of growth of 2.9 per cent (which is expected to reach 3 per cent shortly), the Ethiopian population would double in about 25 years, very sobering prospects to contemplate in view of the sorry economic performance of recent years.
The problem goes beyond the size and rate of growth of population; there is also the question of age structure to reckon with. About 47 per cent of the population is 15 years of age or under, and such a young population exerts considerable pressure on the demand for education and other social services, further straining the country's already strained resources. In addition, it aggravates the unemployment problem, in view of the fact that Ethiopia's unemployment is essentially youth unemployment. Perhaps even more alarming in this connection is the significance of the age structure for "the hidden population momentum". This refers to the fact that even if energetic and successful measures are taken to reduce the number of births per mother, more women will be moving into the child-bearing age bracket, thereby ensuring that the birth rate will continue to be high.
In this context, whatever economic gains were registered were quickly wiped out by the much faster growth rate of population. This demographic dynamics, even if it did not directly cause underdevelopment, certainly exacerbated it and it also rendered the tasks of breaking out of the poverty trap even more formidable than they already were.
2. Environmental Degradation
One of the formidable structural constraints on the economy, particularly agriculture, is accelerated environmental degradation. This assumes its most acute form in the degradation of land -- the very foundation of agricultural production. The Ethiopian Highland Reclamation Study (1986) showed that about half of the highlands, some 270 thousand sq km, is already significantly eroded. Out of this,
30
The Ethiopian Economy: Structure and Policy Issues
about 140 thousand sq km is seriously eroded and left with shallow soils. Agricultural lands which are so seriously eroded that they are unlikely to support cropping in the future amounted to some 20 thousand sq km.
The study further showed that cropped areas lose on average nearly 100 tons of soil per hectare per year. Further, grain production would be reduced by about 2 per cent per annum. This, when combined with the rapidly growing population, has led to a declining land/population ratio and accentuated the process of fragmentation of the already very small land holdings.
It is evident that Ethiopia has been faced with an ever-intensifying series of droughts, indicating a chronic condition rather than an occasional phenomenon. The human mortality, the livestock mortality and the socio-economic dislocation that result from these droughts and famines are quite substantial. A study of famine during 1958-1977 points out that "famine deaths in Ethiopia in the twenty years may be between two and five million"[Mesfin 1984].
The 1984/85 drought and famine were catastrophic in their consequences. The number of people affected by food shortages reached about 8 million [RRC 1985]. Besides immense human mortality and suffering, the drought caused great loss of livestock -- hence entailing large-scale erosion of asset base and further weakening their capacity to withstand future crises.
Things have not improved since then. The underlying conditions of vulnerability remain. As indicated earlier, at the end of 1990, RRC estimated that nearly 5 million people once again required assistance to forestall famine in 1991.
Therefore, as a result of the recurrent droughts, the 1980s have seen dramatically growing instability in agricultural production. This has had serious consequences for the whole economy and is a major factor for the country's deepening economic crisis. Growing food deficits, food aid dependence, foreign exchange shortages, and low savings and investment are closely associated with it.
3. Investment
As pointed out earlier in the paper, the country's investment effort is particularly low. While war and wrong-headed policies have undoubtedly contributed to this state of affairs, ultimately the most enduring factor is the country's extreme poverty. At a level of per capita income estimated to be in the neighborhood of US$120, it is virtually impossible to raise the investment rate to 25 per cent, which is considered the critical minimum to generate a respectable rate of economic growth. The problem is further aggravated by heavy reliance on foreign capital flows, with all its dire consequences. In this connection, it is important to note that the country's highly narrow export structure has limited its capacity to generate foreign exchange, a factor which has become a formidable bottleneck on the prospects for growth.
31
Eshetu Chok & Makonnen Manyazewal: Macroeconomic Peiformance 19741990
Quite apart from the magnitude of the volume of investment, there is the question of efficiency to consider. The available evidence suggests that capital-labour ratios in Ethiopian manufacturing, for example, are on the high side, suggesting low levels of efficiency. In addition, there is evidence to suggest that the absorptive capacity of the economy is limited, and this is to a large extent a reflection of limited organizational capability and weaknesses in the management of public enterprises.
4. Technology
Another significant structural constraint is technology, a fact which is too obvious to require lengthy amplification. In agriculture, which is highly dominated by peasant production, the technology used is essentially traditional, and modern inputs have been extremely limited in application. Consequently, productivity is extremely low, with obvious adverse consequences on the rest of the economy. Much the same applies to the technology used in the industrial sector. Most of the machinery in manufacturing was imported second-hand several years back and it has long exhausted its productive life. Inevitably, therefore, productivity in the economy was quite low, and the prospects for a breakthrough in technology dim.
This account of structural constraints can easily be expanded to include problems of limited infrastructure, shortage of skilled manpower, and a host of other factors that fall within the conventional catalogue of development bottlenecks. Important as all these constraints are, one must guard against the tendency of blaming everything on them. This would not only be inaccurate, but it would also lead to pessimism regarding the prospects for development. Such an approach would also excuse the many policy blunders that had a considerable role to play in driving the Ethiopian people farther along the path of poverty and destitution.
D. External Factors
Like most developing countries, Ethiopia is vulnerable to external economic shocks. This is particularly associated with the instability in primary commodity prices, which becomes acute when the exports of a country are dominated by one crop, as in the case of Ethiopia.
There has been increased reliance on coffee exports since the mid-1970s. In the first half of the 1970s non-coffee exports constituted about 60 per cent of total export earnings. At present coffee exports contribute about 55-60 per cent of total exports by value.
Ethiopia's external terms of trade have shown sharp fluctuations and a generally declining trend. Except in 1984 and 1986 the terms of trade have been below 100 (1980=100). The seriousness of the decline in the terms of trade is better judged if one takes note of the fact that their level was 198.8 in 1977 while they fell to 94.5 in 1988.
32
The Ethiopian Economy: Structure and Policy Issues
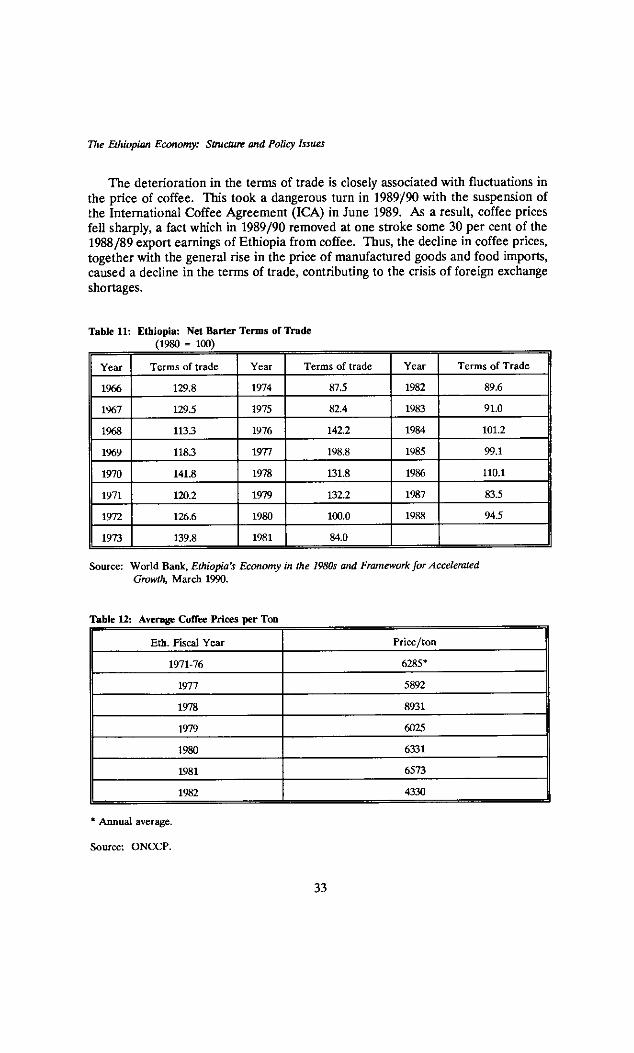
The deterioration in the terms of trade is closely associated with fluctuations in the price of coffee. This took a dangerous turn in 1989/90 with the suspension of the International Coffee Agreement (ICA) in June 1989. As a result, coffee prices fell sharply, a fact which in 1989/90 removed at one stroke some 30 per cent of the 1988/89 export earnings of Ethiopia from coffee. Thus, the decline in coffee prices, together with the general rise in the price of manufactured goods and food imports, caused a decline in the terms of trade contributing to the crisis of foreign exchange shortages.
Table 11: Ethiopia: Net Barter Terms of Trade 1980 = 100)
Year Terms of trade Year Terms of trade Year Terms of Trade
1966 129.8 1974 87.5 1982 89.6
1967 129.5 1975 82.4 1983 91.0
1968 113.3 1976 142.2 1984 101.2
1969 118.3 1977 198.8 1985 99.1
1970 141.8 1978 131.8 1986 110.1
1971 120.2 1979 132.2 1987 83.5
1972 126.6 1980 100.0 1988 94.5
1973 139.8 1981 84.0
Source: World Bank, Ethiopia's Economy in the 1980s and Framework for Accelerated Growth, March 1990.
Table 12: Average Coffee Prices per Ton
Eth. Fiscal Year Price/ton
1971-76 6285*
1977 5892
1978 8931
1979 6025
1980 6331
1981 6573
1982 4330
Annual average.
Source: ONCCP.
33
Eshelu Chole & Makonnen Manyazewak Macroeconomic Perfonnance 1974-1990
Apart from the instability in coffee prices, the outlook for world demand is not bright. A combination of high world coffee production and slack consumer demand render the prospects of coffee revival doubtful for most of the coming decade. Nor is there any guarantee that there will be a revival of ICA.
VI. THE GOVERNMENTS RESPONSE TO THE DEEPENING CRISIS
A. The November 1988 Economic Reform
The deepening crisis brought forth internal and external calls for economic policy reform. But because of the underlying ideological motivation of the policies, the government was reluctant to make timely responses. And the economic problems kept on compounding.
The shift in East-West relations, growing policy conditionality pressure applied by the donor community for external assistance and loans, the intensification of the war and a series of military reversals, as well as a growing crisis of confidence on the part of the populace finally acted in concert to nudge the government towards reform.
The first major attempt at policy reform came following the resolutions of the 9th Plenum of the Central Committee (CC) of WPE in November 1988. It was stated that the main decisions of the Plenum had as their basic objectives defending the gains scored in the revolutionary process, scoring new victories, safeguarding the people's security and the unity of the country, and creating a secure and appropriate material, technical and cultural foundation for the socialist system. Key elements of the 9th Plenum's resolutions were:
a) continue organizing producers' cooperatives through strengthened government technical assistance;
b) continue strengthening the villagization programme; c) remove the constraints facing state farms and expand and strengthen them so as
to bring qualitative and quantitative increase in their output, raw materials for industry, export market, and to broaden job opportunities;
d) continue strengthening the resettlement programme in order to ease food shortage by developing idle land, tackle problems of unemployment, ease the pressure on seriously degraded regions, and generally maintain proper population distribution and ecological balance;
e) ensure tenure security for peasants; f) raise the ceiling on private capital in small-scale industries; g) create legal conditions for private investors with adequate capital and
management skills to participate without any capital limitations, privately, in
34
The Ethiopian Economy: Structure and Policy Issues
partnership, concessional arrangements or joint ventures with the government in the fields of large-scale agriculture, animal husbandry and animal by-products, industry and services;
h) amend the proclamation on joint venture so as to encourage mutually acceptable participation of foreign capital.
The basic direction of the country's development still remained that of socialism. The problem is not, said the philosophy of the resolution, with socialization per se, but with its poor implementation and with lack of commitment and adequate support -- hence the call for strengthened technical, financial, and managerial support.
As far as the private sector was concerned, the intention was to create legal conditions and remove outright hostility and allow it to contribute to the construction of a socialist economy. It was viewed as a tactical ally -- so to speak. On the basis of the above policy directives, legislation to promote private participation in small-scale industries, hotels and joint ventures was proclaimed.
The Joint Venture Proclamation was issued in July 1989. It made a major departure from previous policy on private sector investment. There was to be no capital ceiling on investment, it removed the limits on the proportion of equity contributed by each party, on the total legal life of the Joint Venture, and the areas of operation. It allowed free remittance of dividends earned by the foreign investor in convertible currencies, as well as the remittance of fees, royalties and expatriate salaries, the exemption of machinery and equipment from customs duties, and exemption for raw material imports from customs tariffs for a specific period. In addition, the Joint Venture law allowed the carrying forward of any losses for three consecutive years for tax purposes.
The legislation on small-scale industries, issued on July 5, 1989, raised the investment ceiling for small-scale enterprises to Birr 2 million for an individual entrepreneur and Birr 4 million for a business firm. Further, investment was permitted in more than one enterprise, subject to the overall ceiling of 4 and 8 million Birr, respectively. However, cooperatives were exempted from any capital ceiling. Small-scale enterprises in manufacturing were also allowed exemption from customs duties for the initial purchase of capital goods, and a four-year income tax exemption where 10 per cent of annual sales is exported.
As far as the hotel services development decree is concerned, the capital ceiling was raised to Birr 3 million for individual entrepreneurs and Birr 6 million for a business organization. Further, imports of basic infrastructure with a value of up to Birr 300,000 were exempt from tariff payments.
35
Eshetu (-hole & Makonnen Manyazewa• Macroeconomic Performance 1974-1990
B. The Mixed Economy Policy Reform
While the government was attempting to legislate its reform measures of November 1988, things were moving at a dizzying pace on the international front. The close of the 1980s saw the demise of socialism in Eastern Europe and its imminent collapse in the Soviet Union. These developments, the deepening economic crisis, the continued military defeats, the internal and external confidence crisis these generated, and dwindling external resource flows clearly limited the government's room for maneuver and rendered the November 1988 reform inadequate. The government had to respond in a fundamental way to withstand the pressures from all sides that were bringing it to a collapse. This came with the resolutions of the 11th Plenum of the CC of the WPE, held in March 1990.
The 11th Plenum brought together earlier attempts and new perspectives on the state of the economy and formulated a fundamentally new overall development strategy -- the policy of mixed economy. The significance of the new mixed economy policy was its orientation, which contrasted with the institutional and policy framework in which the Ethiopian econothy had been operating in the post-1974 period.
The new mixed economy policy adopted by the 11th Plenum was an orientation watershed. It marked a break with and reversal of the programme of transition to socialism as envisaged in the National Democratic Revolution Programme, which was to be attained through steadily easing out the private sector and creating a dominant state sector. Under this economic orientation the private sector was seen as an adversary and not an ally and its activities were to be curtailed through the political and economic power of the state.
The new economic policy showed the government's new development orientation by defining a new, complementary relationship between the state sector and the private sector. Now the private sector was to be taken as a useful partner in the country's economic development process. A conducive legal environment was to be created to remove restrictions and to encourage the economic activities of all forms of enterprises -- state, private and cooperatives.
The essential elements of the New Economic Reform Programme (NEAP) can be outlined briefly as follows. They were:
a) promotion of a mixed economy where all forms of enterprise -- state, private, and cooperative -- operate side by side in a competitive environment;
b) greater use of the market mechanism to guide economic decisions; c) elimination of state controls on the operation of the private sector (capital
ceilings, area of operation, etc.) and active promotion of private economic activity;
d) restructuring public enterprise management towards competitiveness and profitability; and
36
The Ethiopian Economy Stalin and Policy Issues
e) in the agricultural sector:
i) abolition of Agricultural Marketing Corporation quota levies; ii) lifting of all inter-regional grain movement controls;
iii) allowing the private sector to operate in grain marketing in a free market environment;
iv) security of land tenure, trees and other investments on land; v) strictly voluntary formation and/or dissolution of cooperatives;
f) promotion of foreign investment.
Overall, the essential difference in economic management between the pre- and post-11th Plenum lies in the stated orientation towards a market economy, acceptance of profitability as a guiding principle of enterprises, whether they are state, private or cooperative enterprises. The new system of economic management intended to give state enterprises progressively greater management autonomy (authority) in production, labor hire and fire as well as in input supply and marketing decisions.
Following the adoption of the mixed economy development strategy, the government issued a new Investment Policy with the aim of creating the legal environment for the participation of local capital as well as public and private foreign capital in the acceleration of the country's development. In May 1990 the State Council issued Special Decree (No. 17/1990) on investment. The new Investment Decree defined the areas of investment open to investors and the incentives to which they are entitled. Private investment, including foreign investment, was actively encouraged without restriction on size, in all sectors except in a very few cases, such as public utilities, banking and insurance, for which prior authorization would be required from the Council of Ministers.
The new Investment Decree also provided extensive incentives to investment. Investors were exempted from payment of customs duties and from payment of income tax ranging from two up to five years, depending on capital invested. Furthermore, the Decree provided an additional year or two of exemption from income tax as incentives for investment in areas designated as preferred by tka. Council of Ministers.
The incentives were not limited to making exemption from payment of customs duties and income tax. The top marginal income tax rate was reduced from 89 per cent to 59 per cent in May 1990 to provide further encouragement to private investment.
In order to facilitate the implementation of the Investment Decree, the Council of Ministers issued regulations to provide for the issuance of licenses for agria Rural, industrial, hotel and tourism activities.
37
Eshetu Chole & Makonnen Manyazewal: Macroeconomic Performance 1974-1990
The overall conclusion that one can draw is that the new Investment Decree practically removed all restrictions and discrimination against the private sector (both local and foreign) and that the door was open for competitive investment opportunities.
But the fundamental question that needs to be asked is how far the new economic policy could have gone in restoring growth dynamics to the Ethiopian economy. Given the then prevailing political and military situation in Ethiopia, it can be argued that NERP could not have achieved much. It simply came too late to save the day. The main Western donors as well as the Soviet Union had already written off the military government. This had squeezed and starved the government of badly needed external resources. Internally, the crisis of confidence had grown in intensity, thus making the response of private sector investors uncertain.
Perhaps the single most important determining factor of the implementability of NERP was the direction and intensity of the war. The government had already absorbed a series of military defeats and lost control of large territories. A continuation, let alone deterioration, of this situation was bad for the new economic policy, mainly due to four major reasons. First, even though NERP had created the legal environment and was offering enticing incentives, domestic investors were unlikely to be confident enough to be forthcoming on a sufficient scale. Secondly, it showed to potential foreign investors a deteriorating and uncertain political environment, a key variable for their confidence to invest in a given country. Thirdly, the multilateral and bilateral donor community, which are sources of the much needed inflow of foreign resources, had already adopted an attitude of wait and see -- thus blocking the vital life line for NERP to take off. Fourth, domestic resources would have continued to be increasingly tied to the war effort instead of being released for public investment. In other words, NERP was foredoomed to failure; and the military government did not live to implement it.
VII. LOOKING AHEAD: PROSPECTS FOR THE 1990s
What, then, are Ethiopia's economic prospects as it moves towards the twenty-first century? The first point to recognize is that since the economy is in ruins and since the constraints it has to deal with represent a formidable array, no dramatic improvement in the lives of the people can be expected in the next few years. It must also be recognized, however, that there are new opportunities (as well as challenges) which justify looking at the future with some hope.
First is the termination of war, if not in an absolute sense, at least relative to what the country has known in the last several years, especially since the mid-eighties. The basic question here is: will there be a peace dividend, and if so, how much will it be? The destruction of the country's huge military machine will no doubt release considerable resources, and if the state of peace holds the country can
38
The Ethiopian Economy: Structure and Policy Issues
mobilize all its human and material potential for the tasks of economic construction. But if the state of peace proves ephemeral, such optimism will not be sustainable.
The transition from war to peace also poses unique challenges of its own. Most significant in this regard is what to do with the hundreds of thousands of former soldiers. Unless these are rehabilitated and reintegrated within society in a reasonable period of time, they will represent a formidable economic and social problem which the country has to contend with. Their rehabilitation and reintegration is not a costless enterprise, and it is bound to create further strains on the country's severely depleted resources. We do not wish to speculate on the prospects for receiving foreign assistance for this purpose, but we believe that it is indispensable.
Another challenge posed by the termination of war arises from the new political realities in Eritrea. As a result of these realities, the country has lost a sizeable component of its manufacturing industry, and its access to the sea can no longer be taken for granted. But even if access is ensured, the costs involved are bound to be an additional burden on a fragile economy.
The other important variable is the transition from a highly state-oriented economy to a more market-based one. This transition, although it offers many opportunities, is bound to pose several challenges as well. If the state succeeds in creating an enabling environment and confines itself to activities in which its role is indispensable or in which it has a proven comparative advantage, the prospects for getting the economy moving again will be good.
But, as the experience of Eastern Europe makes only too clear, the transition period is a painful one and needs sophisticated steering. When state enterprises are privatized, prices are decontrolled, subsidies are withdrawn, etc., there is bound to be unemployment, more inflation, further decline of already poor incomes, etc. -- in other words, a deterioration in social welfare. To prevent this from happening, one needs a substantial package of resources. The Ethiopian economy cannot generate this internally, which means that the social welfare consequences of reform can only be alleviated with massive foreign assistance. What the prospects for mobilizing such assistance are is difficult to speculate.
But these two aspects of the transition process -- from war to peace and from state control to a more liberal economy -- will be the major determinants of how the economy will perform in the next few years. In both cases, a massive infusion of foreign resources is indispensable. The economy is therefore particularly vulnerable. The structural constraints, because of their inherent character, will be with us for a long time to come. In the immediate future, therefore, the tasks before the economy are those of reconstructing the war-torn economy, feeding the people, and laying the groundwork for development over the long haul. This in itself is an overwhelming agenda.
39
Eshetu Chole & Makonnen Manyazewal: Macroeconomic Performance 1974-1990
VIII. CONCLUSION
In its early days, the military government frequently took advantage of every conceivable situation to declare that the economy it had inherited was in ruins and that the public treasury was virtually empty. True, the economy was stagnant and its prospects for growth not promising. But the record clearly shows that, compared to what the Derg was to bequeath to its successors, the economic legacy of the imperial regime strikes one as having been generous.
As pointed out earlier in the paper, the domestic saving rate was at least three times what it was to be during the era of military rule; the country had an import cover of more than 16 months compared to 0.3 months in the last days of the Derg; the trade and resource balances were positive; and the budget deficit represented less than 3 per cent of GDP, compared to over 17 per cent in 1989/90. In view of these facts, it would not be unfair to conclude that the military government left the economy in worse shape than it had found it. In terms of economic development, therefore, the Derg era represented seventeen lost years.
NOTES
1. The average domestic saving rate for low-income countries was 26 per cent in 1989 [World Bank 1990: 220-2211.
2. The average investment rate for low-income countries was 28 per cent in 1989 [World Bank 1991: 218-219].
3. The information in this and the following two paragraphs is taken from ONCCP (1991: 17-19).
4. There is the problem of what budgetary items should be taken to represent military spending. Taking the budget of the Ministry of Defence alone would result in understatement, for a number of reasons. To begin with, some of the items under "public order and security' or "internal order and justice" are of an essentially military character. Thus, items such as the police force, military commissariat, territorial militia, etc. are essentially military categories. In addition, spending on institutions such as the Rehabilitation Center for People's Heroes and Revolutionary Ethiopia Chidren's Village is directly related to war. For all these reasons it should be borne in mind that the figures used here for military spending are obvious understatements.
REFERENCES
Central Statistical Authority. Manufacturing Survey, various issues.
Eshetu Chole (1989a). Ethiopia's Balance of Payments 1974-1985. Journal of Ethiopian Studies, Vol.XXII.
40
The Ethiopian Economy: Structure and Policy Issues
(19896). The Impact of War on the Ethiopian Economy. In Conditions for the Possibility of Peace in the Horn of Africa - Proceedings of the 4th Annual Conference on the Horn of Africa, City College of the City University of New York, 26-28 May 1989.
(1990). The Ethiopian Economy: Current State, Policy Environment and Future Prospects. Study Prepared for the Canadian International Development Agency, unpublished.
FAO 1986. Ethiopia: Highland Reclamation Study. Rome.
Gedion Asfaw (1988). Disaster Prevention and Preparedness Planning in the Context of the Five Year Plan. Paper presented at National Conference on A Disaster Prevention And Preparedness Strategy For Ethiopia, Addis Ababa, December 5-8, 1988.
Hancock, Graham (1985). Ethiopia: The Challenge of Hunger. London: Victor Gollancz Ltd.
Henze, Paul B. n.d. Contrasts in African Economic Development: The Economies of Kenya and Ethiopia, 1975-1984, mimeo.
IDS Bulletin, Vol.21, No3, July 1990.
Mesfm Wolde Mariam (1984). Ruml Vulnerability to Famine in Ethiopia: 1958-1977. New Delhi:Vilcas Publishers.
Office of the National Committee for Central Planning (ONCCP). Annual Development Plans (in Amharic), various issues.
n.d. National Conference on a Disaster Prevention and Preparedness Strategy for Ethiopia, 5-8 December 1988, Addis Ababa.
(1988a). The Overall Performance of the Ethiopian Economy During the First-Half of the Ten- Year Perspective Plan (in Amharic).
(19886). Initial Targets and Preparation Guidelines for the First Five-Year Development Plan (1982-1986) and the 1982 Annual Plan, Vol.! (in Amharic).
(1989a). Towards A Food And Nutrition Strategy For Ethiopia. Proceedings of the National Workshop on Food Strategies for Ethiopia held at Alemaya University of Agriculture, 8-12 December 1986.
(198%). Conference on Population Issues in Ethiopia's National Developmenk Report of Conference Proceedings.
(1989c). The Ethiopian Economy: Problems Recent Developments and Implications forEateral Assistance.
(1990). The Ethiopian Economy: Towards An Economic Programme For the 1990s.
(1991). The Current State of the Ethiopian Economy and Measures that Need to be Taken (in Amharic).
ONCCP/SAATA (1991). Inflationary Pressures and Prospects of the Ethiopian Economy.
Planning Commission Office (1976). Report on the Current Economic Situation.
41
Eshetu aole & Makonnen Manyazewa• Macroeconomic Performance 1974-1999
Provisional Military Government of Ethiopia (PMGE) (1974). Declaration of the Provisional Military Government of Ethiopia.
Provisional Military Government of Socialist Ethiopia (1984). Ten-Year Perspective Plan 1984/81 1993/94.
Relief and Rehabilitation Commission (RRC) (1985). The Challenges of Drouglot Ethiopia's Decade of Struggle In Relief and Rehabilitation.
(1991). Early Warning System Report, Food Supply of Crop Dependent Population in 1991.
Tekk Birhan G.Michael (1990). Inflation Galore?. Binitu, No. 50.
United States Arms Control and Disarmament Agency (1989). Work! Military Expenditures and Arms 7'mnsfers 1989. Washington, D.C.
World Bank (1990). Ethiopia's Economy in the 1980s and Framework for Accelerated Growth. Washington, D.C.
(1991). World Development Report 1991. New York: Oxford University Press.
42