Embed Size (px)
Citation preview
Reportby the Comptroller and Auditor General
Department of Health and NHS England
The management of adult diabetes services in the NHS: progress review
HC 489 SESSION 2015-16 21 OCTOBER 2015

Our vision is to help the nation spend wisely.
Our public audit perspective helps Parliament hold government to account and improve public services.
The National Audit Office scrutinises public spending for Parliament and is independent of government. The Comptroller and Auditor General (C&AG), Sir Amyas Morse KCB, is an Officer of the House of Commons and leads the NAO, which employs some 810 people. The C&AG certifies the accounts of all government departments and many other public sector bodies. He has statutory authority to examine and report to Parliament on whether departments and the bodies they fund have used their resources efficiently, effectively, and with economy. Our studies evaluate the value for money of public spending, nationally and locally. Our recommendations and reports on good practice help government improve public services, and our work led to audited savings of £1.15 billion in 2014.
Report by the Comptroller and Auditor General
Ordered by the House of Commons to be printed on 20 October 2015
This report has been prepared under Section 6 of the National Audit Act 1983 for presentation to the House of Commons in accordance with Section 9 of the Act
Sir Amyas Morse KCB Comptroller and Auditor General National Audit Office
19 October 2015
HC 489 | £10.00
Department of Health and NHS England
The management of adult diabetes services in the NHS: progress review
In 2014, the Committee of Public Accounts asked us to review progress in improving diabetes services since we last reported in 2012. This report sets out the results of our review, which examined progress in implementing the Committee’s recommendations and against key outcomes for people with diabetes.
© National Audit Office 2015
The material featured in this document is subject to National Audit Office (NAO) copyright. The material may be copied or reproduced for non-commercial purposes only, namely reproduction for research, private study or for limited internal circulation within an organisation for the purpose of review.
Copying for non-commercial purposes is subject to the material being accompanied by a sufficient acknowledgement, reproduced accurately, and not being used in a misleading context. To reproduce NAO copyright material for any other use, you must contact [email protected]. Please tell us who you are, the organisation you represent (if any) and how and why you wish to use our material. Please include your full contact details: name, address, telephone number and email.
Please note that the material featured in this document may not be reproduced for commercial gain without the NAO’s express and direct permission and that the NAO reserves its right to pursue copyright infringement proceedings against individuals or companies who reproduce material for commercial gain without our permission.
Links to external websites were valid at the time of publication of this report. The National Audit Office is not responsible for the future validity of the links.
10815 10/15 NAO
The National Audit Office study team consisted of: Craig Adams and Leon Bardot, under the direction of Robert White, with assistance from Zoltan Bedocs, Dominic Ferguson, Helen Palmer and Claire Trevor.
This report can be found on the National Audit Office website at www.nao.org.uk
For further information about the National Audit Office please contact:
National Audit Office Press Office 157–197 Buckingham Palace Road Victoria London SW1W 9SP
Tel: 020 7798 7400
Enquiries: www.nao.org.uk/contact-us
Website: www.nao.org.uk
Twitter: @NAOorguk
Contents
Key facts 4
Summary 5
Part OneNHS services for people with diabetes 12
Part TwoProgress in delivering care processes and improving outcomes 20
Part ThreeImproving the performance of diabetes services 36
Appendix OneProgress against the Committee of Public Accounts’ recommendations 40
Appendix TwoOur audit approach 42
Appendix ThreeThe costs of diabetes to the NHS in England 44
4 Key facts The management of adult diabetes services in the NHS: progress review
Key facts
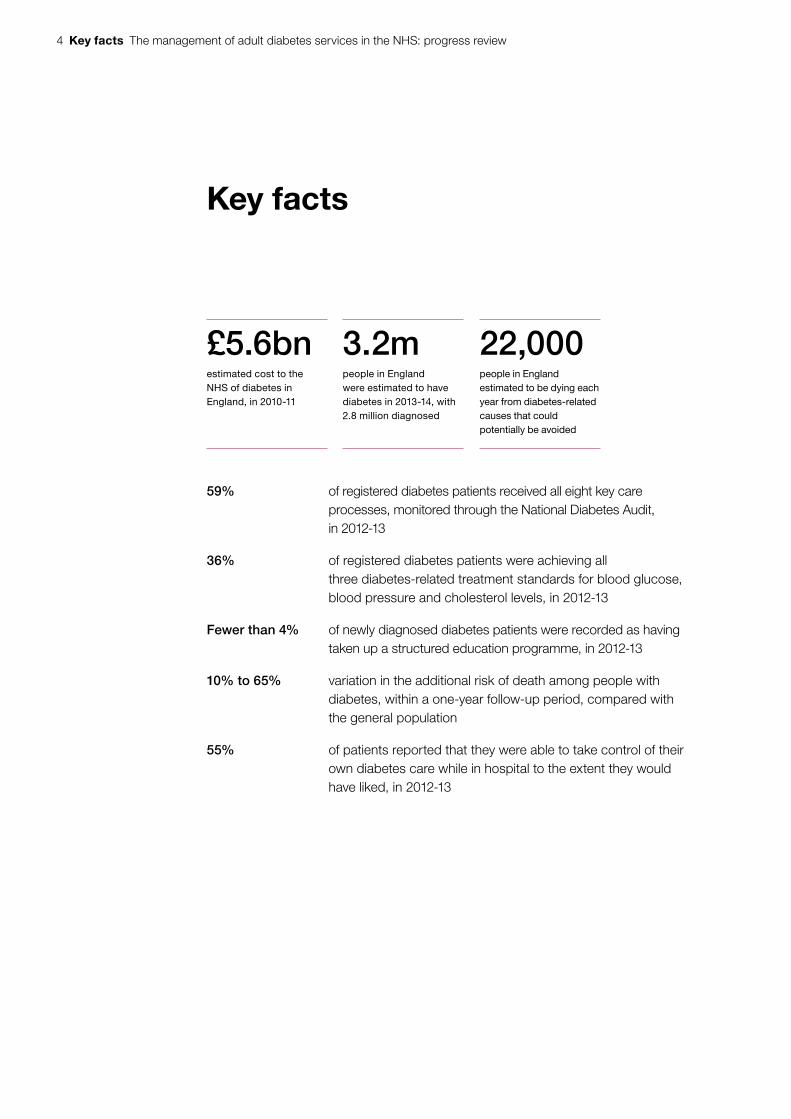
£5.6bnestimated cost to the NHS of diabetes in England, in 2010-11
3.2mpeople in England were estimated to have diabetes in 2013-14, with 2.8 million diagnosed
22,000people in England estimated to be dying each year from diabetes-related causes that could potentially be avoided
59% of registered diabetes patients received all eight key care processes, monitored through the National Diabetes Audit, in 2012-13
36% of registered diabetes patients were achieving all three diabetes-related treatment standards for blood glucose, blood pressure and cholesterol levels, in 2012-13
Fewer than 4% of newly diagnosed diabetes patients were recorded as having taken up a structured education programme, in 2012-13
10% to 65% variation in the additional risk of death among people with diabetes, within a one-year follow-up period, compared with the general population
55% of patients reported that they were able to take control of their own diabetes care while in hospital to the extent they would have liked, in 2012-13
The management of adult diabetes services in the NHS: progress review Summary 5
Summary
1 Diabetes is a chronic condition where the body does not produce enough insulin to regulate blood glucose levels. The percentage of the adult population in England with diabetes has more than doubled between 1996-97 and 2013-14. In 2013-14, there were an estimated 3.2 million people aged 16 years or older with diabetes in England, of whom 2.8 million (6.2% of the adult population) were diagnosed and 400,000 (1.2% of the adult population) were undiagnosed. Since we last reported on diabetes services in 2012, the number of people aged 16 years or older with diagnosed diabetes has, on average, increased by 4.8% a year.
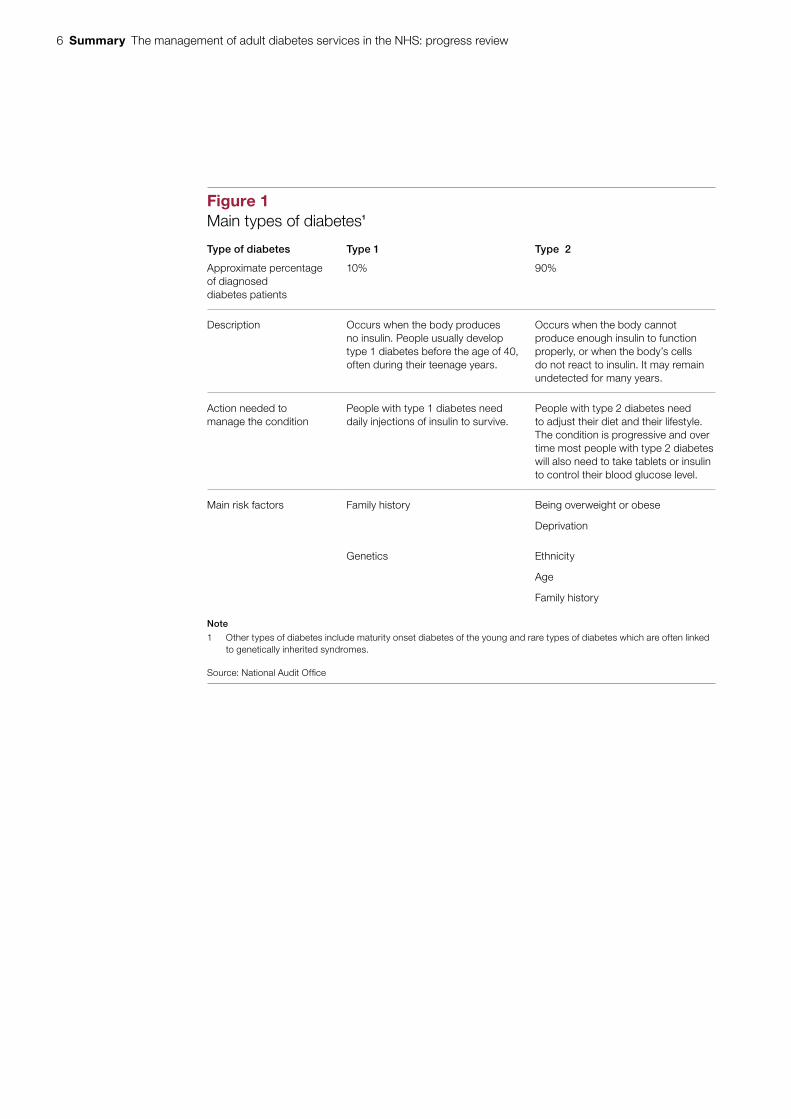
2 There are two main types of diabetes (Figure 1 overleaf). Around 10% of people diagnosed with diabetes have type 1 diabetes, which occurs when the body produces no insulin. The remaining 90% have type 2 diabetes, which occurs when the body cannot produce enough insulin to function properly, or when the body’s cells do not react to insulin.
3 The percentage of the population with type 2 diabetes is strongly associated with social deprivation. Being overweight is the main modifiable risk factor for type 2 diabetes. Obesity is rising and this has led to an increase in the percentage of the adult population with diabetes. About 90% of adults with type 2 diabetes are overweight or obese.
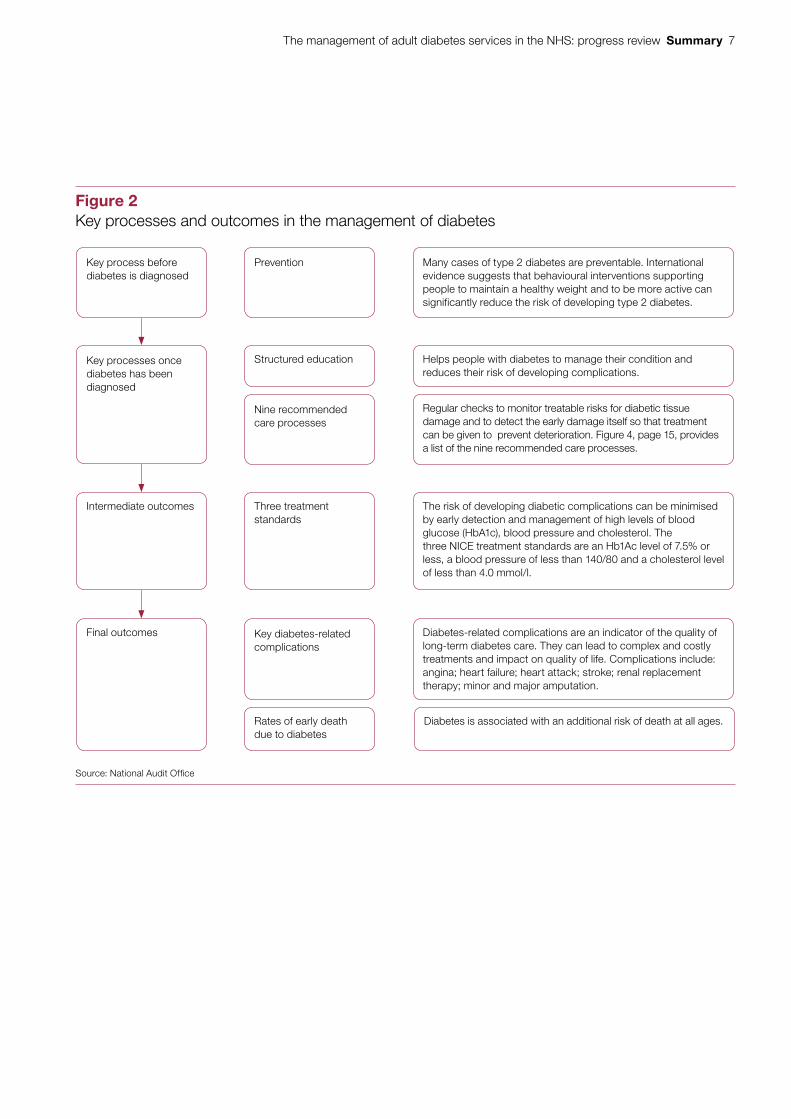
4 With structured education and appropriate support, most people with diabetes can manage their condition themselves by, for example, eating a healthy diet, monitoring their blood glucose level and taking insulin or glucose-lowering medication as needed. They also need regular checks to monitor treatable risks for diabetic tissue damage and to detect the early damage itself, so that treatment can be given to prevent deterioration. In 2001, the Department of Health (the Department) set out nine care processes that people with diabetes should receive each year to detect the early signs of complications. The National Institute for Health and Care Excellence (NICE) has also set treatment standards for blood glucose, blood pressure and cholesterol which, when achieved, reduce the risk of a person with diabetes developing complications (Figure 2 on page 7).
5 The estimated cost of diabetes to the NHS in England was £5.6 billion in 2010-11. The cost of complications (such as amputation, blindness, kidney failure and stroke) accounted for 69% of these costs.
6 Summary The management of adult diabetes services in the NHS: progress review
Figure 1Main types of diabetes1
Type of diabetes Type 1 Type 2
Approximate percentage of diagnosed diabetes patients
10% 90%
Description Occurs when the body produces no insulin. People usually develop type 1 diabetes before the age of 40, often during their teenage years.
Occurs when the body cannot produce enough insulin to function properly, or when the body’s cells do not react to insulin. It may remain undetected for many years.
Action needed to manage the condition
People with type 1 diabetes need daily injections of insulin to survive.
People with type 2 diabetes need to adjust their diet and their lifestyle. The condition is progressive and over time most people with type 2 diabetes will also need to take tablets or insulin to control their blood glucose level.
Main risk factors Family history Being overweight or obese
Deprivation
Genetics Ethnicity
Age
Family history
Note
1 Other types of diabetes include maturity onset diabetes of the young and rare types of diabetes which are often linked to genetically inherited syndromes.
Source: National Audit Offi ce
The management of adult diabetes services in the NHS: progress review Summary 7
Figure 2Key processes and outcomes in the management of diabetes
Source: National Audit Offi ce
Prevention Many cases of type 2 diabetes are preventable. International evidence suggests that behavioural interventions supporting people to maintain a healthy weight and to be more active can significantly reduce the risk of developing type 2 diabetes.
Structured education Helps people with diabetes to manage their condition and reduces their risk of developing complications.
Regular checks to monitor treatable risks for diabetic tissue damage and to detect the early damage itself so that treatment can be given to prevent deterioration. Figure 4, page 15, provides a list of the nine recommended care processes.
Three treatment standards
The risk of developing diabetic complications can be minimised by early detection and management of high levels of blood glucose (HbA1c), blood pressure and cholesterol. The three NICE treatment standards are an Hb1Ac level of 7.5% or less, a blood pressure of less than 140/80 and a cholesterol level of less than 4.0 mmol/l.
Key diabetes-related complications
Diabetes-related complications are an indicator of the quality of long-term diabetes care. They can lead to complex and costly treatments and impact on quality of life. Complications include: angina; heart failure; heart attack; stroke; renal replacement therapy; minor and major amputation.
Nine recommended care processes
Diabetes is associated with an additional risk of death at all ages. Rates of early death due to diabetes
Key process before diabetes is diagnosed
Key processes once diabetes has been diagnosed
Intermediate outcomes
Final outcomes
8 Summary The management of adult diabetes services in the NHS: progress review
6 In 2012, we reported on The management of adult diabetes services in the NHS.1 The Committee of Public Accounts took evidence on the report and concluded that too many people with diabetes were developing complications because they were not receiving the care and support they needed.2 The Committee made seven recommendations aimed at improving services and achieving better outcomes for people with diabetes and minimising the growth in the number of people with diabetes.
Scope
7 In 2014, the Committee asked us to review progress in improving diabetes services. This review was a short, focused piece of work looking specifically at progress against the Committee’s recommendations and progress against key outcomes, rather than an examination of value for money. This report covers:
• an overview of NHS services for people with diabetes (Part One);
• progress against recommended standards of care and key outcomes (Part Two); and
• improving the performance of diabetes services (Part Three).
8 This review draws heavily on data that were already available. The latest data are for 2012-13. In Appendix One we assess progress against the Committee’s recommendations. Our audit approach is in Appendix Two.
Findings
9 An estimated 200,000 people are newly diagnosed with diabetes each year. A number of NHS initiatives aim to minimise the growth in numbers. For example, the NHS Health Check programme, commissioned by local authorities, addresses the top seven causes of preventable mortality: high blood pressure; smoking; cholesterol; obesity; poor diet; physical inactivity; and alcohol consumption. And in March 2015, the national NHS Diabetes Prevention Programme was launched, which targets people at high risk of developing type 2 diabetes (paragraphs 2.3 to 2.8).
10 Few newly diagnosed diabetes patients are recorded as being offered structured education or taking up the offer. The percentage of newly diagnosed diabetes patients recorded as being offered structured education and recorded as taking up the offer is improving each year, but in 2012-13 these percentages were only 16% and 4% respectively. In some areas, poor recording of the take-up of education programmes is an issue. Potential barriers to the take-up of diabetes education and support include: variable levels of provision across the country; patients being given little information about the aims and benefits of the education; practical difficulties in attending courses; and healthcare professionals’ lack of awareness of the benefits of education programmes (paragraphs 2.9 to 2.13).
1 Comptroller and Auditor General, The management of adult diabetes services in the NHS, Session 2012-13, HC 21, National Audit Office, May 2012.
2 HC Committee of Public Accounts, The management of adult diabetes services in the NHS, Seventeenth Report of Session 2012-13, HC 289, November 2012.
The management of adult diabetes services in the NHS: progress review Summary 9
11 NHS performance in delivering the nine recommended care processes has not improved since we last reported on diabetes services. Between 2009-10 and 2012-13, the percentage of registered diabetes patients receiving all the care processes except eye screening, monitored through the National Diabetes Audit, remained at around 60%. Data on eye screening is now reported independently through the NHS diabetic eye screening programme (paragraphs 2.15 and 2.16).
12 The percentage of diabetes patients achieving all three treatment standards has improved slightly since 2009-10 but did not change between 2011-12 and 2012-13. Between 2009-10 and 2011-12, the percentage of registered diabetes patients achieving the recommended NICE treatment standards to control blood glucose, blood pressure and cholesterol increased from 19.4% to 20.9%. In 2012-13, the Health and Social Care Information Centre modified the blood pressure treatment standard. As a result, the percentage of registered diabetes patients achieving all three treatment standards increased to 36% in 2012-13. However, underlying performance did not change between 2011-12 and 2012-13 (paragraphs 2.21 and 2.22).
13 Diabetes specialist staffing levels in hospitals have not changed since we last reported on diabetes services. The percentage of beds in acute hospitals in England occupied by people with diabetes increased from 14.8% in 2010 to 15.7% in 2013. However, the level of diabetes specialists has not significantly changed. In 2013, nearly one-third of hospitals in England taking part in the National Diabetes Inpatient Audit still had no diabetes inpatient specialist nurse and 6% did not have any consultant time for diabetes inpatient care (paragraphs 1.8 and 2.29).
14 Current funding models do not support the delivery of integrated diabetes services. Most of the organisations we spoke to told us that diabetes care needs to be more integrated if performance against the nine recommended care processes and three treatment standards is to improve. Most of the organisations also told us that current organisation-based funding models do not support integrated diabetes care. Where more integrated care is being delivered, this has been achieved despite the system, not because of it (paragraph 3.6).
15 There has been a statistically significant reduction in premature death for those with type 2 diabetes since we last reported on diabetes services. In 2013, people with diabetes were 34% more likely to die that year than the general population in England, an improvement since 2011 when they were 44% more likely to die. A benchmarking study of 19 countries, published in 2013, indicated that in 2010 the UK had the lowest rates of early death due to diabetes. In addition, the relative risk for a person with type 1 or type 2 diabetes developing a diabetes-related complication has not changed or has fallen for most complications. The exception is minor amputation, which is increasing. The increase in the number of people with diabetes means, however, that the absolute number of diabetes patients with complications is rising (paragraphs 2.32, 2.34 and 2.35).
10 Summary The management of adult diabetes services in the NHS: progress review
16 Some groups of diabetes patients receive worse routine care and treatment and have poorer outcomes. Younger people with type 1 and type 2 diabetes and people with type 1 diabetes of all ages receive fewer of the recommended care processes and are less likely to achieve the three treatment standards. This can lead to poorer outcomes. For example, the relative risk of premature death for young women (aged 15 to 34) with type 1 diabetes is particularly high (paragraphs 2.18, 2.24, 2.31 and 2.36).
17 There are significant geographical variations in delivering care processes, achieving treatment standards and in outcomes for diabetes patients. For example, across clinical commissioning groups: the percentage of people with diabetes receiving all the recommended care processes, apart from eye screening, ranged from 30% to 76% in 2012-13; the percentage of people with diabetes achieving all three treatment standards ranged from 28% to 48% in 2012-13; and the additional risk of death among people with diabetes within a one-year follow-up period, ranged from 10% to 65%. Variations across GP practices are likely to be larger, but limited data at this level are available (paragraphs 2.11, 2.19, 2.25 and 2.33).
Conclusion
18 Data now available since we last reported on diabetes services in 2012 show that the Department, its arm’s-length bodies and the NHS have made progress in reducing the additional risk of death for people with diabetes. The risk of complications for people with diabetes has been stable or has reduced for most complications. Improvements in delivering the nine recommended care processes and achieving three treatment standards between 2004 and 2010, highlighted in our previous report, are likely to have contributed to the improvements in excess mortality.
19 However, performance in delivering the nine care processes and achieving the three treatment standards is no longer improving. Very few newly diagnosed diabetes patients are recorded as attending structured education that could help them manage their diabetes. Improving performance across these areas is vital if performance in reducing the additional risk of complications and reducing additional mortality is to continue. This, in turn, will help to control the costs of diabetes, given that complications account for over two-thirds of the estimated costs of diabetes to the NHS.
20 The significant variations across England in delivering care processes, achieving treatment standards and improving outcomes for diabetes patients suggests there is considerable scope to improve diabetes services and outcomes. Addressing these variations, along with aligning financial incentives to enable care to be more integrated, will be key to ensuring outcomes for diabetes patients improve. The experiences of other countries suggest that the NHS Diabetes Prevention Programme has the potential to minimise growth in the number of people with diabetes.
The management of adult diabetes services in the NHS: progress review Summary 11
Recommendations
a Significant geographic variations persist in the quality of care for people with diabetes and in their outcomes. NHS England should set out how it intends to hold clinical commissioning groups to account for poor performance in delivering the nine care processes, the three treatment standards and longer-term outcomes.
b Information on variations in care processes and outcomes is not complete. NHS England should ensure that gaps in data are filled and that clear, high-quality information is available to help improve services. In particular it should address the following issues: not all GP practices provide data on their performance in delivering the recommended care processes and achieving all three diabetes-related treatment targets; GP practice-level data on these are currently not publicly available; and recorded take-up of patient education may not be a true picture of actual take-up.
c Some groups of diabetes patients, such as patients with type 1 diabetes, receive worse routine care and have poorer outcomes. To improve performance for groups that receive worse care and have poorer outcomes, NHS England should consider setting separate targets for different groups of diabetes patients, such as by type and age. Targets would be for the percentage of patients receiving the recommended care process and achieving all three treatment standards.
d With access to education and support, many people with diabetes can manage their condition effectively, but few people with diabetes are recorded as receiving patient education. NHS England should work with clinical commissioning groups to broaden the education offer available locally, for example by offering e-learning. It should build up an evidence base of what works in improving take-up rates, and disseminate this knowledge to commissioners.
e The percentage of hospital beds occupied by diabetes patients is increasing but levels of diabetes specialist staff have not changed. Where shortfalls in specialist diabetes staff persist, NHS England and clinical commissioning groups should ensure that hospital services comply with NICE guidance that people with diabetes admitted to hospital are cared for by appropriately trained staff.
f Current payment mechanisms within the NHS are not offering incentives to integrate diabetes care. NHS England and Monitor should examine ways to support integrated diabetes care and spread best practice from areas that are already delivering more integrated diabetes care across primary, community and hospital care settings.
12 Part One The management of adult diabetes services in the NHS: progress review
Part One
NHS services for people with diabetes
1.1 This part of the report provides an overview of diabetes, the standards of care that diabetes patients should expect to receive, the cost of diabetes to the NHS and the arrangements for commissioning diabetes services.
Background
1.2 In 2013-14, there were 2.8 million adults diagnosed with diabetes in England, with a further 400,000 people estimated to have undiagnosed diabetes.3 Diabetes is a chronic condition where the body does not produce enough insulin to regulate blood glucose levels. Normally, the amount of sugar in the blood is controlled by insulin, a hormone produced by the pancreas. When food is digested and enters the bloodstream, insulin moves any glucose out of the blood and into cells, where it is broken down to produce energy. In people with diabetes, the body cannot break down glucose into energy. The overall likelihood of developing diabetes increases with age.
1.3 There are two main types of diabetes:
• Type 1 (10% of adults with diabetes) – occurs when the body produces no insulin. People with type 1 diabetes need daily injections of insulin to survive.
• Type 2 (90% of adults with diabetes) – occurs when not enough insulin is produced by the body for it to function properly, or when the body’s cells do not react to insulin. People with type 2 diabetes need to adjust their diet and their lifestyle. Some will also need to take tablets or insulin to control their blood glucose level. The percentage of the population with type 2 diabetes is strongly associated with social deprivation and is more common in people of South Asian, African-Caribbean or Middle Eastern descent. Being overweight is the main modifiable risk factor for type 2 diabetes and around 90% of adults with type 2 diabetes are overweight or obese.
3 The estimate for people who have undiagnosed diabetes is taken from the diabetes prevalence model for local authorities available at: www.yhpho.org.uk/resource/view.aspx?RID=154049
The management of adult diabetes services in the NHS: progress review Part One 13
1.4 Diabetes is becoming more common in England with incidence varying across the country:
• The percentage of the adult population in England with diabetes more than doubled between 1996-97 and 2013-14.
• Since we last reported in 2012, the percentage of the adult population in England with diagnosed diabetes increased from 5.3% in 2009-10 to 6.2% in 2013-14 and the number of people aged 16 years or older with diagnosed diabetes has, on average, increased by 4.8% a year.
• This increase is strongly linked to rising levels of obesity amongst the adult population. In England, obese adults are five times more likely to be diagnosed with diabetes than adults of a healthy weight.
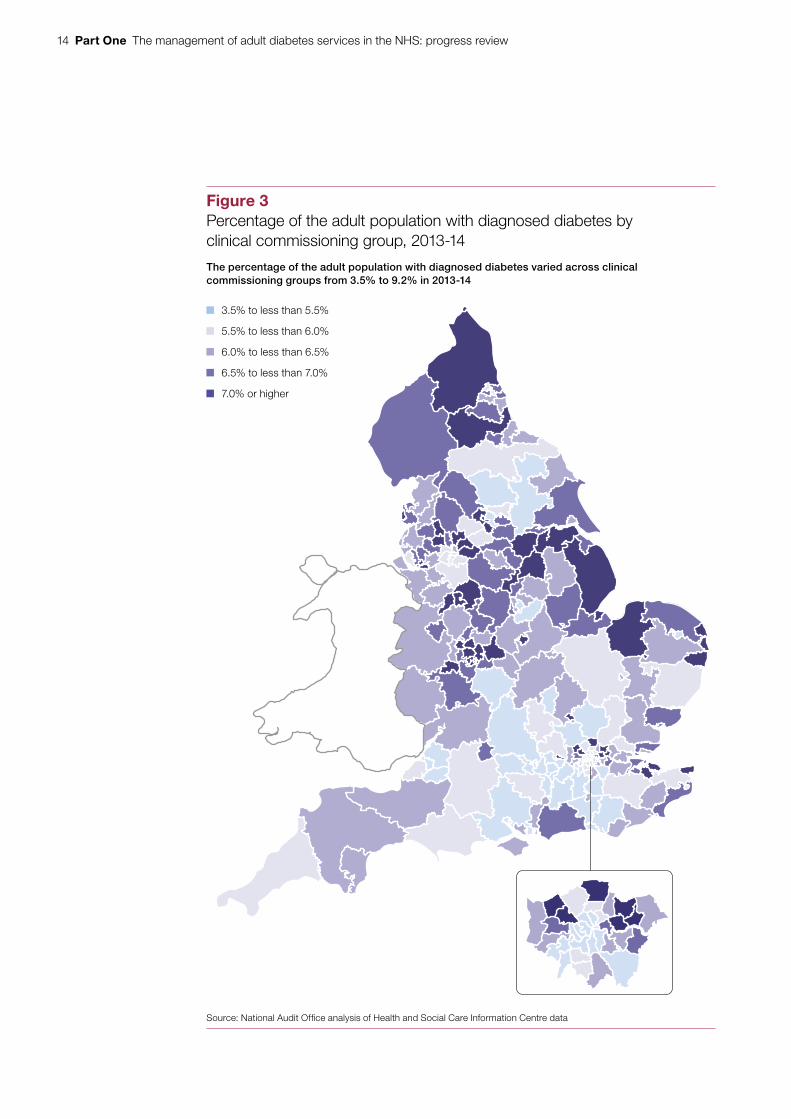
• In 2013-14, the percentage of the adult population with diagnosed diabetes varied across the country from 3.5% to 9.2% (Figure 3 overleaf).
• When the estimated number of undiagnosed people is taken into account, around 7.4% of the adult population had diabetes in 2013-14.
• By 2030, the percentage of the adult population with diabetes is expected to rise to 8.8% (4.2 million people).
Recommended standards of care
1.5 Diabetes causes damage to nerve cells and blood vessels. This has an impact on the cardiovascular system and a number of other parts of the body, such as the feet, kidneys and eyes. Poor diabetes management increases the risk of developing diabetes-related complications early. For example:
• diabetes doubles the risk of cardiovascular disease;
• diabetes is the most common reason for end-stage kidney disease and the most common cause of blindness in people of working age; and
• 135 amputations take place a week in England as a result of diabetes.
1.6 Following structured education, and with appropriate support, most people with diabetes can manage their condition themselves. However, to do so effectively they need regular clinical checks for the early indications of disease progression, such as raised cholesterol and raised blood glucose levels. If detected and managed early, the risk of developing serious complications that require more specialist care can be reduced.
14 Part One The management of adult diabetes services in the NHS: progress review
Figure 3Percentage of the adult population with diagnosed diabetes by clinical commissioning group, 2013-14
The percentage of the adult population with diagnosed diabetes varied across clinical commissioning groups from 3.5% to 9.2% in 2013-14
Source: National Audit Offi ce analysis of Health and Social Care Information Centre data
3.5% to less than 5.5%
5.5% to less than 6.0%
6.0% to less than 6.5%
6.5% to less than 7.0%
7.0% or higher
The management of adult diabetes services in the NHS: progress review Part One 15
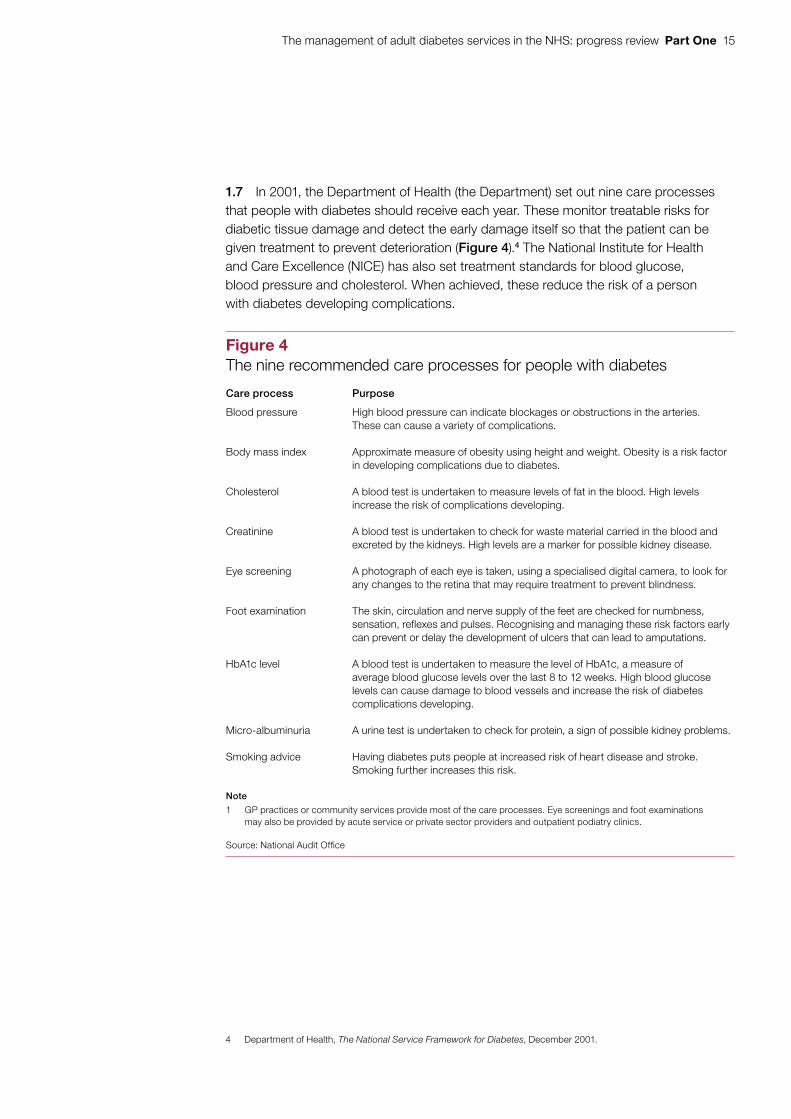
1.7 In 2001, the Department of Health (the Department) set out nine care processes that people with diabetes should receive each year. These monitor treatable risks for diabetic tissue damage and detect the early damage itself so that the patient can be given treatment to prevent deterioration (Figure 4).4 The National Institute for Health and Care Excellence (NICE) has also set treatment standards for blood glucose, blood pressure and cholesterol. When achieved, these reduce the risk of a person with diabetes developing complications.
4 Department of Health, The National Service Framework for Diabetes, December 2001.
Figure 4The nine recommended care processes for people with diabetes
Care process Purpose
Blood pressure High blood pressure can indicate blockages or obstructions in the arteries. These can cause a variety of complications.
Body mass index Approximate measure of obesity using height and weight. Obesity is a risk factor in developing complications due to diabetes.
Cholesterol A blood test is undertaken to measure levels of fat in the blood. High levels increase the risk of complications developing.
Creatinine A blood test is undertaken to check for waste material carried in the blood and excreted by the kidneys. High levels are a marker for possible kidney disease.
Eye screening A photograph of each eye is taken, using a specialised digital camera, to look for any changes to the retina that may require treatment to prevent blindness.
Foot examination The skin, circulation and nerve supply of the feet are checked for numbness, sensation, reflexes and pulses. Recognising and managing these risk factors early can prevent or delay the development of ulcers that can lead to amputations.
HbA1c level A blood test is undertaken to measure the level of HbA1c, a measure of average blood glucose levels over the last 8 to 12 weeks. High blood glucose levels can cause damage to blood vessels and increase the risk of diabetes complications developing.
Micro-albuminuria A urine test is undertaken to check for protein, a sign of possible kidney problems.
Smoking advice Having diabetes puts people at increased risk of heart disease and stroke. Smoking further increases this risk.
Note
1 GP practices or community services provide most of the care processes. Eye screenings and foot examinations may also be provided by acute service or private sector providers and outpatient podiatry clinics.
Source: National Audit Offi ce
16 Part One The management of adult diabetes services in the NHS: progress review
1.8 Diabetes-related complications account for a significant amount of hospital activity. For example, for the common conditions of angina, heart attack, heart failure and stroke, about one-fifth of total emergency bed days are related to diabetes. The percentage of beds in acute hospitals in England occupied by people with diabetes increased from 14.8% in 2010 to 15.7% in 2013.
Cost of diabetes
1.9 The estimated cost of diabetes to the NHS in the UK has been widely reported as about £10 billion a year, based on a piece of work by York Health Economics Consortium in 2012.5 In 2015, the Department revisited this work to give an estimate for England only. It took account of more detailed estimates now available and updated the methodology used. The Department estimates that the cost of diabetes to the NHS in England was £5.6 billion in 2010-11. Complications accounted for 69% of these costs. Appendix Three gives more details about how this estimate was calculated.
Commissioning diabetes services
1.10 The Department is ultimately responsible for securing value for money for spending on healthcare, including diabetes services. Following the reforms to the health system in April 2013, the Department is the steward of the system as a whole. It relies on a system of assurance around the commissioning, provision and regulation of healthcare.
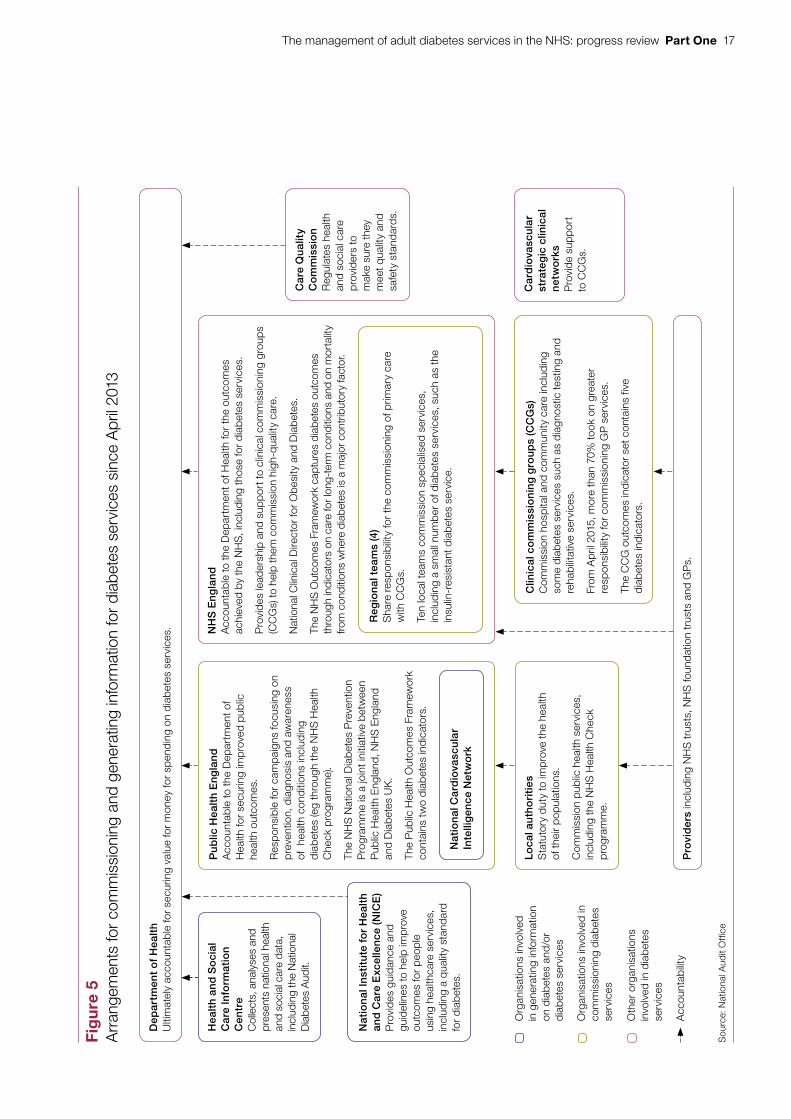
1.11 The arrangements for health services, including diabetes services, have changed since we last reported on this topic in 2012. The reforms to the health system created new structures for commissioning healthcare (Figure 5):
• Clinical commissioning groups commission diabetes services for their local populations from providers of hospital and community services. These include domiciliary care, outpatient appointments and hospital admissions.
• NHS England and clinical commissioning groups now share responsibility for commissioning GP services, which have a key role to play in delivering diabetes care locally. From April 2015, more than 70% of clinical commissioning groups took on greater responsibility for commissioning GP services.
• NHS England also commissions a few specialised diabetes services such as the insulin-resistant diabetes service, and will commission provision of behavioural interventions as part of the NHS Diabetes Prevention Programme (see paragraphs 2.7 and 2.8).
• Local authorities commission public health services, such as the NHS Health Check programme. These support the prevention, diagnosis and awareness of health conditions, including diabetes.
5 N. Hex et al., Estimating the current and future costs of type 1 and type 2 diabetes in the UK, including direct health costs and indirect societal and productivity costs, York Health Economics Consortium, University of York, Diabetic Medicine, Vol. 29, Issue 7, pp. 855–62, July 2012.
The management of adult diabetes services in the NHS: progress review Part One 17
Fig
ure
5A
rran
gem
ents
for
com
mis
sion
ing
and
gene
ratin
g in
form
atio
n fo
r di
abet
es s
ervi
ces
sinc
e A
pril
2013
Dep
artm
ent
of
Hea
lth
Ulti
mat
ely
acco
unta
ble
for
secu
ring
valu
e fo
r m
oney
for
spen
ding
on
diab
etes
ser
vice
s.
Sou
rce:
Nat
iona
l Aud
it O
ffi ce
Hea
lth
and
So
cial
C
are
Info
rmat
ion
Cen
tre
Col
lect
s, a
naly
ses
and
pres
ents
nat
iona
l hea
lth
and
soci
al c
are
data
, in
clud
ing
the
Nat
iona
l D
iabe
tes
Aud
it.
Pu
blic
Hea
lth
En
gla
nd
Acc
ount
able
to th
e D
epar
tmen
t of
Hea
lth fo
r se
curin
g im
prov
ed p
ublic
he
alth
out
com
es.
Res
pons
ible
for
cam
paig
ns fo
cusi
ng o
n pr
even
tion,
dia
gnos
is a
nd a
war
enes
s of
hea
lth c
ondi
tions
incl
udin
g di
abet
es (e
g th
roug
h th
e N
HS
Hea
lth
Che
ck p
rogr
amm
e).
The
NH
S N
atio
nal D
iabe
tes
Pre
vent
ion
Pro
gram
me
is a
join
t ini
tiativ
e be
twee
n P
ublic
Hea
lth E
ngla
nd, N
HS
Eng
land
an
d D
iabe
tes
UK
.
The
Pub
lic H
ealth
Out
com
es F
ram
ewor
k co
ntai
ns t
wo
diab
etes
indi
cato
rs.
Car
dio
vasc
ula
r st
rate
gic
clin
ical
n
etw
ork
sP
rovi
de s
uppo
rt
to C
CG
s.
Nat
ion
al C
ard
iova
scu
lar
Inte
llig
ence
Net
wo
rk
NH
S E
ng
lan
dA
ccou
ntab
le to
the
Dep
artm
ent o
f Hea
lth fo
r th
e ou
tcom
es
achi
eved
by
the
NH
S, i
nclu
ding
thos
e fo
r di
abet
es s
ervi
ces.
Pro
vide
s le
ader
ship
and
sup
port
to c
linic
al c
omm
issi
onin
g gr
oups
(C
CG
s) to
hel
p th
em c
omm
issi
on h
igh-
qual
ity c
are.
Nat
iona
l Clin
ical
Dire
ctor
for
Obe
sity
and
Dia
bete
s.
The
NH
S O
utco
mes
Fra
mew
ork
capt
ures
dia
bete
s ou
tcom
es
thro
ugh
indi
cato
rs o
n ca
re fo
r lon
g-te
rm c
ondi
tions
and
on
mor
talit
y fro
m c
ondi
tions
whe
re d
iabe
tes
is a
maj
or c
ontr
ibut
ory
fact
or.
Reg
ion
al t
eam
s (4
)S
hare
res
pons
ibili
ty fo
r th
e co
mm
issi
onin
g of
prim
ary
care
w
ith C
CG
s.
Ten
loca
l tea
ms
com
mis
sion
spe
cial
ised
ser
vice
s,
incl
udin
g a
smal
l num
ber
of d
iabe
tes
serv
ices
, suc
h as
the
insu
lin-r
esis
tant
dia
bete
s se
rvic
e.
Clin
ical
co
mm
issi
on
ing
gro
up
s (C
CG
s)C
omm
issi
on h
ospi
tal a
nd c
omm
unity
car
e in
clud
ing
som
e di
abet
es s
ervi
ces
such
as
diag
nost
ic te
stin
g an
d re
habi
litat
ive
serv
ices
.
From
Apr
il 20
15, m
ore
than
70%
took
on
grea
ter
resp
onsi
bilit
y fo
r co
mm
issi
onin
g G
P s
ervi
ces.
The
CC
G o
utco
mes
indi
cato
r se
t con
tain
s fiv
e di
abet
es in
dica
tors
.
Lo
cal a
uth
ori
ties
Sta
tuto
ry d
uty
to im
prov
e th
e he
alth
of
thei
r po
pula
tions
.
Com
mis
sion
pub
lic h
ealth
ser
vice
s,
incl
udin
g th
e N
HS
Hea
lth C
heck
pr
ogra
mm
e.
Nat
ion
al In
stit
ute
fo
r H
ealt
h an
d C
are
Exc
elle
nce
(NIC
E)
Pro
vide
s gu
idan
ce a
nd
guid
elin
es to
hel
p im
prov
e ou
tcom
es fo
r pe
ople
us
ing
heal
thca
re s
ervi
ces,
in
clud
ing
a qu
ality
sta
ndar
d fo
r di
abet
es.
Pro
vid
ers
incl
udin
g N
HS
trus
ts, N
HS
foun
datio
n tr
usts
and
GP
s.
Org
anis
atio
ns in
volv
ed
in g
ener
atin
g in
form
atio
n on
dia
bete
s an
d/o
r di
abet
es s
ervi
ces
Org
anis
atio
ns in
volv
ed in
co
mm
issi
onin
g di
abet
es
serv
ices
Oth
er o
rgan
isat
ions
in
volv
ed in
dia
bete
s se
rvic
es
Acc
ount
abili
ty
Car
e Q
ual
ity
Co
mm
issi
on
Reg
ulat
es h
ealth
an
d so
cial
car
e pr
ovid
ers
to
mak
e su
re th
ey
mee
t qua
lity
and
safe
ty s
tand
ards
.
18 Part One The management of adult diabetes services in the NHS: progress review
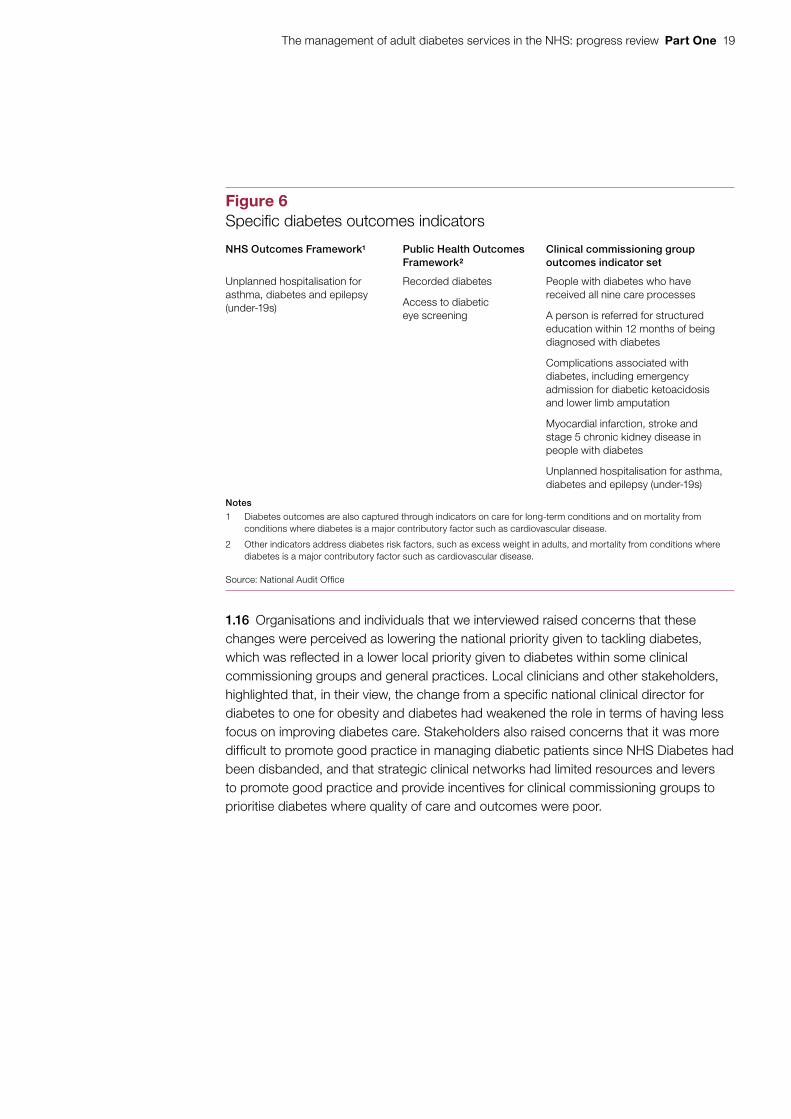
1.12 The accountability arrangements for the health system are set out in the Department’s Accounting Officer system statement.6 The Department sets objectives through an annual mandate to NHS England and a remit letter setting out expectations for Public Health England. The Department intends to measure progress against these objectives through indicators set out in outcomes frameworks for the NHS and public health. These frameworks include two specific indicators relating to diabetes, but diabetes outcomes are also captured through indicators on long-term conditions and on mortality from conditions where diabetes is a major contributing factor, such as cardiovascular disease (Figure 6).
1.13 NHS England supports the 209 clinical commissioning groups and holds them to account for delivering their statutory functions, including improving outcomes for their populations. It does this through an assurance process. NHS England has developed a clinical commissioning group outcomes indicator set containing five diabetes-related indicators (Figure 6). The Accounting Officer system statement notes that reviewing progress against these indicators forms part of NHS England’s ongoing assurance of clinical commissioning groups. Performance against the outcomes indicator set can also be used as part of clinical commissioning groups’ local accountability to their boards and to local authority health and wellbeing boards.
1.14 Public Health England supports local authorities through both advice and evidence tools. It holds to account the 152 local authorities for the money it allocates to them for the appropriate use of the public health grant. Sources of assurance include spending returns submitted to the Department for Communities and Local Government, Director of Public Health annual reports and the Public Health Outcomes Framework (containing two diabetes-related indicators). However, local authorities are ultimately accountable to their electorates for delivering outcomes.
1.15 As part of the reforms to the health system, diabetes support services changed considerably at the end of March 2013:
• The Department’s National Clinical Director for Diabetes was replaced with NHS England’s National Clinical Director for Obesity and Diabetes. The current director is a practising diabetologist, whose role is to provide clinical leadership and support in delivering improved outcomes for diabetes patients. He can draw on expertise from NHS England’s different directorates as needed.
• NHS Diabetes, which provided support to diabetes commissioners, was disbanded. The National Diabetes Information Service was incorporated into the National Cardiovascular Intelligence Network, owned by Public Health England. It aims to provide timely health intelligence to commissioners to inform the planning of cardiovascular services.
• Strategic clinical networks were established to support commissioners in four areas of healthcare, one of which is cardiovascular disease. By June 2015, 11 of the 12 regional cardiovascular strategic clinical networks had appointed a dedicated diabetes clinical lead.
6 Department of Health, Accounting Officer system statement, October 2014.
The management of adult diabetes services in the NHS: progress review Part One 19
1.16 Organisations and individuals that we interviewed raised concerns that these changes were perceived as lowering the national priority given to tackling diabetes, which was reflected in a lower local priority given to diabetes within some clinical commissioning groups and general practices. Local clinicians and other stakeholders, highlighted that, in their view, the change from a specific national clinical director for diabetes to one for obesity and diabetes had weakened the role in terms of having less focus on improving diabetes care. Stakeholders also raised concerns that it was more difficult to promote good practice in managing diabetic patients since NHS Diabetes had been disbanded, and that strategic clinical networks had limited resources and levers to promote good practice and provide incentives for clinical commissioning groups to prioritise diabetes where quality of care and outcomes were poor.
Figure 6Specifi c diabetes outcomes indicators
NHS Outcomes Framework1 Public Health Outcomes Framework2
Clinical commissioning group outcomes indicator set
Unplanned hospitalisation for asthma, diabetes and epilepsy (under-19s)
Recorded diabetes
Access to diabetic eye screening
People with diabetes who have received all nine care processes
A person is referred for structured education within 12 months of being diagnosed with diabetes
Complications associated with diabetes, including emergency admission for diabetic ketoacidosis and lower limb amputation
Myocardial infarction, stroke and stage 5 chronic kidney disease in people with diabetes
Unplanned hospitalisation for asthma, diabetes and epilepsy (under-19s)
Notes
1 Diabetes outcomes are also captured through indicators on care for long-term conditions and on mortality from conditions where diabetes is a major contributory factor such as cardiovascular disease.
2 Other indicators address diabetes risk factors, such as excess weight in adults, and mortality from conditions where diabetes is a major contributory factor such as cardiovascular disease.
Source: National Audit Offi ce
20 Part Two The management of adult diabetes services in the NHS: progress review
Part Two
Progress in delivering care processes and improving outcomes
2.1 This part of the report examines progress in:
• minimising growth in the number of people with diabetes;
• patients being offered and taking up education to help manage their diabetes;
• delivering the nine recommended care processes;
• achieving the treatment standards for cholesterol, blood pressure and blood glucose levels;
• delivering care for diabetes patients in hospital; and
• reducing diabetes-related complications and mortality.
2.2 The National Diabetes Audit is managed by the Health and Social Care Information Centre in partnership with Diabetes UK,7 and collects data on care processes and outcomes from GP practices and secondary care. The Health and Social Care Information Centre reports that the National Diabetes Audit is the largest and most comprehensive annual clinical audit in the world. Participation in the audit is voluntary. In 2012-13, 71% of GP practices in England participated in the audit compared with 88% in 2011-12. The drop in participation is likely to be the result of NHS restructuring in April 2013 and the organisational transition that preceded it.
Minimising the growth in the number of people with diabetes
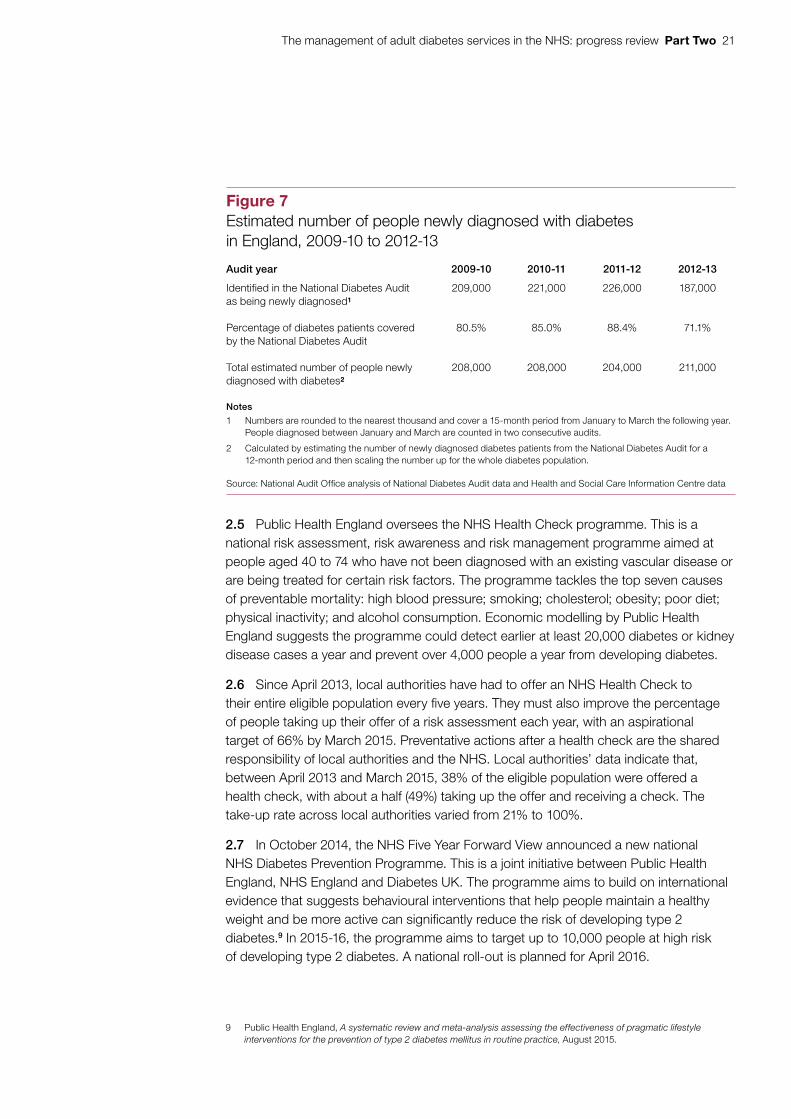
2.3 There are no precise figures for the number of people newly diagnosed with diabetes in England each year. We estimate that between 2009-10 and 2012-13, over 200,000 people a year were newly diagnosed with diabetes (Figure 7).
2.4 NHS England has set out the need for a fundamental shift towards prevention if the NHS is to remain sustainable.8 Public Health England is accountable to the Department for securing improved public health outcomes. It is responsible for campaigns focusing on prevention, diagnosis and awareness of health conditions including diabetes. Key public health activities relating to the prevention of diabetes include the NHS Health Check programme and the NHS Diabetes Prevention Programme.
7 A charity that campaigns on behalf of people affected by or at risk of diabetes.8 NHS England, Five Year Forward View, October 2014.
The management of adult diabetes services in the NHS: progress review Part Two 21
2.5 Public Health England oversees the NHS Health Check programme. This is a national risk assessment, risk awareness and risk management programme aimed at people aged 40 to 74 who have not been diagnosed with an existing vascular disease or are being treated for certain risk factors. The programme tackles the top seven causes of preventable mortality: high blood pressure; smoking; cholesterol; obesity; poor diet; physical inactivity; and alcohol consumption. Economic modelling by Public Health England suggests the programme could detect earlier at least 20,000 diabetes or kidney disease cases a year and prevent over 4,000 people a year from developing diabetes.
2.6 Since April 2013, local authorities have had to offer an NHS Health Check to their entire eligible population every five years. They must also improve the percentage of people taking up their offer of a risk assessment each year, with an aspirational target of 66% by March 2015. Preventative actions after a health check are the shared responsibility of local authorities and the NHS. Local authorities’ data indicate that, between April 2013 and March 2015, 38% of the eligible population were offered a health check, with about a half (49%) taking up the offer and receiving a check. The take-up rate across local authorities varied from 21% to 100%.
2.7 In October 2014, the NHS Five Year Forward View announced a new national NHS Diabetes Prevention Programme. This is a joint initiative between Public Health England, NHS England and Diabetes UK. The programme aims to build on international evidence that suggests behavioural interventions that help people maintain a healthy weight and be more active can significantly reduce the risk of developing type 2 diabetes.9 In 2015-16, the programme aims to target up to 10,000 people at high risk of developing type 2 diabetes. A national roll-out is planned for April 2016.
9 Public Health England, A systematic review and meta-analysis assessing the effectiveness of pragmatic lifestyle interventions for the prevention of type 2 diabetes mellitus in routine practice, August 2015.
Figure 7Estimated number of people newly diagnosed with diabetes in England, 2009-10 to 2012-13
Audit year 2009-10 2010-11 2011-12 2012-13
Identified in the National Diabetes Audit as being newly diagnosed1
209,000 221,000 226,000 187,000
Percentage of diabetes patients covered by the National Diabetes Audit
80.5% 85.0% 88.4% 71.1%
Total estimated number of people newly diagnosed with diabetes2
208,000 208,000 204,000 211,000
Notes
1 Numbers are rounded to the nearest thousand and cover a 15-month period from January to March the following year. People diagnosed between January and March are counted in two consecutive audits.
2 Calculated by estimating the number of newly diagnosed diabetes patients from the National Diabetes Audit for a 12-month period and then scaling the number up for the whole diabetes population.
Source: National Audit Offi ce analysis of National Diabetes Audit data and Health and Social Care Information Centre data
22 Part Two The management of adult diabetes services in the NHS: progress review
2.8 Public Health England, NHS England and Diabetes UK have chosen seven sites to take part in the initial phase of the programme. The sites will test ways to identify people with a high risk of developing type 2 diabetes including using the NHS Health Check. They will monitor and test their local programmes, and help co-design and implement the national programme. Local schemes include initiatives on: weight loss; physical activity; cooking and nutrition; peer support; and online support from trained professionals. Public Health England and NHS England are currently putting in place a national procurement framework for the prevention services.
Patient education
2.9 Once diagnosed with diabetes, most people can manage their condition themselves provided they receive structured education and appropriate support. National Institute for Health and Care Excellence (NICE) guidance recommends that all newly diagnosed diabetes patients be offered patient education programmes. Structured education has been shown to be effective in reducing the risk of people with diabetes developing complications. Education can improve knowledge, blood glucose control, weight and dietary management, physical activity and psychological wellbeing.10
2.10 National Diabetes Audit data showed that very few people with diabetes are recorded as having been offered structured education. Only 22% of those offered structured education are recorded as attending structured education. Figure 8 shows that, between 2009-10 and 2012-13, the percentage of newly diagnosed diabetes patients who were offered structured education increased from 7.6% to 16.4%. Those attending the education increased from 2% to 3.6%. Patients with type 2 diabetes are much more likely to be offered structured education (17.2% in 2012-13) than patients with type 1 diabetes (3.8% in 2012-13).
2.11 In 2012-13, there was significant variation in the percentage of newly diagnosed diabetes patients being offered structured education and the percentage of patients then attending the education, ranging from 0% to 58% and 0% to 22% respectively. To help improve these figures, from 2013-14, NHS England introduced an indicator covering patient education in the Quality and Outcomes Framework (see paragraph 3.3) and the clinical commissioning group outcomes indicator set.
10 Department of Health, The National Service Framework for Diabetes, December 2001.
The management of adult diabetes services in the NHS: progress review Part Two 23
2.12 A recent report by the All Party Parliamentary Group for Diabetes highlighted a number of barriers to the take-up of diabetes education and support including:11
• highly variable levels of provision across the country;
• even where provision is available people are often given little information about the aims and benefits of the education, there can be long waiting times and practical difficulties around location and timing, and courses may only partially meet people’s needs;
• many healthcare professionals do not value, or are unaware of, the benefits of education programmes, leading to a lack of referrals and where referrals are made they are poorly explained, meaning that the patient is less likely to attend;
• poor data recording on referrals and take-up of education leading to a lack of understanding of who is attending courses and who is not; and
• poor take-up of existing courses making expansion of these courses harder to justify.
11 All Party Parliamentary Group for Diabetes, Taking control: supporting people to self-manage their diabetes, March 2015.
7.6
10.411.8
16.4
2.52.03.1 3.6
0
5
10
15
20
2009-10 2010-11 2011-12 2012-13
Figure 8Percentage of newly diagnosed diabetes patients being offered or attending structured education, 2009-10 to 2012-13
Percentage offered or attended structured education (%)
In 2012-13, more newly diagnosed diabetes patients were offered or attended structured education programmes than in previous years but fewer than 4% attended the courses
Note
1 Due to issues with data quality, a patient may be recorded as attending structured education without this being recorded as offered to them. The scale of these issues means that the recorded percentage offered underestimates the true percentage offered by about one percentage point.
Source: National Audit Office analysis of National Diabetes Audit data
Offered
Attended
24 Part Two The management of adult diabetes services in the NHS: progress review
2.13 During our fieldwork, a number of individuals and organisations raised concerns that data collected by the National Diabetes Audit on the number of patients being offered and taking up education may be understated. For example, a local audit in Hull, carried out in collaboration with the Yorkshire and Humberside Cardiovascular Strategic Clinical Network, found that in 2012-13, 45% of newly diagnosed type 2 diabetes patients were offered structured education and 22% took up the offer. The National Diabetes Audit data suggested that 28% were offered structured education and fewer than 2% took up the offer. The National Diabetes Audit’s data is derived from general practice registers where the Quality and Outcomes Framework provides incentives for recording referrals, but not attendance.
Recommended care processes
2.14 In response to a recommendation by the Committee of Public Accounts,12 the Department set targets that 64% of diabetes patients should receive all nine recommended care processes by March 2015, and 80% of patients should receive them by March 2018. While we were finalising this progress review, the Department and NHS England told us that the level at which these targets were set lacked a clinical evidence base.
2.15 Until 2010-11, the National Diabetes Audit collected data on the delivery of all nine recommended care processes. In 2011-12, the (then) NHS Information Centre removed eye screening from the audit because it found that GP practices were not reporting data for this measure consistently. Data on eye screening is now reported independently through the NHS diabetic eye screening programme.
2.16 Since we last reported, performance in achieving all the care processes (excluding eye screening) has remained at around 60% (Figure 9). At this rate of progress, the Department’s targets are unlikely to be met, even though one care process has been removed. The available data predates the health system reforms and the establishment of NHS England.
2.17 For each of these care processes, performance has not changed by more that 1% over this period. Blood pressure monitoring was the most frequently completed process (95% of patients in 2012-13). The urine albumin test was the least frequently completed (73% of patients in 2012-13). Data from the NHS diabetic eye screening programme shows that 73% of patients received an eye screening in 2012-13.
2.18 People with type 1 diabetes are less likely to receive all the care processes (except eye screening) than people with type 2 diabetes, even when other factors, such as age, body mass index, ethnicity, gender and duration of diabetes are taken into account. In 2012-13, 41% of people with type 1 diabetes received all the care processes (except eye screening) compared with 61% of people with type 2 diabetes. People aged under 40 are less likely to receive all the care processes compared with older people for both type 1 and type 2 diabetes, with those with type 1 diabetes showing a bigger difference in receiving all the care processes than those with type 2 diabetes.
12 HC Committee of Public Accounts, The management of adult diabetes services in the NHS, Seventeenth Report of Session 2012-13, HC 289, November 2012.
The management of adult diabetes services in the NHS: progress review Part Two 25
Figure 9Percentage of registered patients receiving all the recommendedcare processes in England, 2009-10 to 2012-13
Percentage of patients (%)
Performance in the percentage of patients receiving all the care processes has plateaued
Note
1 From 2011-12, the National Diabetes Audit has only reported on eight of the nine care processes. The Healthand Social Care Information Centre removed eye screening because it found that data for this measure wasnot reported consistently.
Source: National Audit Office analysis of National Diabetes Audit data
Receiving all nine care processes
Receiving all eight care processes
0
10
20
30
40
50
60
70
80
2009-10 2010-11 2011-12 2012-13
64% target byMarch 2015 for thenine care processes
80% target byMarch 2018 for thenine care processes
50.1
59.2
54.3
60.5 60.2 59.3
26 Part Two The management of adult diabetes services in the NHS: progress review
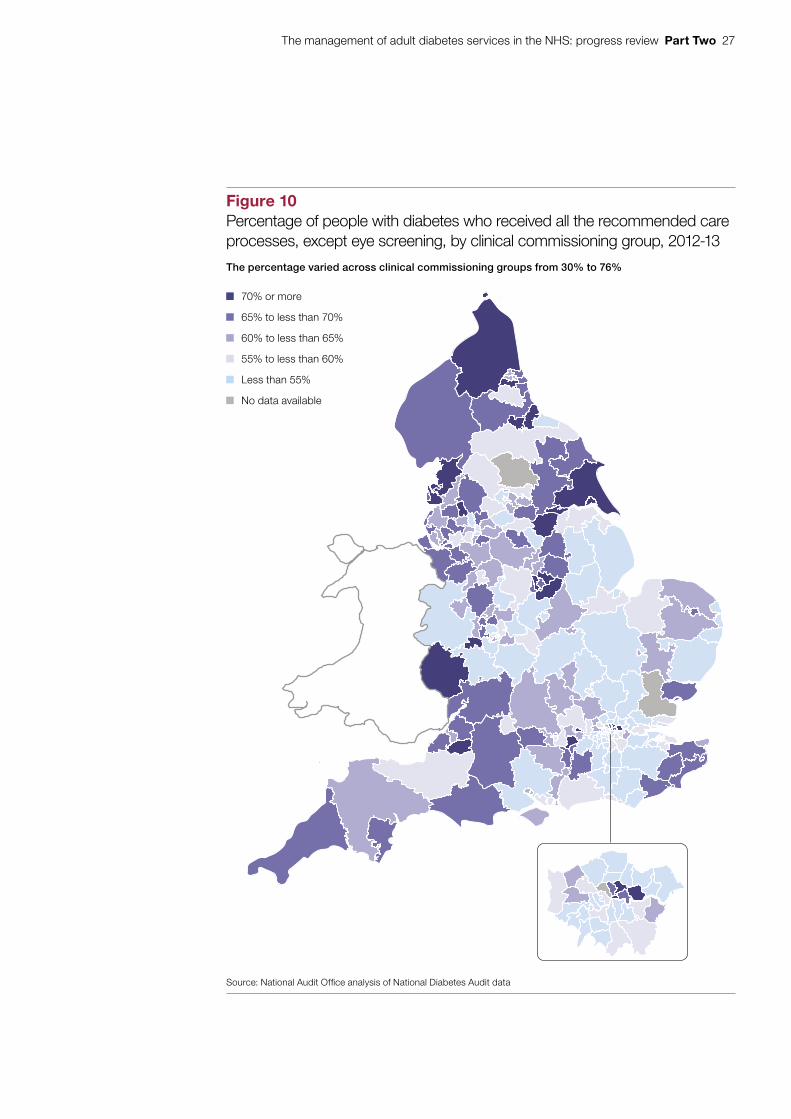
2.19 In 2012-13, there was significant geographical variation in the percentage of people with diabetes receiving all the recommended care processes (except eye screening). This ranged from 30% to 76% across clinical commissioning groups (Figure 10). Between 2009-10 and 2012-13:
• the 21 lowest-performing areas (10% of all areas) in 2009-10 improved performance by an average of 22 percentage points; and
• performance worsened by over ten percentage points in 10% of areas.
Achievement of treatment standards
2.20 The risk of developing diabetic complications can be minimised by early detection and management of high levels of blood glucose (measured using HbA1c), blood pressure and cholesterol. In response to a recommendation by the Committee of Public Accounts,13 the Department set targets that by March 2015, 21% of diabetes patients, and by March 2018, 40% of diabetes patients, should be achieving NICE’s then recommended treatment standards for all three outcomes (blood pressure less than 140/80, cholesterol less than 5 mmol/l and HbA1c of 7.5% or less). The Department noted that it is not clinically appropriate to meet all three levels in all instances.
2.21 The Health and Social Care Information Centre reports on the achievement of all three NICE treatment standards using data collected from the National Diabetes Audit. For cholesterol, it uses a target of less than 5 mmol/l, in line with the Quality and Outcomes Framework target for cholesterol. In 2012-13, the Health and Social Care Information Centre also modified the blood pressure standard, from less than 140/80 to less than or equal to 140/80 to align it with the Quality and Outcomes Framework standard for blood pressure. This change was in response to feedback from GP practices that GPs tend to round the reading when recording this information. Data on the original standard are no longer collected.
2.22 Figure 11 on page 28 shows that, since we last reported, the percentage of patients achieving all three treatment standards has improved, from 19.4% to 36.0%. The small modification to the blood pressure standard resulted in a relatively large change (15 percentage points) in the percentage of patients achieving all three treatment standards. The available data predates the health system reforms and the establishment of NHS England. The data indicated that the Department was on course to meet the March 2015 target for all three NICE treatment standards. However, it is unlikely to achieve the March 2018 target for all three NICE treatment standards, unless a step change in performance is achieved.
2.23 Between 2009-10 and 2012-13, the percentage of people with diabetes achieving:
• the NICE blood glucose standard fell slightly from 63.3% to 62.4%;
• the NICE cholesterol standard fell slightly from 39.9% to 39.6%; and
• the revised blood pressure standard increased from 61.4% to 69.0%.
13 HC Committee of Public Accounts, The management of adult diabetes services in the NHS, Seventeenth Report of Session 2012-13, HC 289, November 2012.
The management of adult diabetes services in the NHS: progress review Part Two 27
Figure 10Percentage of people with diabetes who received all the recommended care processes, except eye screening, by clinical commissioning group, 2012-13
The percentage varied across clinical commissioning groups from 30% to 76%
Source: National Audit Offi ce analysis of National Diabetes Audit data
70% or more
65% to less than 70%
60% to less than 65%
55% to less than 60%
Less than 55%
No data available
28 Part Two The management of adult diabetes services in the NHS: progress review
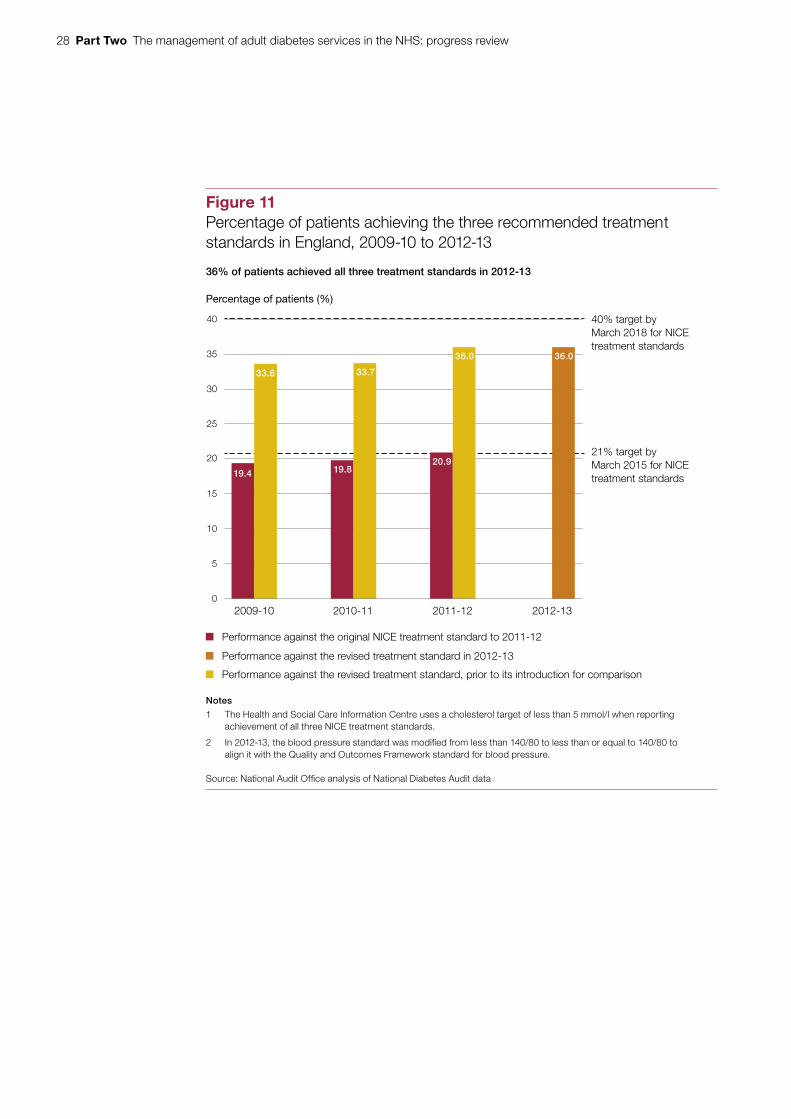
Figure 11Percentage of patients achieving the three recommended treatmentstandards in England, 2009-10 to 2012-13
Percentage of patients (%)
36% of patients achieved all three treatment standards in 2012-13
Notes
1 The Health and Social Care Information Centre uses a cholesterol target of less than 5 mmol/l when reporting achievement of all three NICE treatment standards.
2 In 2012-13, the blood pressure standard was modified from less than 140/80 to less than or equal to 140/80 toalign it with the Quality and Outcomes Framework standard for blood pressure.
Source: National Audit Office analysis of National Diabetes Audit data
Performance against the original NICE treatment standard to 2011-12
Performance against the revised treatment standard in 2012-13
Performance against the revised treatment standard, prior to its introduction for comparison
2009-10 2010-11 2011-12 2012-13
21% target byMarch 2015 for NICE treatment standards
40% target byMarch 2018 for NICE treatment standards
0
5
10
15
20
25
30
35
40
19.4
33.6
19.8
33.7
20.9
36.0 36.0
The management of adult diabetes services in the NHS: progress review Part Two 29
2.24 A lower percentage of people with type 1 diabetes achieved all three treatment standards (16.3% in 2012-13) than people with type 2 diabetes (37.5% in 2012-13). In addition, as people get older they are more likely to achieve the treatment standards.
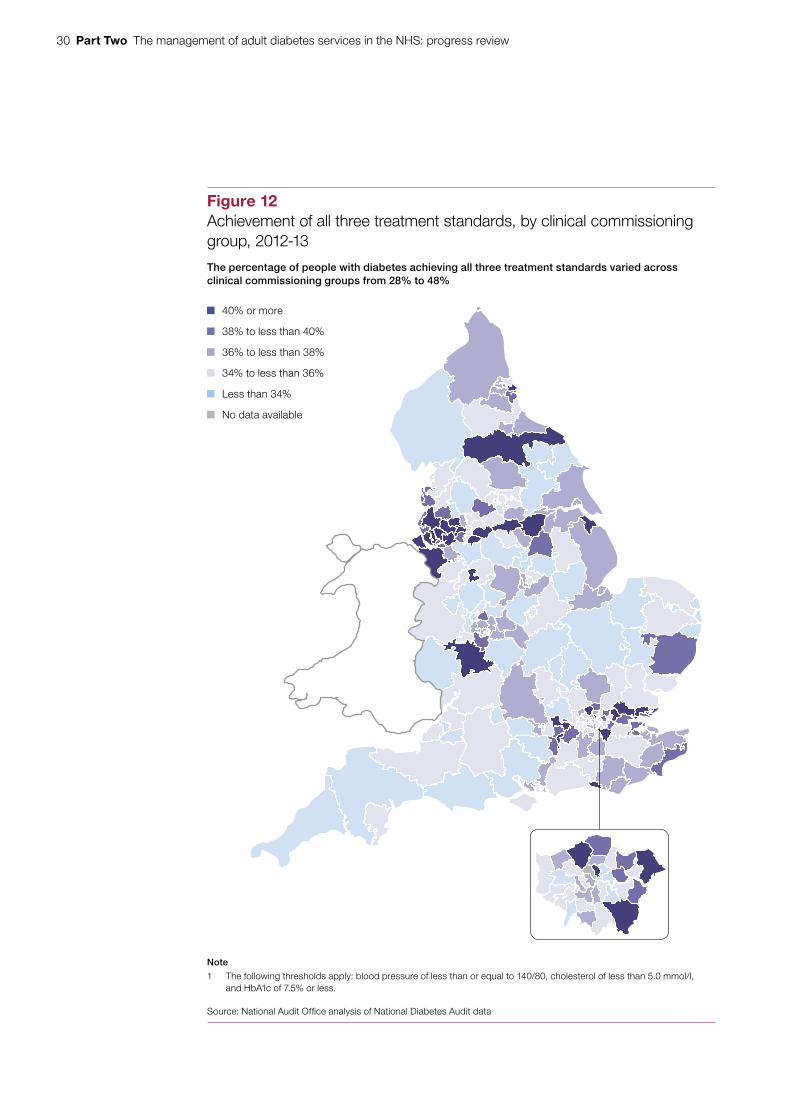
2.25 In 2012-13, there was significant geographical variation in the percentage of people with diabetes achieving all three treatment standards (Figure 12 overleaf), ranging from 28% to 48% across clinical commissioning groups. Between 2009-10 and 2012-13, the range in variation reduced from 21.9 percentage points to 20.2 percentage points but performance worsened in almost one-fifth of areas (19%).
2.26 Data from the Quality and Outcomes Framework (see paragraph 3.3) indicate that variation in achieving treatment standards is even wider between GP practices. In 2012-13, the percentage of people with diabetes achieving individual treatment standards varied from about 10% to 100%, excluding practices with fewer than 10 patients with diabetes. Data on the percentage of people with diabetes achieving all three treatment standards across GP practices are not currently published, but the Health and Social Care Information Centre plans to make this available when it releases the National Diabetes Audit for 2013-14.
2.27 In 2015, NICE updated its HbA1c target for both type 1 and type 2 diabetes patients. The new type 1 diabetes guideline, published in August 2015, and draft type 2 diabetes guideline, both recommended that healthcare professionals support diabetes patients to aim for a HbA1c target of 6.5%, emphasising the need for individualised care, which may extend to HbA1c targets for individual patients.
Care for diabetes patients in hospital
2.28 Data from the National Diabetes Inpatient Audit indicate that some aspects of diabetes care in hospitals in England are improving. For example, between 2010 and 2013:
• the percentage of diabetes patients receiving a foot examination during their hospital stay increased from 29% to 44%;
• the proportion of drugs charts with one or more medication errors reduced from 44% to 37%; and
• the percentage of patients that had one or more severe low blood sugar episodes reduced from 12% to 9%.
However, the percentage of patients with a severe low blood sugar episode requiring injectable treatment – a life-threatening event – has remained at just over 2%.
30 Part Two The management of adult diabetes services in the NHS: progress review
Figure 12Achievement of all three treatment standards, by clinical commissioninggroup, 2012-13
The percentage of people with diabetes achieving all three treatment standards varied across clinical commissioning groups from 28% to 48%
Note
1 The following thresholds apply: blood pressure of less than or equal to 140/80, cholesterol of less than 5.0 mmol/l, and HbA1c of 7.5% or less.
Source: National Audit Offi ce analysis of National Diabetes Audit data
40% or more
38% to less than 40%
36% to less than 38%
34% to less than 36%
Less than 34%
No data available
The management of adult diabetes services in the NHS: progress review Part Two 31
2.29 Most patients in hospital with diabetes are admitted for other conditions and are therefore not under the care of a diabetes consultant. Guidance from NICE recommends that people with diabetes admitted to hospital are cared for by appropriately trained staff and given access to a specialist diabetes team. Between 2010 and 2013, the proportion of patients seen by a member of a hospital diabetes team increased from 31% to 35% and the number of hospitals with multidisciplinary foot care teams increased from 61% to 73%. However, diabetes specialist staffing levels have not significantly changed and 30% of hospitals in England taking part in the audit still had no diabetes inpatient specialist nurse and 6% did not have any consultant time for diabetes inpatient care.
2.30 Data on patients’ experience of hospital inpatient stays are collected through the National Diabetes Inpatient Audit. These data show that, between 2010 and 2013, patient satisfaction measures did not improve. For example:
• 55% of patients reported that they were able to take control of their own diabetes care while in hospital to the extent they would have liked in 2013 – compared with 56% in 2010; and
• 85% of patients reported that the hospital provided suitable meals to manage their diabetes in 2013, compared with 87% in 2010.
Complications and mortality
2.31 People with diabetes are significantly more likely to develop certain complications, such as stroke, kidney disease and amputation, than people without diabetes. In addition, those with type 1 diabetes are at much greater risk of developing complications than those with type 2 diabetes, due to the fact that type 1 diabetes is generally developed at a younger age than type 2 diabetes and its duration is longer. The rates of diabetes-related complications are used as measures of the final outcomes of care. Most complications take a number of years to develop and therefore indicate the quality of long-term care. For those diabetes patients who develop complications, life expectancy is severely reduced.
Complications
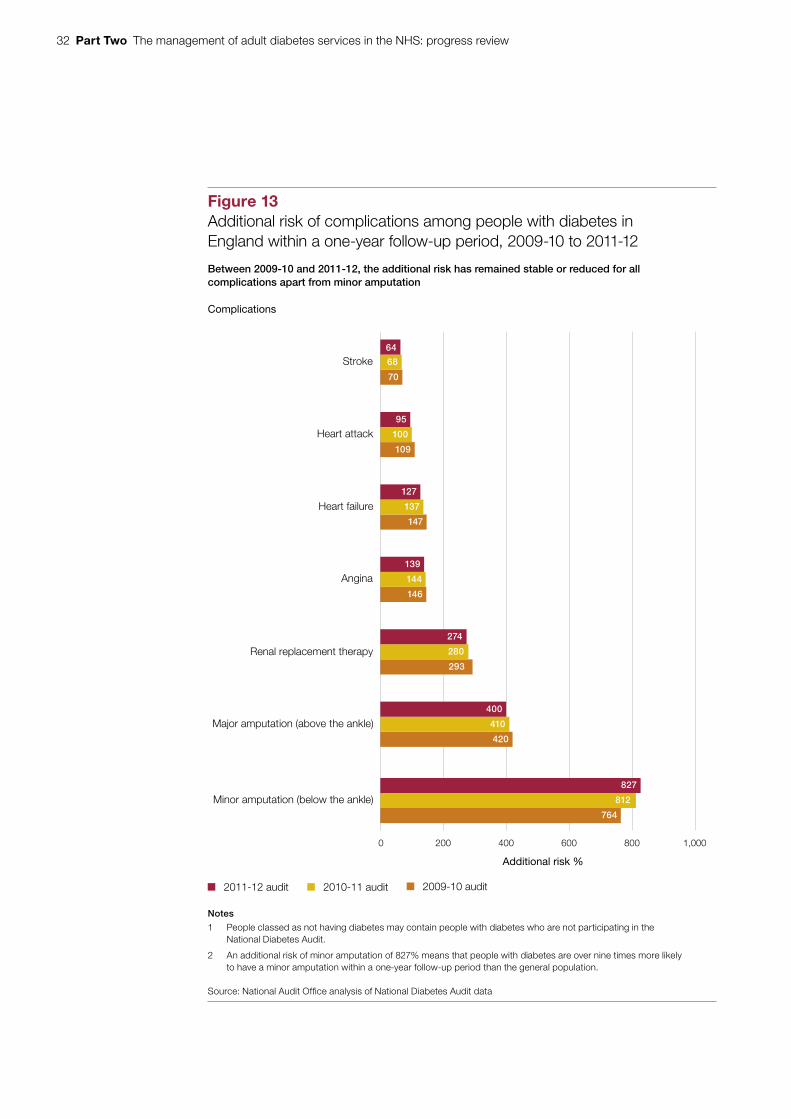
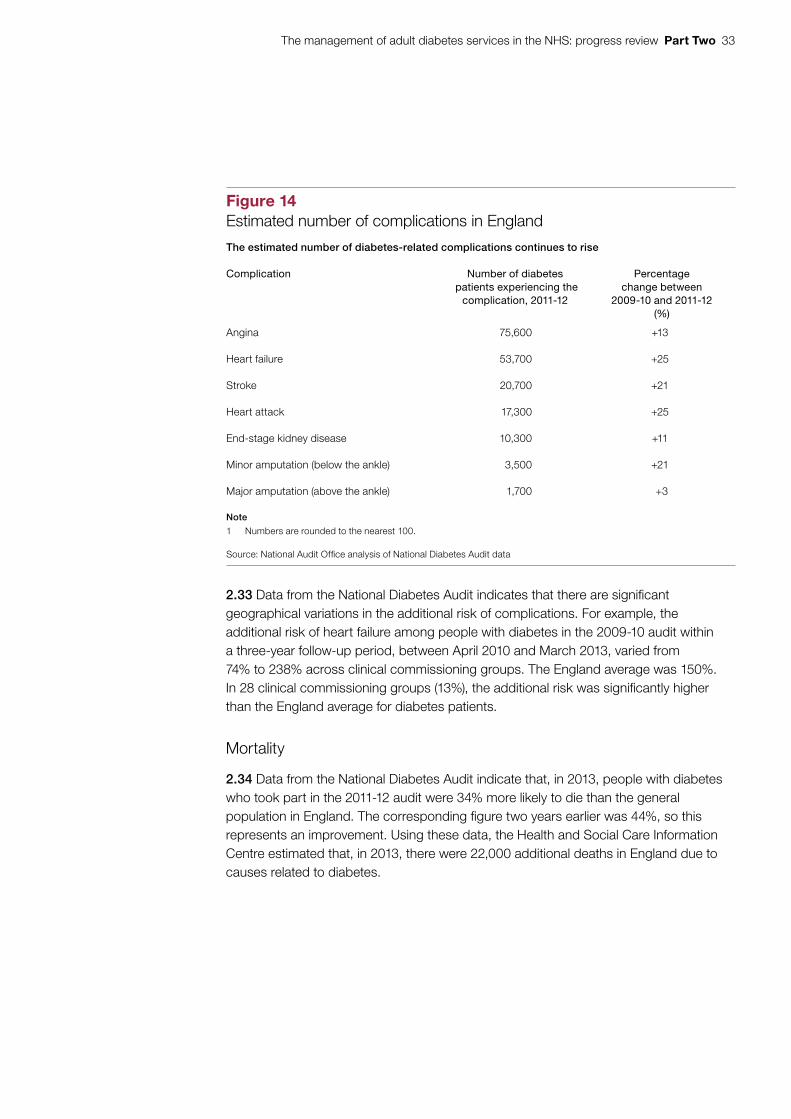
2.32 Between 2009-10 and 2011-12, the additional risk of most complications among people with diabetes was stable or reduced, apart from minor amputation surgery (Figure 13 overleaf). The increasing risk of minor amputation may partly reflect a decrease in major amputations. The decline in additional risk of heart failure is the only statistically significant change over this period. The increasing number of people with diabetes, however, means that the absolute number of people with complications is continuing to rise (Figure 14 on page 33).
32 Part Two The management of adult diabetes services in the NHS: progress review
Figure 13Additional risk of complications among people with diabetes inEngland within a one-year follow-up period, 2009-10 to 2011-12
Between 2009-10 and 2011-12, the additional risk has remained stable or reduced for all complications apart from minor amputation
Complications
Notes
1 People classed as not having diabetes may contain people with diabetes who are not participating in theNational Diabetes Audit.
2 An additional risk of minor amputation of 827% means that people with diabetes are over nine times more likelyto have a minor amputation within a one-year follow-up period than the general population.
Source: National Audit Office analysis of National Diabetes Audit data
2010-11 audit2011-12 audit 2009-10 audit
0 200 400 600 800 1,000
Minor amputation (below the ankle)
Major amputation (above the ankle)
Renal replacement therapy
Angina
Heart failure
Heart attack
Stroke
Additional risk %
64
68
70
95
100
109
127
137
147
139
144
146
274
280
293
400
410
420
827
812
764
The management of adult diabetes services in the NHS: progress review Part Two 33
Figure 14Estimated number of complications in England
The estimated number of diabetes-related complications continues to rise
Complication Number of diabetes patients experiencing the
complication, 2011-12
Percentage change between
2009-10 and 2011-12(%)
Angina 75,600 +13
Heart failure 53,700 +25
Stroke 20,700 +21
Heart attack 17,300 +25
End-stage kidney disease 10,300 +11
Minor amputation (below the ankle) 3,500 +21
Major amputation (above the ankle) 1,700 +3
Note
1 Numbers are rounded to the nearest 100.
Source: National Audit Offi ce analysis of National Diabetes Audit data
2.33 Data from the National Diabetes Audit indicates that there are significant geographical variations in the additional risk of complications. For example, the additional risk of heart failure among people with diabetes in the 2009-10 audit within a three-year follow-up period, between April 2010 and March 2013, varied from 74% to 238% across clinical commissioning groups. The England average was 150%. In 28 clinical commissioning groups (13%), the additional risk was significantly higher than the England average for diabetes patients.
Mortality
2.34 Data from the National Diabetes Audit indicate that, in 2013, people with diabetes who took part in the 2011-12 audit were 34% more likely to die than the general population in England. The corresponding figure two years earlier was 44%, so this represents an improvement. Using these data, the Health and Social Care Information Centre estimated that, in 2013, there were 22,000 additional deaths in England due to causes related to diabetes.
34 Part Two The management of adult diabetes services in the NHS: progress review
2.35 A review of international data published in 2013 showed that, in 2010, the UK had the lowest rates of early death due to diabetes of the 19 countries covered.14 Improvements in delivering the nine care processes and achieving three treatment standards between 2003-04 and 2009-10 – highlighted in our previous report on diabetes services15 – are likely to have contributed to the improvements in excess mortality. For example, the percentage of patients receiving all nine care processes increased from 7% to 50% over this period.
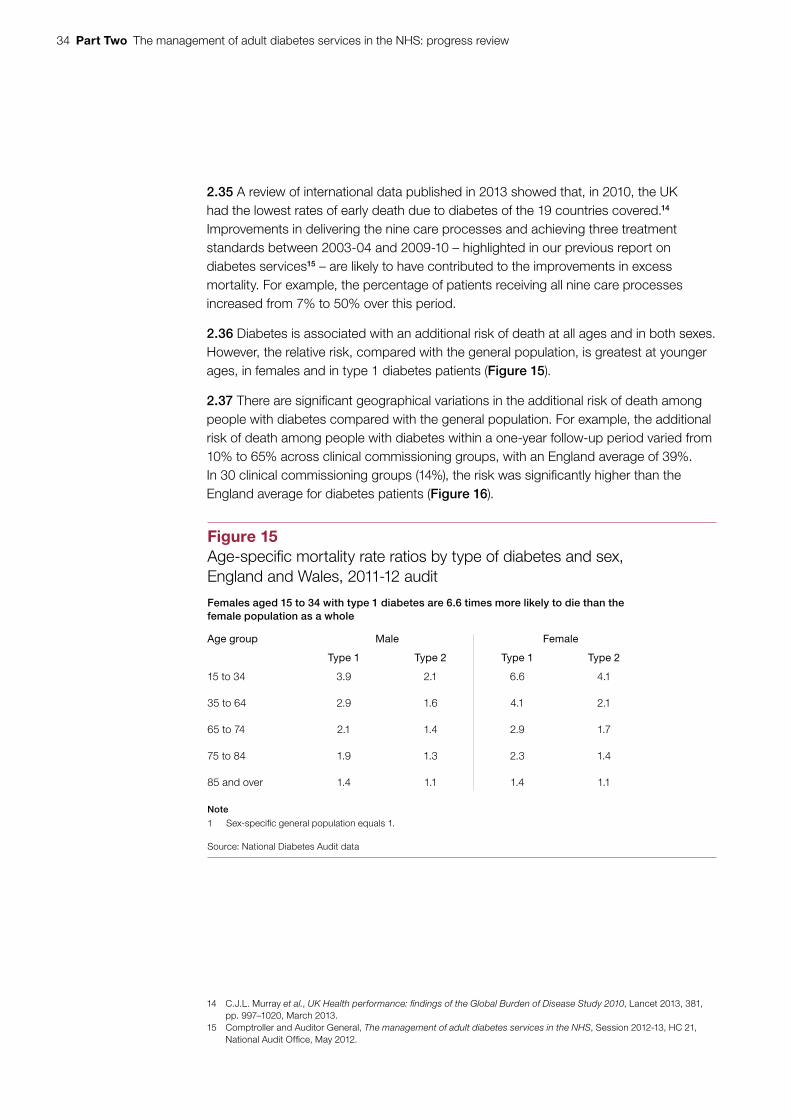
2.36 Diabetes is associated with an additional risk of death at all ages and in both sexes. However, the relative risk, compared with the general population, is greatest at younger ages, in females and in type 1 diabetes patients (Figure 15).
2.37 There are significant geographical variations in the additional risk of death among people with diabetes compared with the general population. For example, the additional risk of death among people with diabetes within a one-year follow-up period varied from 10% to 65% across clinical commissioning groups, with an England average of 39%. In 30 clinical commissioning groups (14%), the risk was significantly higher than the England average for diabetes patients (Figure 16).
14 C.J.L. Murray et al., UK Health performance: findings of the Global Burden of Disease Study 2010, Lancet 2013, 381, pp. 997–1020, March 2013.
15 Comptroller and Auditor General, The management of adult diabetes services in the NHS, Session 2012-13, HC 21, National Audit Office, May 2012.
Figure 15Age-specifi c mortality rate ratios by type of diabetes and sex,England and Wales, 2011-12 audit
Females aged 15 to 34 with type 1 diabetes are 6.6 times more likely to die than the female population as a whole
Age group Male Female
Type 1 Type 2 Type 1 Type 2
15 to 34 3.9 2.1 6.6 4.1
35 to 64 2.9 1.6 4.1 2.1
65 to 74 2.1 1.4 2.9 1.7
75 to 84 1.9 1.3 2.3 1.4
85 and over 1.4 1.1 1.4 1.1
Note
1 Sex-specifi c general population equals 1.
Source: National Diabetes Audit data
The management of adult diabetes services in the NHS: progress review Part Two 35
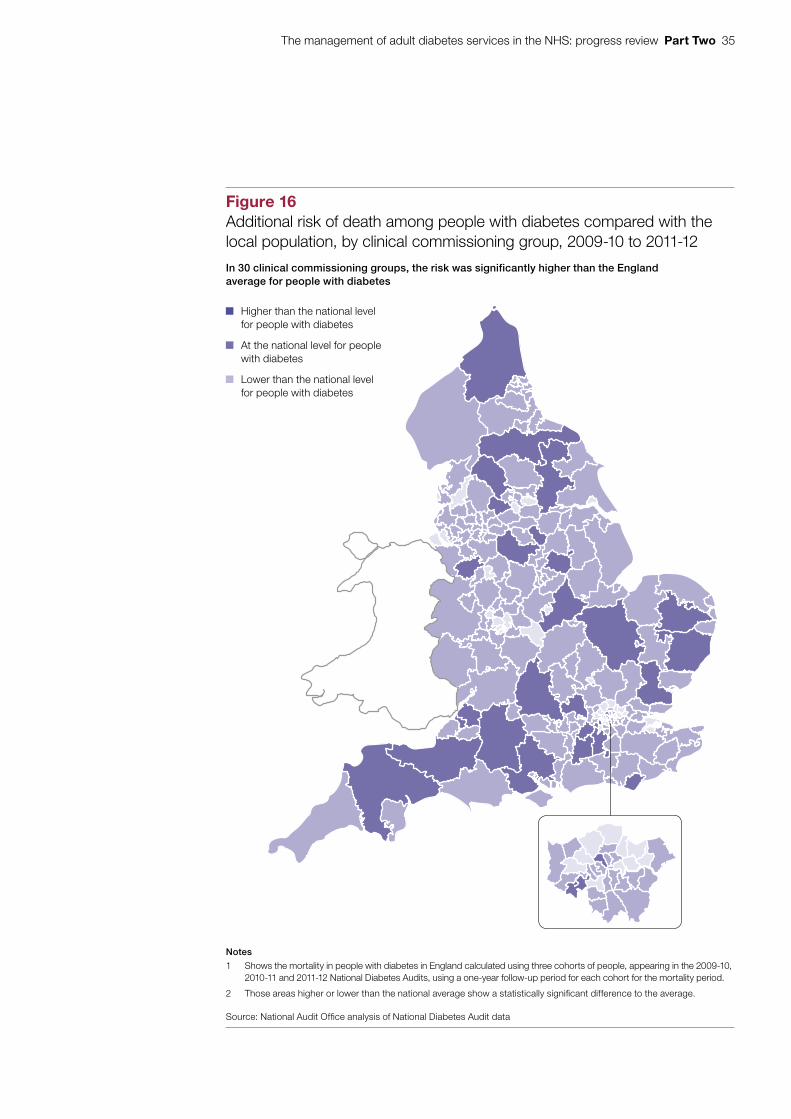
Figure 16Additional risk of death among people with diabetes compared with the local population, by clinical commissioning group, 2009-10 to 2011-12
In 30 clinical commissioning groups, the risk was significantly higher than the Englandaverage for people with diabetes
Notes
1 Shows the mortality in people with diabetes in England calculated using three cohorts of people, appearing in the 2009-10, 2010-11 and 2011-12 National Diabetes Audits, using a one-year follow-up period for each cohort for the mortality period.
2 Those areas higher or lower than the national average show a statistically signifi cant difference to the average.
Source: National Audit Offi ce analysis of National Diabetes Audit data
Higher than the national levelfor people with diabetes
At the national level for people with diabetes
Lower than the national levelfor people with diabetes
36 Part Three The management of adult diabetes services in the NHS: progress review
Part Three
Improving the performance of diabetes services
3.1 This part of the report examines interventions that NHS England, Public Health England and NHS organisations have made to support local improvements in diabetes care, since our last report on diabetes in 2012. It covers:
• incentives for health professionals to deliver better diabetes care and provide more integrated diabetes services; and
• tools and information available to support improvements in diabetes care and its commissioning.
3.2 One of NHS England’s roles is to support the NHS commissioning system to deliver improved outcomes for patients. In response to the Committee of Public Accounts’ report on adult diabetes services,16 NHS England published a document in January 2014 that presented all the actions it was taking, and planned to take, to:
• prevent type 2 diabetes;
• improve early diagnosis of all diabetes; and
• support the management of diabetes in primary care.17
Incentives for health professionals
3.3 The Quality and Outcomes Framework is a voluntary annual reward and incentive programme for all GP practices in England. It is based on the percentage of patients at GP practices receiving recommended care, and achieving standards for specific clinical indicators (including diabetes), to improve health outcomes. In 2012, the Committee of Public Accounts noted that, although the framework had initially improved diabetes outcomes in primary care, it was not driving the required outcomes.18 The Committee noted that GP practices were paid for each individual test they carried out rather than being rewarded for ensuring all nine care processes were delivered.
16 HC Committee of Public Accounts, The management of adult diabetes services in the NHS, Seventeenth Report of Session 2012-13, HC 289, November 2012.
17 NHS England, Action on diabetes, January 2014.18 HC Committee of Public Accounts, The management of adult diabetes services in the NHS, Seventeenth Report
of Session 2012-13, HC 289, November 2012.
The management of adult diabetes services in the NHS: progress review Part Three 37
3.4 In 2014, the National Institute for Health and Care Excellence (NICE) proposed a ‘bundled’ diabetes indicator for 2015-16 covering eight of the basic care processes. However, the proposal was not accepted by the British Medical Association’s General Practitioners’ Committee and by NHS Employers (on behalf of NHS England) during negotiations on the GP contract for 2015-16. For 2015-16, there are 11 diabetes indicators representing 15% of the total points available, including the three treatment standards and an indicator for structured education, but not all nine care processes.
3.5 Other incentives relevant to diabetes services include:
• Best practice tariffs
In April 2013, Monitor and NHS England introduced best practice tariffs to pay providers for diabetic ketoacidosis and hypoglycaemia, serious complications caused by a lack of insulin and low blood glucose levels respectively. The aim of these tariffs is to ensure the involvement of a diabetes specialist team and patient access to a structured education programme.
• The Commissioning for Quality and Innovation payment framework
This helps commissioners improve the quality of services by linking a proportion of a provider’s income to the achievement of local quality improvement goals. The payment is set at 2.5% of the value of all services commissioned through the NHS standard contract. Commissioners choose national and local indicators to include in the scheme. One local indicator covering gestational diabetes is available for commissioners to choose.
• The quality premium paid by NHS England
This rewards clinical commissioning groups for improvements in the quality of the services they commission and for associated improvements in health outcomes and reductions in inequalities in access and in health outcomes. The premium paid reflects the quality of the health services commissioned in the previous financial year, based on both national and local priorities. Commissioners may include a diabetes measure in their local priorities.
3.6 Better integrated diabetes care has been shown to improve patient experience, quality of clinical care and reduce hospital admissions for vulnerable patients.19 In 2012, the Committee of Public Accounts noted that the payments system for hospitals (payment by results) did not offer incentives providing the multidisciplinary care required to treat diabetes. Most of the organisations we spoke to during our fieldwork told us that current organisation-based funding models do not encourage more integrated diabetes care. Where more integrated care is being delivered, this has been achieved despite the system, not because of it.
19 NHS Diabetes and Diabetes UK, Best practice for commissioning diabetes services – an integrated care framework, March 2013.
38 Part Three The management of adult diabetes services in the NHS: progress review
3.7 A number of key enablers of integrated diabetes care have been identified from our fieldwork and literature review:
• Ensuring all providers along a patient’s care pathway have access to the patient’s data – this means patients can be referred to the right healthcare professionals and ‘at risk’ patients can be identified.
• Providing effective clinical engagement and leadership, which is fundamental to delivering integrated care – commissioners, providers, clinicians and people with diabetes should work together in local networks to organise the whole care pathway.
• Improving the skills of the primary care workforce, with specialists on call to provide advice and support to primary care colleagues – this means that more people can be given high-quality care in the community while specialists focus on the most complex or unusual cases.
• Planning care collaboratively, so that clinicians and patients work together to agree goals, identify support needs and develop and implement action plans.
3.8 NHS England is developing a year-of-care funding model for long-term conditions. This aims to provide a financial framework for commissioners and providers to work with locally, when funding care for people with long-term conditions, including diabetes. In addition, in March 2015, NHS England established 29 vanguard sites that aim to develop new care models focusing on closer collaboration and integration of services.
Tools and information
3.9 The outcomes indicator set for clinical commissioning groups gives comparative information for clinical commissioning groups, health and wellbeing boards and local authorities on the quality of diabetes services and their associated health outcomes. It uses five diabetes indicators (see Figure 6, page 19). Clinical commissioning groups can use this information to identify areas for improvement.
3.10 The Commissioning for Value programme, run by NHS Right Care,20 NHS England and Public Health England, provides insight packs to help clinical commissioning groups identify opportunities to transform and improve the quality and outcomes of the services they commission. Figure 17 provides an example of a clinical commissioning group that has used its Commissioning for Value pack to help improve diabetes services. As part of this programme, in 2014-15, NHS England published a Pathways on a Page pack, which includes a diabetes pathway. This presents information for each clinical commissioning group, and compares its performance to ten similar clinical commissioning groups. The information covers nine indicators along the diabetes pathway from initial contact to end of treatment. These indicators include the percentage of the local population with diabetes, care processes and outcomes.
20 Provides tools and support to help commissioners get best value from commissioning health services.
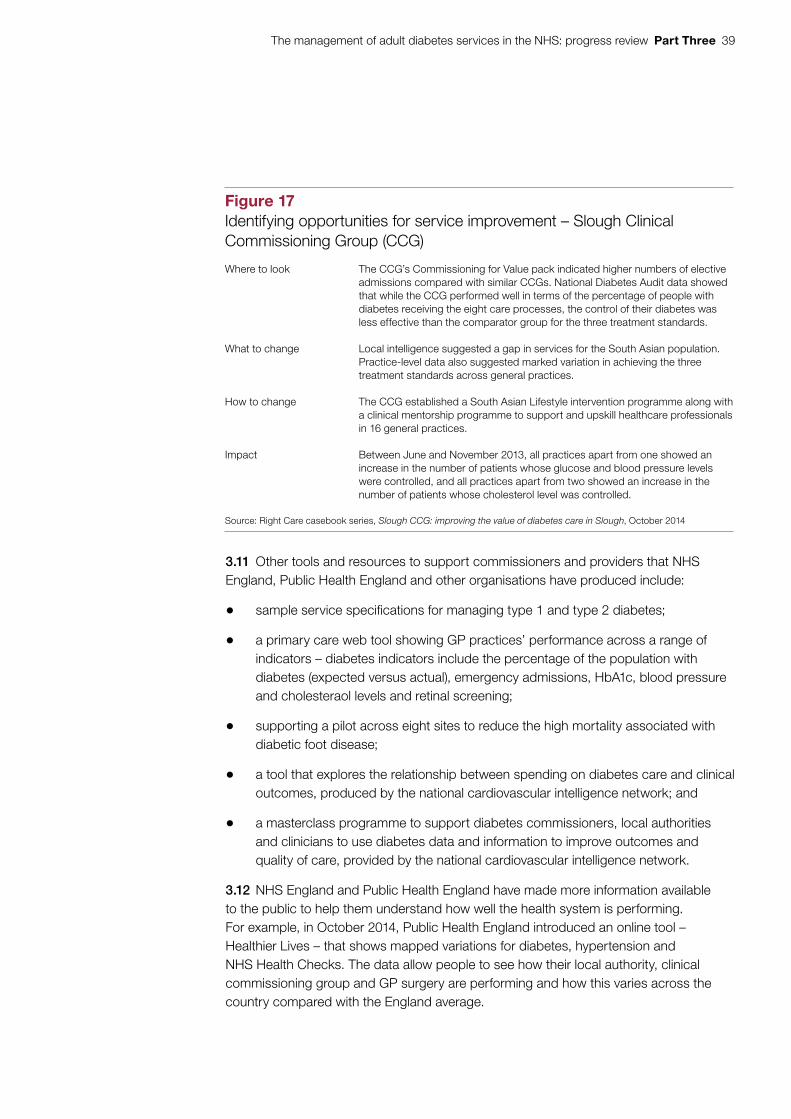
The management of adult diabetes services in the NHS: progress review Part Three 39
3.11 Other tools and resources to support commissioners and providers that NHS England, Public Health England and other organisations have produced include:
• sample service specifications for managing type 1 and type 2 diabetes;
• a primary care web tool showing GP practices’ performance across a range of indicators – diabetes indicators include the percentage of the population with diabetes (expected versus actual), emergency admissions, HbA1c, blood pressure and cholesteraol levels and retinal screening;
• supporting a pilot across eight sites to reduce the high mortality associated with diabetic foot disease;
• a tool that explores the relationship between spending on diabetes care and clinical outcomes, produced by the national cardiovascular intelligence network; and
• a masterclass programme to support diabetes commissioners, local authorities and clinicians to use diabetes data and information to improve outcomes and quality of care, provided by the national cardiovascular intelligence network.
3.12 NHS England and Public Health England have made more information available to the public to help them understand how well the health system is performing. For example, in October 2014, Public Health England introduced an online tool – Healthier Lives – that shows mapped variations for diabetes, hypertension and NHS Health Checks. The data allow people to see how their local authority, clinical commissioning group and GP surgery are performing and how this varies across the country compared with the England average.
Figure 17Identifying opportunities for service improvement – Slough Clinical Commissioning Group (CCG)
Where to look The CCG’s Commissioning for Value pack indicated higher numbers of elective admissions compared with similar CCGs. National Diabetes Audit data showed that while the CCG performed well in terms of the percentage of people with diabetes receiving the eight care processes, the control of their diabetes was less effective than the comparator group for the three treatment standards.
What to change Local intelligence suggested a gap in services for the South Asian population. Practice-level data also suggested marked variation in achieving the three treatment standards across general practices.
How to change The CCG established a South Asian Lifestyle intervention programme along with a clinical mentorship programme to support and upskill healthcare professionals in 16 general practices.
Impact Between June and November 2013, all practices apart from one showed an increase in the number of patients whose glucose and blood pressure levels were controlled, and all practices apart from two showed an increase in the number of patients whose cholesterol level was controlled.
Source: Right Care casebook series, Slough CCG: improving the value of diabetes care in Slough, October 2014
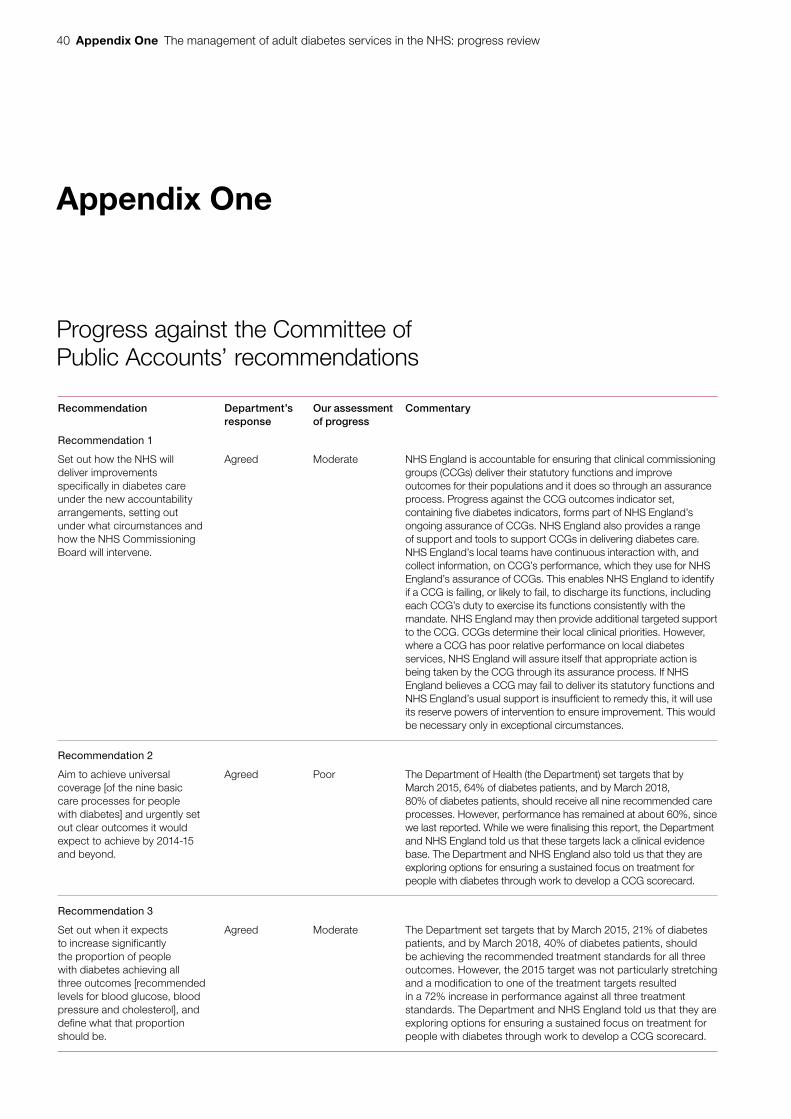
40 Appendix One The management of adult diabetes services in the NHS: progress review
Appendix One
Progress against the Committee of Public Accounts’ recommendations
Recommendation Department’s response
Our assessment of progress
Commentary
Recommendation 1
Set out how the NHS will deliver improvements specifically in diabetes care under the new accountability arrangements, setting out under what circumstances and how the NHS Commissioning Board will intervene.
Agreed Moderate NHS England is accountable for ensuring that clinical commissioning groups (CCGs) deliver their statutory functions and improve outcomes for their populations and it does so through an assurance process. Progress against the CCG outcomes indicator set, containing five diabetes indicators, forms part of NHS England’s ongoing assurance of CCGs. NHS England also provides a range of support and tools to support CCGs in delivering diabetes care. NHS England’s local teams have continuous interaction with, and collect information, on CCG’s performance, which they use for NHS England’s assurance of CCGs. This enables NHS England to identify if a CCG is failing, or likely to fail, to discharge its functions, including each CCG’s duty to exercise its functions consistently with the mandate. NHS England may then provide additional targeted support to the CCG. CCGs determine their local clinical priorities. However, where a CCG has poor relative performance on local diabetes services, NHS England will assure itself that appropriate action is being taken by the CCG through its assurance process. If NHS England believes a CCG may fail to deliver its statutory functions and NHS England’s usual support is insufficient to remedy this, it will use its reserve powers of intervention to ensure improvement. This would be necessary only in exceptional circumstances.
Recommendation 2
Aim to achieve universal coverage [of the nine basic care processes for people with diabetes] and urgently set out clear outcomes it would expect to achieve by 2014-15 and beyond.
Agreed Poor The Department of Health (the Department) set targets that by March 2015, 64% of diabetes patients, and by March 2018, 80% of diabetes patients, should receive all nine recommended care processes. However, performance has remained at about 60%, since we last reported. While we were finalising this report, the Department and NHS England told us that these targets lack a clinical evidence base. The Department and NHS England also told us that they are exploring options for ensuring a sustained focus on treatment for people with diabetes through work to develop a CCG scorecard.
Recommendation 3
Set out when it expects to increase significantly the proportion of people with diabetes achieving all three outcomes [recommended levels for blood glucose, blood pressure and cholesterol], and define what that proportion should be.
Agreed Moderate The Department set targets that by March 2015, 21% of diabetes patients, and by March 2018, 40% of diabetes patients, should be achieving the recommended treatment standards for all three outcomes. However, the 2015 target was not particularly stretching and a modification to one of the treatment targets resulted in a 72% increase in performance against all three treatment standards. The Department and NHS England told us that they are exploring options for ensuring a sustained focus on treatment for people with diabetes through work to develop a CCG scorecard.
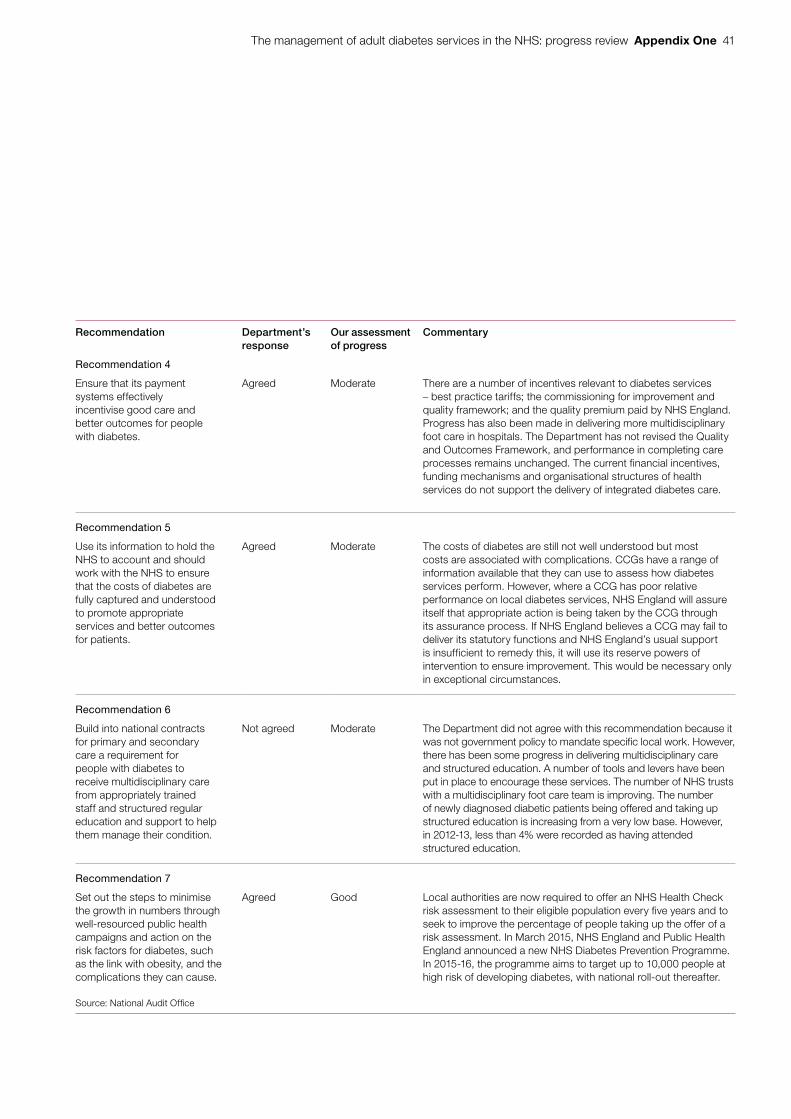
The management of adult diabetes services in the NHS: progress review Appendix One 41
Recommendation Department’s response
Our assessment of progress
Commentary
Recommendation 4
Ensure that its payment systems effectively incentivise good care and better outcomes for people with diabetes.
Agreed Moderate There are a number of incentives relevant to diabetes services – best practice tariffs; the commissioning for improvement and quality framework; and the quality premium paid by NHS England. Progress has also been made in delivering more multidisciplinary foot care in hospitals. The Department has not revised the Quality and Outcomes Framework, and performance in completing care processes remains unchanged. The current financial incentives, funding mechanisms and organisational structures of health services do not support the delivery of integrated diabetes care.
Recommendation 5
Use its information to hold the NHS to account and should work with the NHS to ensure that the costs of diabetes are fully captured and understood to promote appropriate services and better outcomes for patients.
Agreed Moderate The costs of diabetes are still not well understood but most costs are associated with complications. CCGs have a range of information available that they can use to assess how diabetes services perform. However, where a CCG has poor relative performance on local diabetes services, NHS England will assure itself that appropriate action is being taken by the CCG through its assurance process. If NHS England believes a CCG may fail to deliver its statutory functions and NHS England’s usual support is insufficient to remedy this, it will use its reserve powers of intervention to ensure improvement. This would be necessary only in exceptional circumstances.
Recommendation 6
Build into national contracts for primary and secondary care a requirement for people with diabetes to receive multidisciplinary care from appropriately trained staff and structured regular education and support to help them manage their condition.
Not agreed Moderate The Department did not agree with this recommendation because it was not government policy to mandate specific local work. However, there has been some progress in delivering multidisciplinary care and structured education. A number of tools and levers have been put in place to encourage these services. The number of NHS trusts with a multidisciplinary foot care team is improving. The number of newly diagnosed diabetic patients being offered and taking up structured education is increasing from a very low base. However, in 2012-13, less than 4% were recorded as having attended structured education.
Recommendation 7
Set out the steps to minimise the growth in numbers through well-resourced public health campaigns and action on the risk factors for diabetes, such as the link with obesity, and the complications they can cause.
Agreed Good Local authorities are now required to offer an NHS Health Check risk assessment to their eligible population every five years and to seek to improve the percentage of people taking up the offer of a risk assessment. In March 2015, NHS England and Public Health England announced a new NHS Diabetes Prevention Programme. In 2015-16, the programme aims to target up to 10,000 people at high risk of developing diabetes, with national roll-out thereafter.
Source: National Audit Offi ce
42 Appendix Two The management of adult diabetes services in the NHS: progress review
Appendix Two
Our audit approach
Scope
1 In 2012, we reported on The management of adult diabetes services in the NHS.21 The Committee of Public Accounts took evidence on the report, and concluded that too many people with diabetes were developing complications because they were not receiving the straightforward care and support they needed.22 The Committee made seven recommendations aimed at improving services and achieving better outcomes for people with diabetes and minimising the growth in the number of people with diabetes.
2 In 2014, the Committee asked us to review progress in improving diabetes services. This review was a short, focused piece of work looking specifically at progress against the Committee’s recommendations and progress against key outcomes, rather than a value-for-money examination. We carried out the review between April and August 2015.
3 Our review focuses on people aged 16 and over with type 1 or type 2 diabetes. Diabetes in pregnancy and children and young people with diabetes were outside the scope of this review because different clinical standards apply.
Methods
4 We reviewed key documents. These included Treasury minutes, National Diabetes Audit reports, National Diabetes Inpatient Audit reports and NHS England’s Action for Diabetes. We reviewed the findings from international comparisons work on diabetes care and outcomes. We also reviewed reports from Diabetes UK and academic publications estimating the cost of diabetes. We assessed the inclusion of diabetes indicators in the NHS and Public Health outcomes frameworks, the clinical commissioning group outcomes indicator set, and Quality and Outcomes Framework.
21 Comptroller and Auditor General, The management of adult diabetes services in the NHS, Session 2012-13, HC 21, May 2012.
22 HC Committee of Public Accounts, The management of adult diabetes services in the NHS, Seventeenth Report of Session 2012-13, HC 289, November 2012.
The management of adult diabetes services in the NHS: progress review Appendix Two 43
5 We interviewed staff from a range of organisations. The interviews were designed to help us understand:
• progress in implementing the Committee’s seven recommendations;
• progress in improving diabetes services and outcomes; and
• the challenges faced in improving diabetes services and outcomes.
6 The organisations and individuals whom we interviewed included: the Department of Health; NHS England, including the National Clinical Director for Obesity and Diabetes; Public Health England; the Association of British Clinical Diabetologists; Diabetes UK; the National Institute for Health and Care Excellence (NICE); and strategic clinical networks’ diabetes leads.
7 We visited two areas, Portsmouth and Wolverhampton, where we spoke to individuals involved in commissioning and providing diabetes services. These included individuals from the local clinical commissioning group, the local acute provider, GPs and IT specialists.
8 We analysed existing data. We replicated some of the analysis from our original report on diabetes services, adding time series where relevant, to assess:
• the percentage of patients receiving the nine recommended care processes, and variation across England;
• achievement of the three treatment standards, and variation across England;
• rates of diabetes complications and additional mortality and variation across England;
• the relationship between factors such as location, age, ethnicity and deprivation on quality of care and health outcomes;
• access to, and take-up of, structured education to support diabetes self-management; and
• trends in hospital activity for people with diabetes.
9 Our analysis used data from the National Diabetes Audit, the National Diabetes Inpatient Audit, the Quality and Outcomes Framework and Hospital Episode Statistics.
44 Appendix Three The management of adult diabetes services in the NHS: progress review
Appendix Three
The costs of diabetes to the NHS in England
1 In our last report on diabetes, we estimated that the cost of diabetes to the NHS in England was £3.9 billion in 2009-10, noting that this was likely to be an underestimate.23 Since this report, the estimated cost of diabetes to the NHS in the UK has been widely reported as about £10 billion a year, based on a piece of work by the York Health Economics Consortium in 2012.24 This work estimated that, in 2010-11, the cost of treatment was £2.1 billion (21% of total costs) and the cost of diabetes-related complications was £7.7 billion (79% of total costs). The main difference between these two estimates was how complication costs were calculated and the wider coverage of the York Health Economics Consortium’s work (see Figure 18).
2 In 2015, the Department of Health revisited the York Health Economics Consortium’s work to provide an estimate to cover England only (the consortium’s estimate covered the UK) and to cover only those costs that specifically related to, or were indirectly caused by, the condition (the consortium’s estimate covered all costs incurred by patients who had diabetes). The Department took account of more detailed estimates available (for the costs of foot problems and excess inpatient stays) and carried out age-sex standardisation for the costs of cardiovascular disease to take account of the generally older diabetic population.
3 The Department estimated that the cost of diabetes to the NHS in England was £5.6 billion in 2010-11 (Figure 19). It estimated that treatment costs for diabetes were £1.7 billion (31% of total costs) and that the cost of complications directly attributable to diabetes was £3.9 billion (69% of total costs).
23 Comptroller and Auditor General, The management of adult diabetes services in the NHS, Session 2012-13, HC 21, May 2012.
24 N. Hex et al., ‘Estimating the current and future costs of type 1 and type 2 diabetes in the UK, including direct health costs and indirect societal and productivity costs’, York Health Economics Consortium, University of York, Diabetic Medicine, Vol. 29, Issue 7, pp. 855–62, July 2012.
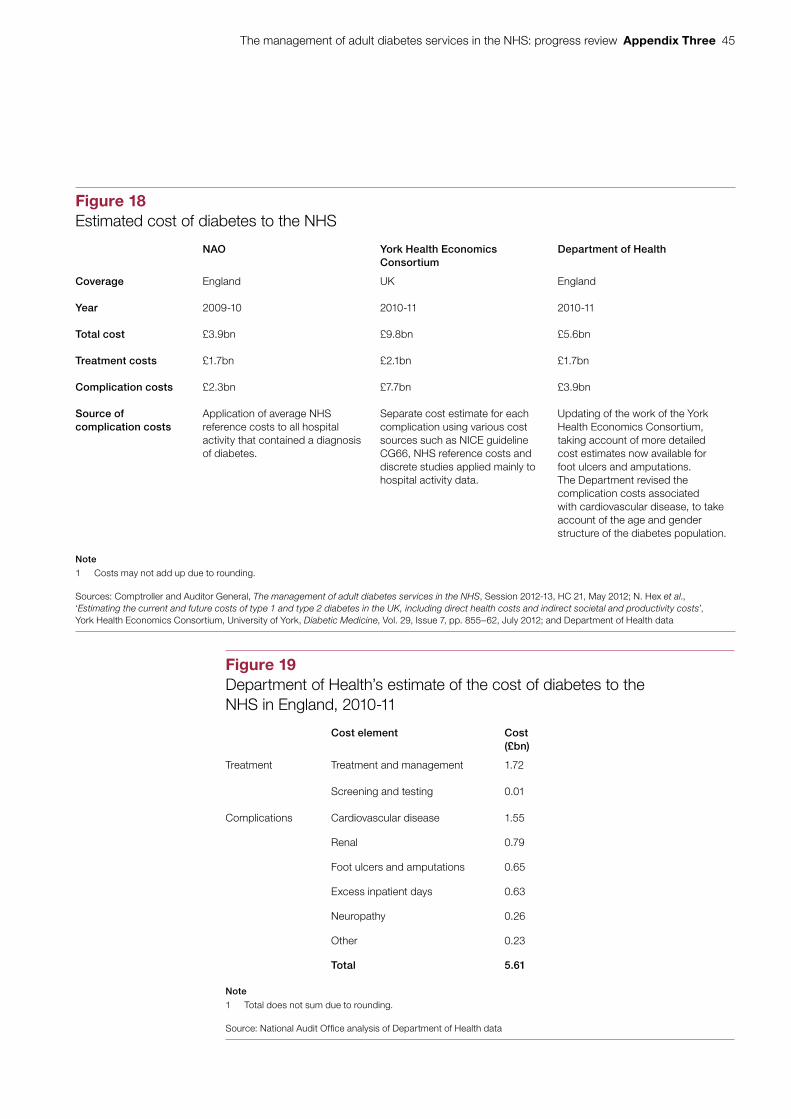
The management of adult diabetes services in the NHS: progress review Appendix Three 45
Figure 18Estimated cost of diabetes to the NHS
NAO York Health Economics Consortium
Department of Health
Coverage England UK England
Year 2009-10 2010-11 2010-11
Total cost £3.9bn £9.8bn £5.6bn
Treatment costs £1.7bn £2.1bn £1.7bn
Complication costs £2.3bn £7.7bn £3.9bn
Source of complication costs
Application of average NHS reference costs to all hospital activity that contained a diagnosis of diabetes.
Separate cost estimate for each complication using various cost sources such as NICE guideline CG66, NHS reference costs and discrete studies applied mainly to hospital activity data.
Updating of the work of the York Health Economics Consortium, taking account of more detailed cost estimates now available for foot ulcers and amputations. The Department revised the complication costs associated with cardiovascular disease, to take account of the age and gender structure of the diabetes population.
Note
1 Costs may not add up due to rounding.
Sources: Comptroller and Auditor General, The management of adult diabetes services in the NHS, Session 2012-13, HC 21, May 2012; N. Hex et al., ‘Estimating the current and future costs of type 1 and type 2 diabetes in the UK, including direct health costs and indirect societal and productivity costs’, York Health Economics Consortium, University of York, Diabetic Medicine, Vol. 29, Issue 7, pp. 855–62, July 2012; and Department of Health data
Figure 19Department of Health’s estimate of the cost of diabetes to the NHS in England, 2010-11
Cost element Cost (£bn)
Treatment Treatment and management 1.72
Screening and testing 0.01
Complications Cardiovascular disease 1.55
Renal 0.79
Foot ulcers and amputations 0.65
Excess inpatient days 0.63
Neuropathy 0.26
Other 0.23
Total 5.61
Note
1 Total does not sum due to rounding.
Source: National Audit Offi ce analysis of Department of Health data

This report has been printed on Evolution Digital Satin and contains material sourced from responsibly managed and sustainable forests certified in accordance with the FSC (Forest Stewardship Council).
The wood pulp is totally recyclable and acid-free. Our printers also have full ISO 14001 environmental accreditation, which ensures that they have effective procedures in place to manage waste and practices that may affect the environment.

£10.00
9 781786 040084
ISBN 978-1-78604-008-4
Design and Production by NAO Communications DP Ref: 10815-001