Embed Size (px)
Citation preview

8/14/2019 The Maps Are Being Redrawn
http://slidepdf.com/reader/full/the-maps-are-being-redrawn 1/3
9rorrP,uilding Betler Perf ormernce
COMMENTARY 83 MARCH 2OO5
THE MAPS ARE BEING REDRAWN'
"The world's biggest iceberg has crashed into an ice tongue protruding out of
Antarctica, breaking a portion off, the European Space Agency said."
"The B-15A iceberg, about the size of Luxembourg, in the past month hit the
Drygalski ice tongue, a feature marked on most maps of Antarctica, and broke
a five-kilometer- (three-mile-) long section off, ESA said on its Web site, using
satellite pictures to illustrate the damage."
"Maps of Antarctica need to be amended," ESA said."
wvwv.bloomberg.com, April 1 Bth 2005
Plexus Group's symbol for the hidden trading costs
has been the icebero. which leads us to use the
The force behind this movement is pressure to reduce
institutional trading costs. This pressure has three
driving forces: (1) modeling, derived from academic
work, (2) motivation, derived from pressing
institutional needs, and (3) methodology, to define,
implement and validate improvements to trading
practices.
Modeling
Jack Treynor and Andre Perold deserve credit for the
implementation shortfall (iceberg) approach. This is the
key insight, because it casts costs in the framework of a
cost:benefit model. The old paradigm considered costs
as something to be minimized. In effect, all other factors
other than broker behavior were assumed to be fixed and
unresponsive to trading strateEy and tactics. By linking
trading costs to performance, Perold recast the problem
from one of cost control to one of prudent spending to
achieve the investment goals. In addition, by creating an
all-inclusive cost measure, the door was opened to the
above geographical alteration as an
analogy to what's happening with the
U.S. stock exchanges. In one week
the NYSE announced a merger with
ARCA and the NASDAQ a purchase
of the lnstinet system. What has
caused this sudden flurry of exchange
mergers? We see two goals; further
reducing the cost of trading through the
technology along with accessing new
believe this is the next logical step in
'T'tz*##r??ss?gy ti*xreir; :xf"rtrpgf * **t'*s***re? FdY',$#
,S,tr#,€ #rpfl$ tr*S#*.#$s:psfd#*f arfff r**rx.#* fFa*
#{#c:g;ra#pfuy *f fft* #tr#fldd *f cs?w*s$setgr"
use of better
markets. We
response to
discovery ofhidden costs
the large but heretofore undiscoveredof trading: the iceberg. With this new
l\,4any thanks to Peter Haynes of TD Newcrest Securities, who brought the
iceberg news item to our attention and first developed the analogy to the
chanqes in the market.orces that have been active for decades
8/14/2019 The Maps Are Being Redrawn
http://slidepdf.com/reader/full/the-maps-are-being-redrawn 2/3
paradigm, it became possible to engineer changes to
improve trading results.
Motivation
The CFA Institute picked up on this same idea when they
defined Best Execution as the trading process most likely
to maximize the value of client portfolios.2 Once an
investment management firm truly internalizes theconnection between costs and performance, high-costtrading impediments become intolerable.
In recent years, institutional investors, led by -i./anguard
and Fidelity, have intensified pressure on the exchangesto develop more cost-effective solutions. The irresistible
iceberg of institutional trading needs broke the defense of
the entrenched interests.
Measu rement
In 1975, Cuneo and Wagner published an estimate ofround trip costs of 2.6% for information motivated trades.
This was in line with Demsetz's '1963 * the first we are
aware of - estimate and Krause and Stoll's 1972estimate. In Plexus' very first depiciion of an iceberg in
1992, the round trip costs were measured at2.B'h no
real change over 30 years.
Turning to the present, current Plexus client data shows
all-in round trip costs at an all time low of 1"5%. So it
appears at first blush that costs have been cut roughly in
half since the turn of the millennium, with the big
reductions starting to appear in 2003 as the effects ofdecimalization began to kick in.
Not so fast! As recently as 200'1, at the end of the Internet
frenzy, costs peaked out at 3.1% round trip, much higher
than current costs and higher than the cosl estimates ofthe 1960's and '70's. What this shows is that
economic/market prospects and
conditions play a major role in ,.,.,,,,,'-,:.. . ,,:.: .
determining the magnitude oftransaction costs. ln contrast, 1,,,,, 1, ;,: .: ..,,... : : :
the recent low costs are partly
due to the low volatility/low ...:, :.,,...,
: . : : :., ...
return exoectations of recentvears.
Another way of looking at this is to say that changes in
market structure and improved trading practices have
enabled us to hold costs constant in the face of massivegrowth in assets under management. Assuredly, both
the investing environment and the market structure are
much different than they were in the 70's and 80's.
Changes in the brokerage industry have led to much
lower liquidity costs as long as prices remain stable. But
as stability wavers, costs rise. Indeed, when adjusted for
momentum, the cost reduction shrinks. One well known
investment manager shared with us an intuition thattrading costs haven't fallen at all -- they've just moved
from one bucket (fixed commissions) to other buckets(impact and delay.) There's some truth to that insight,
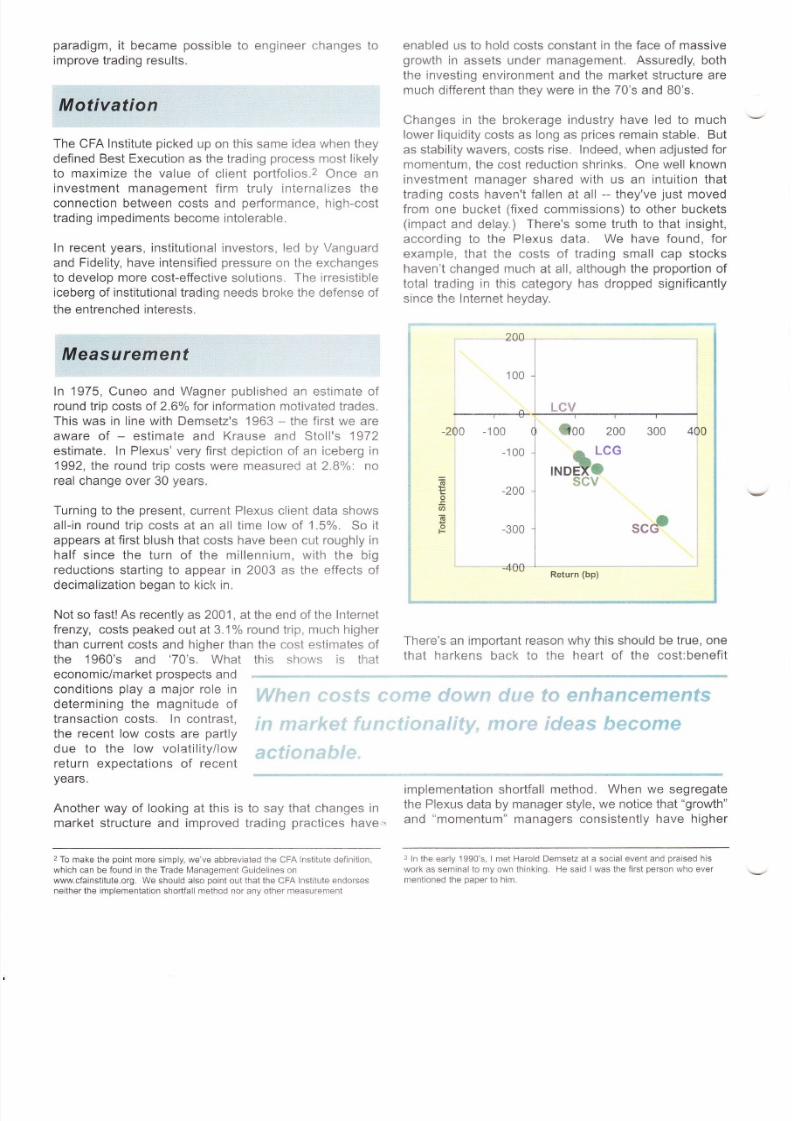
according to the Plexus data. We have found, forexample, that the costs of trading small cap stockshaven't changed much at all, although the proportion of
total trading in this category has dropped significantlysince the Internet heyday.
200
100
----r--+200 -100 &oo 200 300 400
-1 00
-200
-300
-400
e LCG
INDMS$evc
.E
: .cl.F SCGS
Return (bp)
There's an important reason why this should be true, one
that harkens back to the heart of the cost:benefit
...,',: .':.'.,.,..:.'::::ti:',. :1,:i''lii'lti;r-1,{.i{il'.i?l'::if':l$
,.. ,: :::';,:: ,1:',.a,.,.::":',a:::;::l .;';,..,.1:.;.',:: ::..,:::ill{;}:
ro"r"rt"ii".
.n"rnrll method. When we segregatethe Plexus data by manager style, we notice that "growth"
and "momentum" managers consistently have higher
*
i
"._*_*{
2 To make the point more simply, we've abbreviated the CFA Institute definition,
which can be found in the Trade l\4anagement Guidelines on
www.cfainstitute.org. We should also point out that the CFA Inst;tute endorses
neither the implementation shortfall method nor any other measurement
3 ln the early 1990's, I met Harold Demsetz at a social event and praised his
work as seminal to my own thinking. He said I was the first person who ever
mentioned the oaoer to him.
8/14/2019 The Maps Are Being Redrawn
http://slidepdf.com/reader/full/the-maps-are-being-redrawn 3/3
costs of trading than "value" or "contrarian" managers. In
Commentary 55 of May 1998, we measured trading costs
for large cap growth managers at 2.5 times the cost oflarge cap value managers. Small cap growth managers
spent twice the cost of small cap value managers.
The chart, reproduced from Commentary 55, graphs
trading costs by style against 30 day market adjusted
returns and draws two interesting conclusions: (1) the
dots representing costs vs. returns lie very close to a
straight line; and (2) the costs approached the experi-enced returns for each style. i.e. costs go up in lock step
with the information value.
We explained ". . . the value of the research dictates the
acceptable cost as managers filter out ideas with greater
expected cost, or stop trading when costs exceed idea
value. Either wav. manaqers overall are able to calibrate
costs to research value."
To summarize, in times of high expectations such as the
internet boom, transaction prices go up; in low expectation
times like 2002-2004, they go down. What we see here
is the returns expectations translated into an upper bound
on the cost of liquidity. This relationship of costs to
expectations seems to be a pointer to market efficiency,and goes a long way to explain why active management
net of costs looks like a zero-sum oame.
Lower Cosf Markets
It would be incorrect to conclude that the level ofexchange costs doesn't matter; it matters a great deal.
When costs come down due to enhancements in market
functionality, more ideas become actionable. Institutional
investors can profit from ideas that have smaller
expectations, to the benefit of investors. This is veryevident in the world of the high-turnover hedge funds,
who are able to trade for tinv returns at even tinier trade
costs.
Thus the changes in the markets and the coming titanic
struggle between NYSE/ARCA and NASDAQ/Instinet will
change the geography of the world of investing. Trading
of equities will merge with trading of bonds, options and
futures, opening new types of strategies that are too
difficult to execute now. We will redraw the map, and
investors will be the winners.
What will come of this in the future? Clearly both the
NYSE and NASDAQ are gathering resources for a titanic
clash. lt's hard to see who, if anyone, will ultimatelydominate. Any predictions are highly speculative, but
our guess would be a duopolistic standoff with both
systems surviving. We also predict continuing budding of
new trading technologies aimed at niche markets. Keeps
everybody on their toes.
Investors will be the clear winners, but the manner in
which investors win may be a
little more indirect than simplyfrom reduced trade costs. The
real gains will come from thenncnino rrn of new
investmentstrategies.
As the traditional barriers toprogress retreat, exchanges will
move on to the real work to be
done. The key to exchange improvement for institutional
investors lies, as always, in the enhancement of liquidity
and the strengthening of confidentiality. The major
challenge for the new consolidations will be to figure out
how information technology and high speed connectivity
can be used to promote these commanding institutional
needs.
However, connectivity won't solve all trading problems.
Ticking off orders against the book is fine when volatility
is low and the book is deep. However, high tech
solutions can traumatize when volatility is high,
momentum is strong and the book is thin. In those
situations hightouch markets show their merit, and find-
the-liquiciity services becorne more highly valued than
blazing speed. lf a headlong rush to high tech
connectivity destroys the high-touch capabilities of the
market, investors could be hurt.
Finally, don't expect the average cost of institutional
trading to remain low when a new boom drivesexpectations skyward. Transaction costs will still be top-
down driven by value expectations, not cost structures.
Plexus News *,;/.
Put this on your calendar! The Plexus Group 9th Client Conference is scheduled for September 18 - 20, 2005 at the :l:
Fairmont Turnberry Is/e Resort & Ctub (http://www.fairmont.com/turnberryisle/) 7:
,:,


![The Pythogorean Proposition Diagrams Redrawn [Clean]](https://img.pdfslide.net/doc/110x75/55cf990f550346d0339b51f6/the-pythogorean-proposition-diagrams-redrawn-clean.jpg)