Embed Size (px)
DESCRIPTION
The Massachusetts Housing Challenge Barry Bluestone. Center for Urban and Regional Policy Northeastern University Greater Boston Real Estate Board LINK Forum January 19, 2005. Understanding the Massachusetts Economy & Housing Market. Employment Household Income Demographic Trends - PowerPoint PPT Presentation
Citation preview

The MassachusettsHousing Challenge
Barry Bluestone
Center for Urban and Regional PolicyNortheastern University
Greater Boston Real Estate BoardLINK Forum
January 19, 2005

Understanding the Massachusetts Economy & Housing Market
Employment Household Income Demographic Trends Cost of Living Housing Trends

How is Massachusetts doing … economically?
By the September 2005, employment in Massachusetts was still down by more than 160,000 from its pre-recession peak
Real median household income dropped by 3.5% between 2000 and 2004
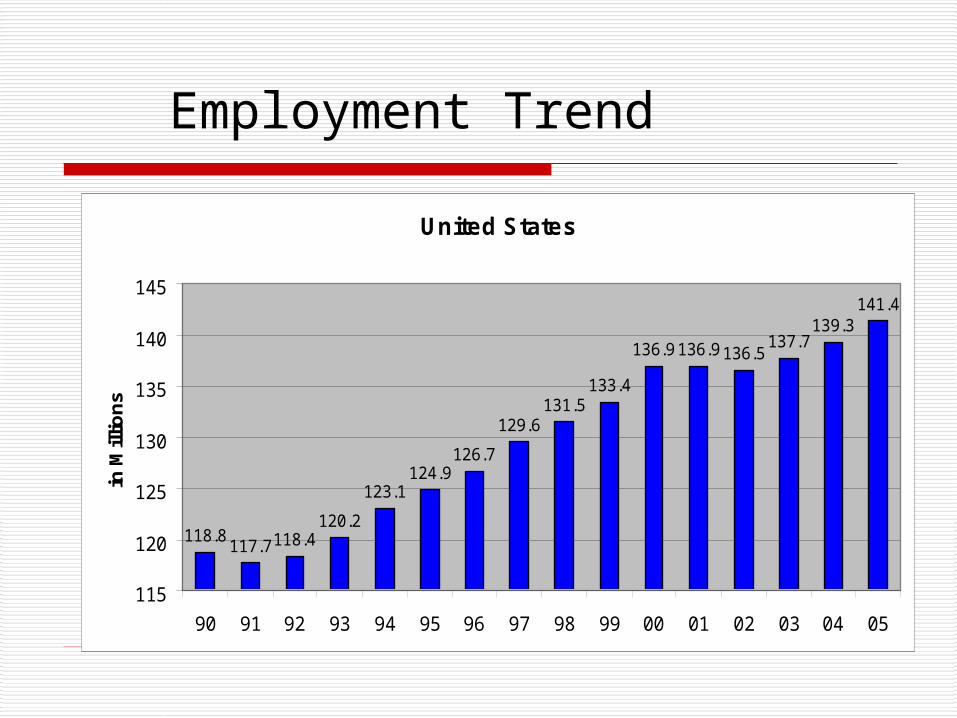
Employment Trend
United States
118.8117.7118.4
120.2
123.1124.9
126.7
129.6131.5
133.4
136.9 136.9 136.5137.7
139.3141.4
115
120
125
130
135
140
145
90 91 92 93 94 95 96 97 98 99 00 01 02 03 04 05
in M
illio
ns

Employment Trend
M assachusetts
3044
2875
2795 28152869
29502994
3083
31513200
3279
3371
3270
32113165
3190
2700
2800
2900
3000
3100
3200
3300
3400
90 91 92 93 94 95 96 97 98 99 00 01 02 03 04 05
in T
ho
us
an
ds

U.S. vs. Massachusetts
Employment Growth
-4.0
-3.0
-2.0
-1.0
0.0
1.0
2.0
3.0
4.0
Jan-99 Jan-00 Jan-01 Jan-02 Jan-03 Jan-04 Jan-05
% C
han
ge
Sin
ce
Ye
ar
Earl
ier
U.S. Massachusetts
Source: Bureau of Labor Statistics, Payroll Employment
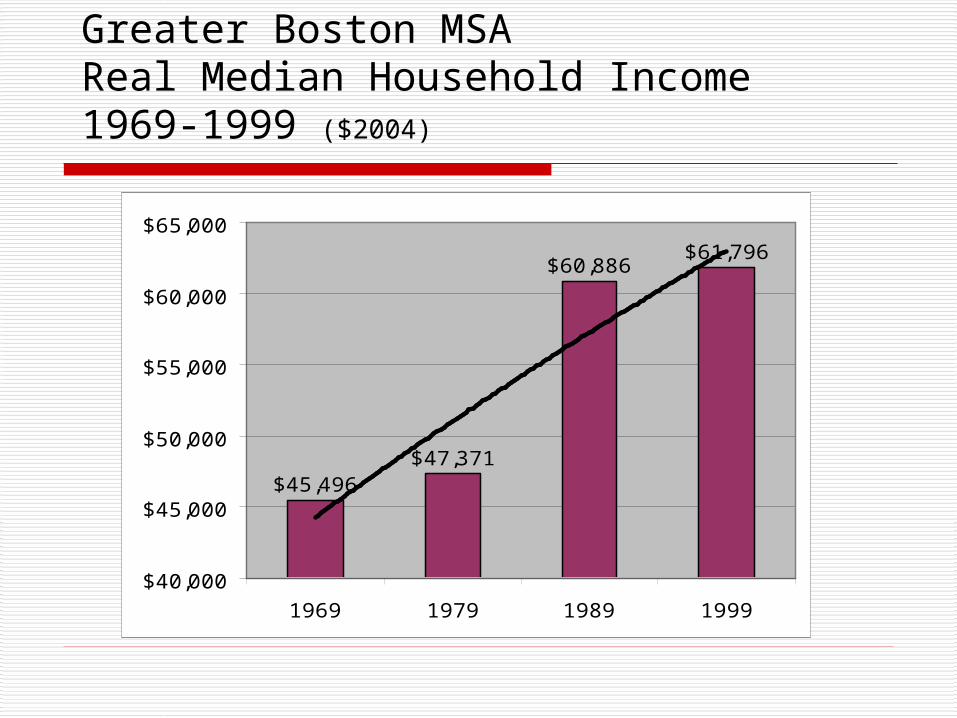
Greater Boston MSA Real Median Household Income 1969-1999 ($2004)
$45,496$47,371
$60,886$61,796
$40,000
$45,000
$50,000
$55,000
$60,000
$65,000
1969 1979 1989 1999

Greater BostonReal Median Household Income ($2004)
$60,784
$63,546 $63,496
$60,466
$61,333
$58,500
$59,000
$59,500
$60,000
$60,500
$61,000
$61,500
$62,000
$62,500
$63,000
$63,500
$64,000
in $
Do
llars
2000 2001 2002 2003 2004

How do the demographics look?
We are losing population to out-migration
The largest net losses in population were in the young prime age cohorts

Greater Boston Population 2000-2004
3310 3311 33043296
3275
3100
3150
3200
3250
3300
3350
in T
ho
us
an
ds
2000 2001 2002 2003 2004

Massachusetts Net Migration 2000-2004
32,268 32,244 31,555 31,535
-14,244
-28,074
-47,776
-58,910-70,000
-50,000
-30,000
-10,000
10,000
30,000
50,000
2000-01 2001-02 2002-03 2003-04

Figure 2.3
Population Change by Age Cohort Boston PMSA 2001-2003
-15.0%
-10.0%
-5.0%
0.0%
5.0%
10.0%
15.0%
Un
de
r 5
yea
rs
5 t
o 1
9ye
ars
20
to
24
yea
rs
25
to
34
yea
rs
35
to
54
yea
rs
55
to
64
yea
rs
65
ye
ars
+
Change 2001-2003

Where did they go?
TX
CA
MT
AZ
ID
NV
NM
CO
IL
OR
UT
KS
WY
IA
SD
NE
MN
ND
FL
OK
WI
MO
AL
WA
GA
AR
LA
MI
IN
NY
PA
NC
MS
TN
KYVA
OH
SC
ME
WV
MI VTNH
MD
NJ
MA
CT
DE
RI
Net Migration* Betweeen Massachusetts and Competitor States1990-2002
*Thicker line represents more migration
State Net Migration from State
Florida -99,082 New Hampshire -78,201 California -23,978 Arizona -11,033 North Carolina -8,983 Washington -4,516

What’s doing with the Cost of Living?
According to a new measure of living costs, Greater Boston has the highest cost of living of any metro area in the United States
A family of four needs $64,656 to pay for the costs of housing, transportation, day care, health care, and other basic necessities.
This is more than $3,000 higher than in Washington, D.C; $6,000 higher than in New York City; and $7.000 more than in San Francisco
Monthly housing costs are 40% higher than in Austin, Chicago, and Miami and 63% higher than in Raleigh-Durham-Chapel Hill
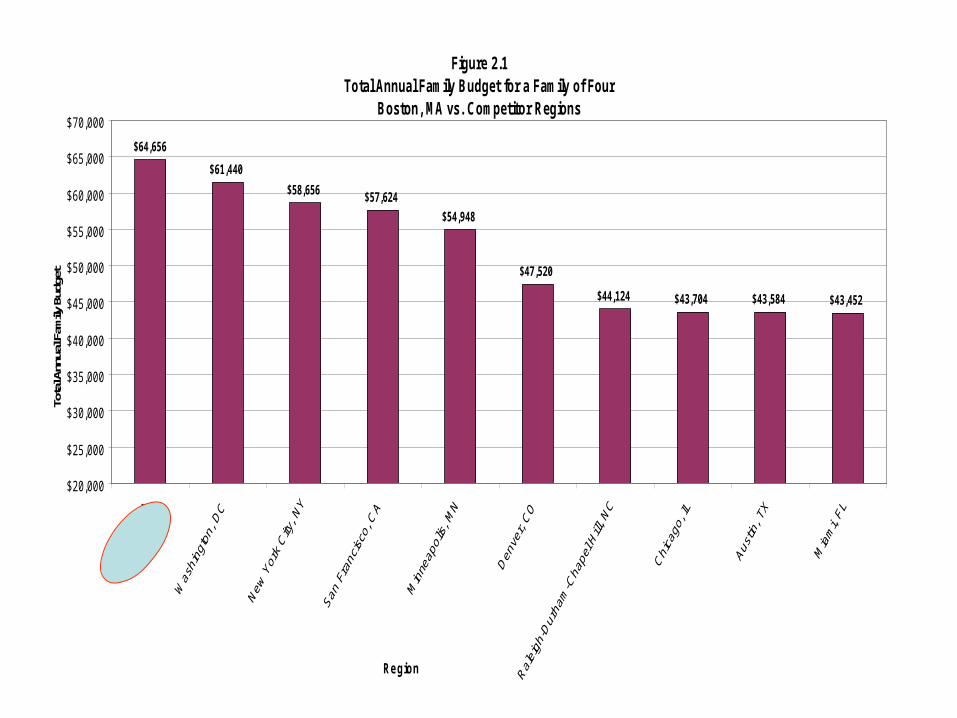
Figure 2.1Total Annual Family Budget for a Family of Four
Boston, MA vs. Competitor Regions
$64,656
$61,440
$58,656 $57,624
$54,948
$47,520
$44,124 $43,704 $43,584 $43,452
$20,000
$25,000
$30,000
$35,000
$40,000
$45,000
$50,000
$55,000
$60,000
$65,000
$70,000
Re gion
Tota
l Ann
ual F
amily
Bud
get

A Tale of Two CitiesBasic Budget
2 Parents, 2 Children
Boston
Monthly Housing $1,266
Monthly Food $ 587
Monthly Child Care $1,298
Monthly Transportation $ 321
Monthly Health Care $ 592
Monthly Other Necessity $ 500
Monthly Taxes $ 824
Monthly Total $5,388
Annual Total $64,656
Raleigh-Durham-Chapel Hill
Monthly Housing $ 779
Monthly Food $ 587
Monthly Child Care $ 866
Monthly Transportation $ 358
Monthly Health Care $ 368
Monthly Other Necessity $ 369
Monthly Taxes $ 350
Monthly Total $3,677
Annual Total $44,124

$169$159
$152 $146 $148 $150 $154$161
$168
$186
$210
$245
$273
$313
$343
$376
$165 $168
$100
$150
$200
$250
$300
$350
$400
1987 1988 1989 1990 1991 1992 1993 1994 1995 1996 1997 1998 1999 2000 2001 2002 2003 2004
(in
$th
ou
san
ds)
Greater Boston Median Single Family Home Price 1987-2004
Source: The Warren Group Publications

2005Class A Apartment Rents
$1
,95
3
$1
,82
5
$1
,74
5
$1
,68
6
$1
,67
7
$1
,63
2
$1
,57
9
$1
,52
6
$1
,51
7
$1
,46
6
$1
,43
9
$1
,32
5
$1
,31
6
$1
,24
1
$1
,15
5
$1
,11
1
$1
,04
3
$1
,01
8
$1
,01
2
$9
87
$0
$500
$1,000
$1,500
$2,000
$2,500
Source: Forbes Magazine

1998 2000 2001 2002 2003 2004
Below $100,000 4 0 0 0 0 0
$100,000 - $199,999 82 41 14 5 0 0
$200,000 - $299,999 50 68 74 62 43 19
$300,000 - $399,999 16 32 42 52 61 74
$400,000 - $499,999 4 10 12 22 30 33
$500,000 - $999,999 4 9 18 19 25 33
$1,000,000 and Above 0 0 0 0 1 1
# of Communities with Median Single Family Sales Price

1998 2000 2001 2002 2003 2004
Below $300,000 85.0% 68.1% 55.0% 41.9% 26.9% 11.9%
$300,000 - $499,999 12.5% 26.3% 33.8% 46.3% 56.9% 66.9%
$500,000 and Above 2.5% 5.6% 11.3% 11.9% 16.3% 21.3%
% of Communities with Median Single Family Sales Price

Figure 3.5Historical Construction Costs
60.0
80.0
100.0
120.0
140.0
160.0
180.0
19
83
19
85
19
87
19
89
19
91
19
93
19
95
19
97
19
99
20
01
20
03
20
05
Year
RS
Me
an
s I
nd
ex
(3
0 C
ity N
atl
Av
g b
as
e,
19
93
=
10
0
Boston Natl 30 City Average
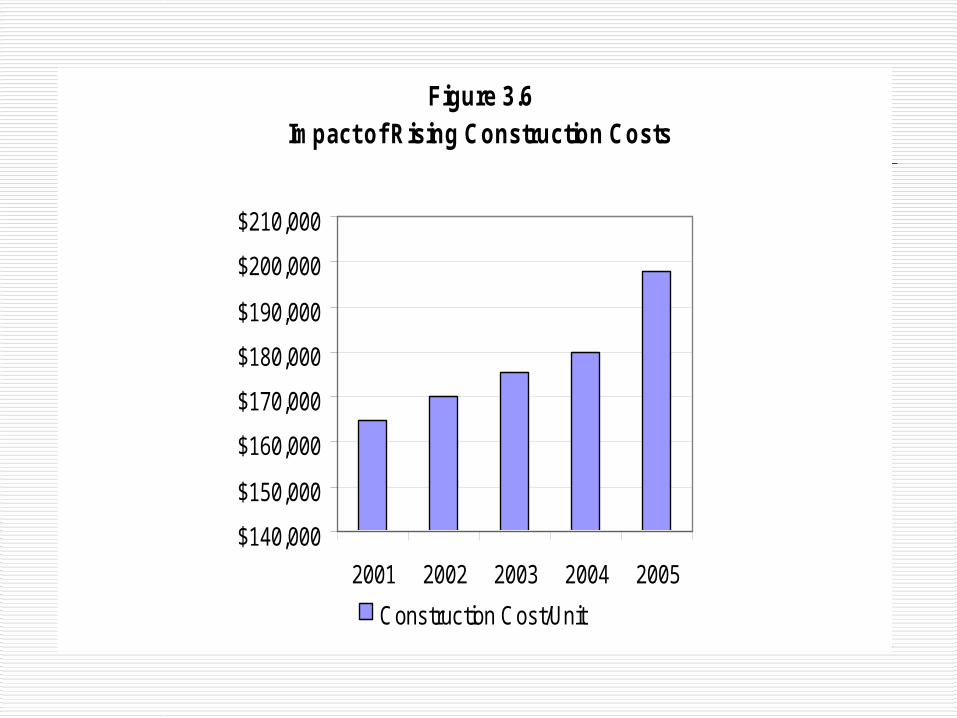
Figure 3.6Impact of Rising Construction Costs
$140,000
$150,000
$160,000
$170,000
$180,000
$190,000
$200,000
$210,000
2001 2002 2003 2004 2005
Construction Cost/Unit
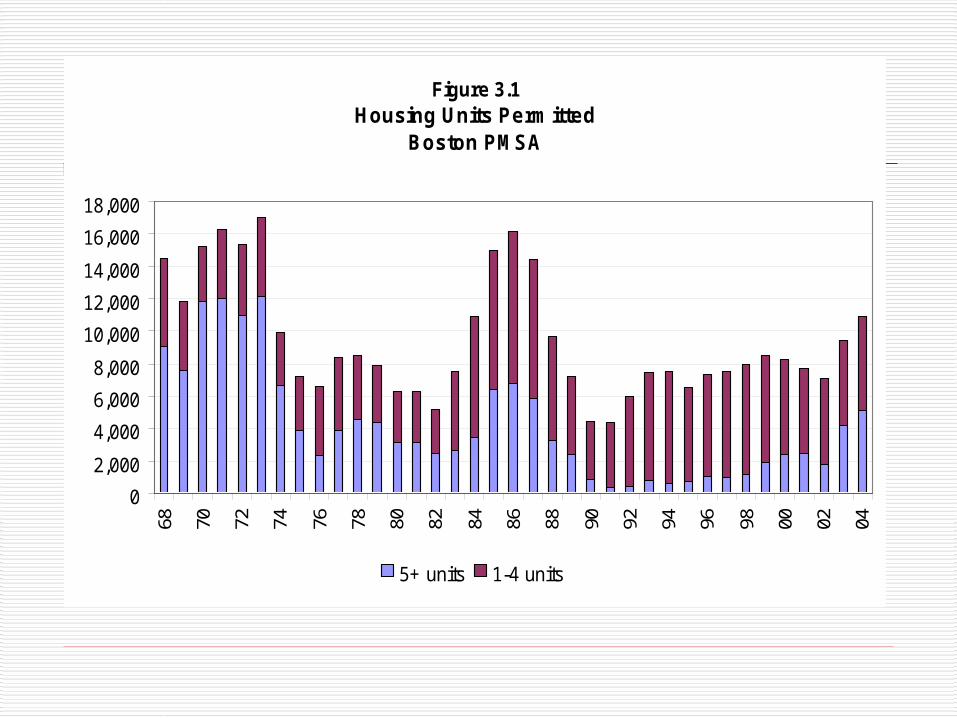
Figure 3.1Housing Units Permitted
Boston PMSA
0
2,000
4,000
6,000
8,000
10,000
12,000
14,000
16,000
18,000
68 70 72 74 76 78 80 82 84 86 88 90 92 94 96 98 00 02 04
5+ units 1-4 units

Year Total Units Permitted
Units in Single Family
Structures
Single Family
Units as % of Total
Units in 2-4 Unit
Structures
Units in 5+ Unit
Structures
1998 10,846 8,639 79.70% 574 1,633
1999 10,662 7,775 72.90% 746 2,141
2000 10,342 7,102 68.70% 701 2,539
2001 9,701 6,313 65.10% 686 2,702
2002 9,520 6,408 67.30% 764 2,348
2003 12,121 6,020 49.70% 1,093 5,003
2004 13,556 7,000 51.60% 994 5,562

Housing Price Forecast – New England Economic Project
Double-Digit Appreciation from 1995-2004
2005: Appreciation of only 1-3% 2006: Average Price Decline < 3% 2007-2009: Average Price Increase:
<3%/year
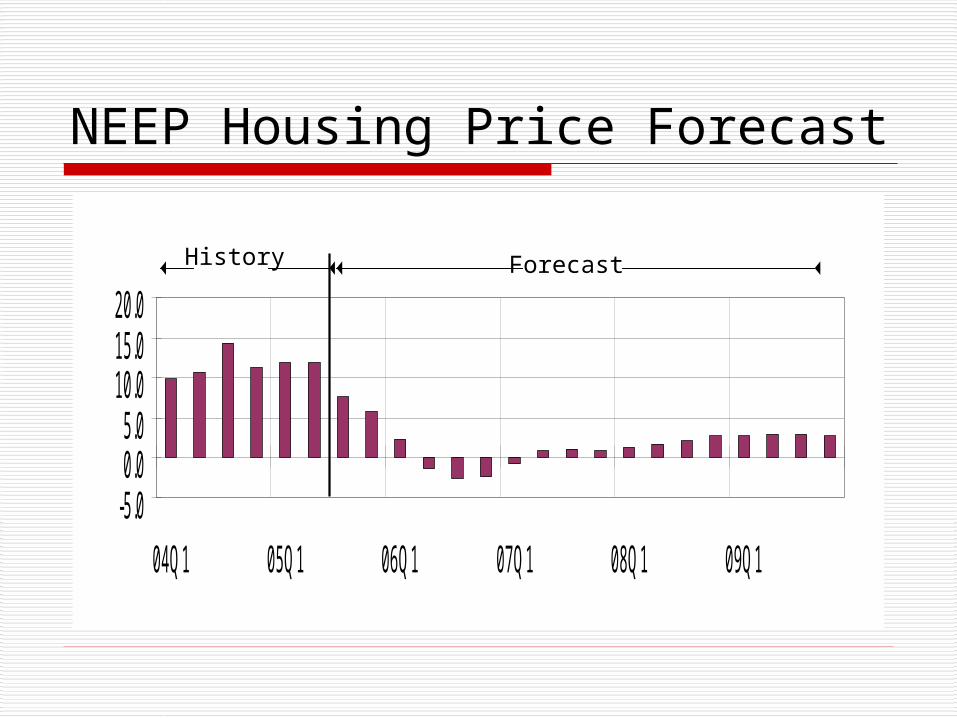
NEEP Housing Price Forecast
-5.00.05.0
10.015.020.0
04Q1 05Q1 06Q1 07Q1 08Q1 09Q1
History Forecast
Conclusion – No Short Term Bubble
Housing production has improved in Greater Boston over the past three years, but total production in 2004 was still at only 72 percent of the level needed to slow housing price appreciation to normal levels if economy were sound
In the short run, limited housing supply will keep home prices from collapsing

Conclusion – Long Term Challenges
In the long run, economic weakness, slow job growth, and demographic flight could lead to much weaker housing markets in Massachusetts
And don’t forget about a troubled national economy … with soaring federal debt, massive trade deficits, and increasing international competition for investment and raw materials