Embed Size (px)
Citation preview
GHSUG User Group
The Means Procedure in SAS Enterprise Guide
(EG)... “Summary Statistics”
Sueheir Saddik
April 15th, 2010
2 Bell Canada Restricted
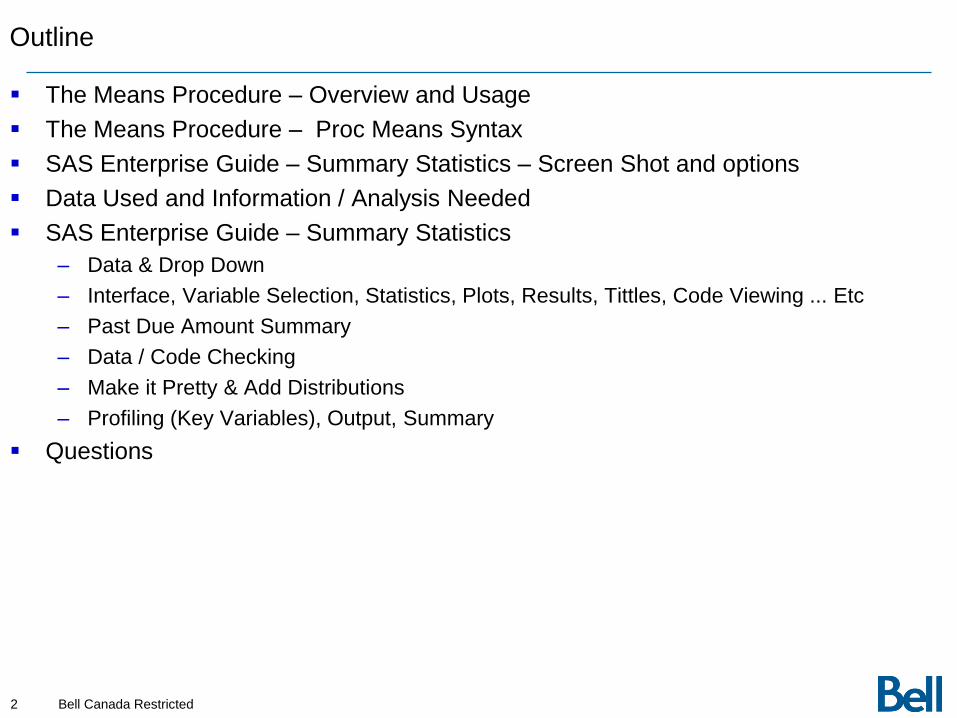
Outline
The Means Procedure – Overview and Usage
The Means Procedure – Proc Means Syntax
SAS Enterprise Guide – Summary Statistics – Screen Shot and options
Data Used and Information / Analysis Needed
SAS Enterprise Guide – Summary Statistics
– Data & Drop Down
– Interface, Variable Selection, Statistics, Plots, Results, Tittles, Code Viewing ... Etc
– Past Due Amount Summary
– Data / Code Checking
– Make it Pretty & Add Distributions
– Profiling (Key Variables), Output, Summary
Questions
3 Bell Canada Restricted
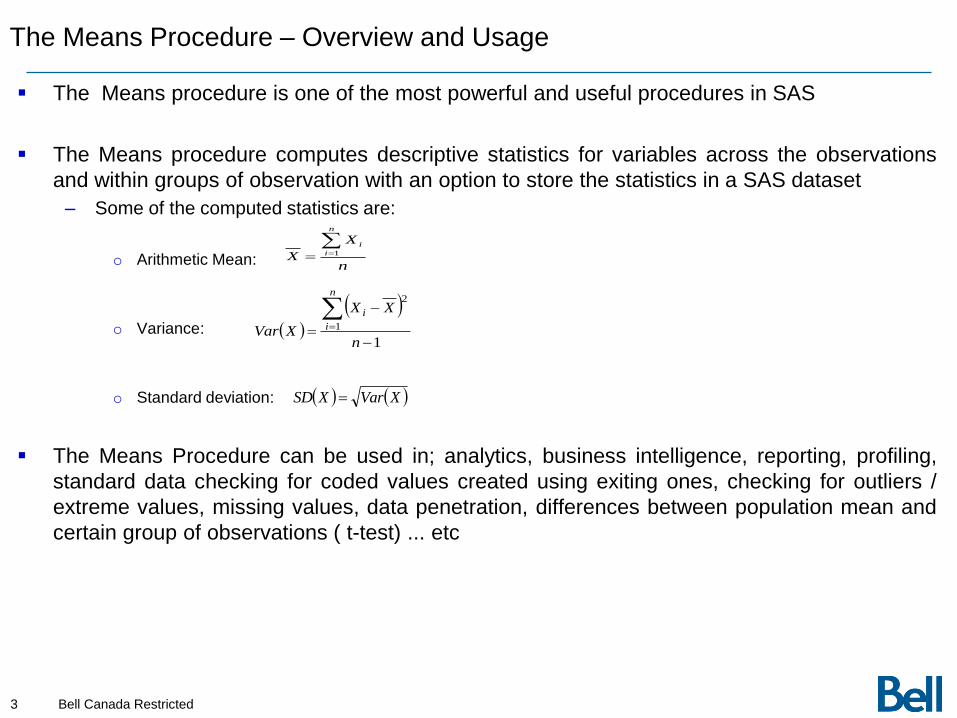
The Means Procedure – Overview and Usage
The Means procedure is one of the most powerful and useful procedures in SAS
The Means procedure computes descriptive statistics for variables across the observations
and within groups of observation with an option to store the statistics in a SAS dataset
– Some of the computed statistics are:
o Arithmetic Mean:
o Variance:
o Standard deviation:
The Means Procedure can be used in; analytics, business intelligence, reporting, profiling,
standard data checking for coded values created using exiting ones, checking for outliers /
extreme values, missing values, data penetration, differences between population mean and
certain group of observations ( t-test) ... etc
n
X
X
n
i
i 1
1
1
2
n
XX
XVar
n
i
i
XVarXSD
4 Bell Canada Restricted
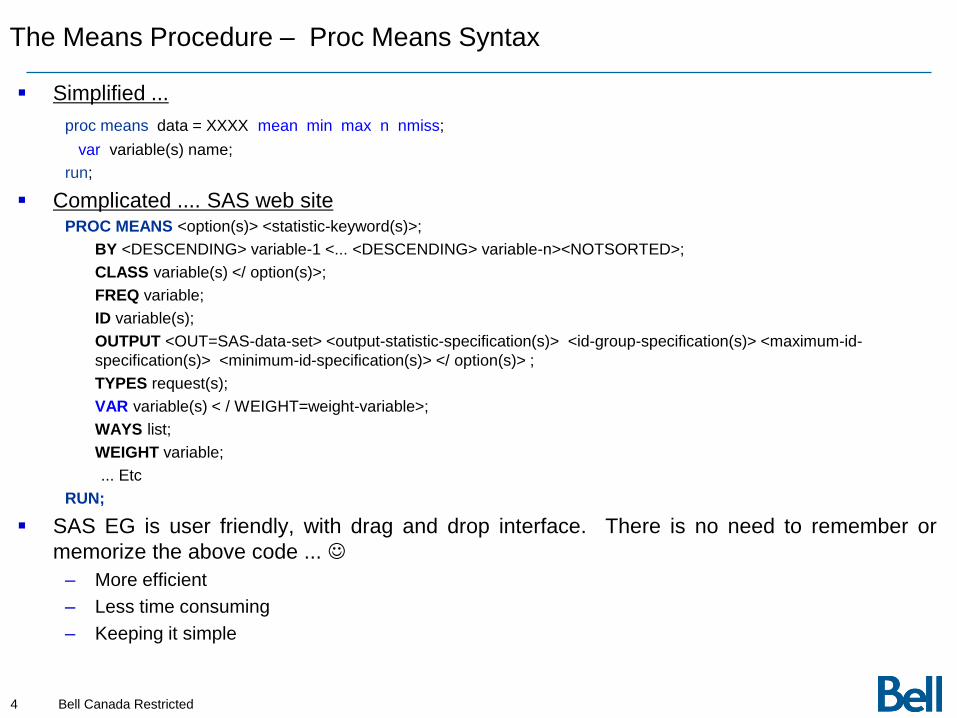
The Means Procedure – Proc Means Syntax
Simplified ...
proc means data = XXXX mean min max n nmiss;
var variable(s) name;
run;
Complicated .... SAS web site PROC MEANS <option(s)> <statistic-keyword(s)>;
BY <DESCENDING> variable-1 <... <DESCENDING> variable-n><NOTSORTED>;
CLASS variable(s) </ option(s)>;
FREQ variable;
ID variable(s);
OUTPUT <OUT=SAS-data-set> <output-statistic-specification(s)> <id-group-specification(s)> <maximum-id-
specification(s)> <minimum-id-specification(s)> </ option(s)> ;
TYPES request(s);
VAR variable(s) < / WEIGHT=weight-variable>;
WAYS list;
WEIGHT variable;
... Etc
RUN;
SAS EG is user friendly, with drag and drop interface. There is no need to remember or
memorize the above code ...
– More efficient
– Less time consuming
– Keeping it simple
5 Bell Canada Restricted
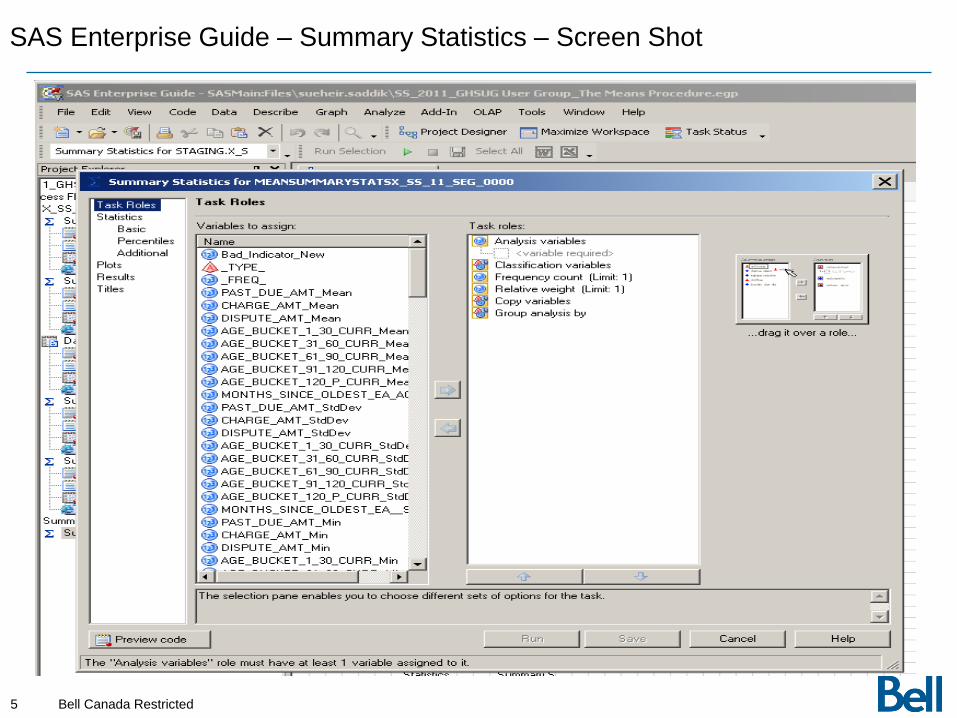
SAS Enterprise Guide – Summary Statistics – Screen Shot
6 Bell Canada Restricted
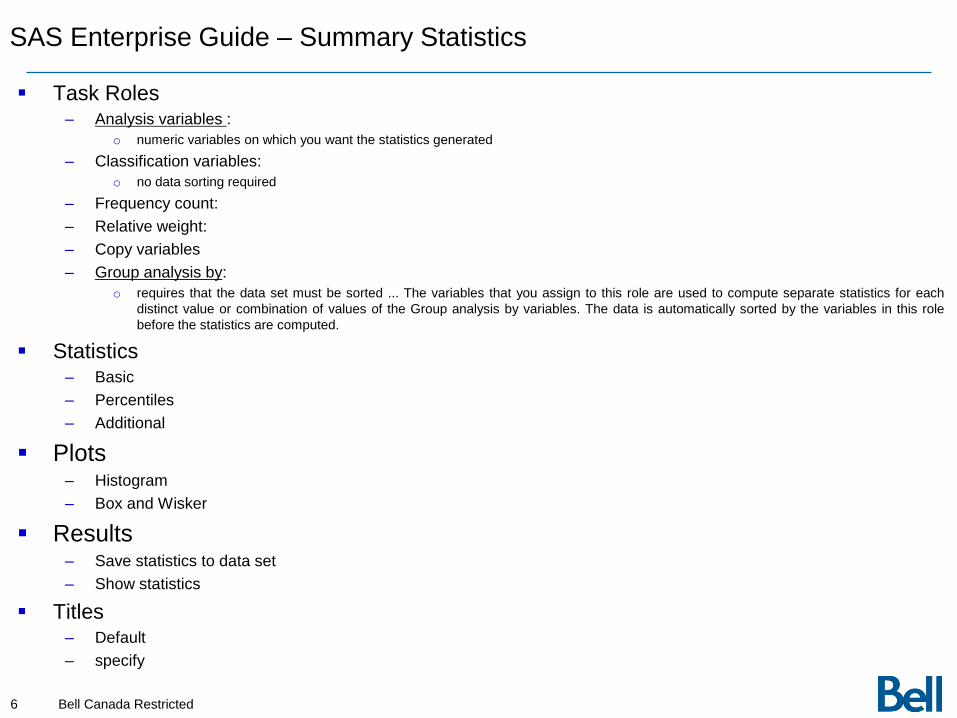
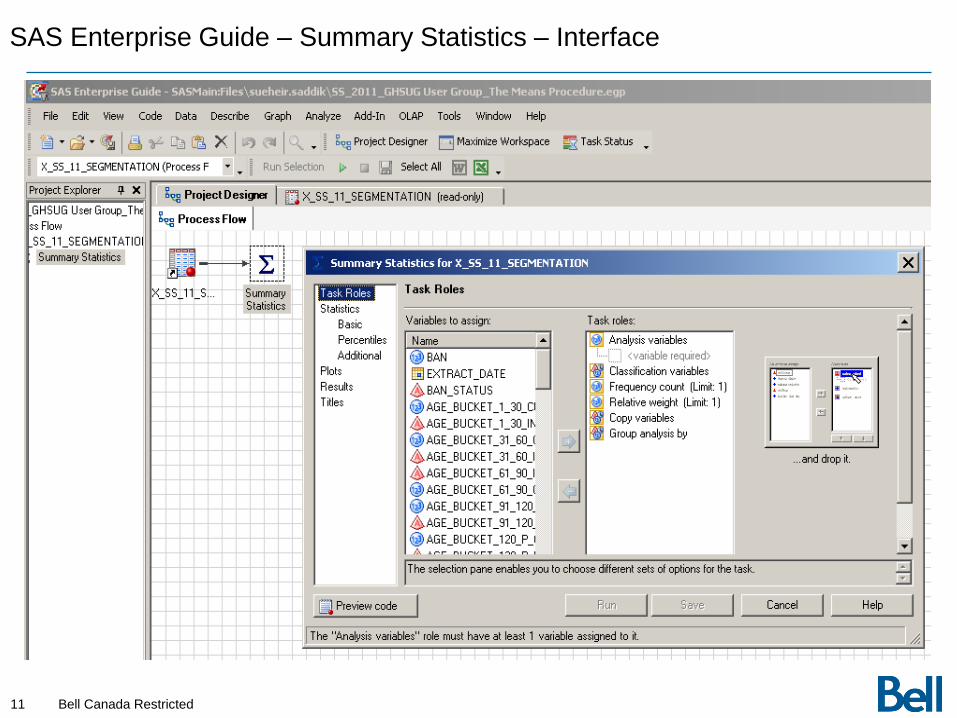
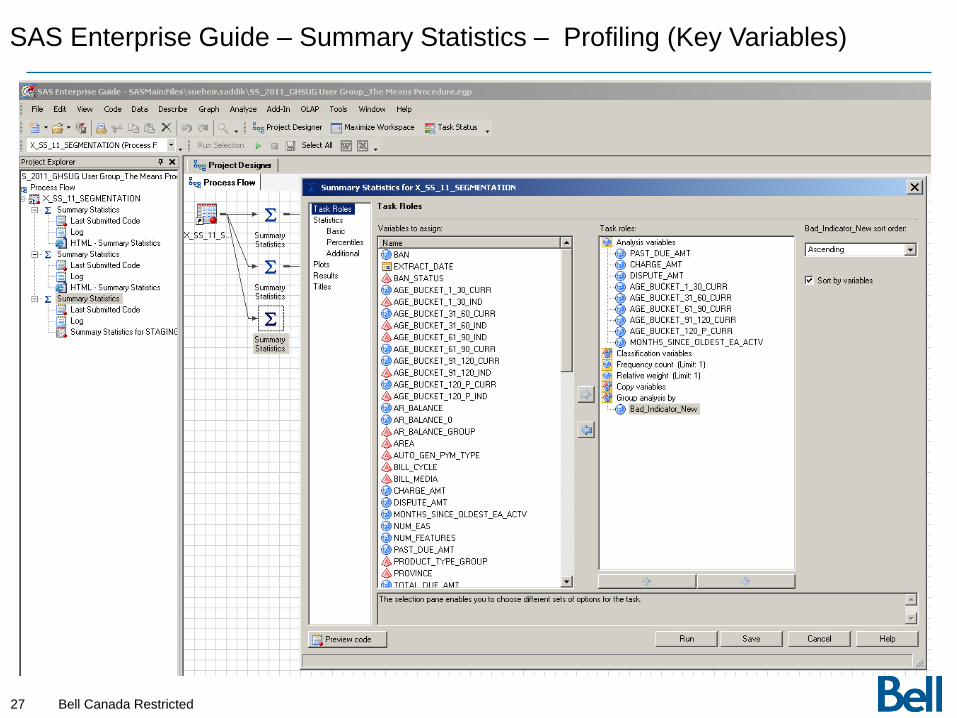
SAS Enterprise Guide – Summary Statistics
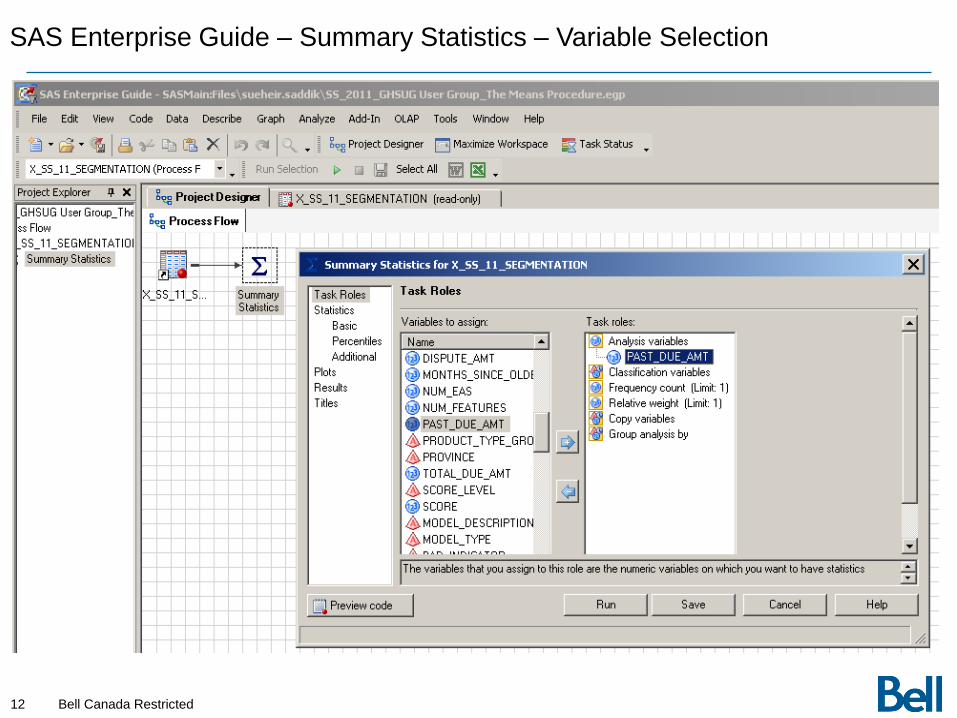
Task Roles – Analysis variables :
o numeric variables on which you want the statistics generated
– Classification variables:
o no data sorting required
– Frequency count:
– Relative weight:
– Copy variables
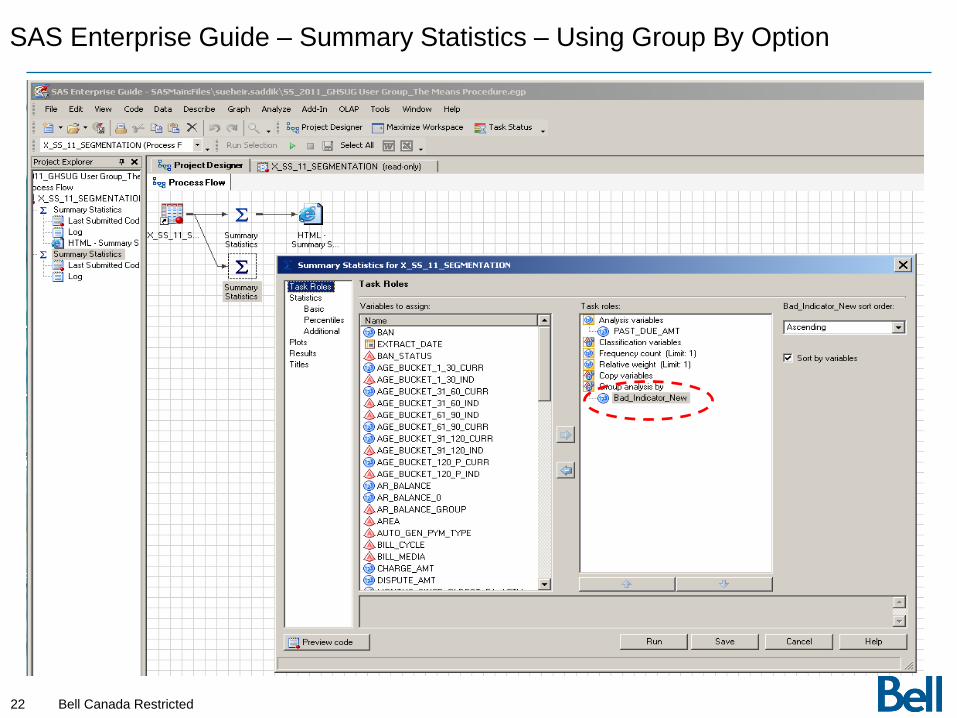
– Group analysis by:
o requires that the data set must be sorted ... The variables that you assign to this role are used to compute separate statistics for each
distinct value or combination of values of the Group analysis by variables. The data is automatically sorted by the variables in this role
before the statistics are computed.
Statistics – Basic
– Percentiles
– Additional
Plots – Histogram
– Box and Wisker
Results – Save statistics to data set
– Show statistics
Titles – Default
– specify
7 Bell Canada Restricted
SAS Enterprise Guide – Summary Statistics ... Cont‟d
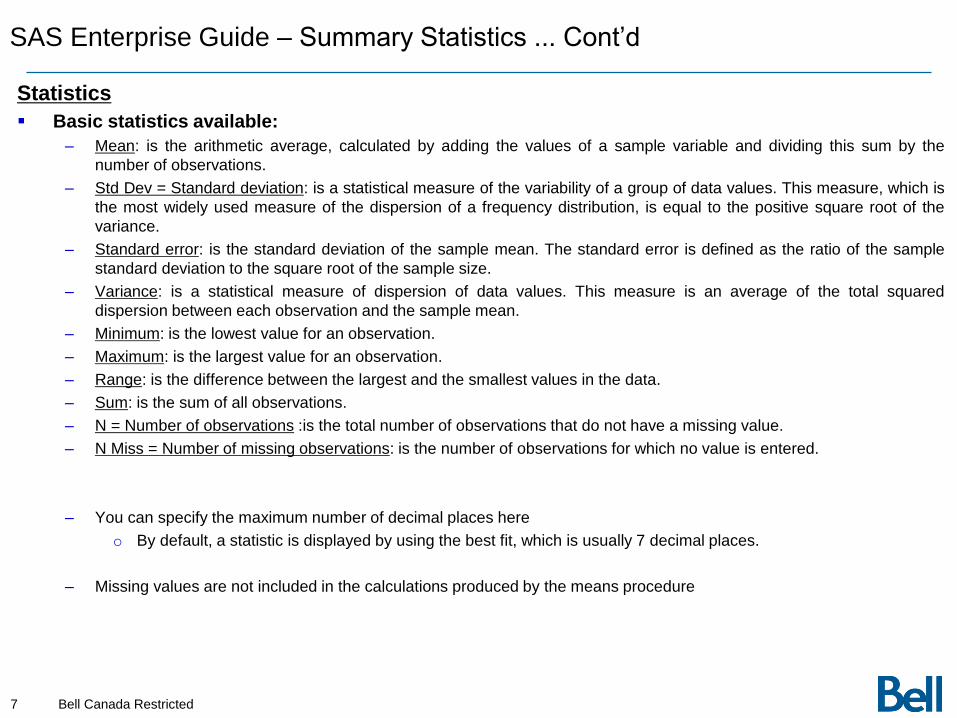
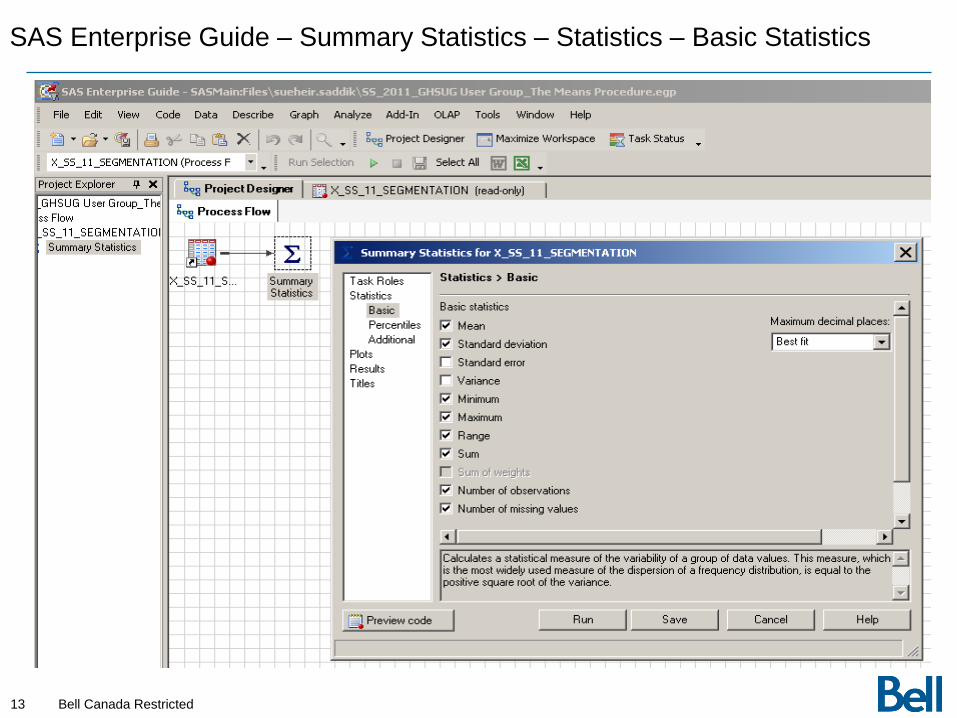
Statistics
Basic statistics available:
– Mean: is the arithmetic average, calculated by adding the values of a sample variable and dividing this sum by the
number of observations.
– Std Dev = Standard deviation: is a statistical measure of the variability of a group of data values. This measure, which is
the most widely used measure of the dispersion of a frequency distribution, is equal to the positive square root of the
variance.
– Standard error: is the standard deviation of the sample mean. The standard error is defined as the ratio of the sample
standard deviation to the square root of the sample size.
– Variance: is a statistical measure of dispersion of data values. This measure is an average of the total squared
dispersion between each observation and the sample mean.
– Minimum: is the lowest value for an observation.
– Maximum: is the largest value for an observation.
– Range: is the difference between the largest and the smallest values in the data.
– Sum: is the sum of all observations.
– N = Number of observations :is the total number of observations that do not have a missing value.
– N Miss = Number of missing observations: is the number of observations for which no value is entered.
– You can specify the maximum number of decimal places here
o By default, a statistic is displayed by using the best fit, which is usually 7 decimal places.
– Missing values are not included in the calculations produced by the means procedure
8 Bell Canada Restricted
SAS Enterprise Guide – Summary Statistics ...Cont‟d
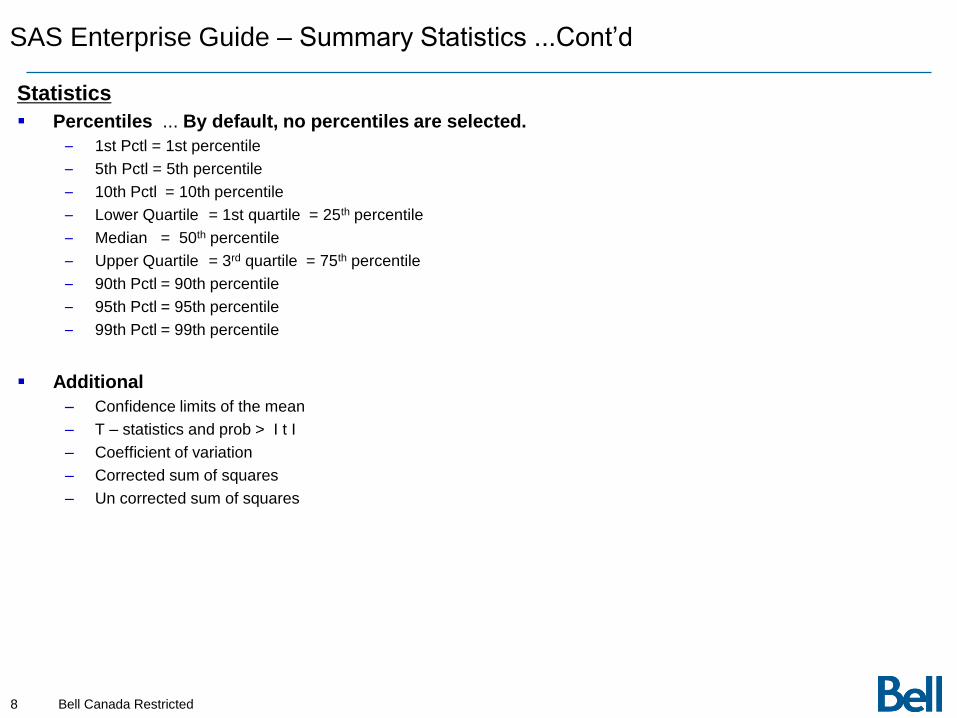
Statistics
Percentiles ... By default, no percentiles are selected.
– 1st Pctl = 1st percentile
– 5th Pctl = 5th percentile
– 10th Pctl = 10th percentile
– Lower Quartile = 1st quartile = 25th percentile
– Median = 50th percentile
– Upper Quartile = 3rd quartile = 75th percentile
– 90th Pctl = 90th percentile
– 95th Pctl = 95th percentile
– 99th Pctl = 99th percentile
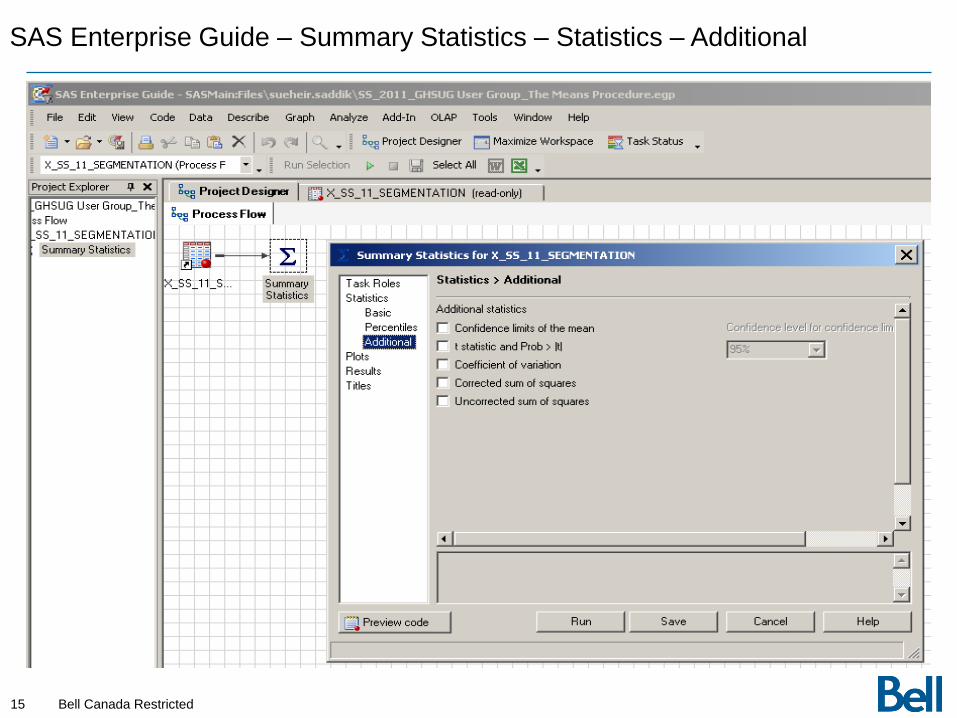
Additional
– Confidence limits of the mean
– T – statistics and prob > I t I
– Coefficient of variation
– Corrected sum of squares
– Un corrected sum of squares
9 Bell Canada Restricted
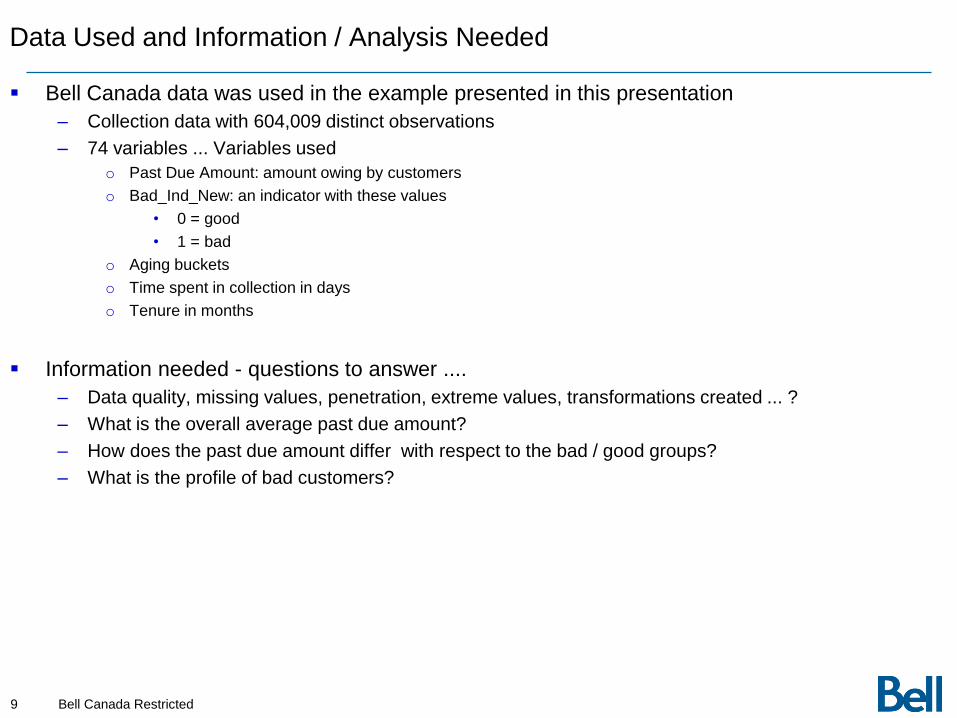
Data Used and Information / Analysis Needed
Bell Canada data was used in the example presented in this presentation
– Collection data with 604,009 distinct observations
– 74 variables ... Variables used
o Past Due Amount: amount owing by customers
o Bad_Ind_New: an indicator with these values
• 0 = good
• 1 = bad
o Aging buckets
o Time spent in collection in days
o Tenure in months
Information needed - questions to answer ....
– Data quality, missing values, penetration, extreme values, transformations created ... ?
– What is the overall average past due amount?
– How does the past due amount differ with respect to the bad / good groups?
– What is the profile of bad customers?
10 Bell Canada Restricted
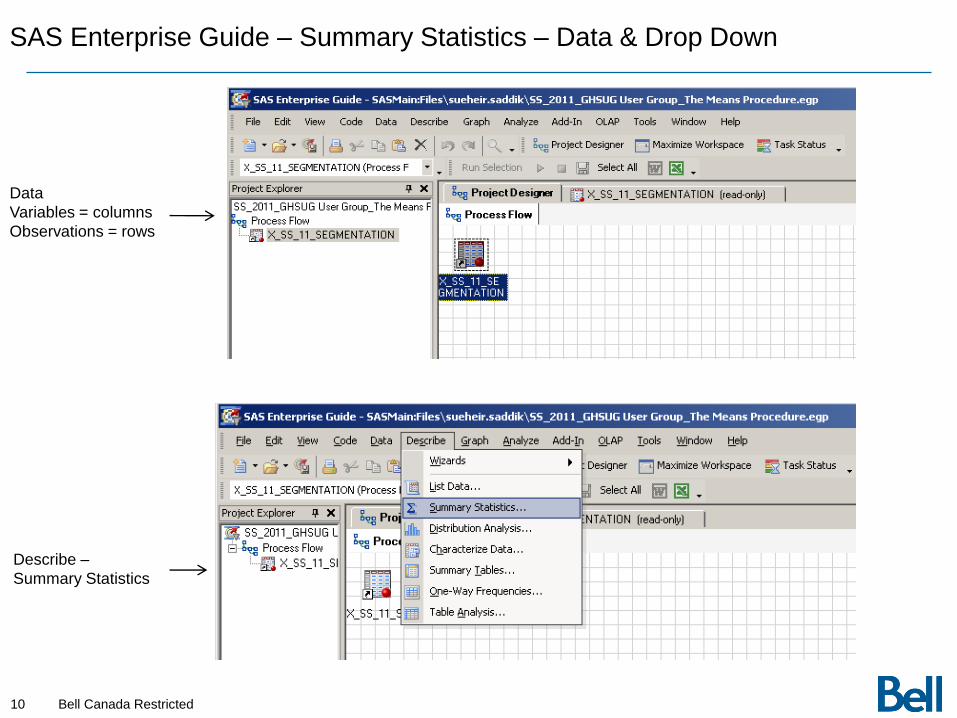
SAS Enterprise Guide – Summary Statistics – Data & Drop Down
Data
Variables = columns
Observations = rows
Describe –
Summary Statistics
11 Bell Canada Restricted
SAS Enterprise Guide – Summary Statistics – Interface
12 Bell Canada Restricted
SAS Enterprise Guide – Summary Statistics – Variable Selection
13 Bell Canada Restricted
SAS Enterprise Guide – Summary Statistics – Statistics – Basic Statistics

14 Bell Canada Restricted
SAS Enterprise Guide – Summary Statistics – Statistics – Percentiles
15 Bell Canada Restricted
SAS Enterprise Guide – Summary Statistics – Statistics – Additional
16 Bell Canada Restricted
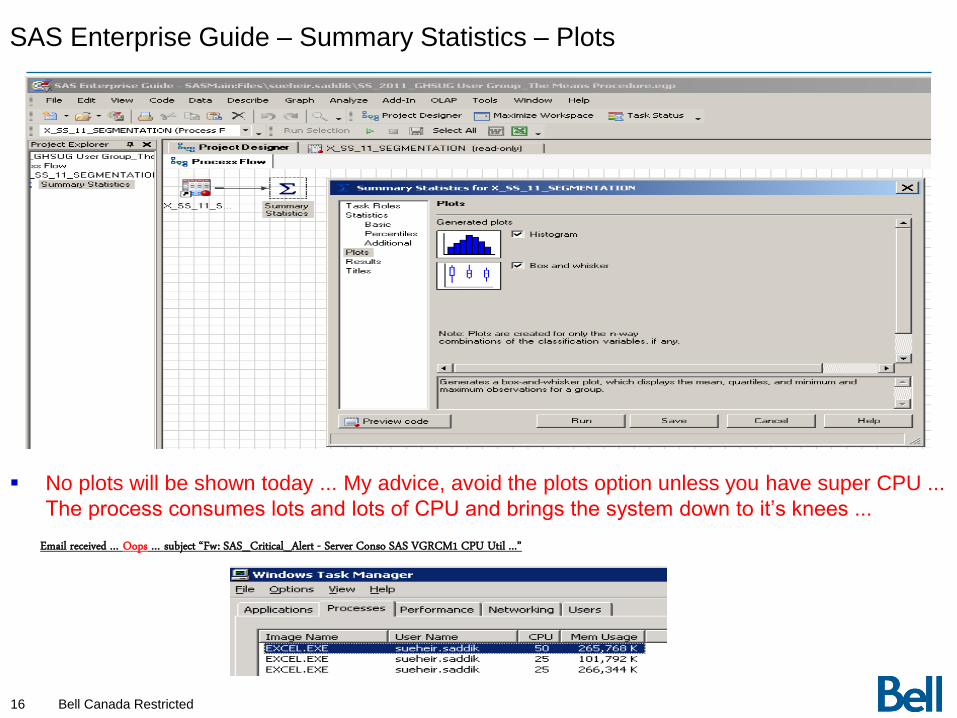
SAS Enterprise Guide – Summary Statistics – Plots
No plots will be shown today ... My advice, avoid the plots option unless you have super CPU ...
The process consumes lots and lots of CPU and brings the system down to it‟s knees ... Email received … Oops … subject “Fw: SAS_Critical_Alert - Server Conso SAS VGRCM1 CPU Util ...”
17 Bell Canada Restricted
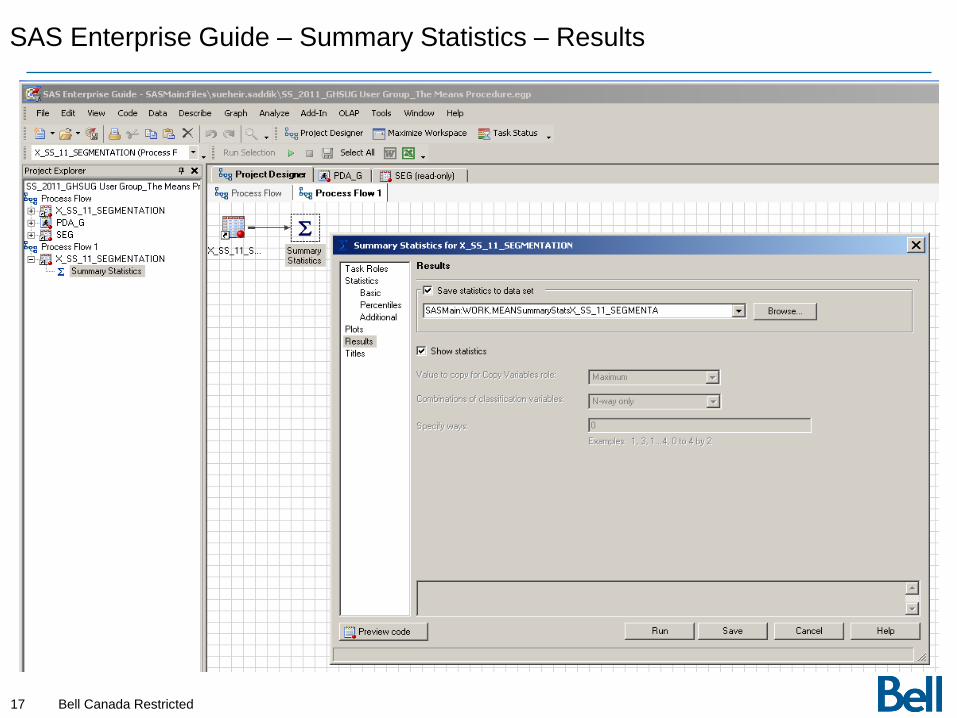
SAS Enterprise Guide – Summary Statistics – Results

18 Bell Canada Restricted
SAS Enterprise Guide – Summary Statistics – Titles
19 Bell Canada Restricted
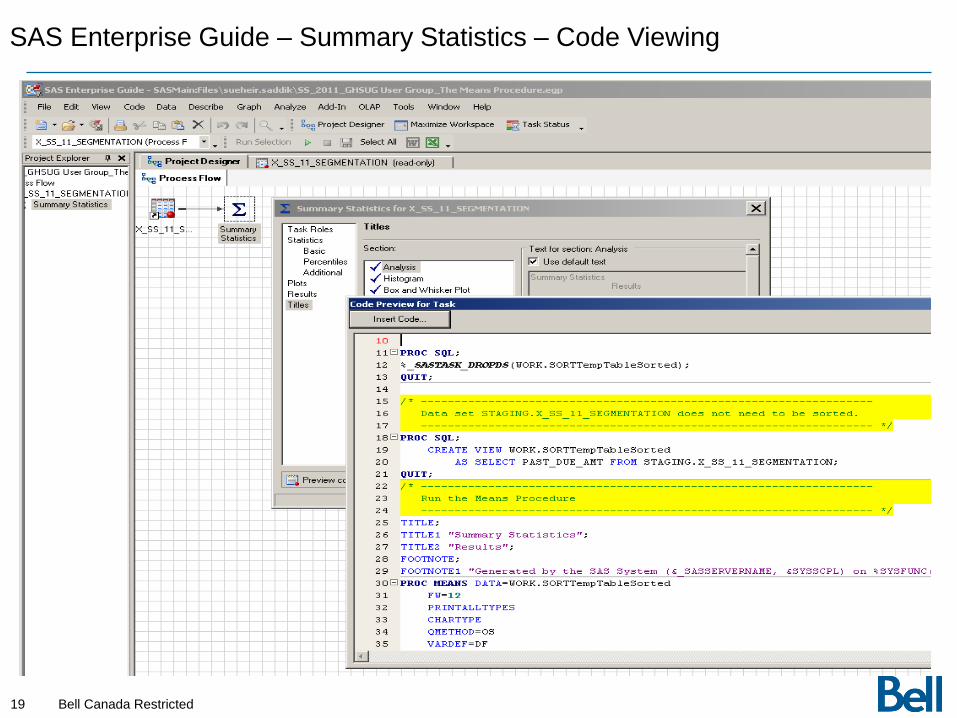
SAS Enterprise Guide – Summary Statistics – Code Viewing
20 Bell Canada Restricted
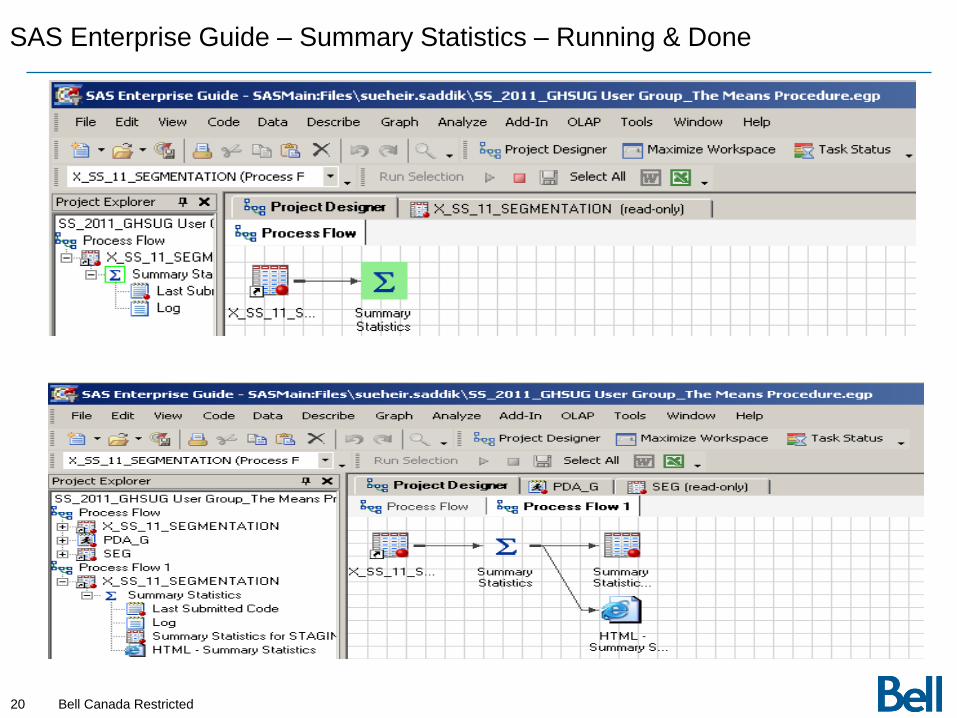
SAS Enterprise Guide – Summary Statistics – Running & Done
21 Bell Canada Restricted
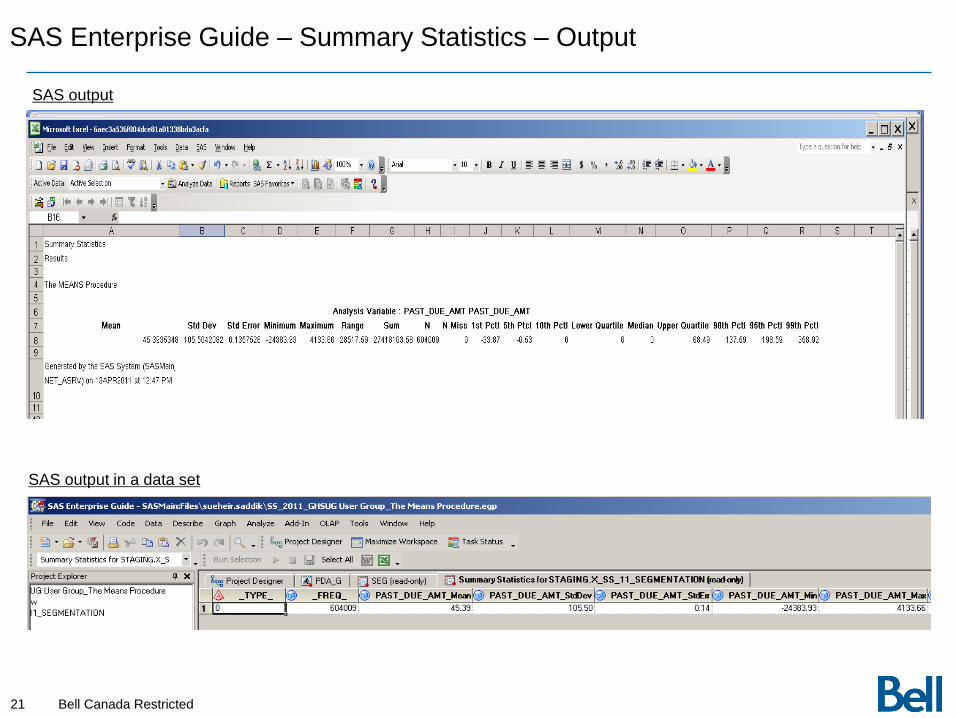
SAS Enterprise Guide – Summary Statistics – Output
SAS output in a data set
SAS output
22 Bell Canada Restricted
SAS Enterprise Guide – Summary Statistics – Using Group By Option
23 Bell Canada Restricted
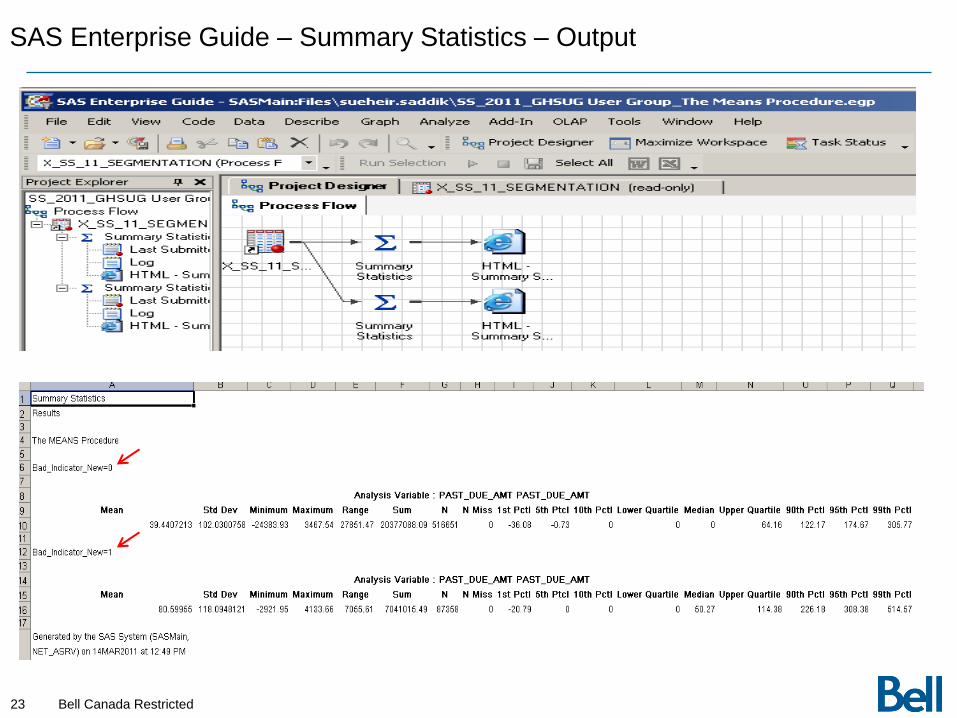
SAS Enterprise Guide – Summary Statistics – Output
24 Bell Canada Restricted
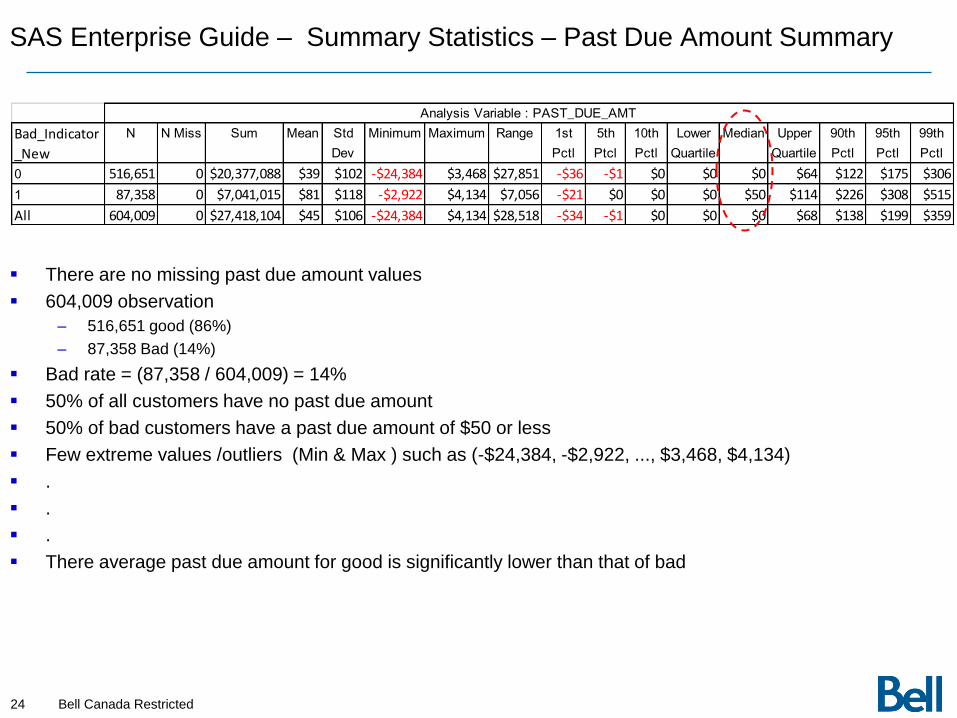
SAS Enterprise Guide – Summary Statistics – Past Due Amount Summary
There are no missing past due amount values
604,009 observation
– 516,651 good (86%)
– 87,358 Bad (14%)
Bad rate = (87,358 / 604,009) = 14%
50% of all customers have no past due amount
50% of bad customers have a past due amount of $50 or less
Few extreme values /outliers (Min & Max ) such as (-$24,384, -$2,922, ..., $3,468, $4,134)
.
.
.
There average past due amount for good is significantly lower than that of bad
Bad_Indicator
_New
N N Miss Sum Mean Std
Dev
Minimum Maximum Range 1st
Pctl
5th
Ptcl
10th
Pctl
Lower
Quartile
Median Upper
Quartile
90th
Pctl
95th
Pctl
99th
Pctl
0 516,651 0 $20,377,088 $39 $102 -$24,384 $3,468 $27,851 -$36 -$1 $0 $0 $0 $64 $122 $175 $306
1 87,358 0 $7,041,015 $81 $118 -$2,922 $4,134 $7,056 -$21 $0 $0 $0 $50 $114 $226 $308 $515
All 604,009 0 $27,418,104 $45 $106 -$24,384 $4,134 $28,518 -$34 -$1 $0 $0 $0 $68 $138 $199 $359
Analysis Variable : PAST_DUE_AMT

25 Bell Canada Restricted
SAS Enterprise Guide – Summary Statistics – Data / Code Checking
PAST_DUE_AMT_G=$0
Mean Minimum Maximum N N Miss 1st Pct l 5th Ptc l Median 95th Pct l 99th Pct l
0 0 0 276403 0 0 0 0 0 0
PAST_DUE_AMT_G=-ive
Mean Minimum Maximum N N Miss 1st Pct l 5th Ptc l Median 95th Pct l 99th Pct l
-32.2243993 -24383.93 -0.01 36913 0 -343.11 -100.3 -3.86 -0.09 -0.01
PAST_DUE_AMT_G=1-$0.01 to $75
Mean Minimum Maximum N N Miss 1st Pct l 5th Ptc l Median 95th Pct l 99th Pct l
46.6463012 0.01 75 160903 0 0.1 2.75 50.94 72.62 74.56
PAST_DUE_AMT_G=2-$75.01 to $150
Mean Minimum Maximum N N Miss 1st Pct l 5th Ptc l Median 95th Pct l 99th Pct l
106.2728741 75.01 150 77476 0 75.49 77.38 103.14 143.95 148.91
PAST_DUE_AMT_G=3-$150.01 to $250
Mean Minimum Maximum N N Miss 1st Pct l 5th Ptc l Median 95th Pct l 99th Pct l
190.4260796 150.01 250 35405 0 150.63 153.11 186.4 240.87 248.08
PAST_DUE_AMT_G=4-$250.01 to $500
Mean Minimum Maximum N N Miss 1st Pct l 5th Ptc l Median 95th Pct l 99th Pct l
326.9079031 250.01 500 15094 0 250.72 254.11 308.815 459.35 491.93
PAST_DUE_AMT_G=5-$500.01 +
Mean Minimum Maximum N N Miss 1st Pct l 5th Ptc l Median 95th Pct l 99th Pct l
656.8003251 500.05 4133.66 1815 0 502.24 507.38 591.94 995.9 1435.91
Analys is Variable : PAST_DUE_AMT PAST_DUE_AMT
Analys is Variable : PAST_DUE_AMT PAST_DUE_AMT
Analys is Variable : PAST_DUE_AMT PAST_DUE_AMT
Analys is Variable : PAST_DUE_AMT PAST_DUE_AMT
Analys is Variable : PAST_DUE_AMT PAST_DUE_AMT
Analys is Variable : PAST_DUE_AMT PAST_DUE_AMT
Analys is Variable : PAST_DUE_AMT PAST_DUE_AMT
Summary Statistics Interface SAS Code created if PAST_DUE_AMT < 0 then PAST_DUE_AMT_G = '-ive ';
else if PAST_DUE_AMT = 0 then PAST_DUE_AMT_G = '$0 ';
else if 0 < PAST_DUE_AMT <= 75 then PAST_DUE_AMT_G = '1-$0.01 to $75 ';
else if 75 < PAST_DUE_AMT <= 150 then PAST_DUE_AMT_G = '2-$75.01 to $150 „;
else if 150 < PAST_DUE_AMT <= 250 then PAST_DUE_AMT_G = '3-$150.01 to $250';
else if 250 < PAST_DUE_AMT <= 500 then PAST_DUE_AMT_G = '4-$250.01 to $500';
else if PAST_DUE_AMT > 500 then PAST_DUE_AMT_G = '5-$500.01 + ';
run;
SAS output
26 Bell Canada Restricted
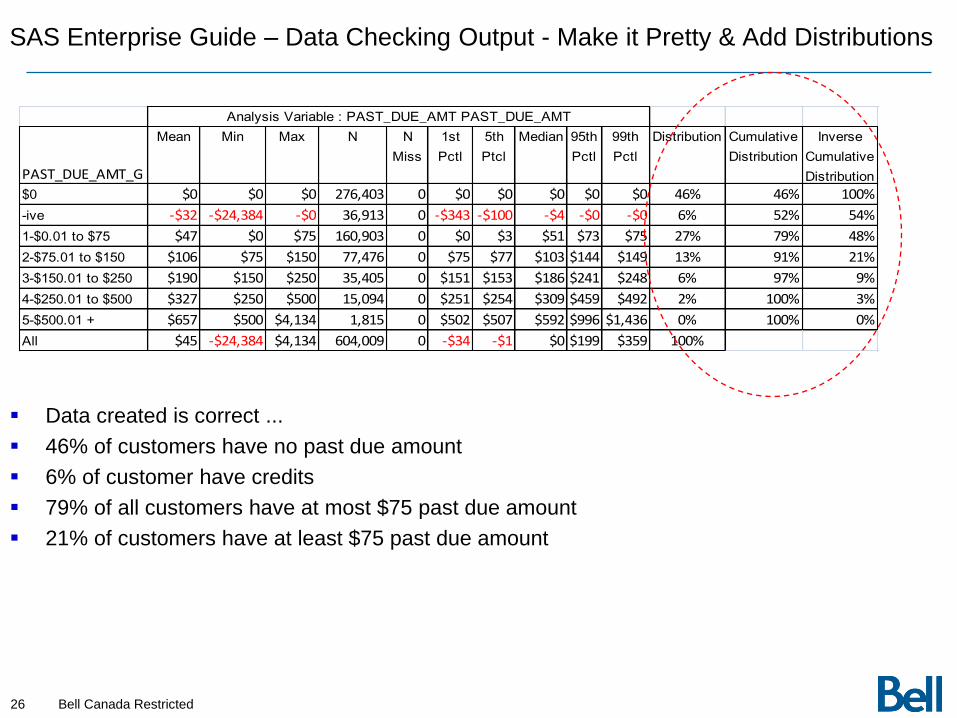
SAS Enterprise Guide – Data Checking Output - Make it Pretty & Add Distributions
PAST_DUE_AMT_G
Mean Min Max N N
Miss
1st
Pctl
5th
Ptcl
Median 95th
Pctl
99th
Pctl
Distribution Cumulative
Distribution
Inverse
Cumulative
Distribution
$0 $0 $0 $0 276,403 0 $0 $0 $0 $0 $0 46% 46% 100%
-ive -$32 -$24,384 -$0 36,913 0 -$343 -$100 -$4 -$0 -$0 6% 52% 54%
1-$0.01 to $75 $47 $0 $75 160,903 0 $0 $3 $51 $73 $75 27% 79% 48%
2-$75.01 to $150 $106 $75 $150 77,476 0 $75 $77 $103 $144 $149 13% 91% 21%
3-$150.01 to $250 $190 $150 $250 35,405 0 $151 $153 $186 $241 $248 6% 97% 9%
4-$250.01 to $500 $327 $250 $500 15,094 0 $251 $254 $309 $459 $492 2% 100% 3%
5-$500.01 + $657 $500 $4,134 1,815 0 $502 $507 $592 $996 $1,436 0% 100% 0%
All $45 -$24,384 $4,134 604,009 0 -$34 -$1 $0 $199 $359 100%
Analysis Variable : PAST_DUE_AMT PAST_DUE_AMT
Data created is correct ...
46% of customers have no past due amount
6% of customer have credits
79% of all customers have at most $75 past due amount
21% of customers have at least $75 past due amount
27 Bell Canada Restricted
SAS Enterprise Guide – Summary Statistics – Profiling (Key Variables)
28 Bell Canada Restricted
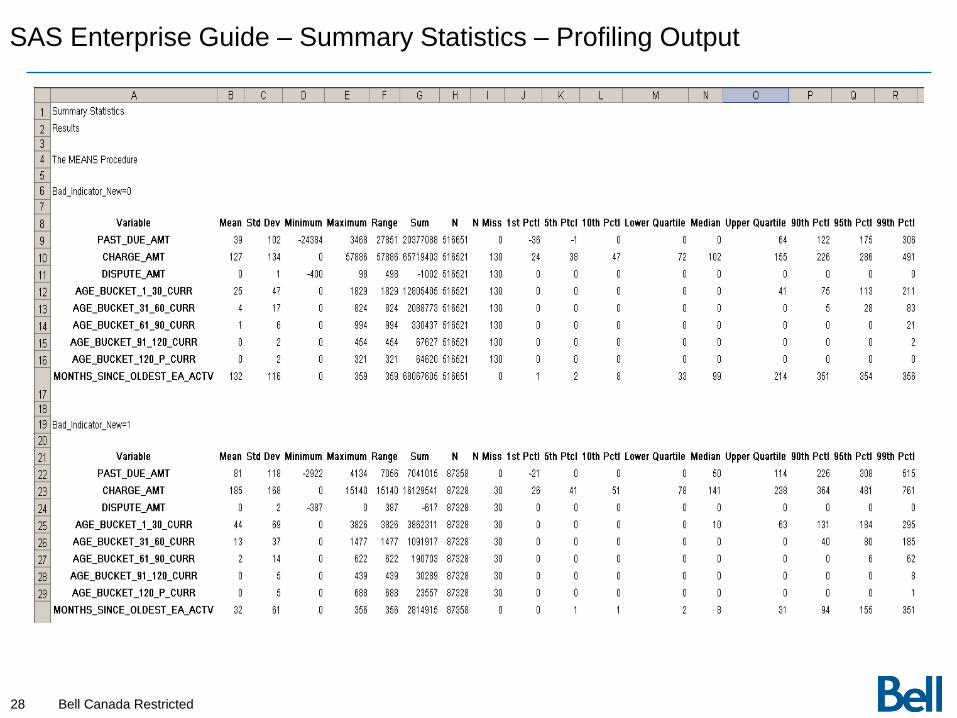
SAS Enterprise Guide – Summary Statistics – Profiling Output
29 Bell Canada Restricted
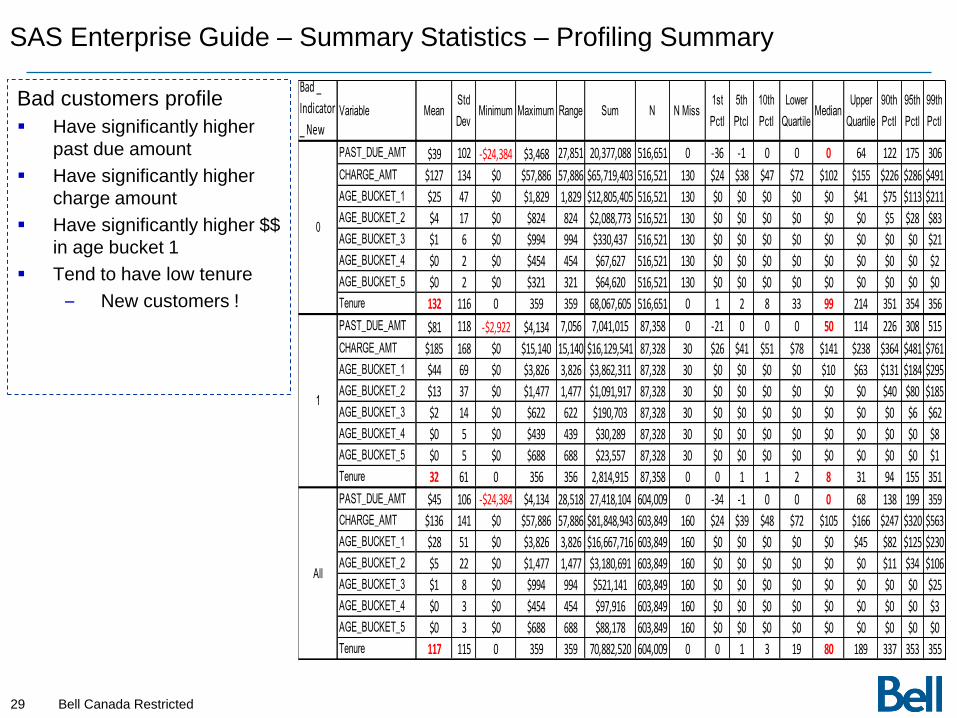
SAS Enterprise Guide – Summary Statistics – Profiling Summary
Bad customers profile
Have significantly higher
past due amount
Have significantly higher
charge amount
Have significantly higher $$
in age bucket 1
Tend to have low tenure
– New customers !
Bad _
Indicator
_ NewVariable Mean
Std
DevMinimum Maximum Range Sum N N Miss
1st
Pctl
5th
Ptcl
10th
Pctl
Lower
QuartileMedian
Upper
Quartile
90th
Pctl
95th
Pctl
99th
Pctl
PAST_DUE_AMT $39 102 -$24,384 $3,468 27,851 20,377,088 516,651 0 -36 -1 0 0 0 64 122 175 306
CHARGE_AMT $127 134 $0 $57,886 57,886 $65,719,403 516,521 130 $24 $38 $47 $72 $102 $155 $226 $286 $491
AGE_BUCKET_1 $25 47 $0 $1,829 1,829 $12,805,405 516,521 130 $0 $0 $0 $0 $0 $41 $75 $113 $211
AGE_BUCKET_2 $4 17 $0 $824 824 $2,088,773 516,521 130 $0 $0 $0 $0 $0 $0 $5 $28 $83
AGE_BUCKET_3 $1 6 $0 $994 994 $330,437 516,521 130 $0 $0 $0 $0 $0 $0 $0 $0 $21
AGE_BUCKET_4 $0 2 $0 $454 454 $67,627 516,521 130 $0 $0 $0 $0 $0 $0 $0 $0 $2
AGE_BUCKET_5 $0 2 $0 $321 321 $64,620 516,521 130 $0 $0 $0 $0 $0 $0 $0 $0 $0
Tenure 132 116 0 359 359 68,067,605 516,651 0 1 2 8 33 99 214 351 354 356
PAST_DUE_AMT $81 118 -$2,922 $4,134 7,056 7,041,015 87,358 0 -21 0 0 0 50 114 226 308 515
CHARGE_AMT $185 168 $0 $15,140 15,140 $16,129,541 87,328 30 $26 $41 $51 $78 $141 $238 $364 $481 $761
AGE_BUCKET_1 $44 69 $0 $3,826 3,826 $3,862,311 87,328 30 $0 $0 $0 $0 $10 $63 $131 $184 $295
AGE_BUCKET_2 $13 37 $0 $1,477 1,477 $1,091,917 87,328 30 $0 $0 $0 $0 $0 $0 $40 $80 $185
AGE_BUCKET_3 $2 14 $0 $622 622 $190,703 87,328 30 $0 $0 $0 $0 $0 $0 $0 $6 $62
AGE_BUCKET_4 $0 5 $0 $439 439 $30,289 87,328 30 $0 $0 $0 $0 $0 $0 $0 $0 $8
AGE_BUCKET_5 $0 5 $0 $688 688 $23,557 87,328 30 $0 $0 $0 $0 $0 $0 $0 $0 $1
Tenure 32 61 0 356 356 2,814,915 87,358 0 0 1 1 2 8 31 94 155 351
PAST_DUE_AMT $45 106 -$24,384 $4,134 28,518 27,418,104 604,009 0 -34 -1 0 0 0 68 138 199 359
CHARGE_AMT $136 141 $0 $57,886 57,886 $81,848,943 603,849 160 $24 $39 $48 $72 $105 $166 $247 $320 $563
AGE_BUCKET_1 $28 51 $0 $3,826 3,826 $16,667,716 603,849 160 $0 $0 $0 $0 $0 $45 $82 $125 $230
AGE_BUCKET_2 $5 22 $0 $1,477 1,477 $3,180,691 603,849 160 $0 $0 $0 $0 $0 $0 $11 $34 $106
AGE_BUCKET_3 $1 8 $0 $994 994 $521,141 603,849 160 $0 $0 $0 $0 $0 $0 $0 $0 $25
AGE_BUCKET_4 $0 3 $0 $454 454 $97,916 603,849 160 $0 $0 $0 $0 $0 $0 $0 $0 $3
AGE_BUCKET_5 $0 3 $0 $688 688 $88,178 603,849 160 $0 $0 $0 $0 $0 $0 $0 $0 $0
Tenure 117 115 0 359 359 70,882,520 604,009 0 0 1 3 19 80 189 337 353 355
0
1
All

30 Bell Canada Restricted
Questions ?


![2970-0-05-0050_0_1[1] HAZID procedure](https://img.pdfslide.net/doc/110x75/577ca80c1a28abea748cac67/2970-0-05-0050011-hazid-procedure.jpg)