Embed Size (px)
Citation preview

The Measurement of Capabilities – Welfare Economics Beyond GDP
Paul AnandThe Open University
Economics
AHRB Research Team
• Paul Anand, The Open University• Ian Carter, Universita di Pavia• Keith Dowding, London School of Economics• Francesco Guala, Exeter University• Martin van Hees, Groningen Universiteit• Graham Hunter, The Open University
with help from Maria Sigala (Oxford), Ingrid Robeyns (Leiden), Ron Smith (Birkbeck) and Cristina Santos (UCL/Open)

Plan
• Motivation and Context
• Theory
• Data Design
• Some results and analysis
• Conclusions to date and next steps
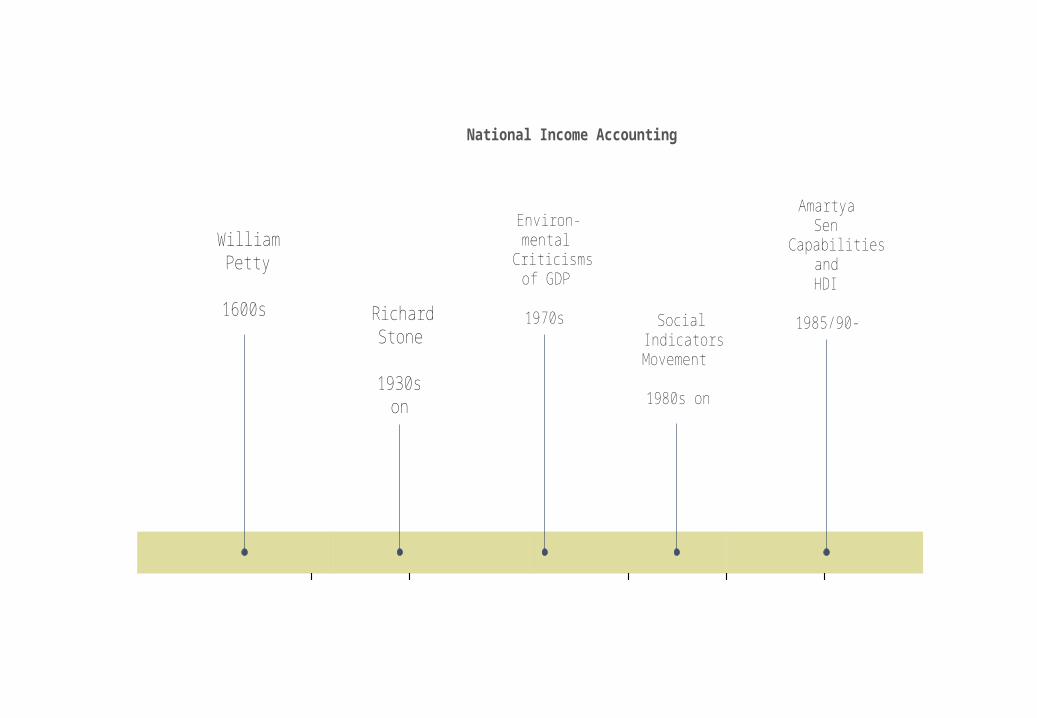
National Income Accounting
WilliamPetty
1600s RichardStone
1930son
Environ-mental
Criticismsof GDP
1970s SocialIndicatorsMovement
1980s on
AmartyaSen
CapabilitiesandHDI
1985/90-
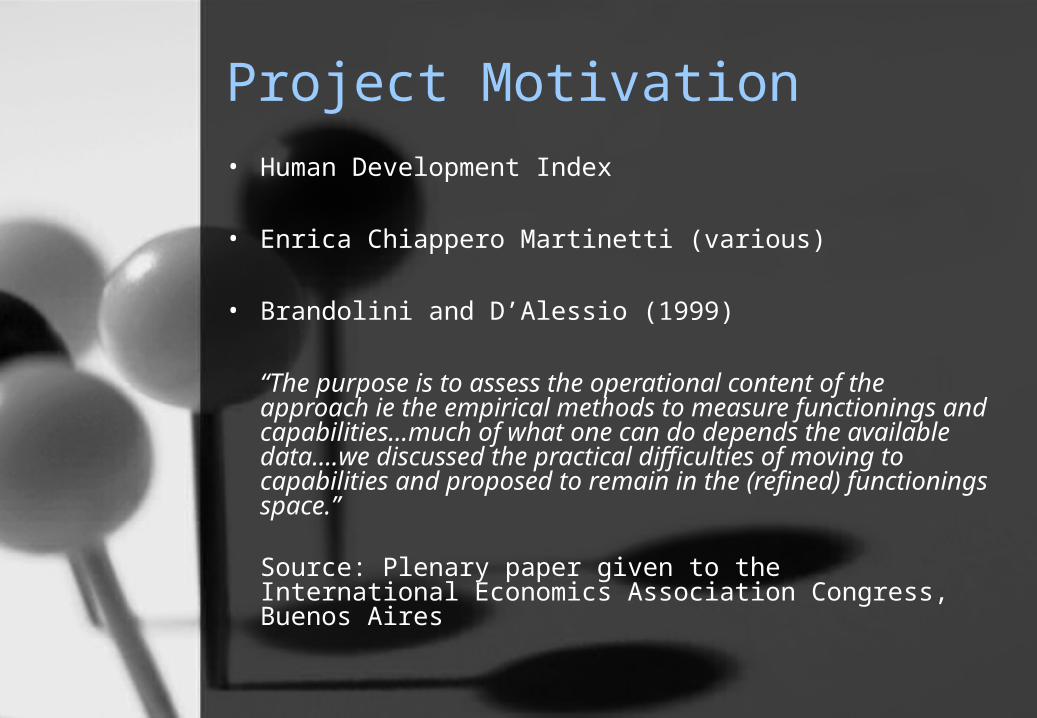
Project Motivation• Human Development Index
• Enrica Chiappero Martinetti (various)
• Brandolini and D’Alessio (1999)
“The purpose is to assess the operational content of the approach ie the empirical methods to measure functionings and capabilities…much of what one can do depends the available data….we discussed the practical difficulties of moving to capabilities and proposed to remain in the (refined) functionings space.”
Source: Plenary paper given to the International Economics Association Congress, Buenos Aires
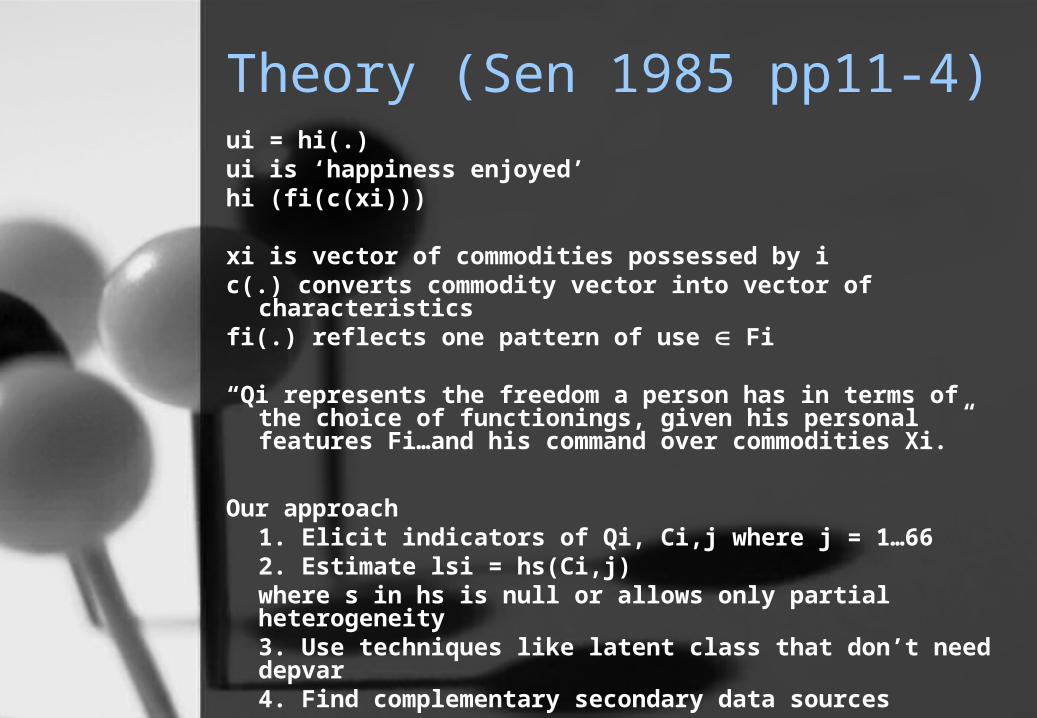
Theory (Sen 1985 pp11-4)ui = hi(.)ui is ‘happiness enjoyed’hi (fi(c(xi)))
xi is vector of commodities possessed by ic(.) converts commodity vector into vector of characteristicsfi(.) reflects one pattern of use Fi
“Qi represents the freedom a person has in terms of the choice of functionings, given his personal features Fi…and his command over commodities Xi.”
Our approach1. Elicit indicators of Qi, Ci,j where j = 1…662. Estimate lsi = hs(Ci,j)where s in hs is null or allows only partial heterogeneity3. Use techniques like latent class that don’t need depvar4. Find complementary secondary data sources
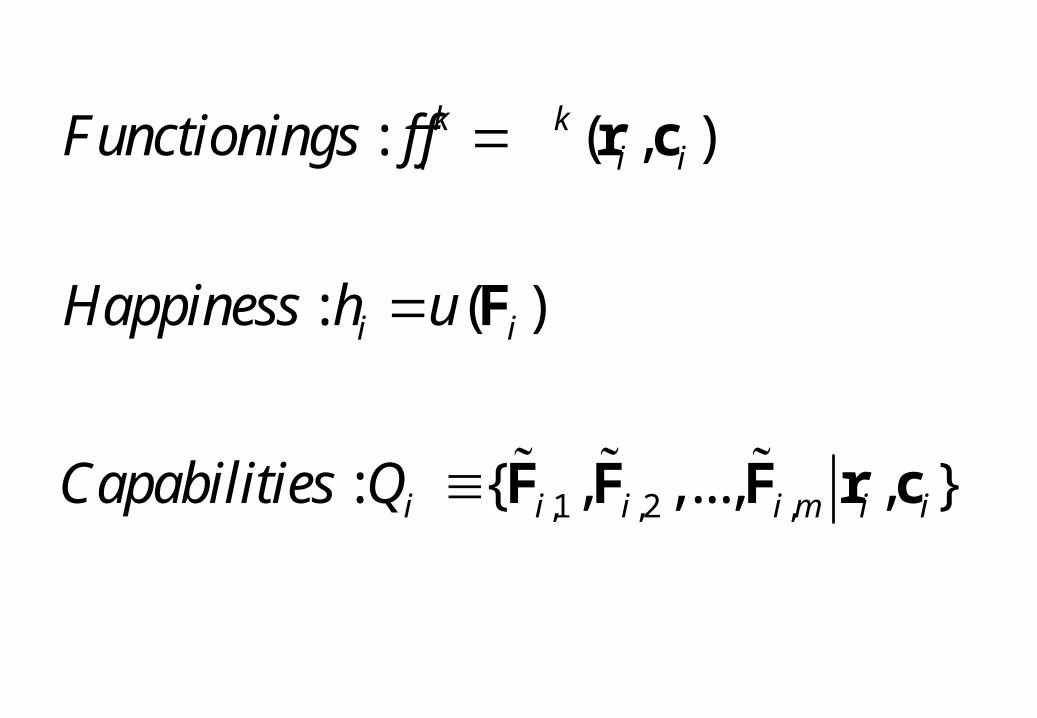
,1 ,2 ,
: ( , )
: ( )
: { , ,..., , }
k ki i i
i i
i i i i m i i
Functionings f f
Happiness h u
Capabilities Q
r c
F
F F F r c
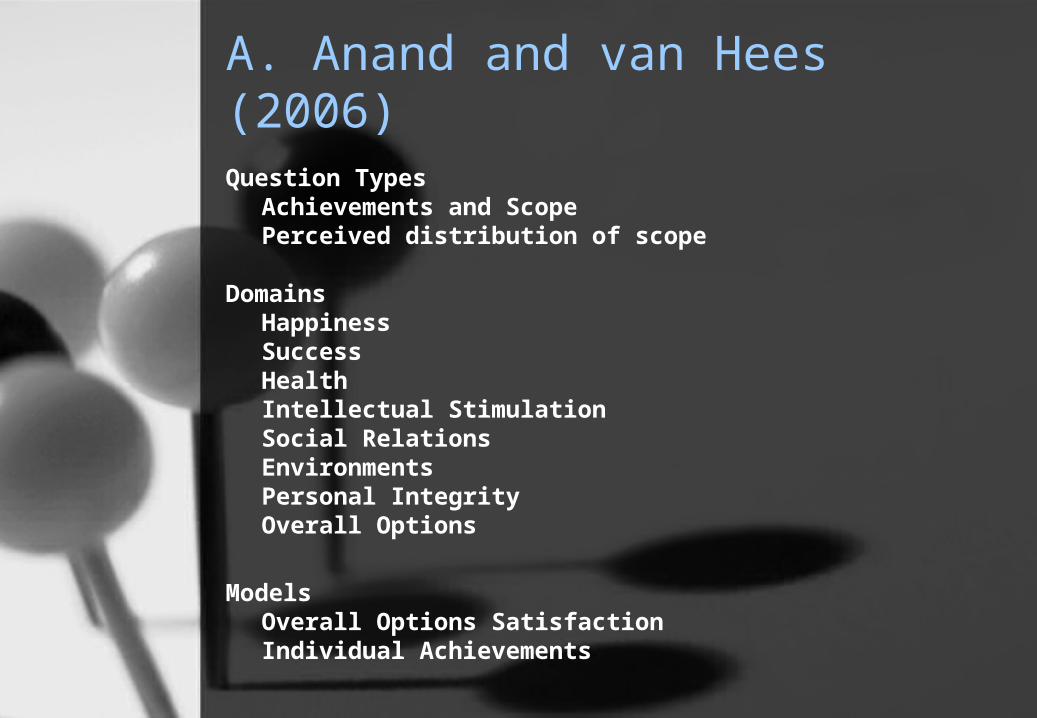
A. Anand and van Hees (2006)
Question TypesAchievements and ScopePerceived distribution of scope
DomainsHappinessSuccessHealthIntellectual StimulationSocial RelationsEnvironmentsPersonal IntegrityOverall Options
ModelsOverall Options SatisfactionIndividual Achievements
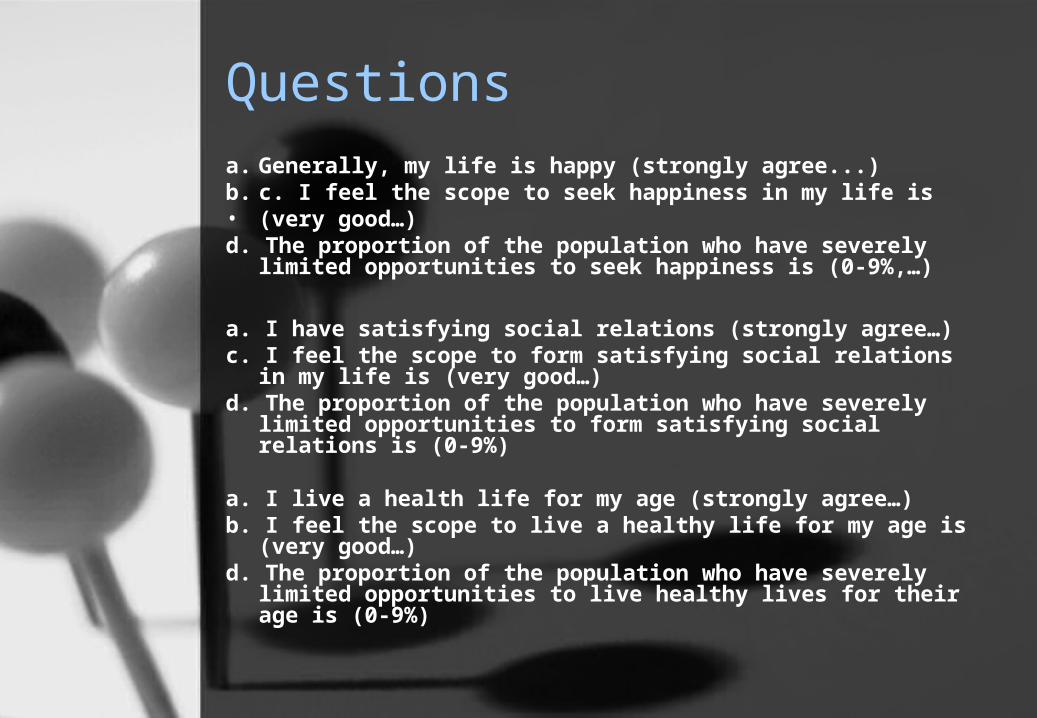
Questionsa. Generally, my life is happy (strongly agree...)b. c. I feel the scope to seek happiness in my life is • (very good…)d. The proportion of the population who have severely limited
opportunities to seek happiness is (0-9%,…)
a. I have satisfying social relations (strongly agree…)c. I feel the scope to form satisfying social relations in my life is
(very good…)d. The proportion of the population who have severely limited
opportunities to form satisfying social relations is (0-9%)
a. I live a health life for my age (strongly agree…)b. I feel the scope to live a healthy life for my age is (very good…)d. The proportion of the population who have severely limited
opportunities to live healthy lives for their age is (0-9%)
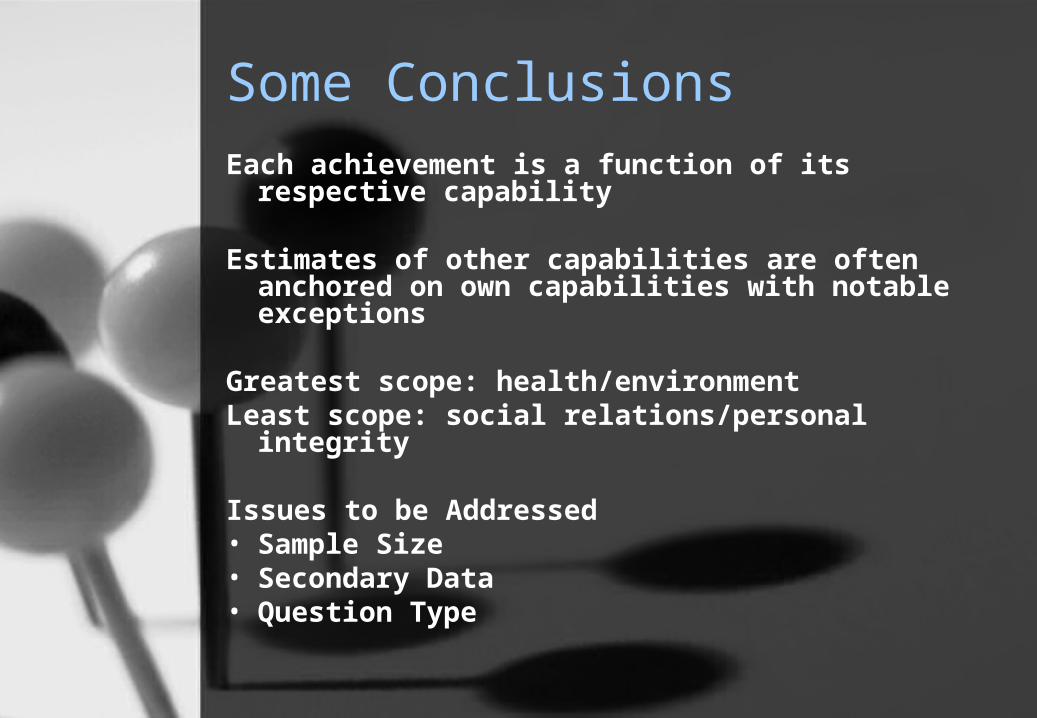
Some ConclusionsEach achievement is a function of its respective
capability
Estimates of other capabilities are often anchored on own capabilities with notable exceptions
Greatest scope: health/environmentLeast scope: social relations/personal integrity
Issues to be Addressed• Sample Size• Secondary Data• Question Type
B. Anand Hunter and Smith (2005) Social Indicators Research
Aim
Explore links between satisfaction and capabilities using BHPS data
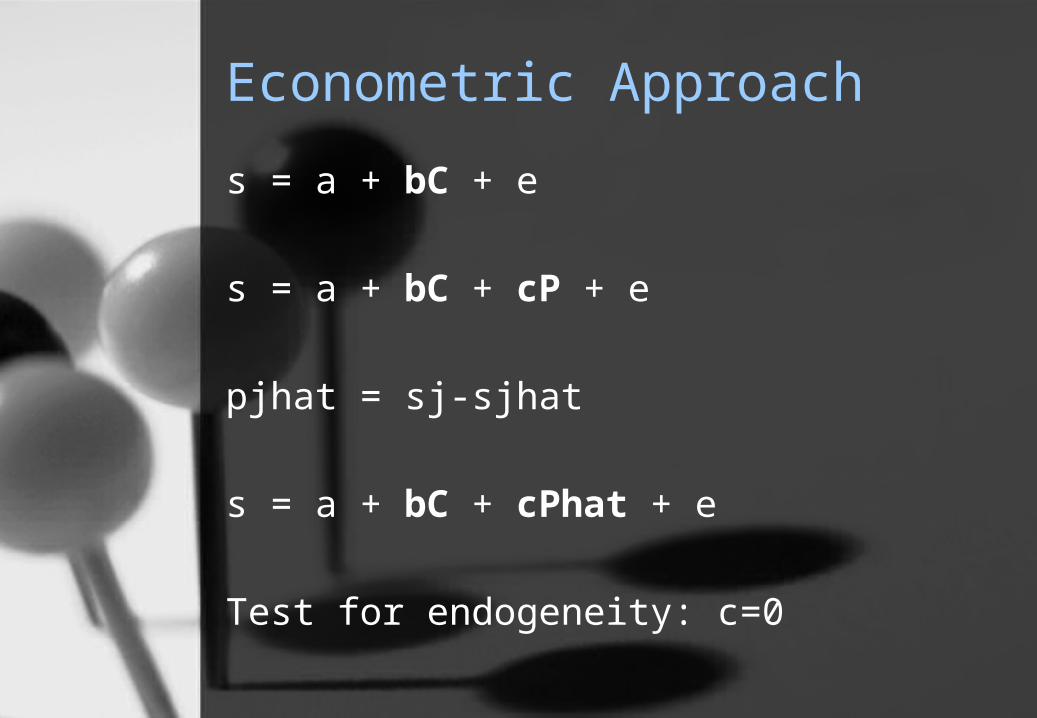
Econometric Approach
s = a + bC + e
s = a + bC + cP + e
pjhat = sj-sjhat
s = a + bC + cPhat + e
Test for endogeneity: c=0
Adaptation Issues
Need for a Normative Theory
If Complete and Instantaneous ‘Goods’ would have no observable impact on life satisfaction
There is some evidence of adaptation especially to improvements so capabilities which impact life satisfaction are only the utilitarian capabilities
Two Conclusions
Person specific effects significant
Secondary data exists but is sparse
C. AHRB Project to Measure Capabilities
Research Question
Can we measure capabilities across a wide spectrum of human domains within the conventions applicable to national household and social surveys?
Framework for Questions
• Nussbaum (2000) – similar to many others
Rationale
Comprehensive
Robust
Don’t require universal claims
Has normative grounding
Question Categories
• Life• Bodily Health• Bodily Integrity• Senses Imagination and Thought• Emotions• Practical Reason• Affiliation• Nature• Leisure• Control over one’s Environment
Bodily Health
• Being able to have good health, including reproductive health; to be adequately nourished; to have adequate shelter
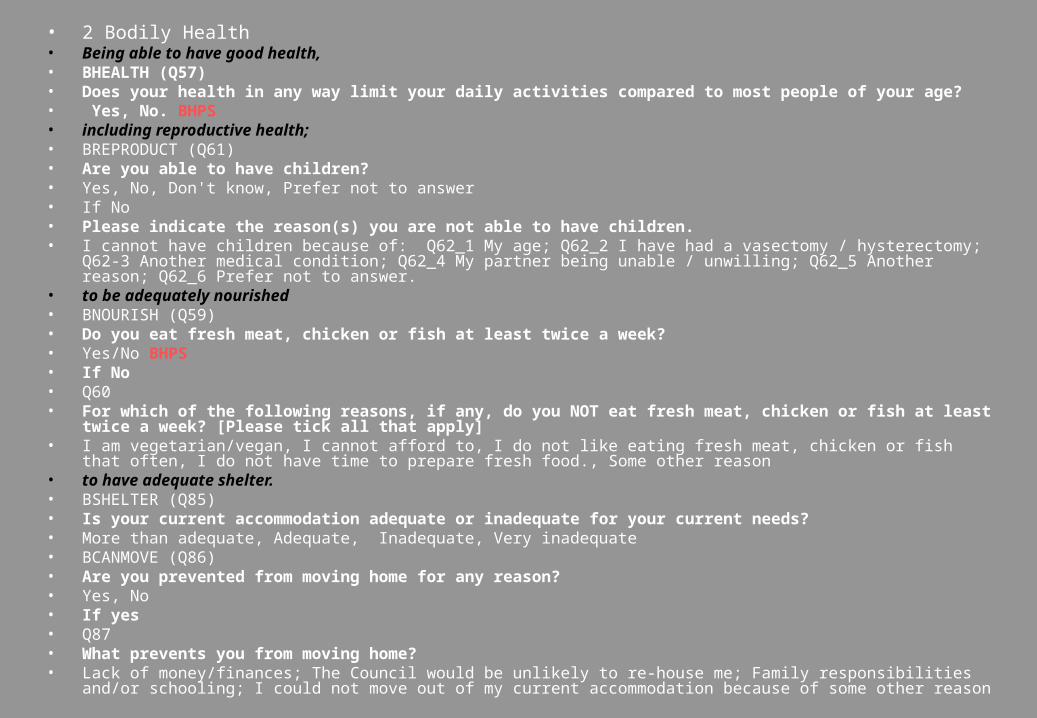
• 2 Bodily Health• Being able to have good health, • BHEALTH (Q57)• Does your health in any way limit your daily activities compared to most people of your age?• Yes, No. BHPS• including reproductive health;• BREPRODUCT (Q61)• Are you able to have children?• Yes, No, Don't know, Prefer not to answer• If No• Please indicate the reason(s) you are not able to have children. • I cannot have children because of: Q62_1 My age; Q62_2 I have had a vasectomy / hysterectomy; Q62-3 Another medical
condition; Q62_4 My partner being unable / unwilling; Q62_5 Another reason; Q62_6 Prefer not to answer.• to be adequately nourished • BNOURISH (Q59)• Do you eat fresh meat, chicken or fish at least twice a week? • Yes/No BHPS• If No• Q60• For which of the following reasons, if any, do you NOT eat fresh meat, chicken or fish at least twice a week? [Please tick
all that apply]• I am vegetarian/vegan, I cannot afford to, I do not like eating fresh meat, chicken or fish that often, I do not have time to prepare
fresh food., Some other reason• to have adequate shelter.• BSHELTER (Q85)• Is your current accommodation adequate or inadequate for your current needs?• More than adequate, Adequate, Inadequate, Very inadequate• BCANMOVE (Q86)• Are you prevented from moving home for any reason?• Yes, No• If yes• Q87• What prevents you from moving home? • Lack of money/finances; The Council would be unlikely to re-house me; Family responsibilities and/or schooling; I could not move
out of my current accommodation because of some other reason
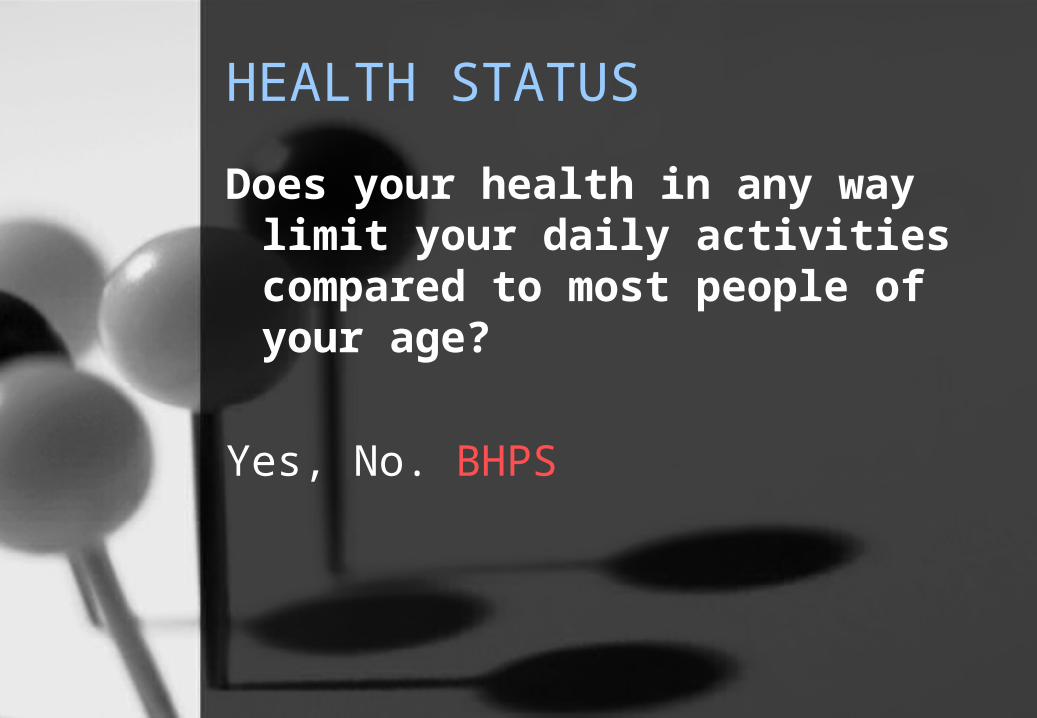
HEALTH STATUS
Does your health in any way limit your daily activities compared to most people of your age?
Yes, No. BHPS
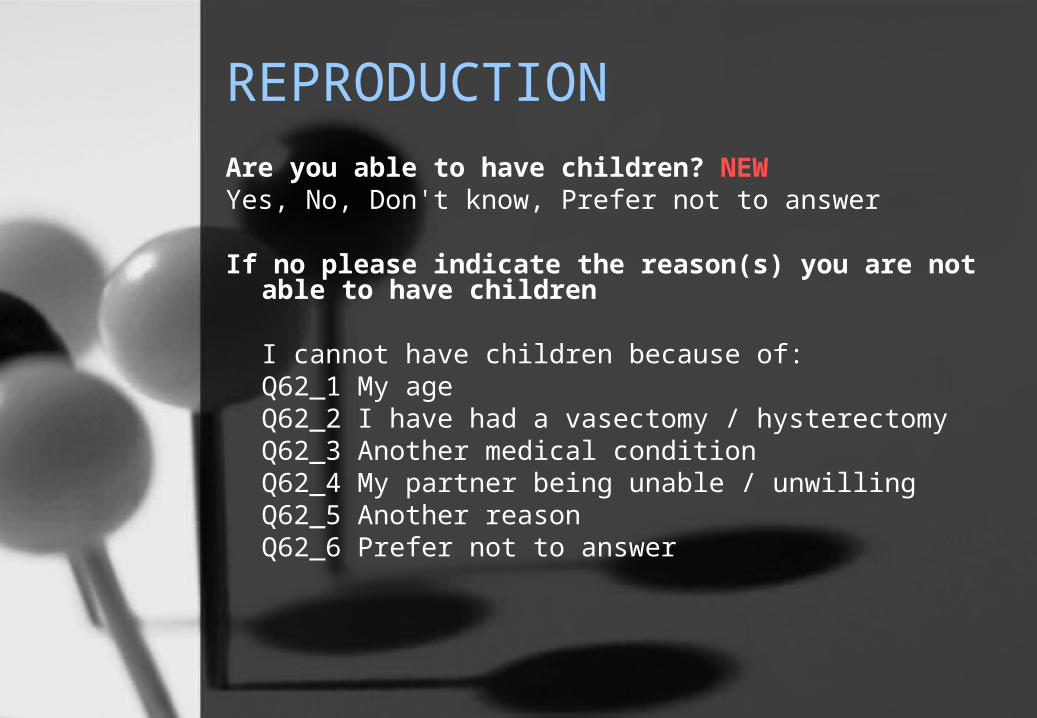
REPRODUCTIONAre you able to have children? NEWYes, No, Don't know, Prefer not to answer
If no please indicate the reason(s) you are not able to have children
I cannot have children because of: Q62_1 My ageQ62_2 I have had a vasectomy / hysterectomyQ62_3 Another medical conditionQ62_4 My partner being unable / unwillingQ62_5 Another reasonQ62_6 Prefer not to answer
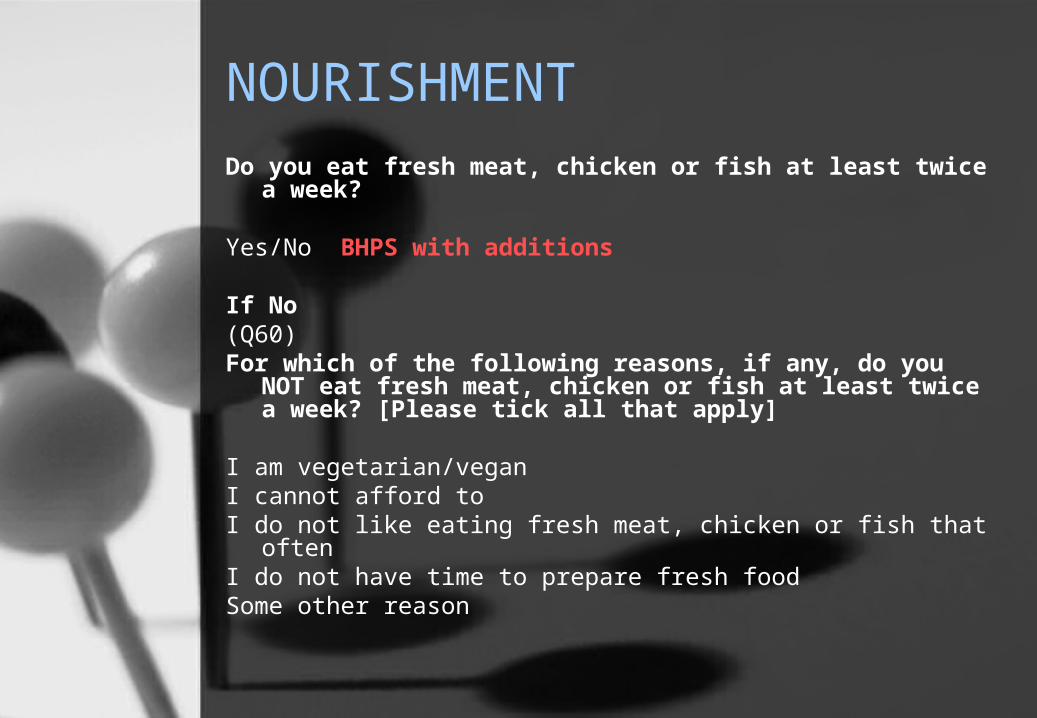
NOURISHMENTDo you eat fresh meat, chicken or fish at least twice a week?
Yes/No BHPS with additions
If No(Q60)For which of the following reasons, if any, do you NOT eat fresh
meat, chicken or fish at least twice a week? [Please tick all that apply]
I am vegetarian/veganI cannot afford toI do not like eating fresh meat, chicken or fish that often I do not have time to prepare fresh foodSome other reason
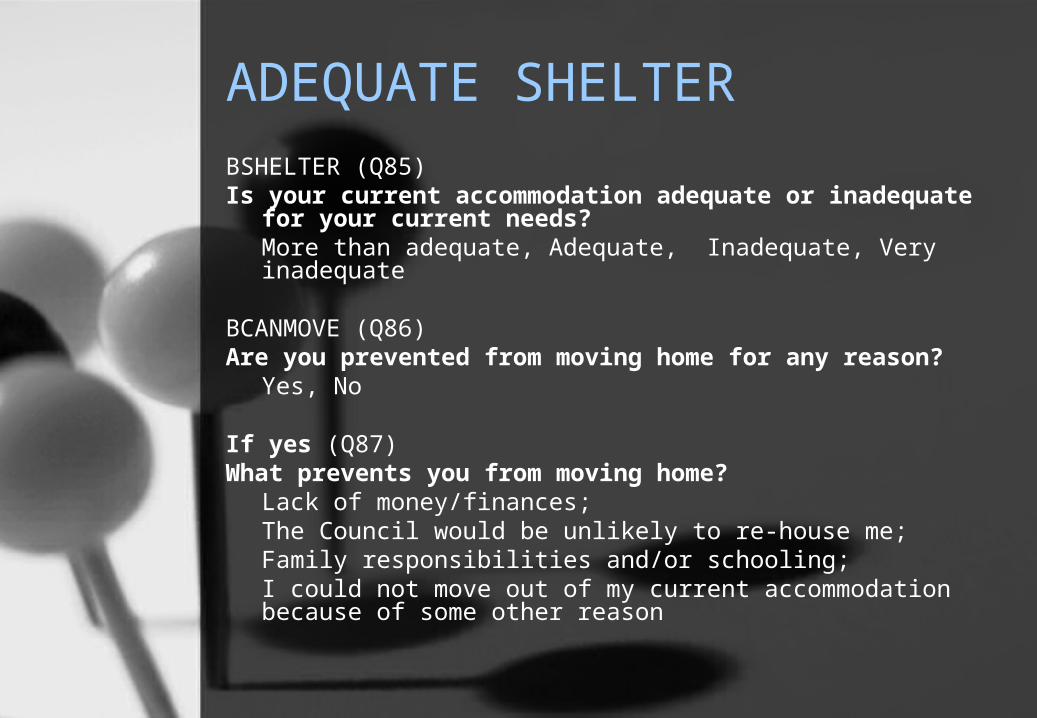
ADEQUATE SHELTERBSHELTER (Q85)Is your current accommodation adequate or inadequate for your
current needs?More than adequate, Adequate, Inadequate, Very inadequate
BCANMOVE (Q86)Are you prevented from moving home for any reason?
Yes, No
If yes (Q87)What prevents you from moving home?
Lack of money/finances; The Council would be unlikely to re-house me; Family responsibilities and/or schooling; I could not move out of my current accommodation because of some other reason
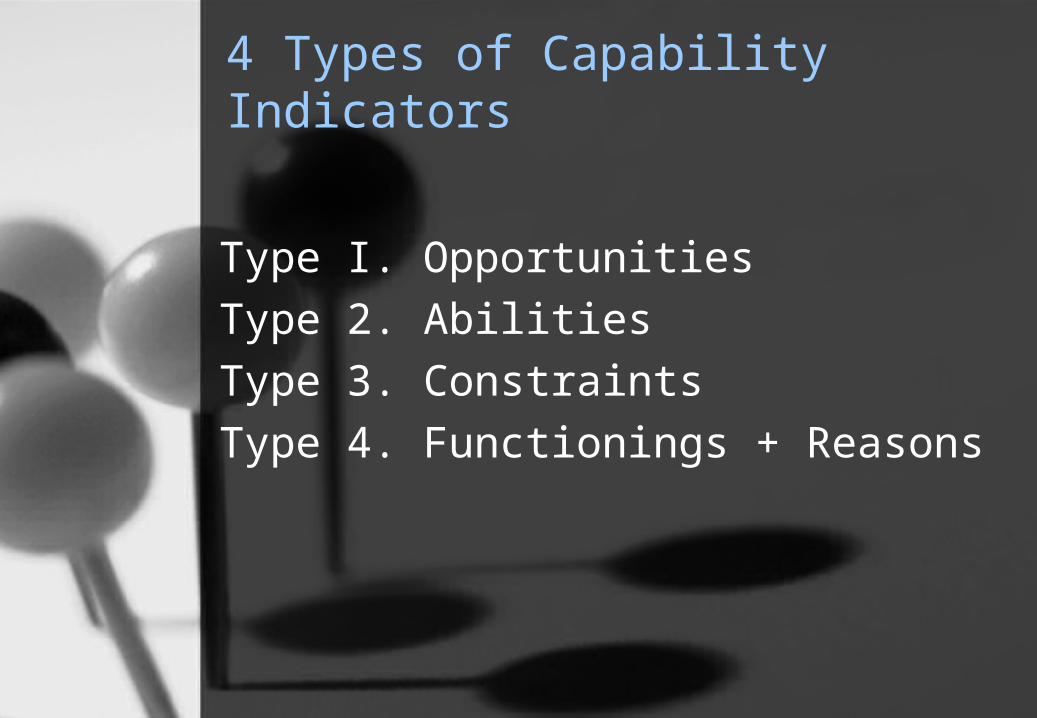
4 Types of Capability Indicators
Type I. Opportunities
Type 2. Abilities
Type 3. Constraints
Type 4. Functionings + Reasons
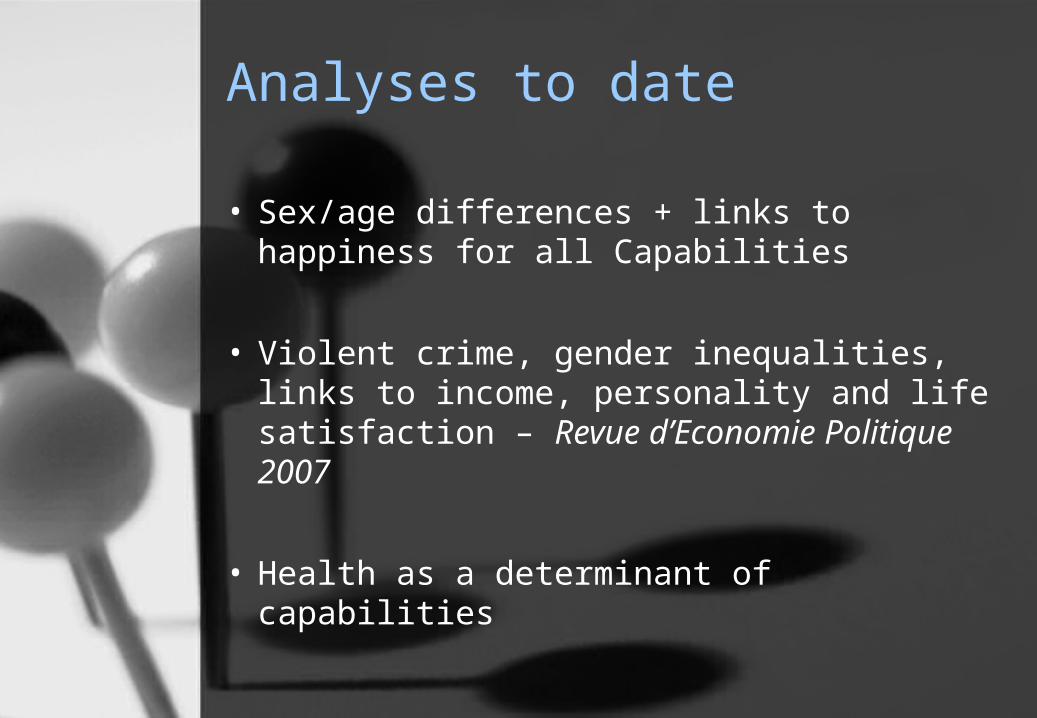
Analyses to date
• Sex/age differences + links to happiness for all Capabilities
• Violent crime, gender inequalities, links to income, personality and life satisfaction – Revue d’Economie Politique 2007
• Health as a determinant of capabilities
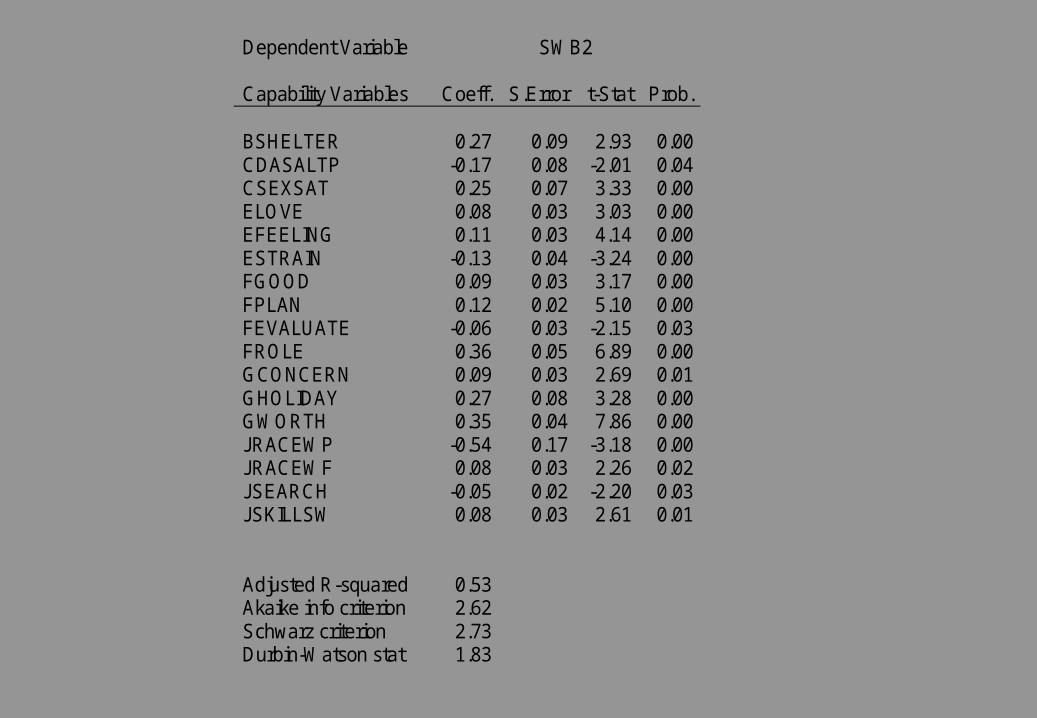
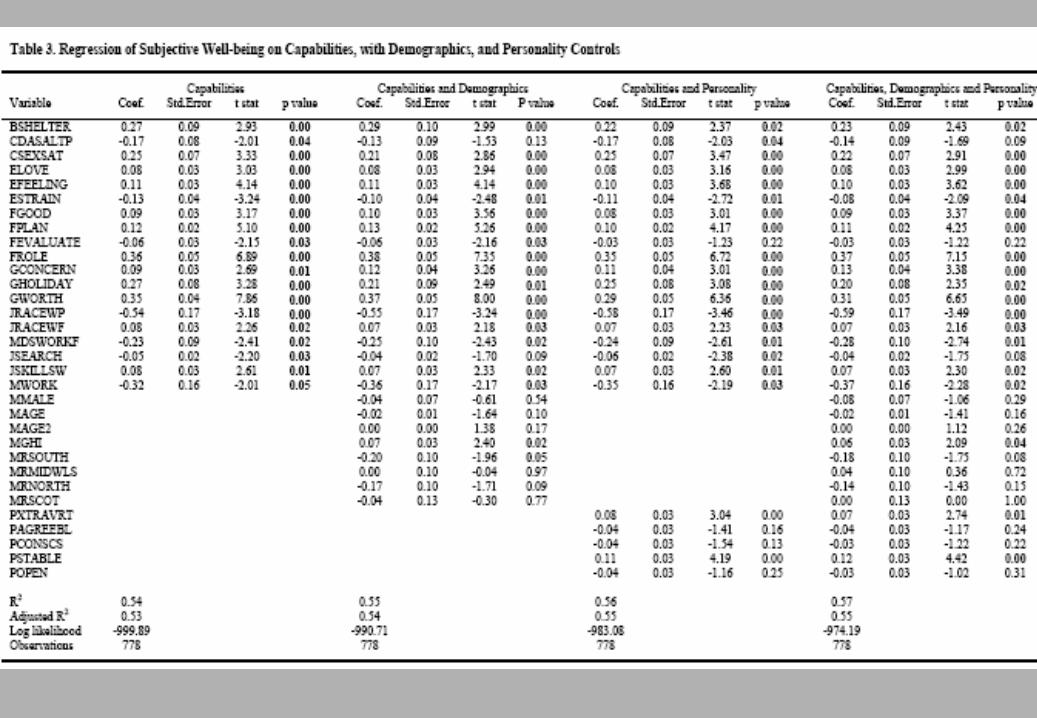
Dependent Variable SWB2 Capability Variables Coeff. S.Error t-Stat Prob. BSHELTER 0.27 0.09 2.93 0.00 CDASALTP -0.17 0.08 -2.01 0.04 CSEXSAT 0.25 0.07 3.33 0.00 ELOVE 0.08 0.03 3.03 0.00 EFEELING 0.11 0.03 4.14 0.00 ESTRAIN -0.13 0.04 -3.24 0.00 FGOOD 0.09 0.03 3.17 0.00 FPLAN 0.12 0.02 5.10 0.00 FEVALUATE -0.06 0.03 -2.15 0.03 FROLE 0.36 0.05 6.89 0.00 GCONCERN 0.09 0.03 2.69 0.01 GHOLIDAY 0.27 0.08 3.28 0.00 GWORTH 0.35 0.04 7.86 0.00 JRACEWP -0.54 0.17 -3.18 0.00 JRACEWF 0.08 0.03 2.26 0.02 JSEARCH -0.05 0.02 -2.20 0.03 JSKILLSW 0.08 0.03 2.61 0.01 Adjusted R-squared 0.53 Akaike info criterion 2.62 Schwarz criterion 2.73 Durbin-Watson stat 1.83
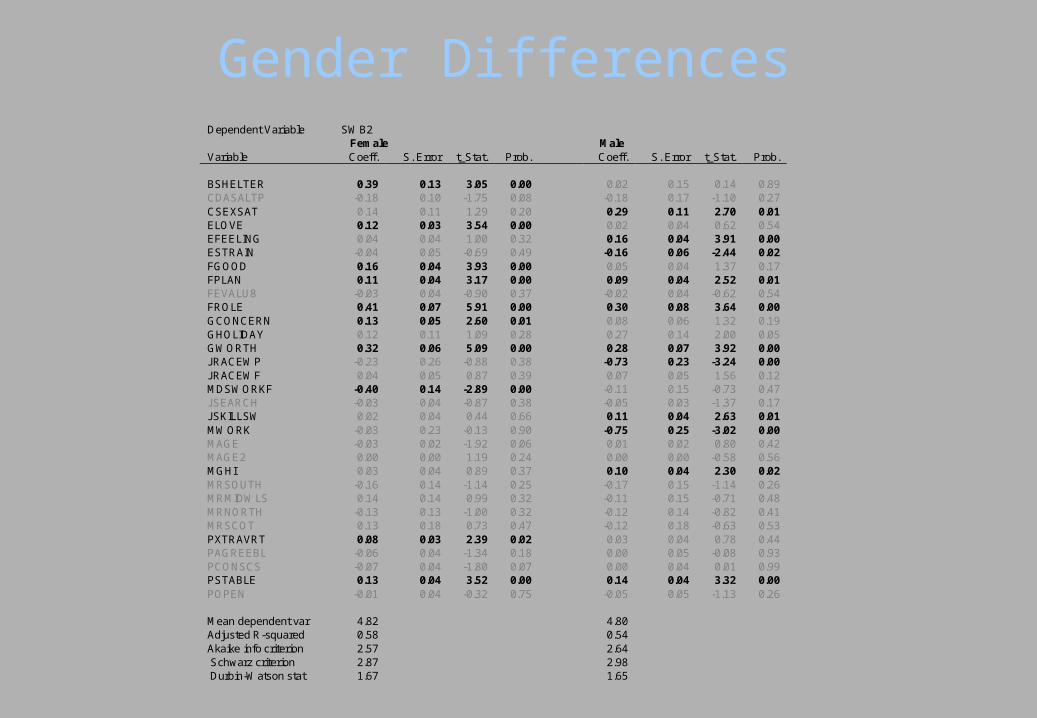
Gender DifferencesDependent Variable SWB2 Female Male Variable Coeff. S. Error t_Stat. Prob. Coeff. S. Error t_Stat. Prob. BSHELTER 0.39 0.13 3.05 0.00 0.02 0.15 0.14 0.89 CDASALTP -0.18 0.10 -1.75 0.08 -0.18 0.17 -1.10 0.27 CSEXSAT 0.14 0.11 1.29 0.20 0.29 0.11 2.70 0.01 ELOVE 0.12 0.03 3.54 0.00 0.02 0.04 0.62 0.54 EFEELING 0.04 0.04 1.00 0.32 0.16 0.04 3.91 0.00 ESTRAIN -0.04 0.05 -0.69 0.49 -0.16 0.06 -2.44 0.02 FGOOD 0.16 0.04 3.93 0.00 0.05 0.04 1.37 0.17 FPLAN 0.11 0.04 3.17 0.00 0.09 0.04 2.52 0.01 FEVALU8 -0.03 0.04 -0.90 0.37 -0.02 0.04 -0.62 0.54 FROLE 0.41 0.07 5.91 0.00 0.30 0.08 3.64 0.00 GCONCERN 0.13 0.05 2.60 0.01 0.08 0.06 1.32 0.19 GHOLIDAY 0.12 0.11 1.09 0.28 0.27 0.14 2.00 0.05 GWORTH 0.32 0.06 5.09 0.00 0.28 0.07 3.92 0.00 JRACEWP -0.23 0.26 -0.88 0.38 -0.73 0.23 -3.24 0.00 JRACEWF 0.04 0.05 0.87 0.39 0.07 0.05 1.56 0.12 MDSWORKF -0.40 0.14 -2.89 0.00 -0.11 0.15 -0.73 0.47 JSEARCH -0.03 0.04 -0.87 0.38 -0.05 0.03 -1.37 0.17 JSKILLSW 0.02 0.04 0.44 0.66 0.11 0.04 2.63 0.01 MWORK -0.03 0.23 -0.13 0.90 -0.75 0.25 -3.02 0.00 MAGE -0.03 0.02 -1.92 0.06 0.01 0.02 0.80 0.42 MAGE2 0.00 0.00 1.19 0.24 0.00 0.00 -0.58 0.56 MGHI 0.03 0.04 0.89 0.37 0.10 0.04 2.30 0.02 MRSOUTH -0.16 0.14 -1.14 0.25 -0.17 0.15 -1.14 0.26 MRMIDWLS 0.14 0.14 0.99 0.32 -0.11 0.15 -0.71 0.48 MRNORTH -0.13 0.13 -1.00 0.32 -0.12 0.14 -0.82 0.41 MRSCOT 0.13 0.18 0.73 0.47 -0.12 0.18 -0.63 0.53 PXTRAVRT 0.08 0.03 2.39 0.02 0.03 0.04 0.78 0.44 PAGREEBL -0.06 0.04 -1.34 0.18 0.00 0.05 -0.08 0.93 PCONSCS -0.07 0.04 -1.80 0.07 0.00 0.04 0.01 0.99 PSTABLE 0.13 0.04 3.52 0.00 0.14 0.04 3.32 0.00 POPEN -0.01 0.04 -0.32 0.75 -0.05 0.05 -1.13 0.26 Mean dependent var 4.82 4.80 Adjusted R-squared 0.58 0.54 Akaike info criterion 2.57 2.64 Schwarz criterion 2.87 2.98 Durbin-Watson stat 1.67 1.65
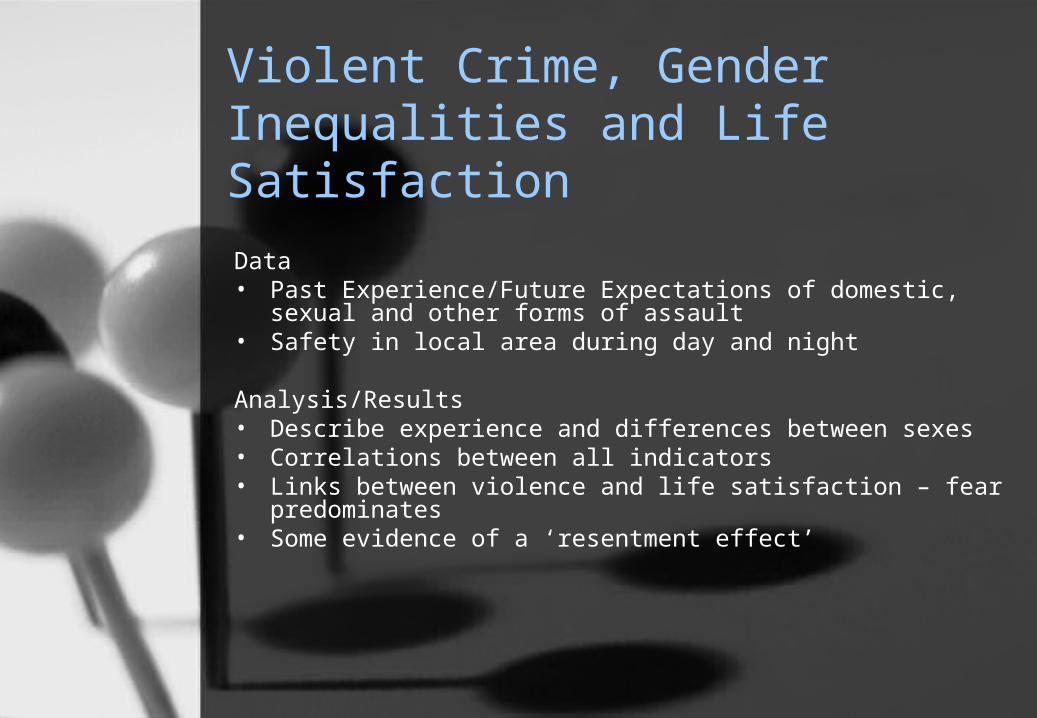
Violent Crime, Gender Inequalities and Life Satisfaction
Data• Past Experience/Future Expectations of domestic, sexual and other
forms of assault• Safety in local area during day and night
Analysis/Results• Describe experience and differences between sexes• Correlations between all indicators• Links between violence and life satisfaction – fear predominates• Some evidence of a ‘resentment effect’
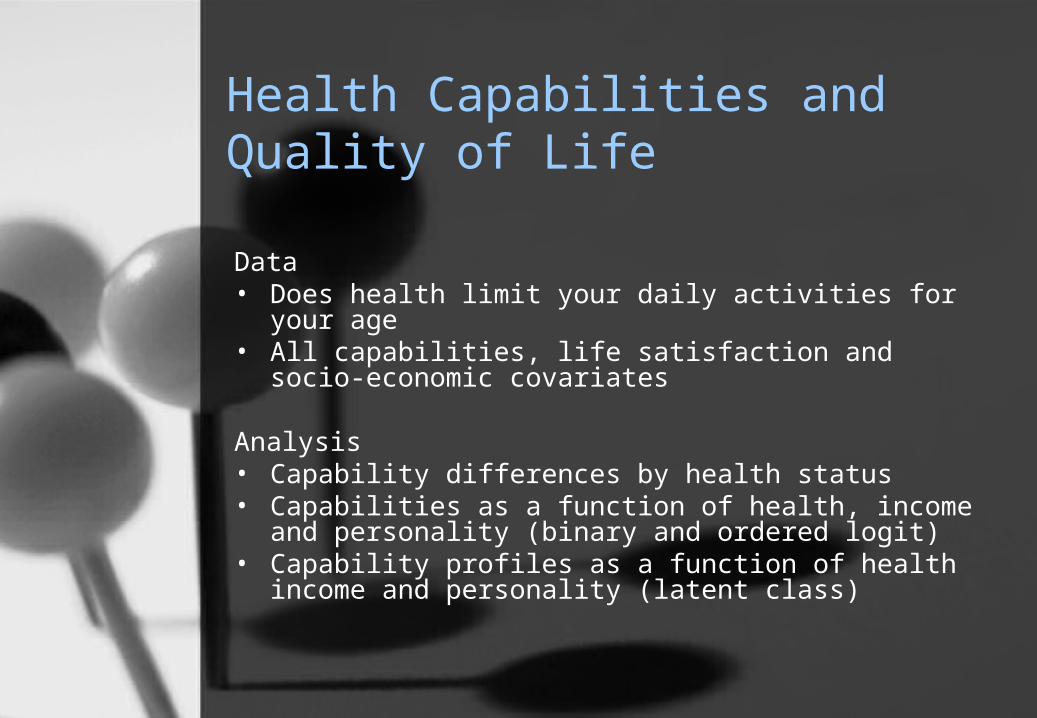
Health Capabilities and Quality of Life
Data• Does health limit your daily activities for your age• All capabilities, life satisfaction and socio-economic
covariates
Analysis• Capability differences by health status• Capabilities as a function of health, income and personality
(binary and ordered logit)• Capability profiles as a function of health income and
personality (latent class)
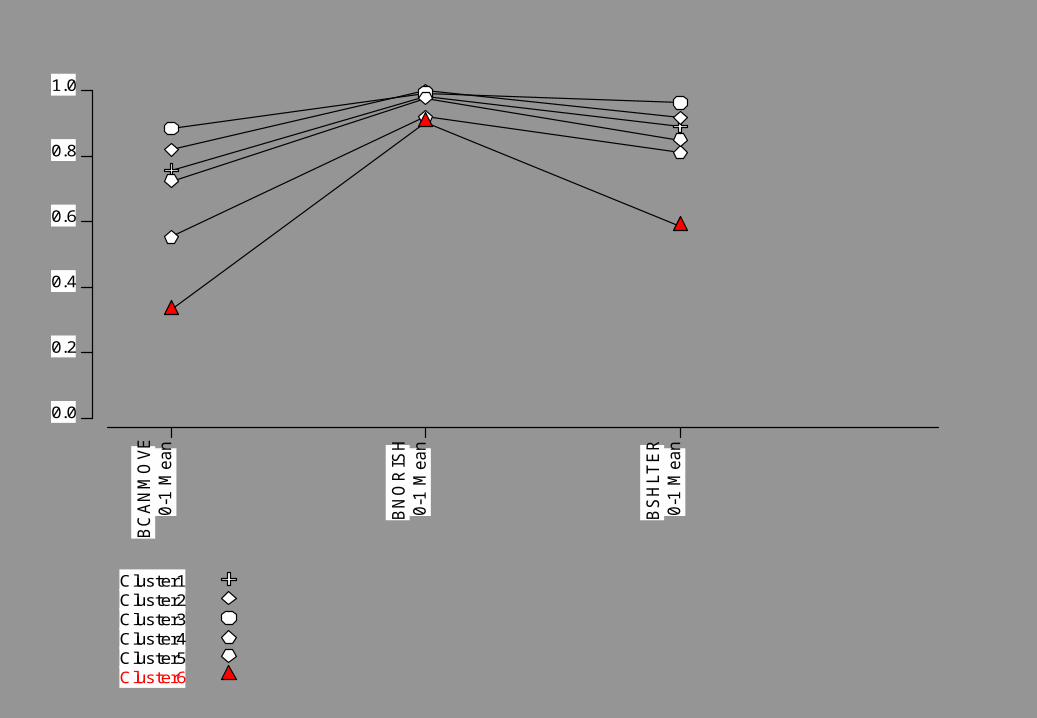
BC
AN
MO
VE
0-1
Mean
BN
OR
ISH
0-1
Mean
BS
HLT
ER
0-1
Mean
1.0
0.8
0.6
0.4
0.2
0.0
Cluster1Cluster2Cluster3Cluster4Cluster5Cluster6
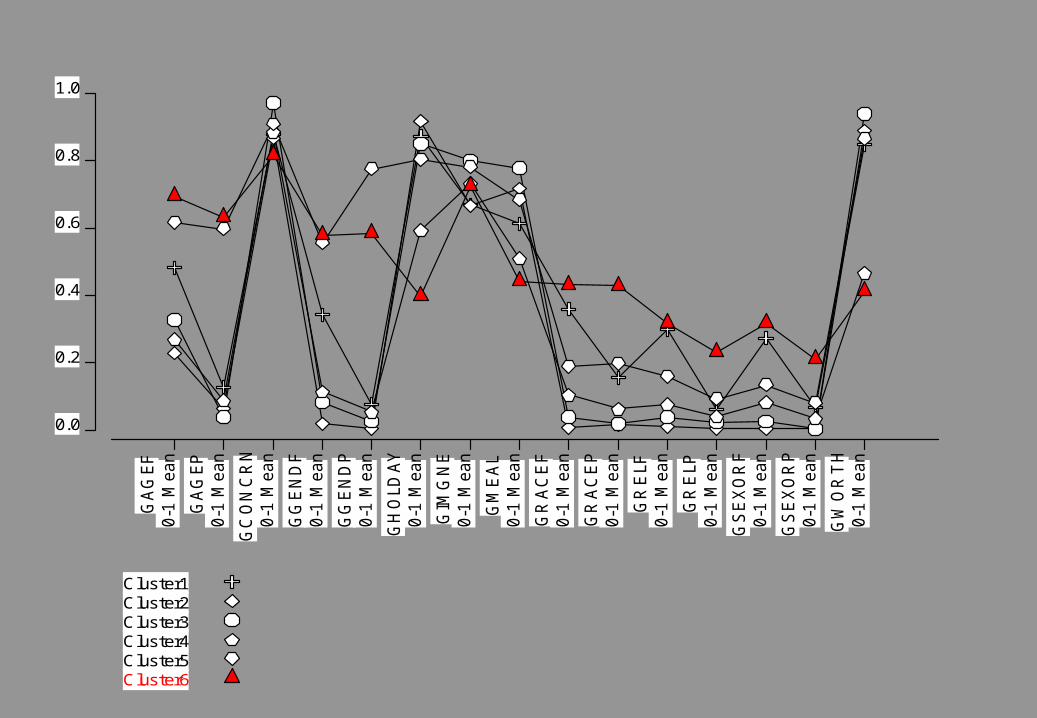
GA
GE
F0-1
Mean
GA
GE
P0-1
Mean
GC
ON
CR
N0-1
Mean
GG
EN
DF
0-1
Mean
GG
EN
DP
0-1
Mean
GH
OLD
AY
0-1
Mean
GIM
GN
E0-1
Mean
GM
EA
L0-1
Mean
GR
AC
EF
0-1
Mean
GR
AC
EP
0-1
Mean
GR
ELF
0-1
Mean
GR
ELP
0-1
Mean
GS
EX
OR
F0-1
Mean
GS
EX
OR
P0-1
Mean
GW
OR
TH
0-1
Mean
1.0
0.8
0.6
0.4
0.2
0.0
Cluster1Cluster2Cluster3Cluster4Cluster5Cluster6
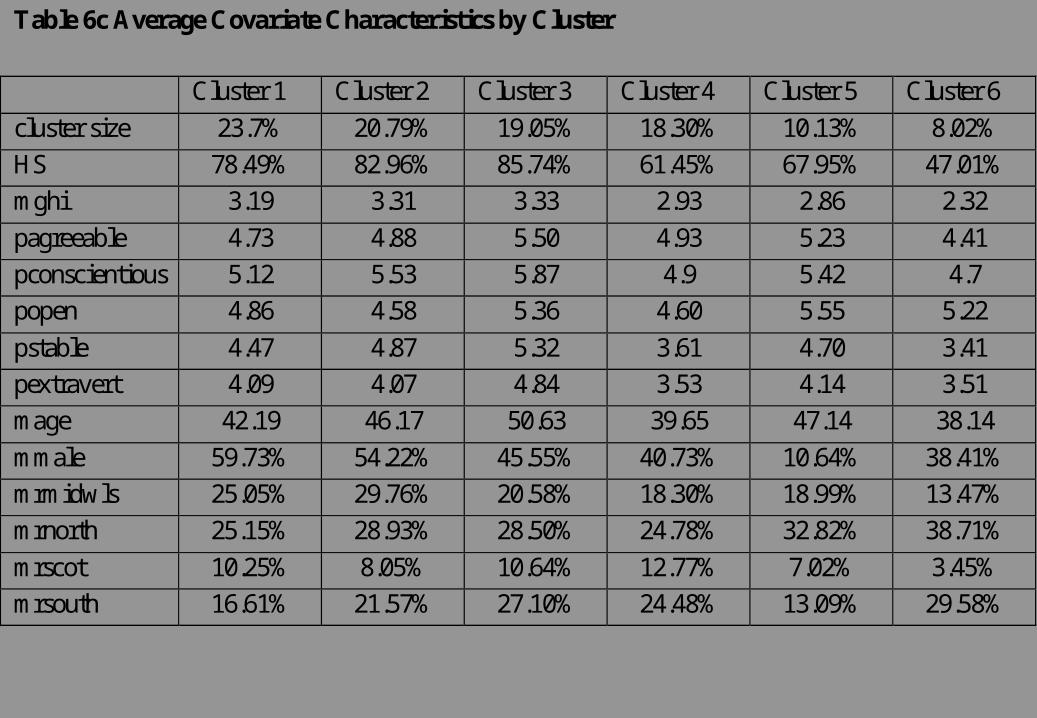
Table 6c Average Covariate Characteristics by Cluster
Cluster 1 Cluster 2 Cluster 3 Cluster 4 Cluster 5 Cluster 6
cluster size 23.7% 20.79% 19.05% 18.30% 10.13% 8.02%
HS 78.49% 82.96% 85.74% 61.45% 67.95% 47.01%
mghi 3.19 3.31 3.33 2.93 2.86 2.32
pagreeable 4.73 4.88 5.50 4.93 5.23 4.41
pconscientious 5.12 5.53 5.87 4.9 5.42 4.7
popen 4.86 4.58 5.36 4.60 5.55 5.22
pstable 4.47 4.87 5.32 3.61 4.70 3.41
pextravert 4.09 4.07 4.84 3.53 4.14 3.51
mage 42.19 46.17 50.63 39.65 47.14 38.14
mmale 59.73% 54.22% 45.55% 40.73% 10.64% 38.41%
mrmidwls 25.05% 29.76% 20.58% 18.30% 18.99% 13.47%
mrnorth 25.15% 28.93% 28.50% 24.78% 32.82% 38.71%
mrscot 10.25% 8.05% 10.64% 12.77% 7.02% 3.45%
mrsouth 16.61% 21.57% 27.10% 24.48% 13.09% 29.58%
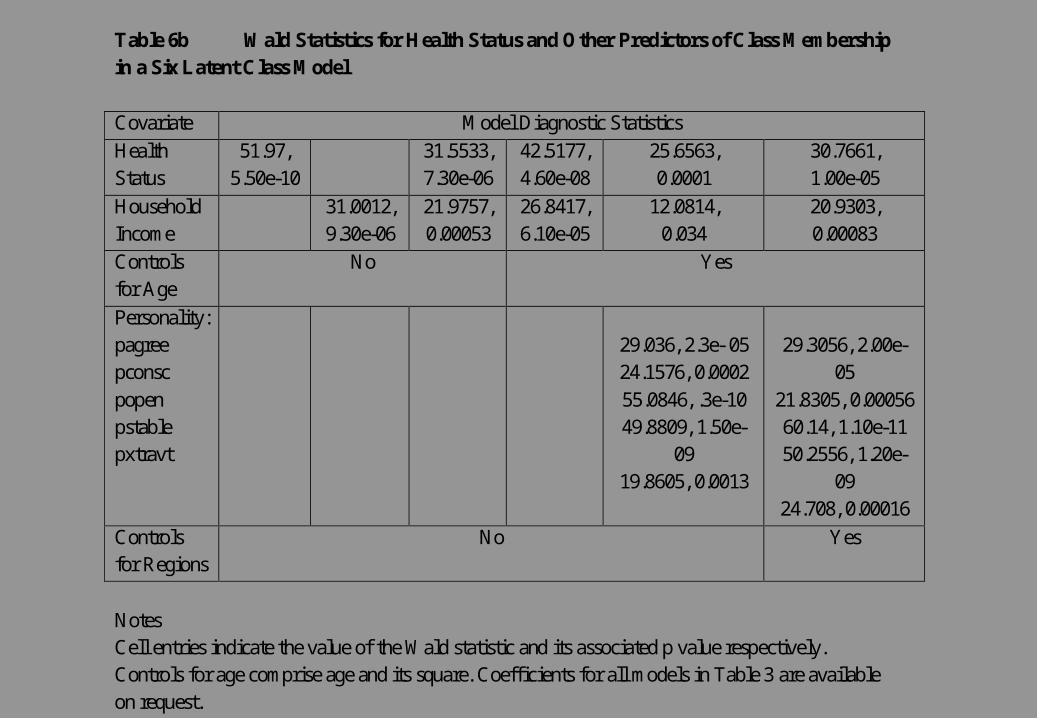
Table 6b Wald Statistics for Health Status and Other Predictors of Class Membership in a Six Latent Class Model
Covariate Model Diagnostic Statistics
Health Status
51.97, 5.50e-10
31.5533, 7.30e-06
42.5177, 4.60e-08
25.6563, 0.0001
30.7661, 1.00e-05
Household Income
31.0012, 9.30e-06
21.9757, 0.00053
26.8417, 6.10e-05
12.0814, 0.034
20.9303, 0.00083
Controls for Age
No Yes
Personality: pagree pconsc
popen pstable pxtravt
29.036, 2.3e- 05 24.1576, 0.0002
55.0846, .3e-10 49.8809, 1.50e-
09 19.8605, 0.0013
29.3056, 2.00e-
05
21.8305, 0.00056 60.14, 1.10e-11 50.2556, 1.20e-
09 24.708, 0.00016
Controls for Regions
No Yes
Notes Cell entries indicate the value of the Wald statistic and its associated p value respectively. Controls for age comprise age and its square. Coefficients for all models in Table 3 are available on request.
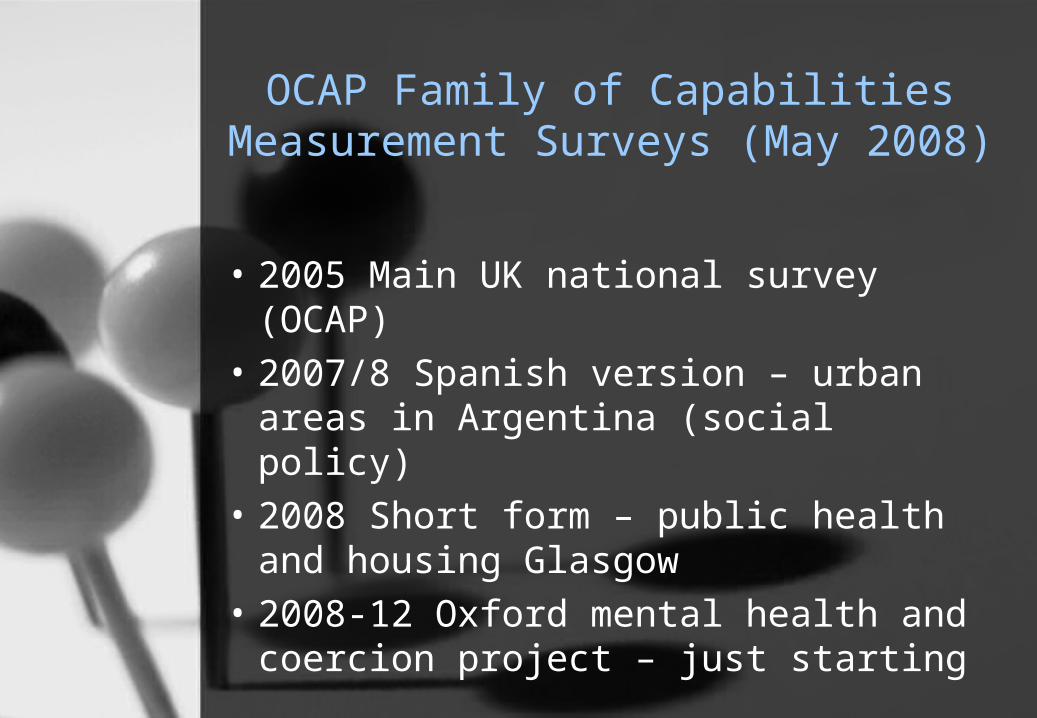
OCAP Family of Capabilities Measurement Surveys (May 2008)
• 2005 Main UK national survey (OCAP)
• 2007/8 Spanish version – urban areas in Argentina (social policy)
• 2008 Short form – public health and housing Glasgow
• 2008-12 Oxford mental health and coercion project – just starting
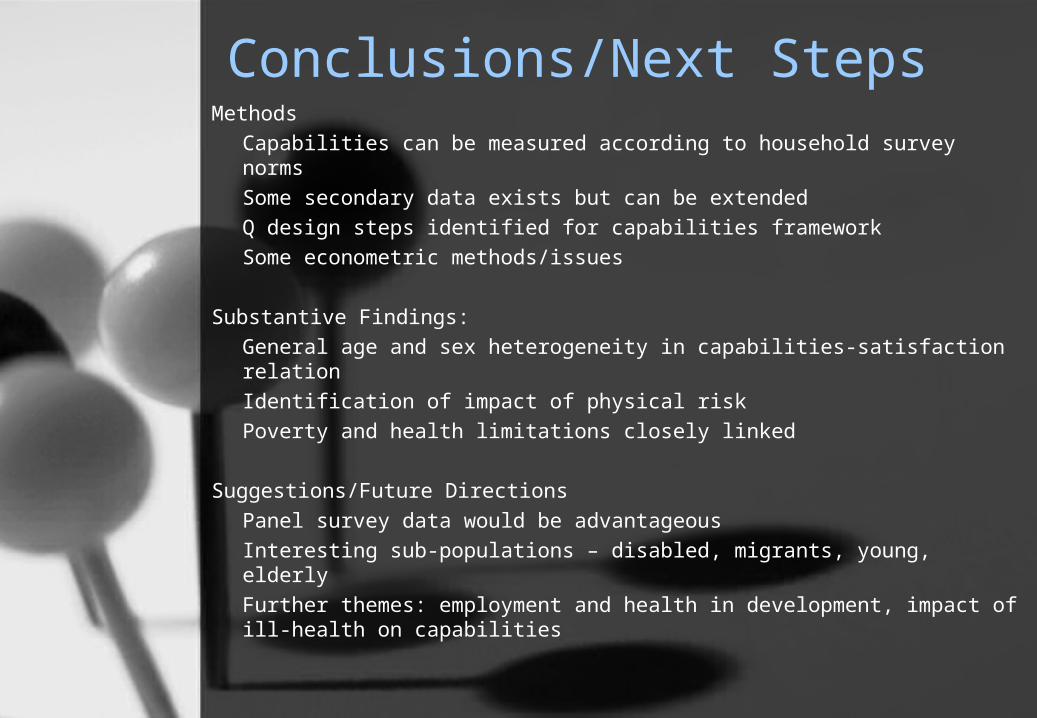
Conclusions/Next StepsMethods
Capabilities can be measured according to household survey norms
Some secondary data exists but can be extended
Q design steps identified for capabilities framework
Some econometric methods/issues
Substantive Findings:
General age and sex heterogeneity in capabilities-satisfaction relation
Identification of impact of physical risk
Poverty and health limitations closely linked
Suggestions/Future Directions
Panel survey data would be advantageous
Interesting sub-populations – disabled, migrants, young, elderly
Further themes: employment and health in development, impact of ill-health on capabilities