Embed Size (px)
Citation preview
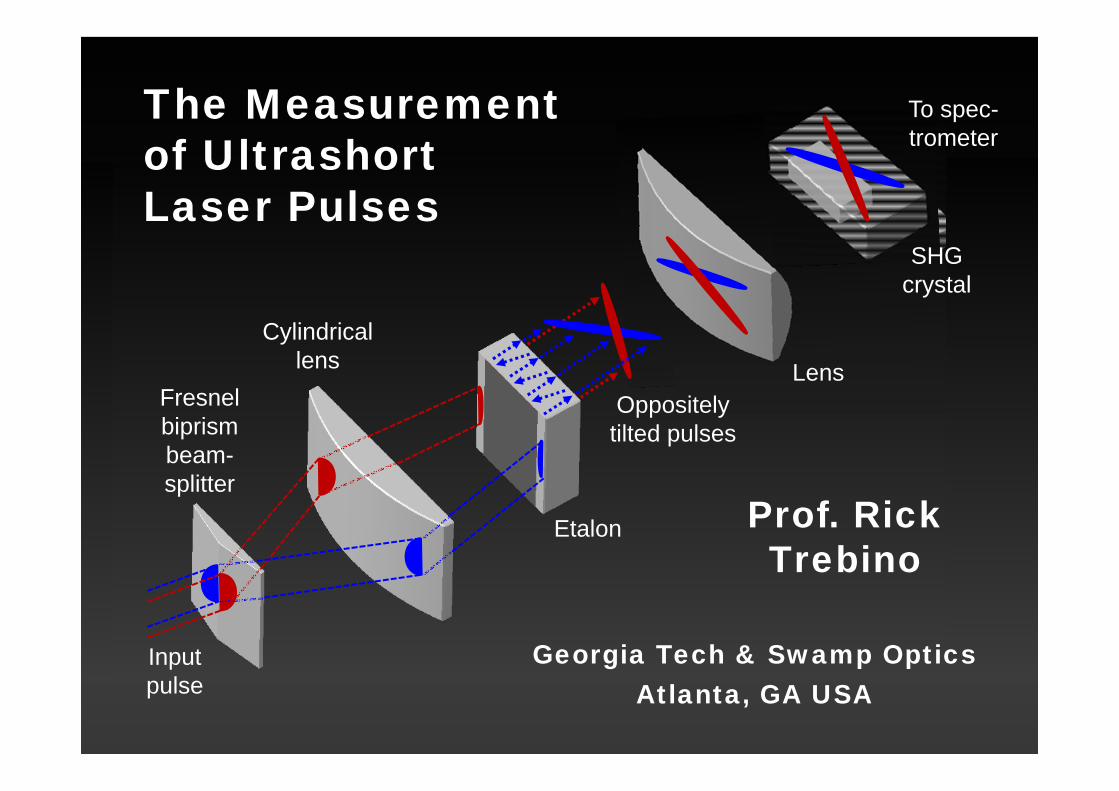
Fresnel biprism beam-splitter
Cylindrical lens
Oppositely tilted pulses
Input pulse
Etalon
To spec-trometer
SHG crystal
Lens
Georgia Tech & Swamp Optics Atlanta, GA USA
Prof. Rick Trebino
The Measurement of Ultrashort Laser Pulses
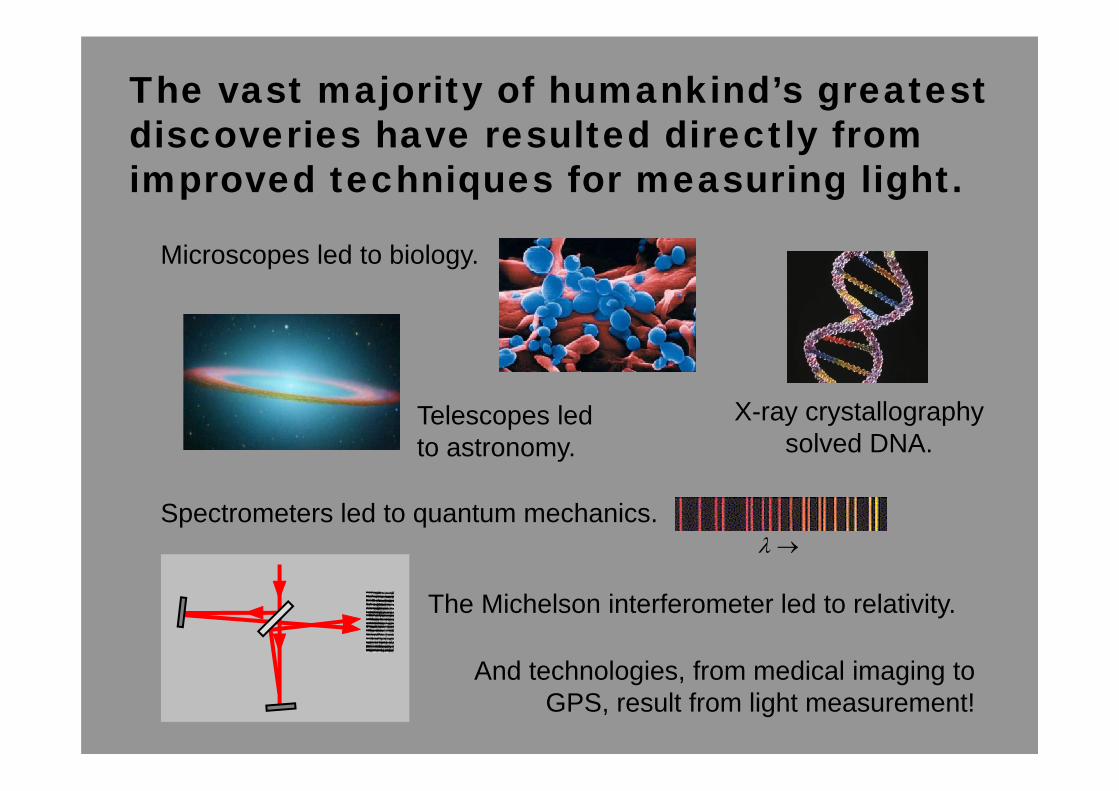
The vast majority of humankind’s greatest discoveries have resulted directly from improved techniques for measuring light.
Spectrometers led to quantum mechanics.
The Michelson interferometer led to relativity.
Microscopes led to biology.
Telescopes led to astronomy.
X-ray crystallography solved DNA.
And technologies, from medical imaging to GPS, result from light measurement!
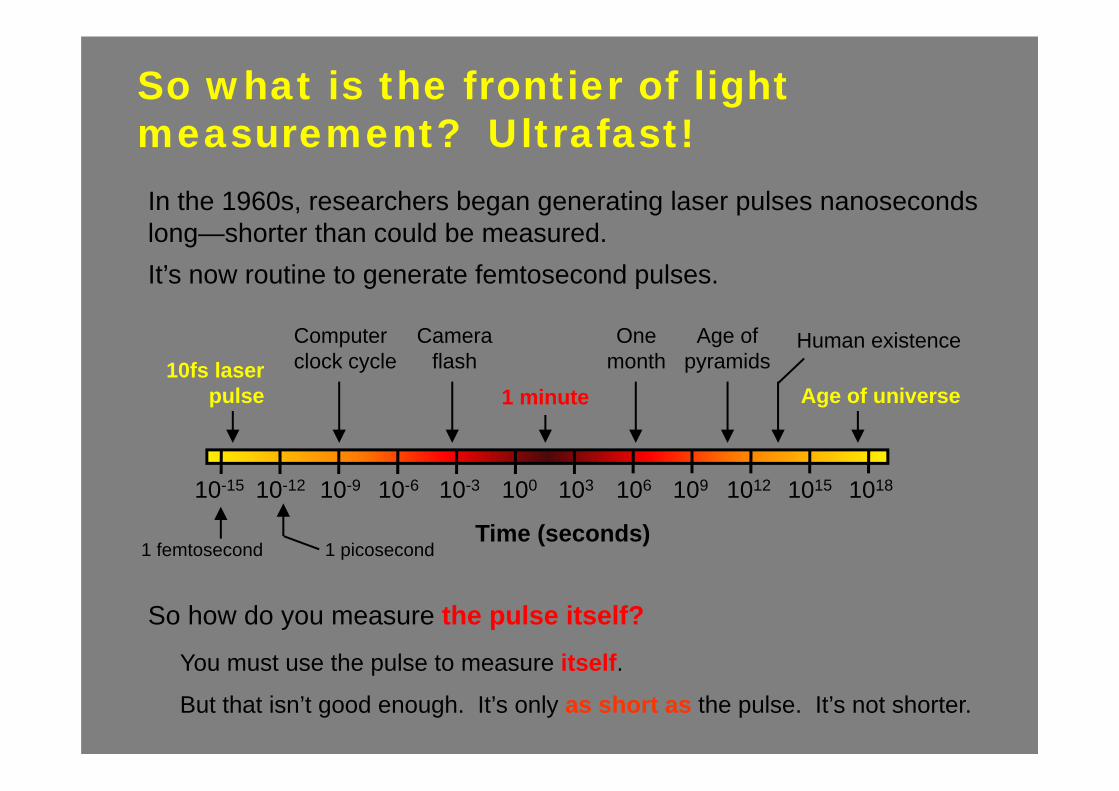
So what is the frontier of light measurement? Ultrafast!
So how do you measure the pulse itself?
1 minute10fs laser
pulse Age of universe
Time (seconds)
Computer clock cycle
Camera flash
Age of pyramids
One month
Human existence
10-15 10-12 10-9 10-6 10-3 100 103 106 109 1012 1015 1018
1 femtosecond 1 picosecond
In the 1960s, researchers began generating laser pulses nanoseconds long—shorter than could be measured. It’s now routine to generate femtosecond pulses.
You must use the pulse to measure itself.
But that isn’t good enough. It’s only as short as the pulse. It’s not shorter.
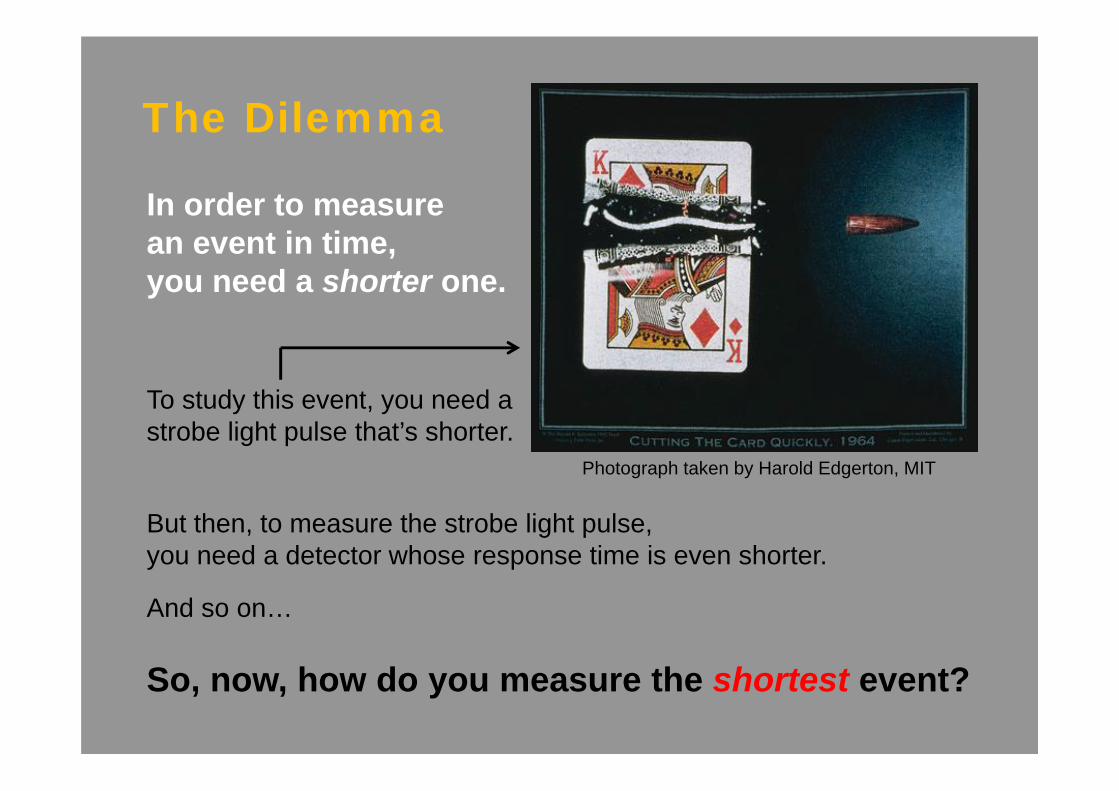
In order to measure an event in time,you need a shorter one.
To study this event, you need a strobe light pulse that’s shorter.
But then, to measure the strobe light pulse, you need a detector whose response time is even shorter.
So, now, how do you measure the shortest event?
Photograph taken by Harold Edgerton, MIT
The Dilemma
And so on…
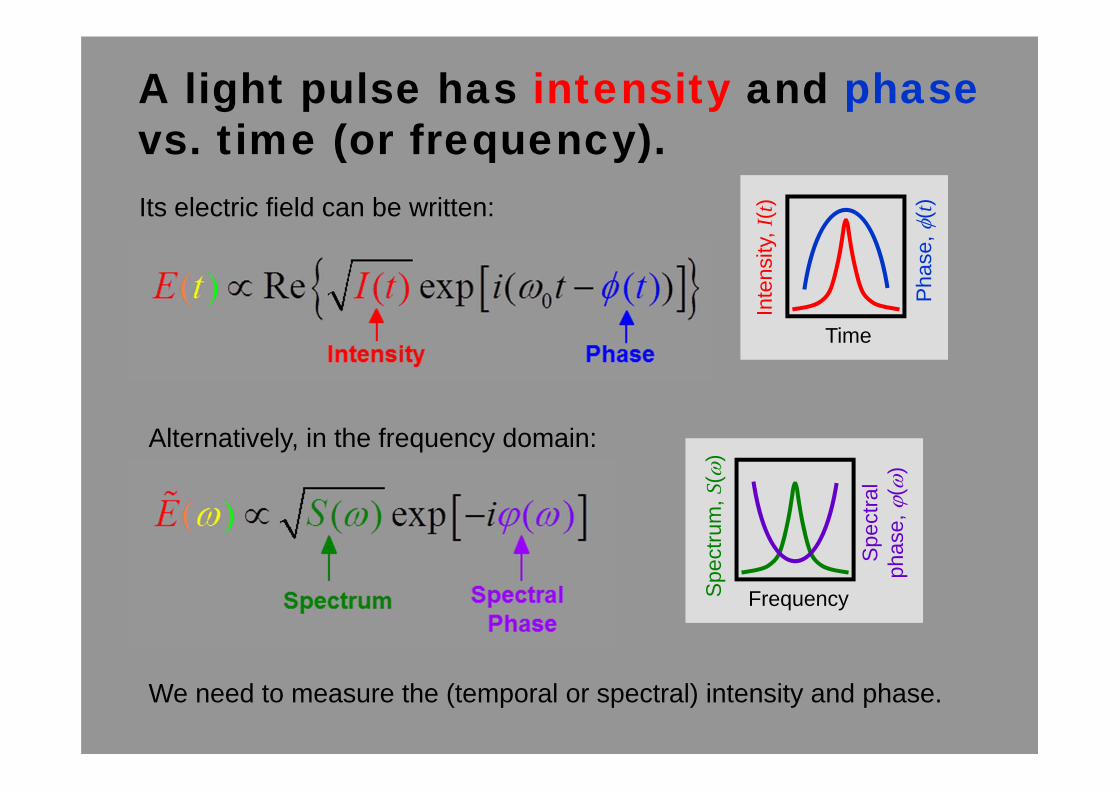
Its electric field can be written:
Alternatively, in the frequency domain:
We need to measure the (temporal or spectral) intensity and phase.
A light pulse has intensity and phasevs. time (or frequency).
Spe
ctra
l ph
ase,
(
)
FrequencySpe
ctru
m, S
()
Pha
se,
(t)
Time
Inte
nsity
, I(t)
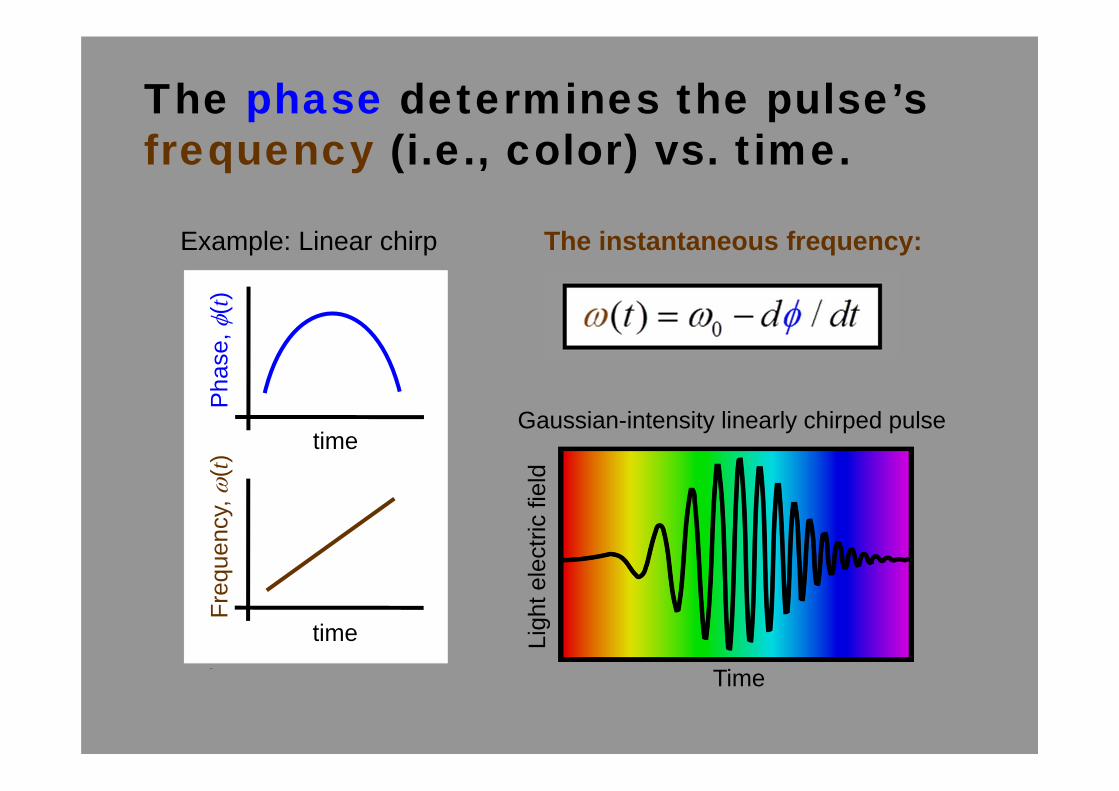
The instantaneous frequency:Example: Linear chirp P
hase
, (t)
time
time
Freq
uenc
y,
(t)
time
The phase determines the pulse’s frequency (i.e., color) vs. time.
Time
Ligh
t ele
ctric
fiel
d
Gaussian-intensity linearly chirped pulse
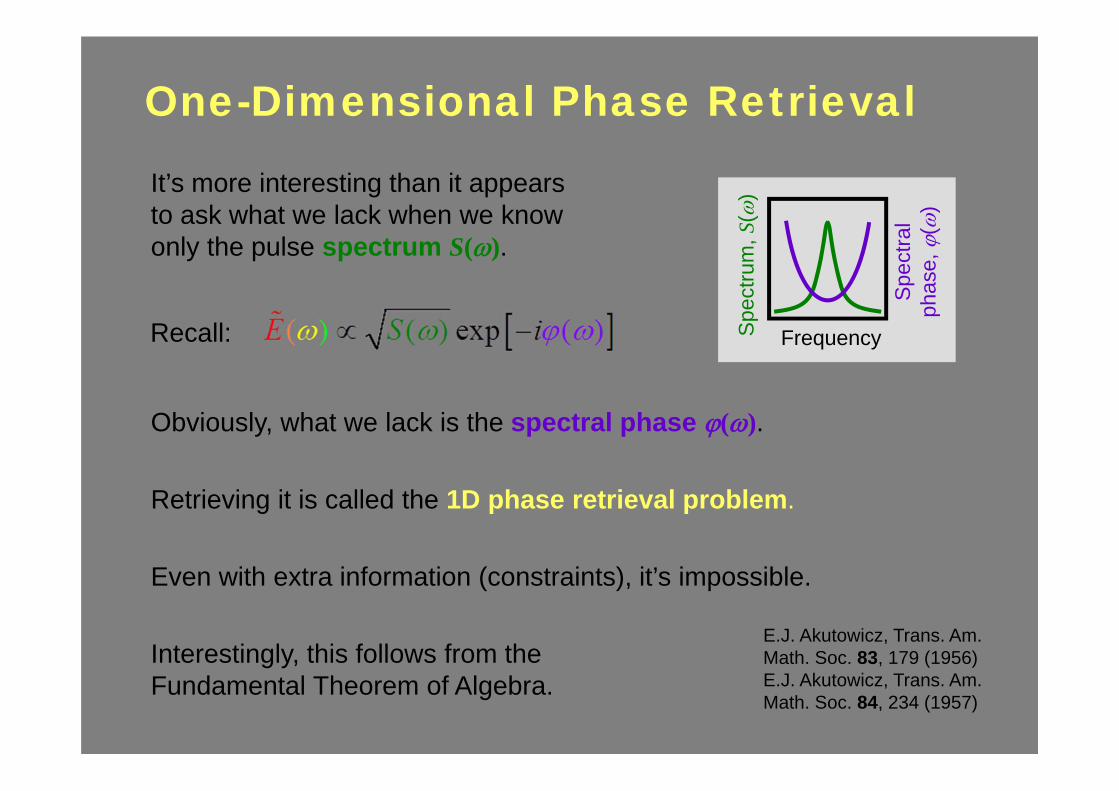
One-Dimensional Phase Retrieval
E.J. Akutowicz, Trans. Am. Math. Soc. 83, 179 (1956)E.J. Akutowicz, Trans. Am. Math. Soc. 84, 234 (1957)
Retrieving it is called the 1D phase retrieval problem.
It’s more interesting than it appears to ask what we lack when we know only the pulse spectrum S().
Obviously, what we lack is the spectral phase ().
Even with extra information (constraints), it’s impossible.
Recall:
Spe
ctra
l ph
ase,
(
)
FrequencySpe
ctru
m, S
()
Interestingly, this follows from the Fundamental Theorem of Algebra.
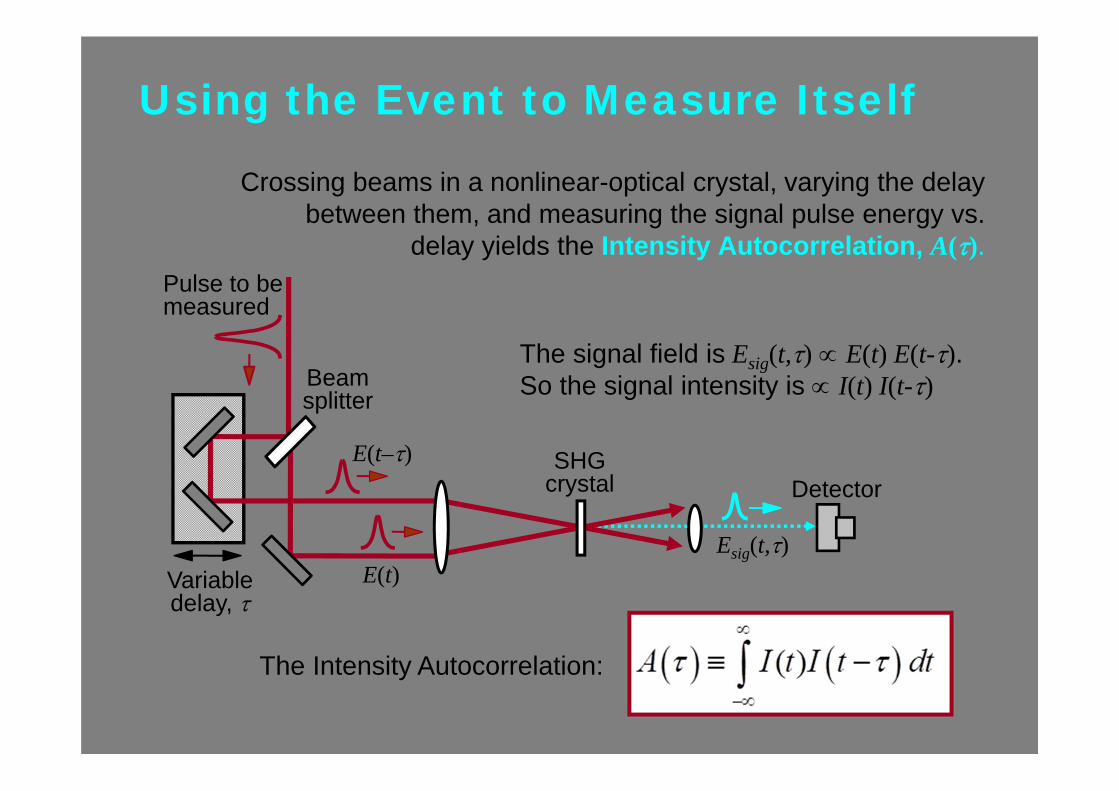
Using the Event to Measure Itself
SHG crystal
The Intensity Autocorrelation: ( )A I t I t dt
SHGcrystal
Pulse to be measured
Variable delay,
Detector
Beamsplitter
E(t)
E(t–)
Esig(t,)
The signal field is Esig(t,) E(t) E(t-).So the signal intensity is I(t) I(t-)
Crossing beams in a nonlinear-optical crystal, varying the delay between them, and measuring the signal pulse energy vs.
delay yields the Intensity Autocorrelation, A().
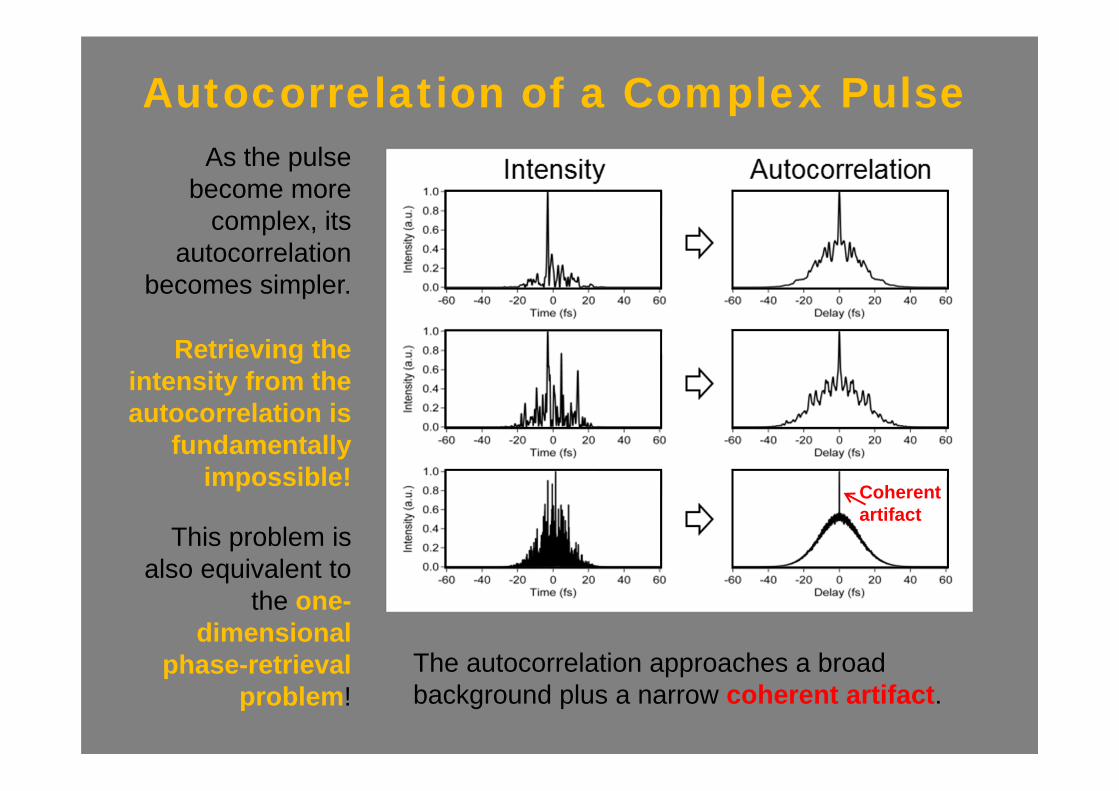
Autocorrelation of a Complex PulseAs the pulse
become more complex, its
autocorrelation becomes simpler.
Retrieving the intensity from the autocorrelation is
fundamentally impossible!
This problem is also equivalent to
the one-dimensional
phase-retrieval problem!
Coherent artifact
The autocorrelation approaches a broad background plus a narrow coherent artifact.
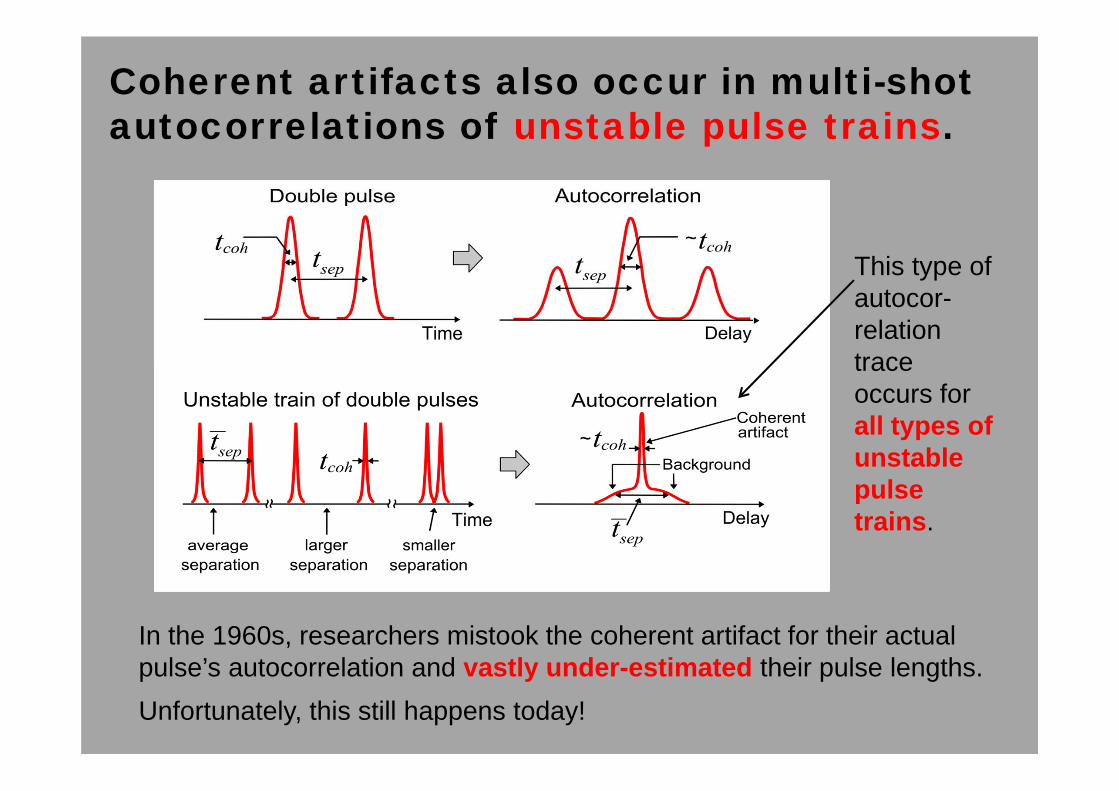
Coherent artifacts also occur in multi-shot autocorrelations of unstable pulse trains.
This type of autocor-relation trace occurs for all types of unstable pulse trains.
In the 1960s, researchers mistook the coherent artifact for their actual pulse’s autocorrelation and vastly under-estimated their pulse lengths.Unfortunately, this still happens today!
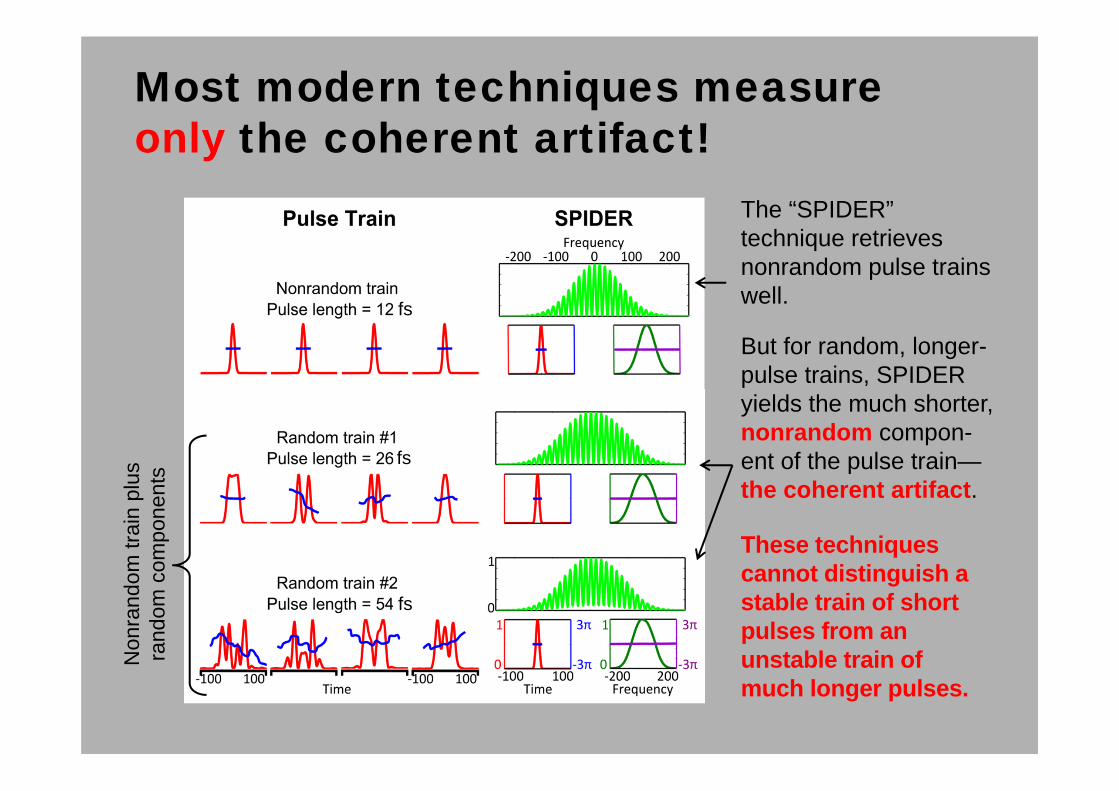
Most modern techniques measure only the coherent artifact!
The “SPIDER” technique retrieves nonrandom pulse trains well.
But for random, longer-pulse trains, SPIDER yields the much shorter, nonrandom compon-ent of the pulse train—the coherent artifact.
These techniques cannot distinguish a stable train of short pulses from an unstable train of much longer pulses.
Non
rand
om tr
ain
plus
ra
ndom
com
pone
nts
fs
fs
fs
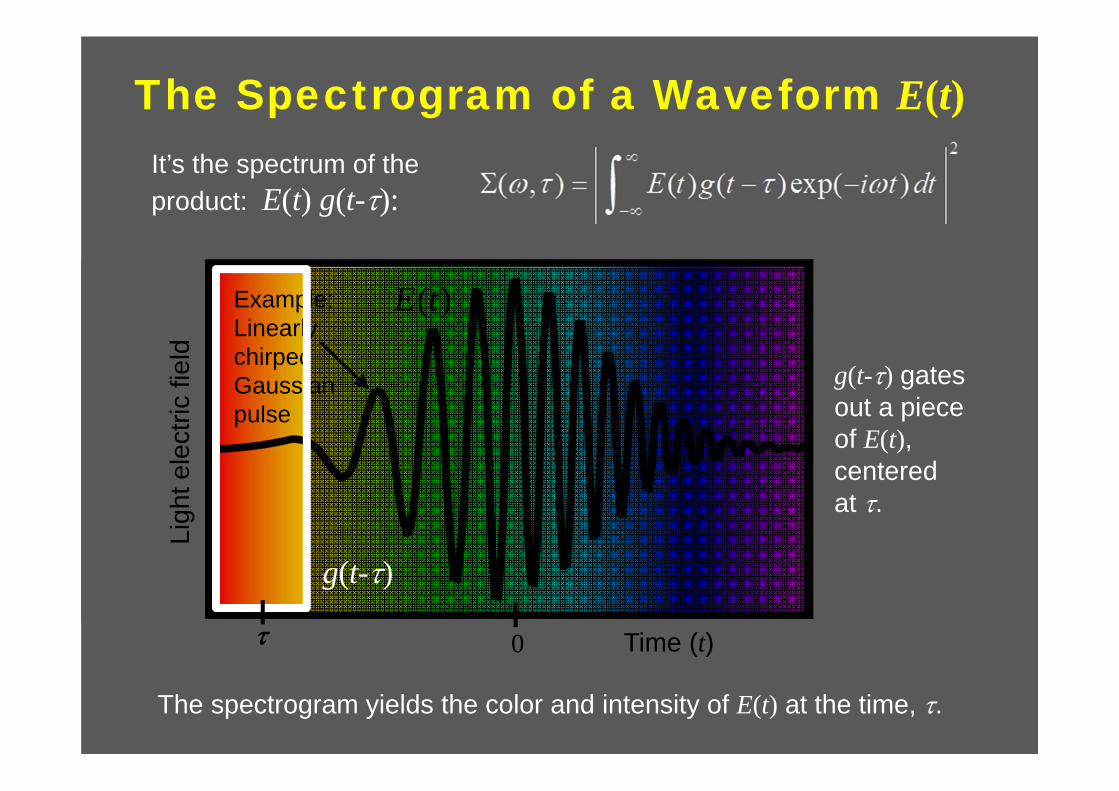
The Spectrogram of a Waveform E(t)
The spectrogram yields the color and intensity of E(t) at the time, .
It’s the spectrum of the product: E(t) g(t-):
Example: Linearly chirped Gaussian pulse
( )E t
Time (t)0
2
( , ) ( ) ( ) exp( )E t g t i t dt
g(t-)
g(t-) gates out a piece of E(t), centered at .
Ligh
t ele
ctric
fiel
d
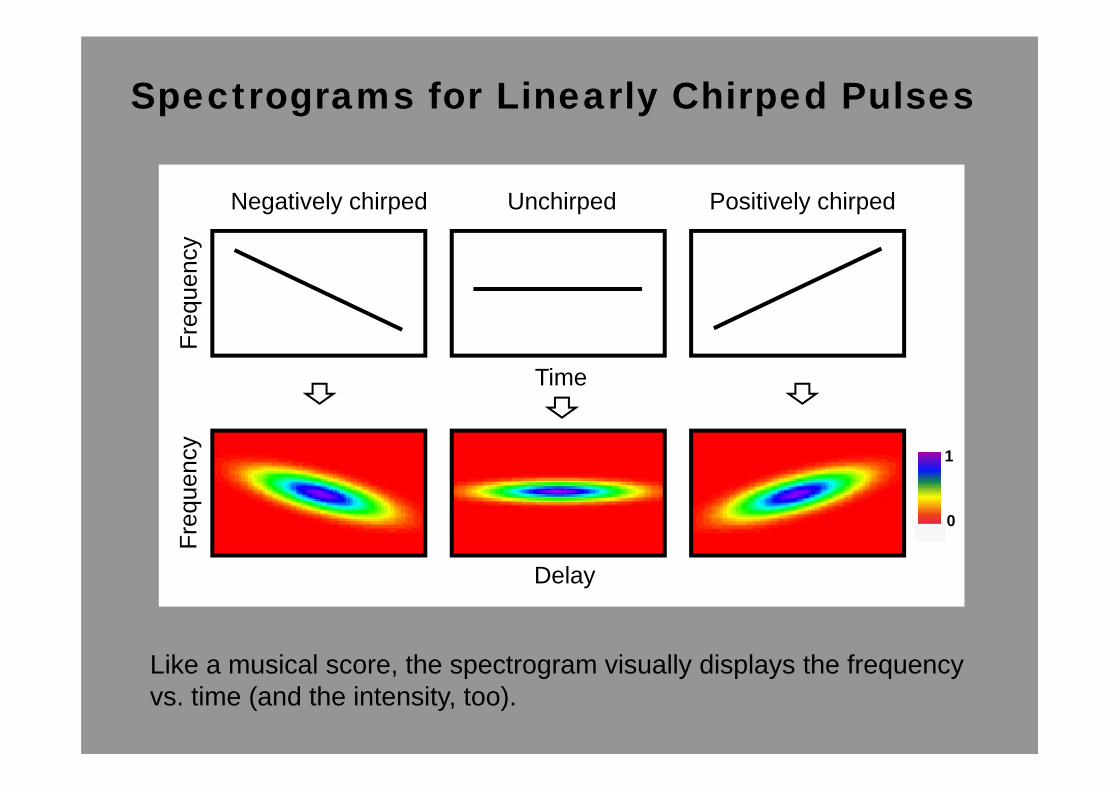
Spectrograms for Linearly Chirped Pulses
Like a musical score, the spectrogram visually displays the frequency vs. time (and the intensity, too).
Freq
uenc
yFr
eque
ncy
Time
Delay
Negatively chirped Unchirped Positively chirped
1
0
Autocorrelator
Nonlinear-optical medium
Unknown pulse
Variable delay
CameraSpec-
trometer
Beamsplitter
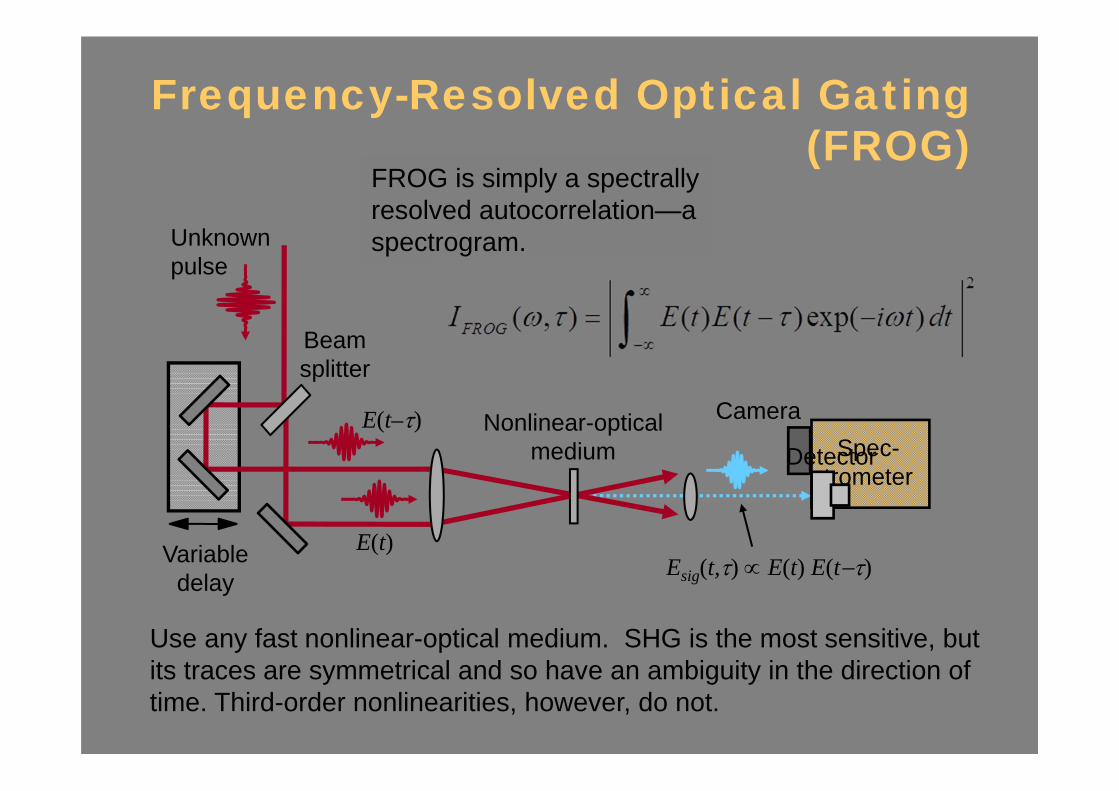
Use any fast nonlinear-optical medium. SHG is the most sensitive, but its traces are symmetrical and so have an ambiguity in the direction of time. Third-order nonlinearities, however, do not.
FROG is simply a spectrally resolved autocorrelation—a spectrogram.
Frequency-Resolved Optical Gating (FROG)
E(t)
E(t–)Detector
Esig(t,) E(t) E(t)
Properties of the Spectrogram/FROG
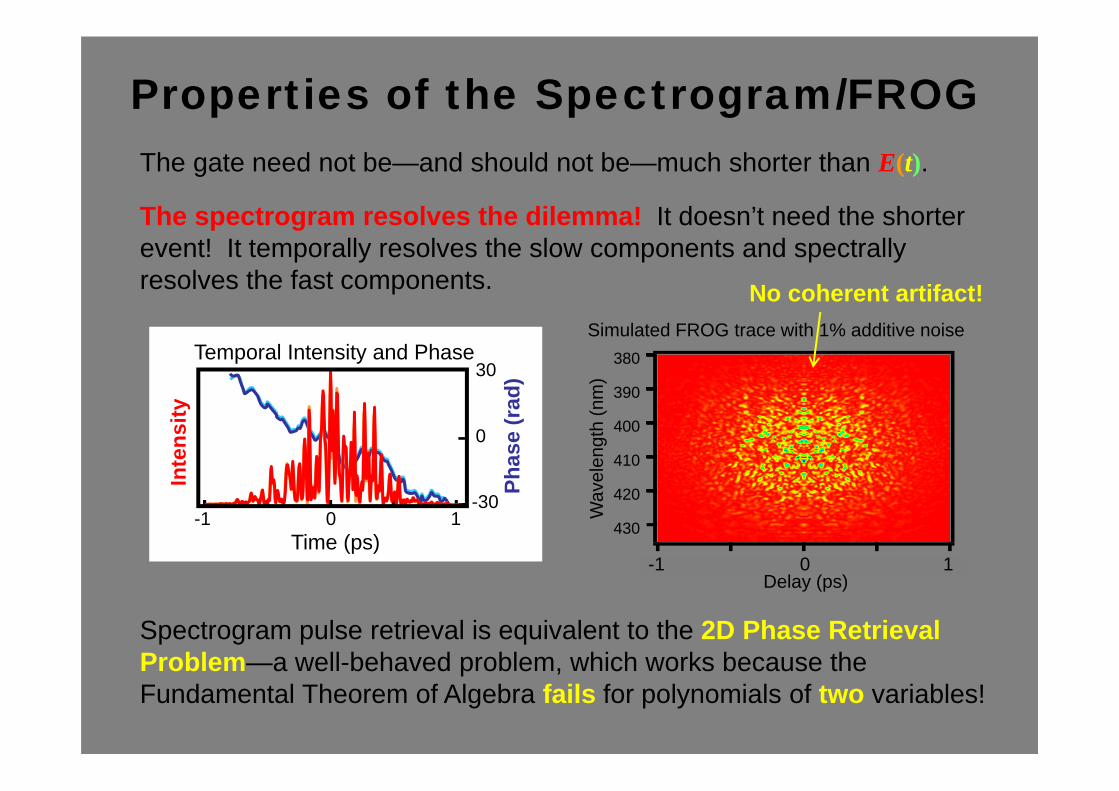
Spectrogram pulse retrieval is equivalent to the 2D Phase Retrieval Problem—a well-behaved problem, which works because the Fundamental Theorem of Algebra fails for polynomials of two variables!
The gate need not be—and should not be—much shorter than E(t).
Time (ps)
Inte
nsity
10-1-30
0
30
Phas
e (r
ad)
Temporal Intensity and PhaseSimulated FROG trace with 1% additive noise
Wav
elen
gth
(nm
) TBP=95
430
420
410
400
390
380
-1000 -500 0 500 1000-1 0 1-1 0Delay (ps)
No coherent artifact!
The spectrogram resolves the dilemma! It doesn’t need the shorter event! It temporally resolves the slow components and spectrally resolves the fast components.
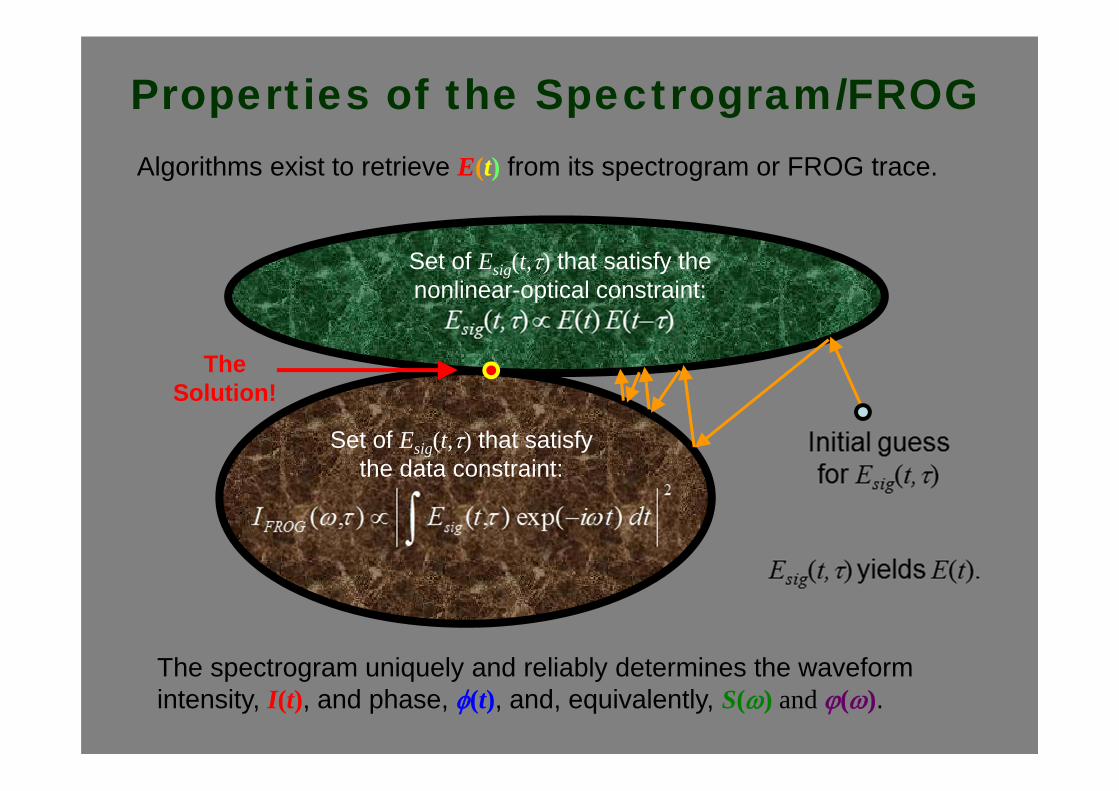
Properties of the Spectrogram/FROGAlgorithms exist to retrieve E(t) from its spectrogram or FROG trace.
2
( , ) ( , ) exp( )FROG sigI E t i t dt
The Solution!
Set of Esig(t,) that satisfy the nonlinear-optical constraint:
Esig(t,) E(t) E(t–)
Set of Esig(t,) that satisfy the data constraint:
The spectrogram uniquely and reliably determines the waveform intensity, I(t), and phase, (t), and, equivalently, S() and ().
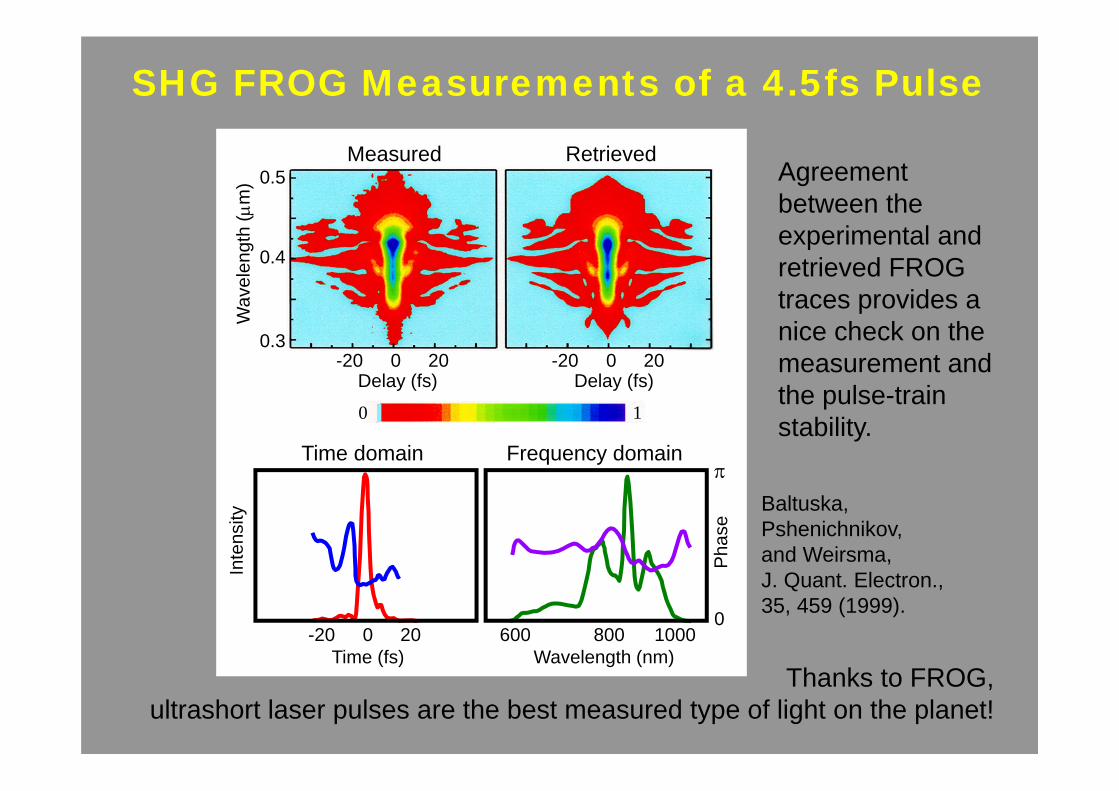
SHG FROG Measurements of a 4.5fs Pulse
Baltuska, Pshenichnikov, and Weirsma,J. Quant. Electron., 35, 459 (1999).
Agreement between the experimental and retrieved FROG traces provides a nice check on the measurement and the pulse-train stability.
Thanks to FROG, ultrashort laser pulses are the best measured type of light on the planet!
Inte
nsity
Time (fs) Wavelength (nm)
Pha
se
Time domain Frequency domain
600 1000800-20 200
Wav
elen
gth
(m
)
Delay (fs) Delay (fs)
Measured Retrieved0.5
0.4
0.3-20 200 -20 200
10
0
SHG FROGDelay Delay
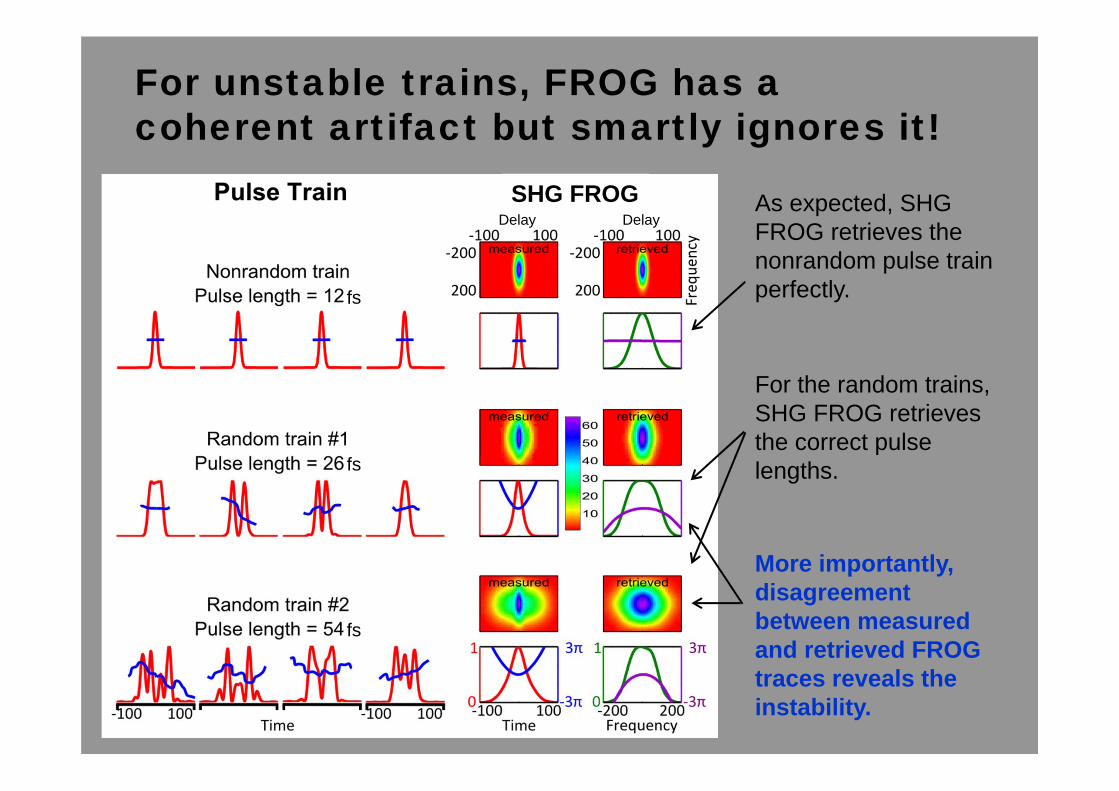
For unstable trains, FROG has a coherent artifact but smartly ignores it!
More importantly, disagreement between measured and retrieved FROG traces reveals the instability.
For the random trains, SHG FROG retrieves the correct pulse lengths.
As expected, SHG FROG retrieves the nonrandom pulse train perfectly.fs
fs
fs
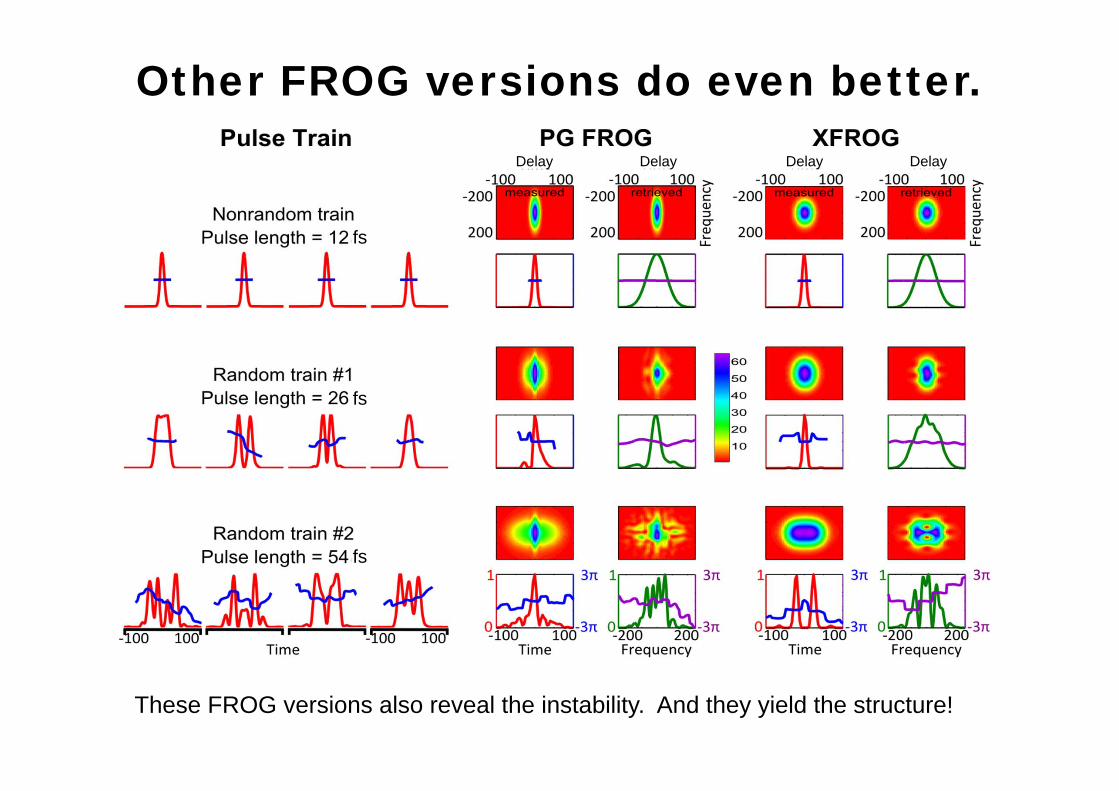
Other FROG versions do even better.
These FROG versions also reveal the instability. And they yield the structure!
Delay DelayDelay Delay
fs
fs
fs
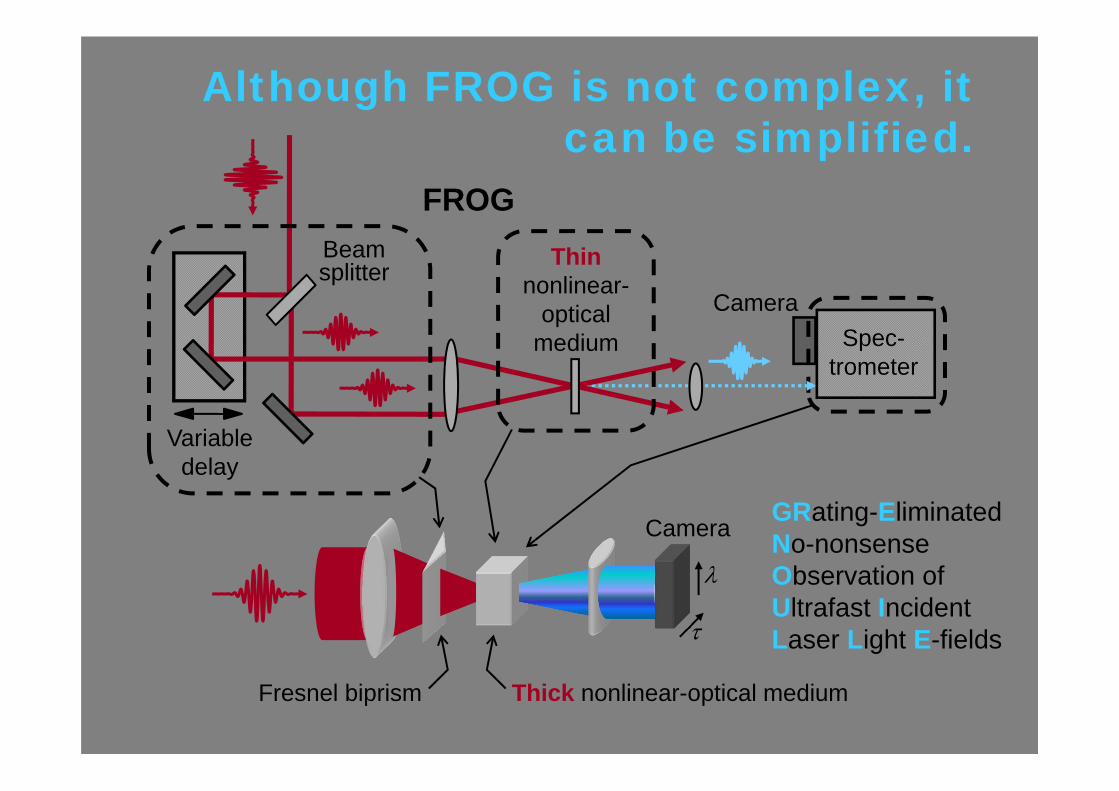
Although FROG is not complex, it can be simplified.
FROGThin
nonlinear-optical
medium
Variable delay
CameraSpec-
trometer
Beamsplitter
GRENOUILLE
Camera
Thick nonlinear-optical mediumFresnel biprism
GRating-Eliminated No-nonsense Observation of Ultrafast Incident Laser Light E-fields
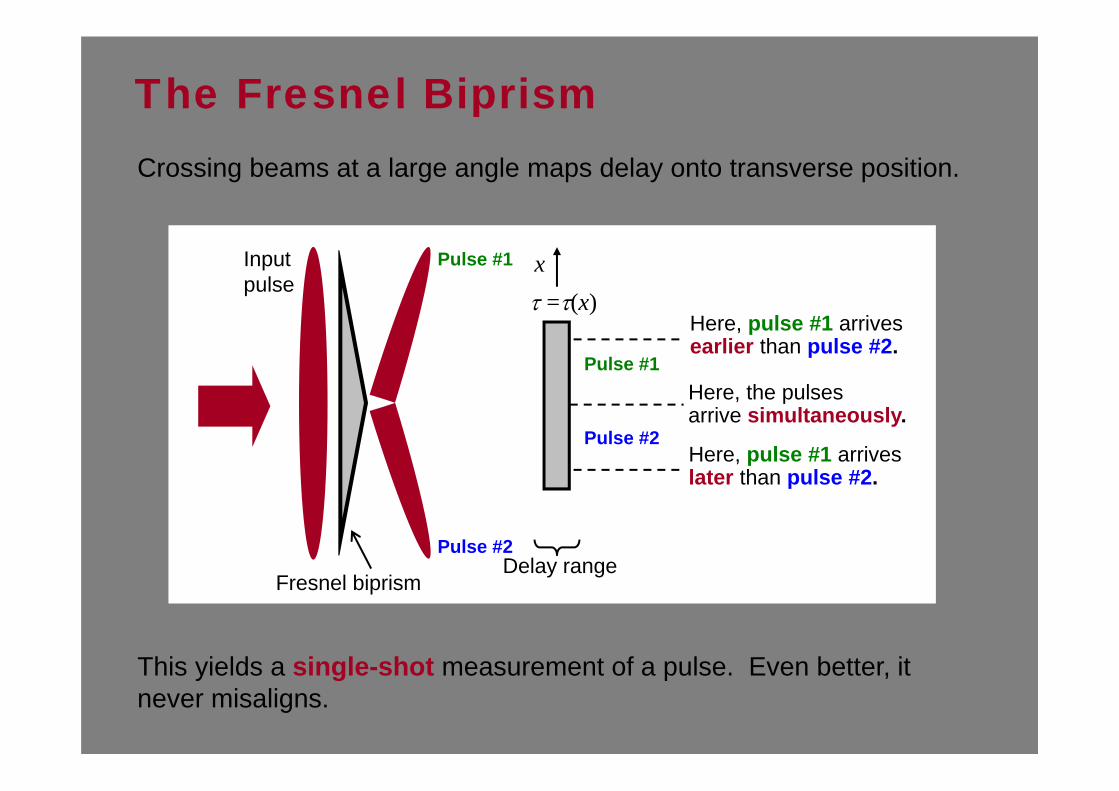
Crossing beams at a large angle maps delay onto transverse position.
This yields a single-shot measurement of a pulse. Even better, it never misaligns.
Here, pulse #1 arrivesearlier than pulse #2.
Here, the pulsesarrive simultaneously.
Here, pulse #1 arriveslater than pulse #2.
Fresnel biprism
=(x)xInput
pulsePulse #1
Pulse #2
The Fresnel Biprism
Pulse #1
Pulse #2
Delay range
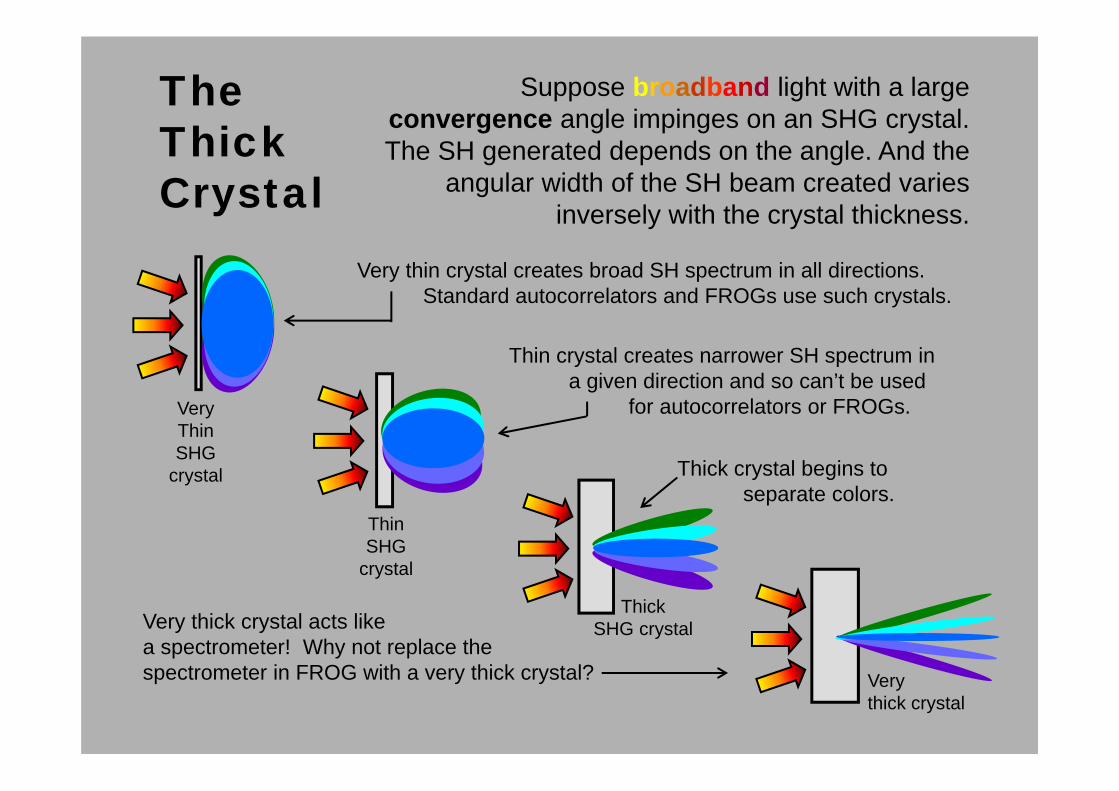
Very thin crystal creates broad SH spectrum in all directions.Standard autocorrelators and FROGs use such crystals.
VeryThinSHG
crystal
Thin crystal creates narrower SH spectrum ina given direction and so can’t be used
for autocorrelators or FROGs.
ThinSHG
crystal
Thick crystal begins to separate colors.
ThickSHG crystalVery thick crystal acts like
a spectrometer! Why not replace the spectrometer in FROG with a very thick crystal? Very
thick crystal
Suppose broadband light with a large convergence angle impinges on an SHG crystal. The SH generated depends on the angle. And the
angular width of the SH beam created varies inversely with the crystal thickness.
The Thick Crystal
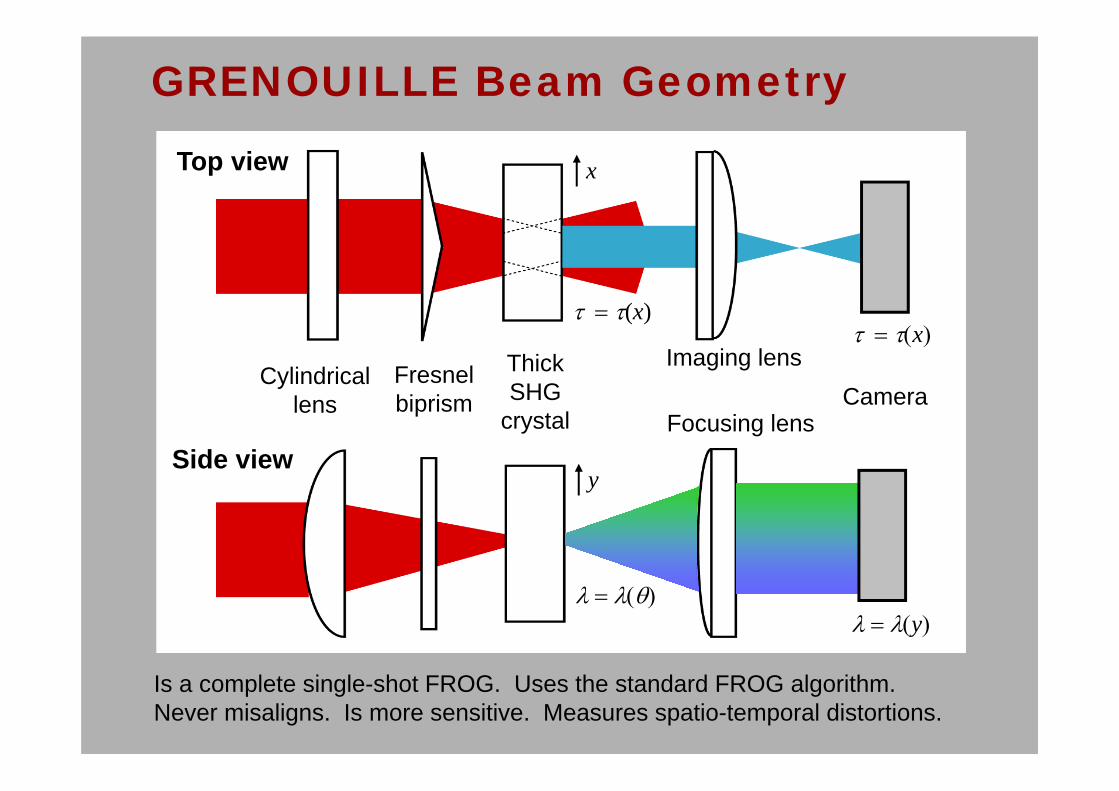
Is a complete single-shot FROG. Uses the standard FROG algorithm. Never misaligns. Is more sensitive. Measures spatio-temporal distortions.
GRENOUILLE Beam Geometry
Thick SHG
crystal
Imaging lensFresnel biprism
Cylindrical lens Camera
Top view
Side viewFocusing lens
x
y
(x)
y
x
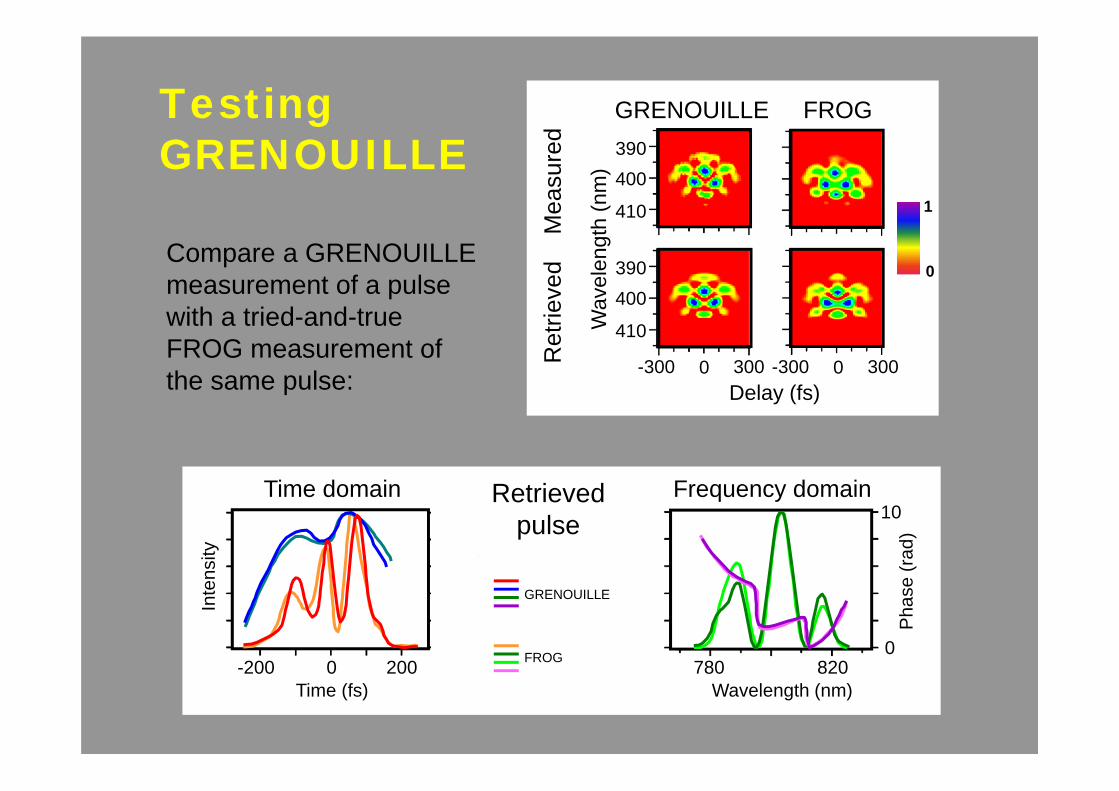
Testing GRENOUILLE
Compare a GRENOUILLE measurement of a pulse with a tried-and-true FROG measurement of the same pulse:
Time domain Frequency domain
Inte
nsity
Time (fs)
GRENOUILLE
FROG
Retrieved pulse
-200 200 780 820Wavelength (nm)
0
10
0
Pha
se (r
ad)
Delay (fs)-300 0 300 -300 0 300
Wav
elen
gth
(nm
)
390400
410
390400
410
GRENOUILLE FROG
Mea
sure
dR
etrie
ved
1
0
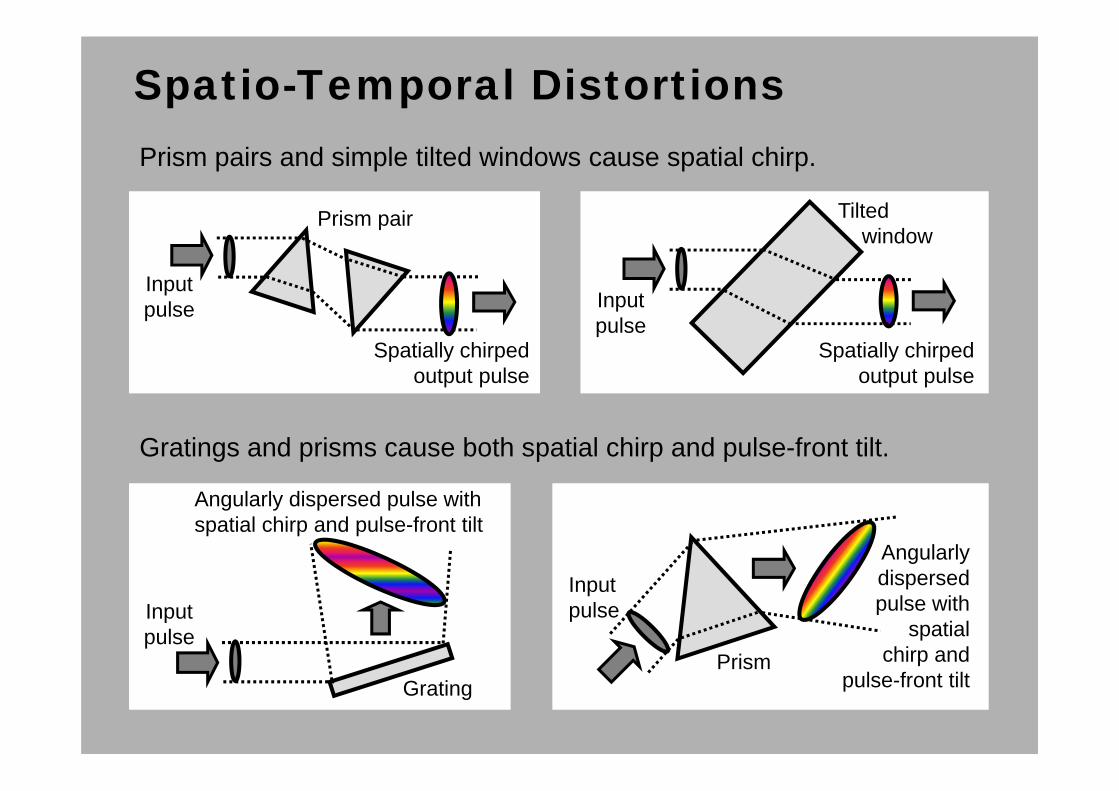
Spatio-Temporal DistortionsPrism pairs and simple tilted windows cause spatial chirp.
Gratings and prisms cause both spatial chirp and pulse-front tilt.
Prism
Angularly dispersed pulse with
spatial chirp and
pulse-front tilt
Input pulse
Grating
Angularly dispersed pulse with spatial chirp and pulse-front tilt
Input pulse
Prism pair
Input pulse
Spatially chirped output pulse
Spatially chirped output pulse
Input pulse
Tilted window
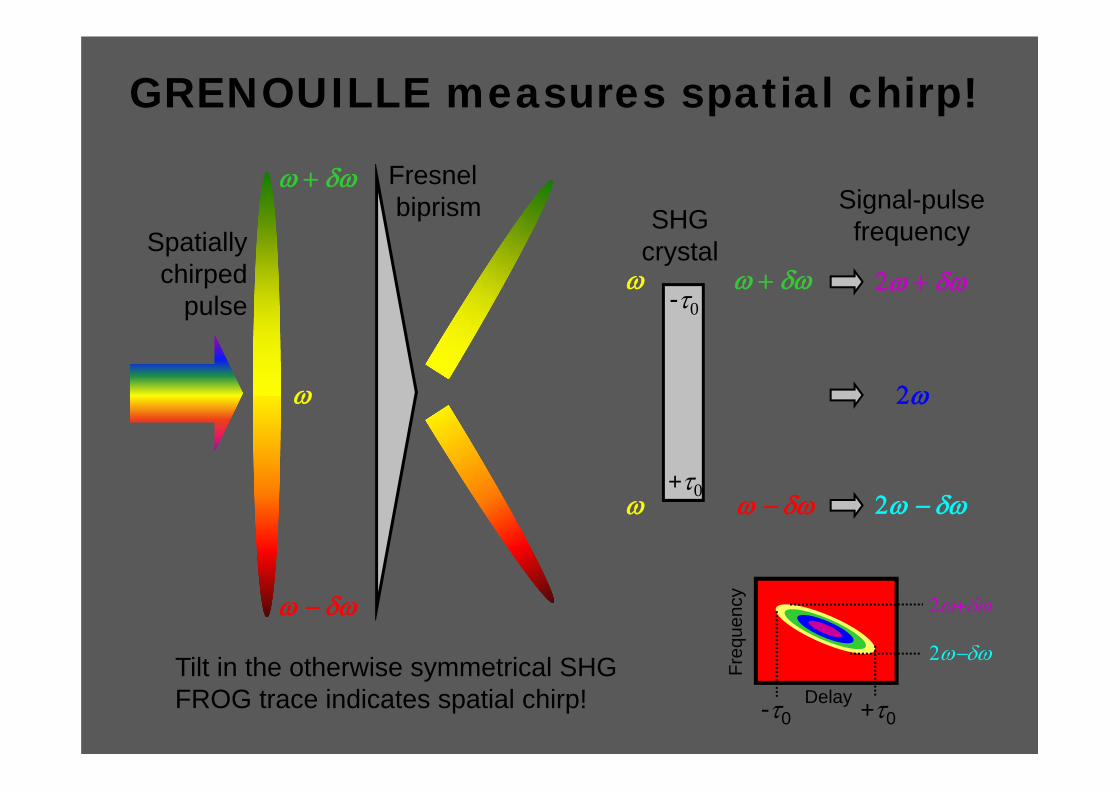
GRENOUILLE measures spatial chirp!
-0
+0
SHGcrystal
Signal-pulse frequency
Delay
Freq
uenc
y
+0-0
Tilt in the otherwise symmetrical SHG FROG trace indicates spatial chirp!
Fresnel biprism
Spatially chirped
pulse
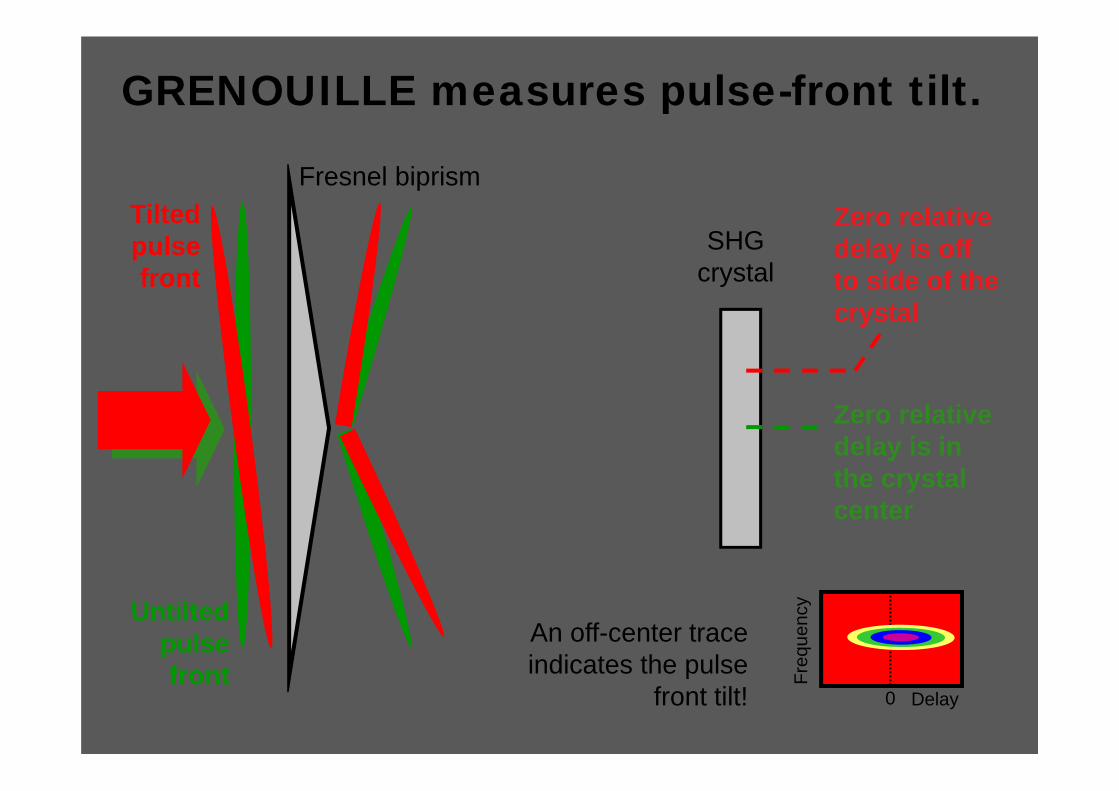
GRENOUILLE measures pulse-front tilt.
Zero relative delay is off to side of the crystal
Zero relative delay is in the crystal center
SHGcrystal
An off-center trace indicates the pulse
front tilt! Delay
Freq
uenc
y
0
Fresnel biprism
Untilted pulse front
Tilted pulse front
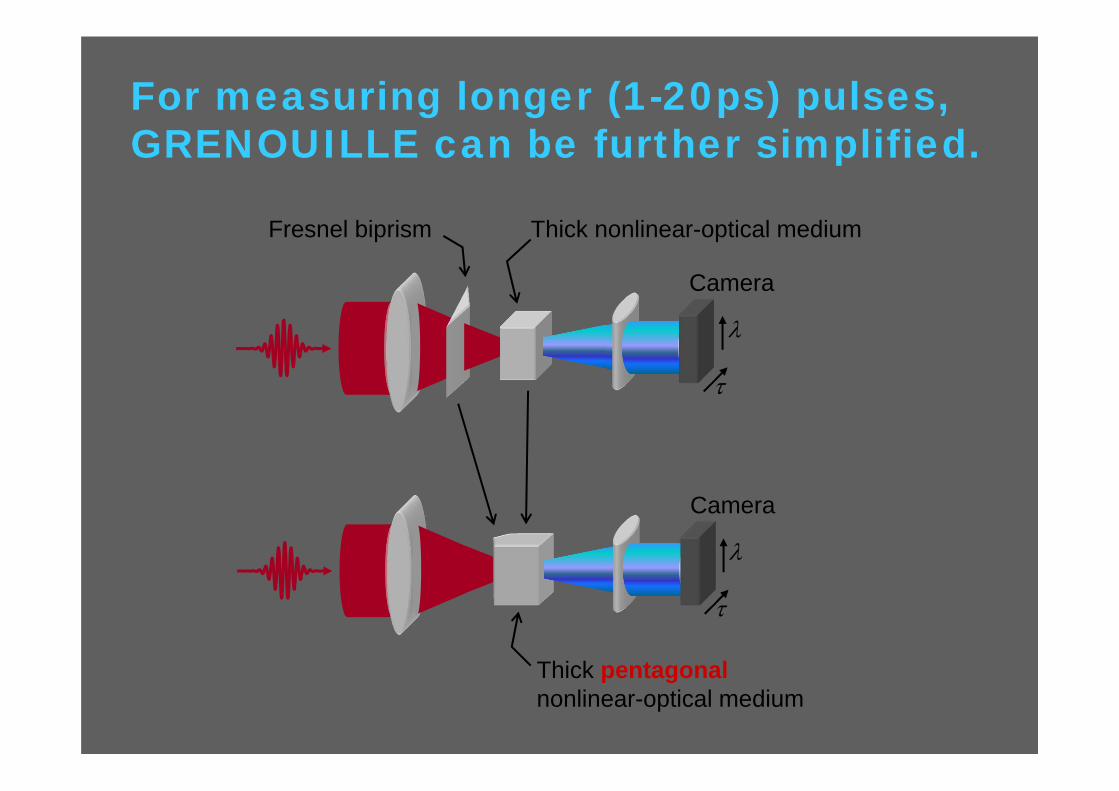
For measuring longer (1-20ps) pulses, GRENOUILLE can be further simplified.
Camera
Thick pentagonalnonlinear-optical medium
Camera
Thick nonlinear-optical mediumFresnel biprism
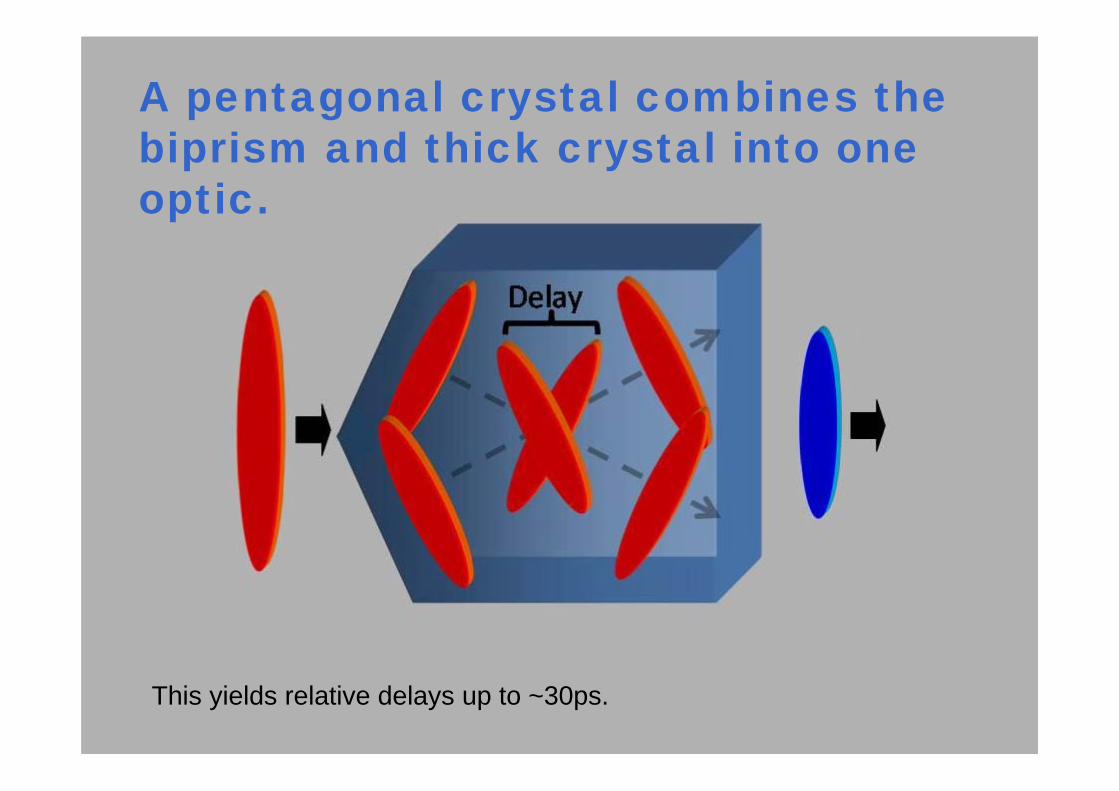
A pentagonal crystal combines the biprism and thick crystal into one optic.
This yields relative delays up to ~30ps.
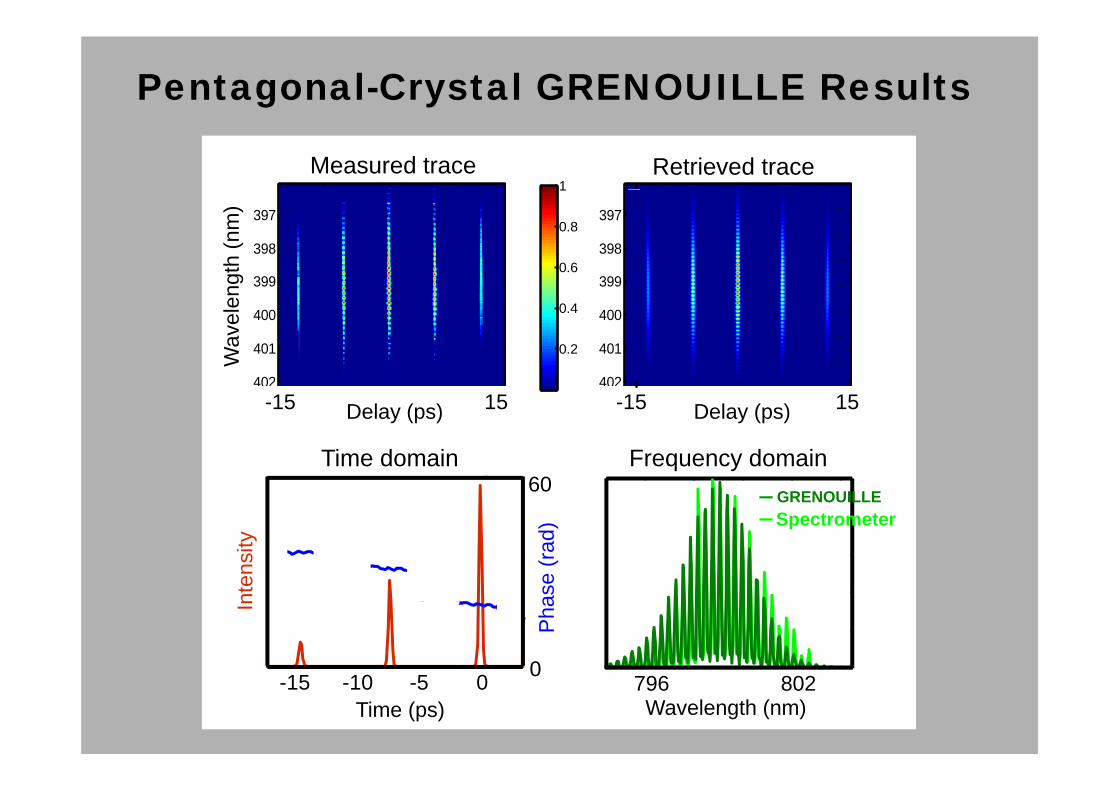
Pentagonal-Crystal GRENOUILLE Results
0.2
0.4
0.6
0.8
1
Inte
nsity
Pha
se (r
ad)
Time domain
Time (ps)
60
Pha
se (r
ad)
-15 -10 -5 0 0
Inte
nsity
Wavelength (nm)
Retrieved Spectrum
796 802
GRENOUILLE Spectrometer
Frequency domain
Delay (ps)
397
398
399
400
401
402
Measured trace
Wav
elen
gth
(nm
)
-15 15
397
398
399
400
401
402
Delay (ps)
Retrieved trace
-15 15
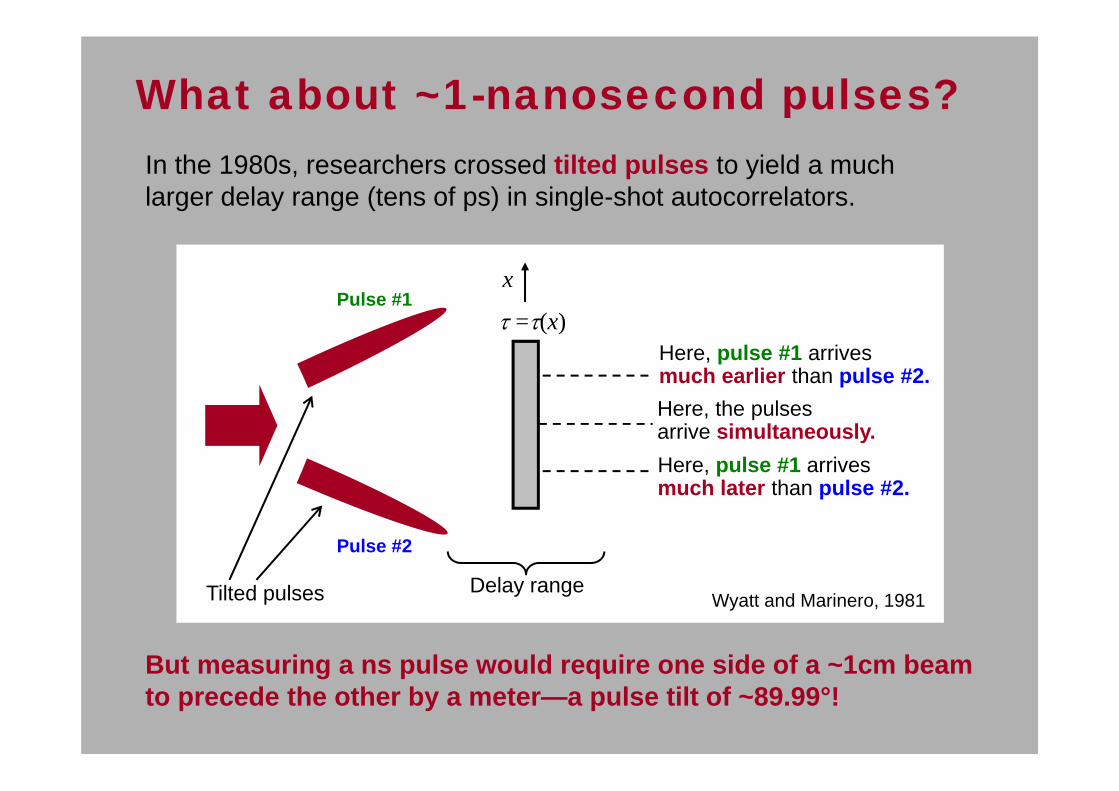
In the 1980s, researchers crossed tilted pulses to yield a much larger delay range (tens of ps) in single-shot autocorrelators.
Here, pulse #1 arrivesmuch earlier than pulse #2.Here, the pulsesarrive simultaneously.Here, pulse #1 arrivesmuch later than pulse #2.
=(x)
xPulse #1
Pulse #2
What about ~1-nanosecond pulses?
Tilted pulses Delay rangeWyatt and Marinero, 1981
But measuring a ns pulse would require one side of a ~1cm beam to precede the other by a meter—a pulse tilt of ~89.99°!
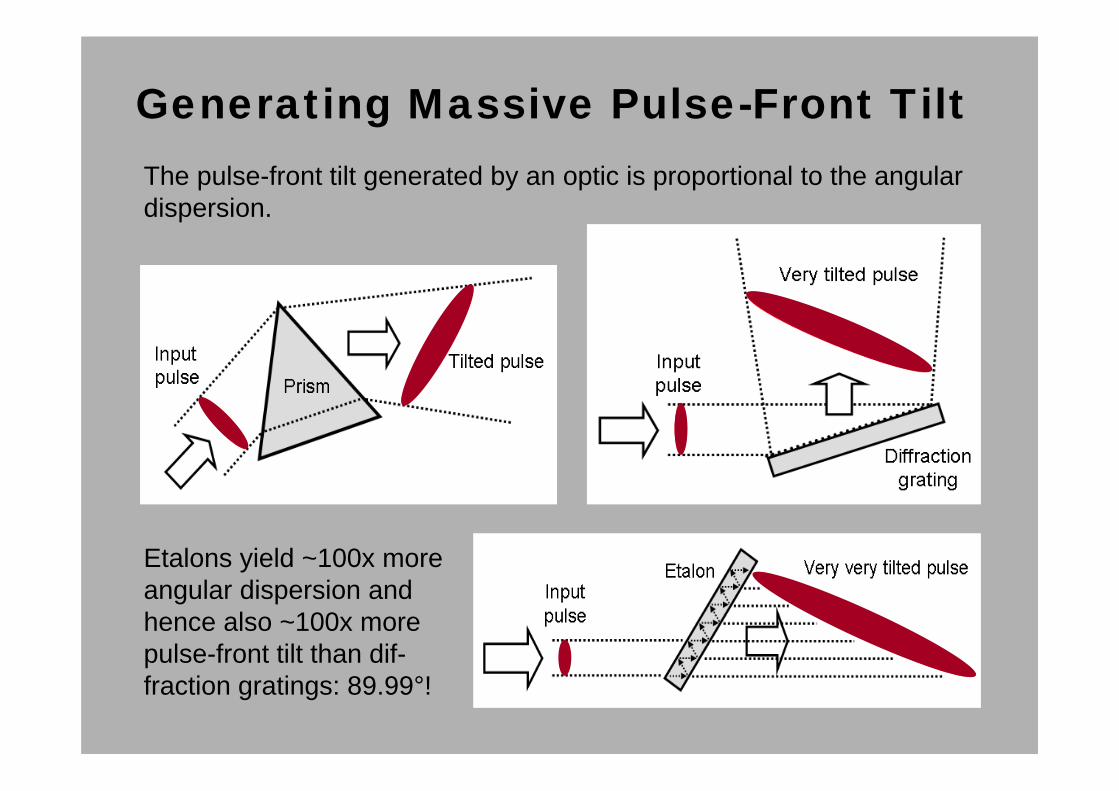
Generating Massive Pulse-Front TiltThe pulse-front tilt generated by an optic is proportional to the angular dispersion.
Etalons yield ~100x more angular dispersion and hence also ~100x more pulse-front tilt than dif-fraction gratings: 89.99°!
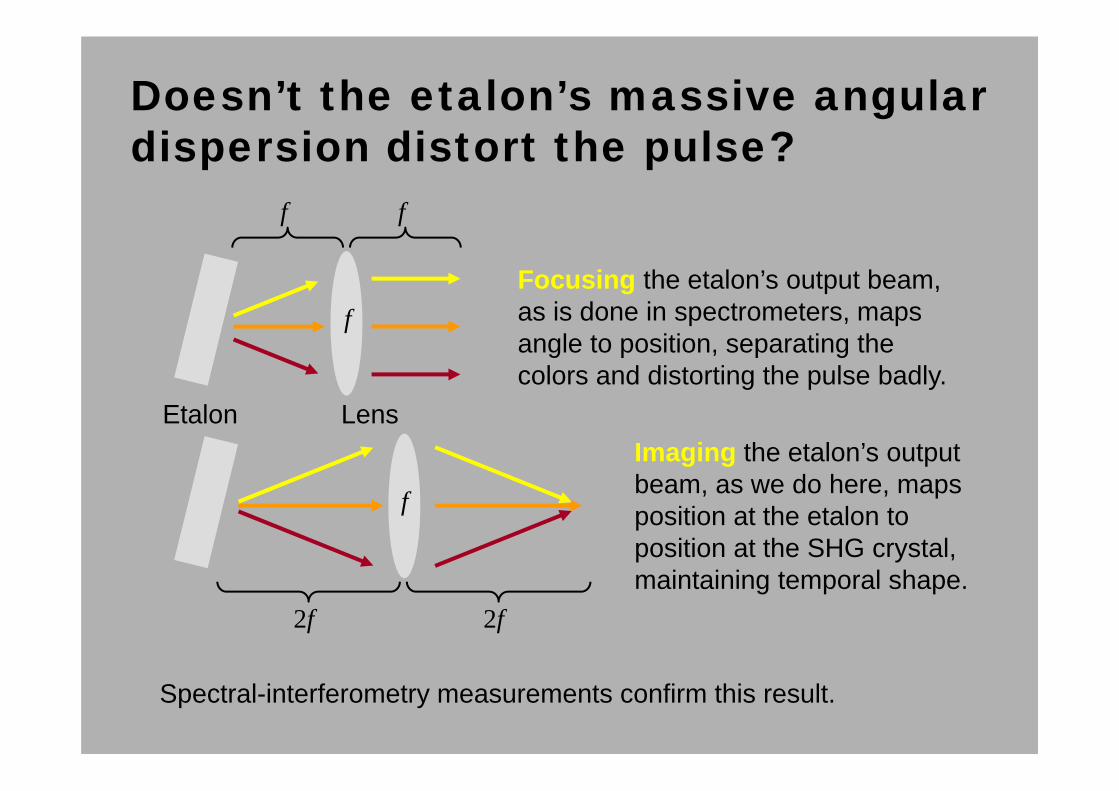
Doesn’t the etalon’s massive angular dispersion distort the pulse?
Focusing the etalon’s output beam, as is done in spectrometers, maps angle to position, separating the colors and distorting the pulse badly.
Etalon Lens
f
f
Imaging the etalon’s output beam, as we do here, maps position at the etalon to position at the SHG crystal, maintaining temporal shape.
f
2f 2f
f
Spectral-interferometry measurements confirm this result.
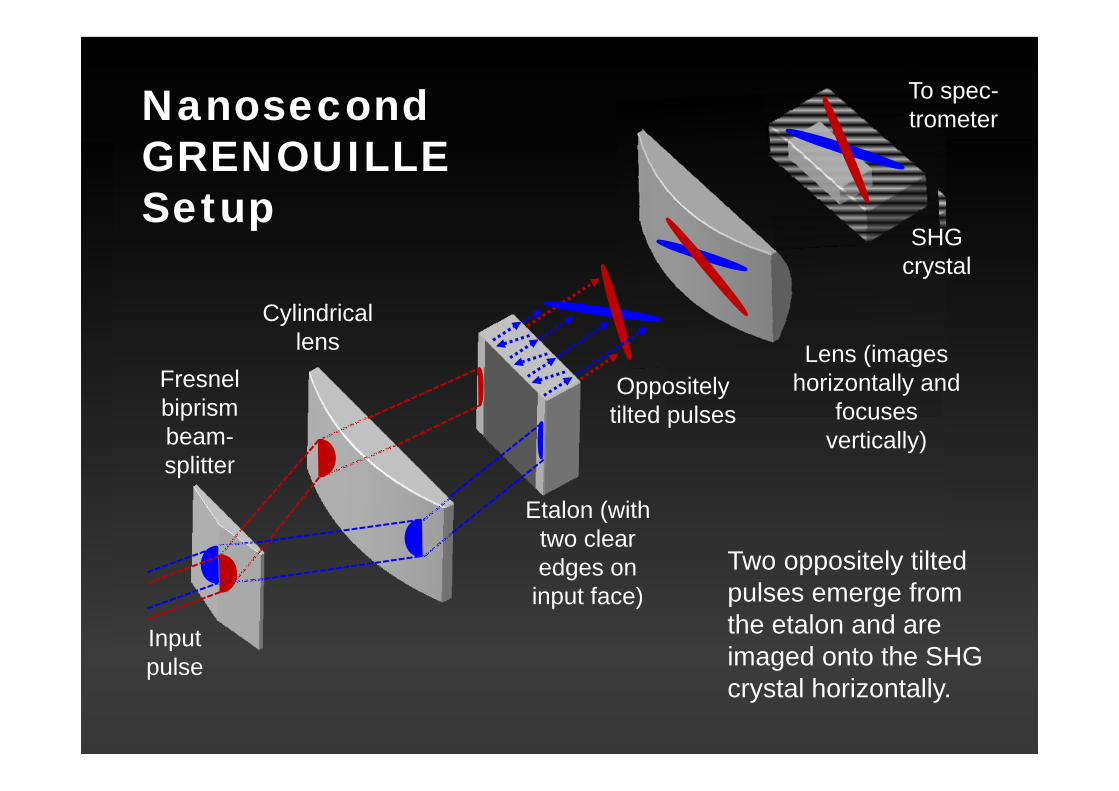
Fresnel biprism beam-splitter
Cylindrical lens
Oppositely tilted pulses
Input pulse
Etalon (with two clear edges on input face)
To spec-trometerNanosecond
GRENOUILLE Setup
SHG crystal
Lens (images horizontally and
focuses vertically)
Two oppositely tilted pulses emerge from the etalon and are imaged onto the SHG crystal horizontally.
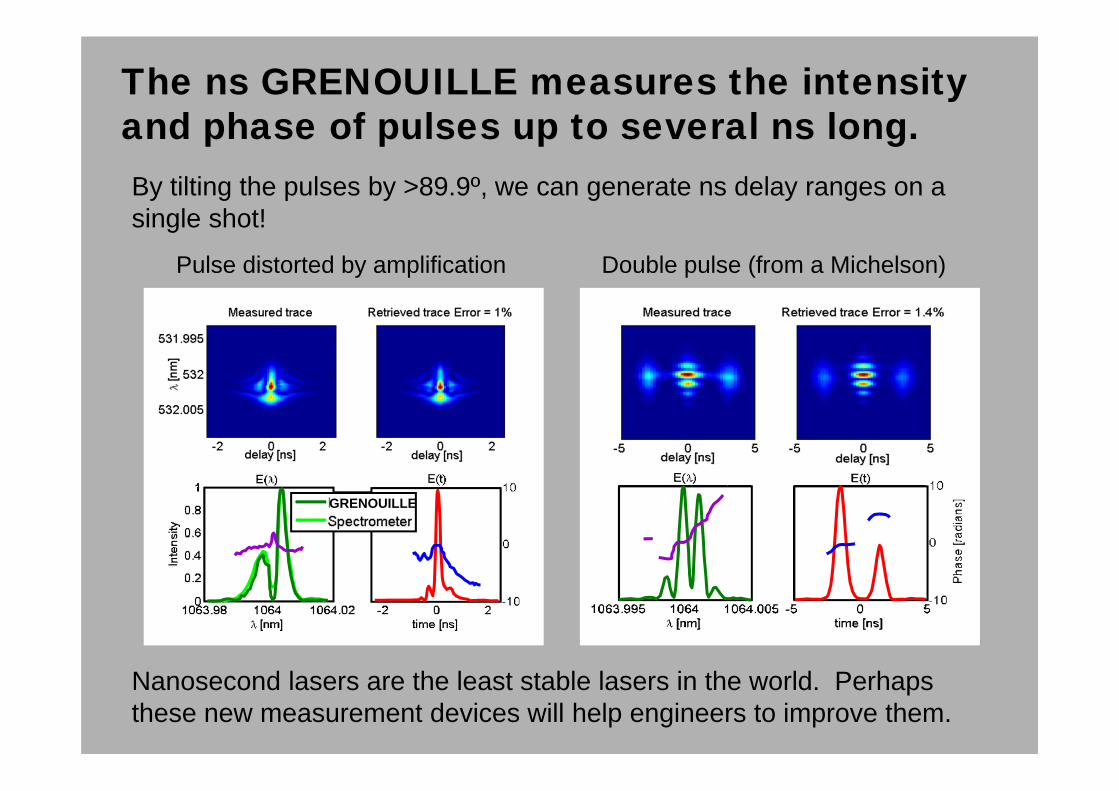
The ns GRENOUILLE measures the intensity and phase of pulses up to several ns long.
Pulse distorted by amplification Double pulse (from a Michelson)
By tilting the pulses by >89.9º, we can generate ns delay ranges on a single shot!
Nanosecond lasers are the least stable lasers in the world. Perhaps these new measurement devices will help engineers to improve them.
GRENOUILLE
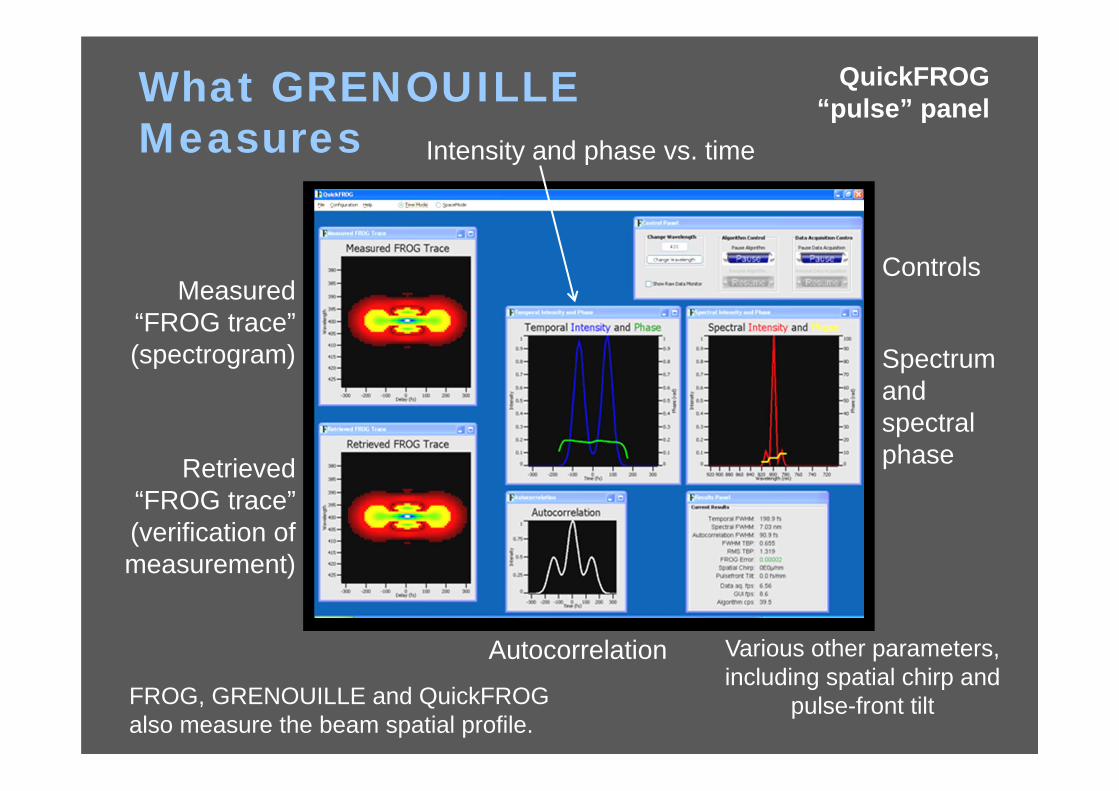
What GRENOUILLE Measures
Measured “FROG trace” (spectrogram)
Retrieved “FROG trace” (verification of measurement)
Autocorrelation Various other parameters, including spatial chirp and
pulse-front tilt
Intensity and phase vs. time
Spectrum and spectral phase
Controls
QuickFROG “pulse” panel
FROG, GRENOUILLE and QuickFROG also measure the beam spatial profile.
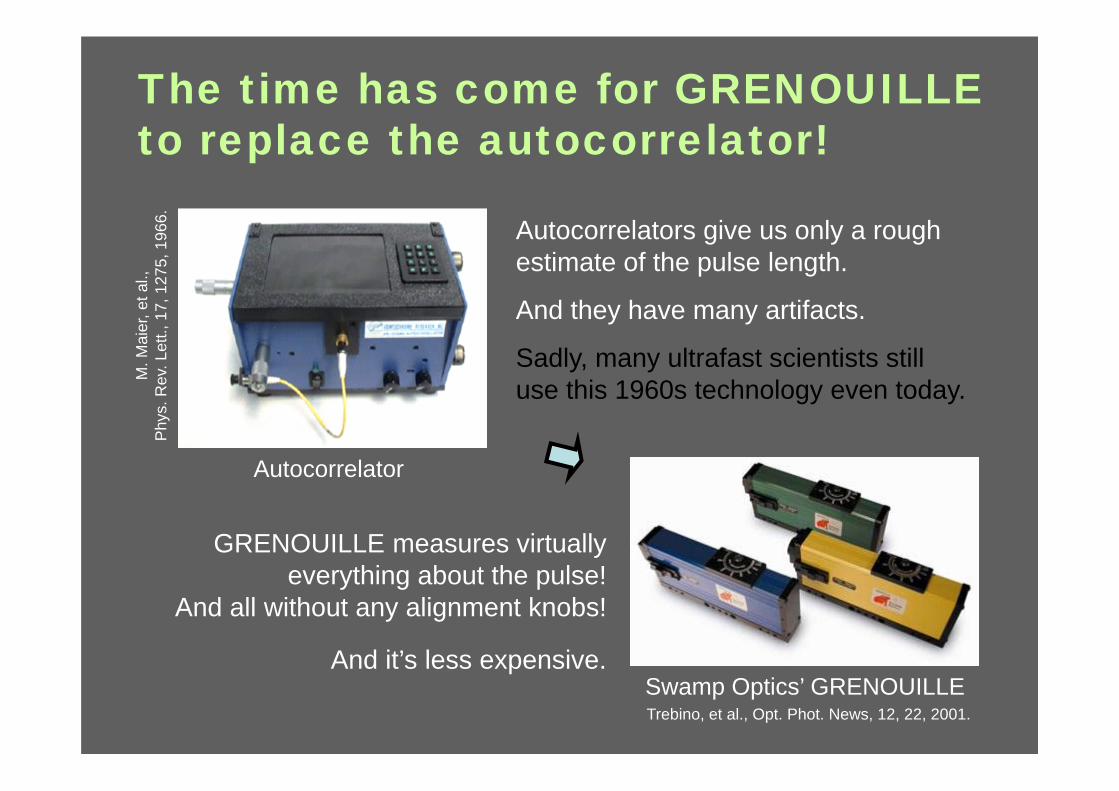
The time has come for GRENOUILLE to replace the autocorrelator!
Swamp Optics’ GRENOUILLE
Autocorrelators give us only a rough estimate of the pulse length.
And they have many artifacts.
Sadly, many ultrafast scientists still use this 1960s technology even today.
Autocorrelator
M. M
aier
, et a
l.,
Phy
s. R
ev. L
ett.,
17,
127
5, 1
966.
GRENOUILLE measures virtually everything about the pulse!
And all without any alignment knobs!
Trebino, et al., Opt. Phot. News, 12, 22, 2001.
And it’s less expensive.
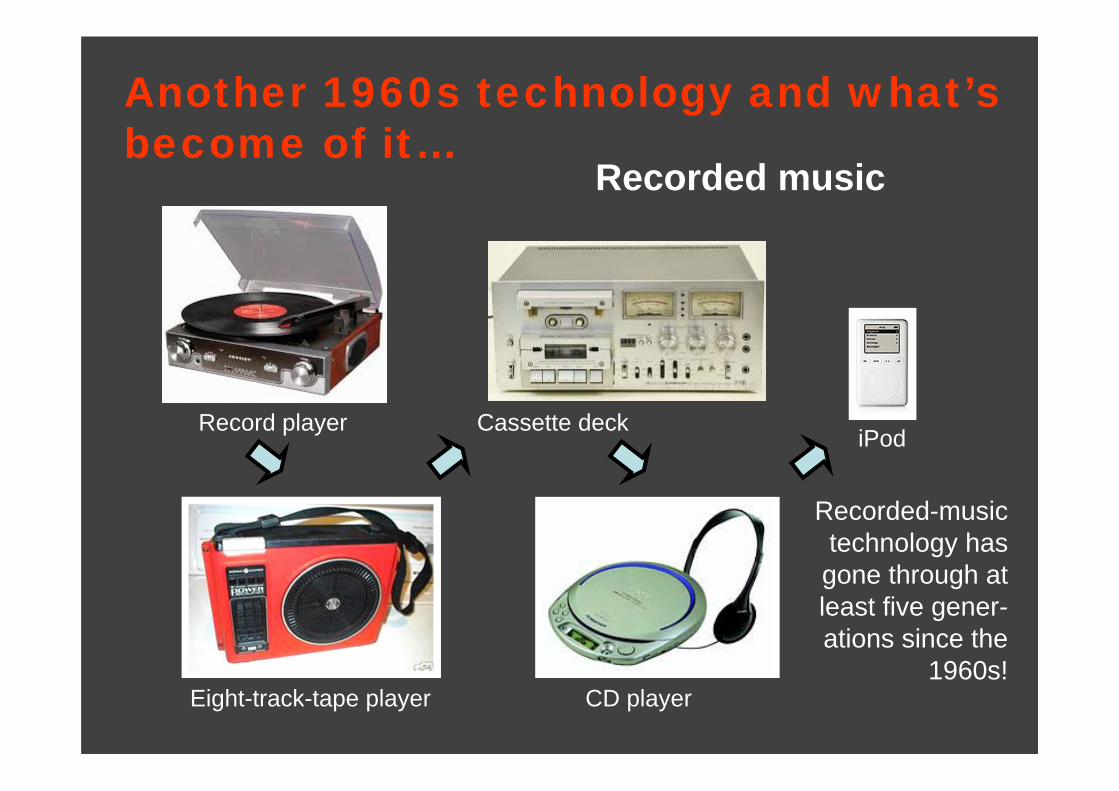
Another 1960s technology and what’s become of it…
Record player
Eight-track-tape player
Cassette deck
CD player
iPod
Recorded-music technology has gone through at least five gener-ations since the
1960s!
Recorded music
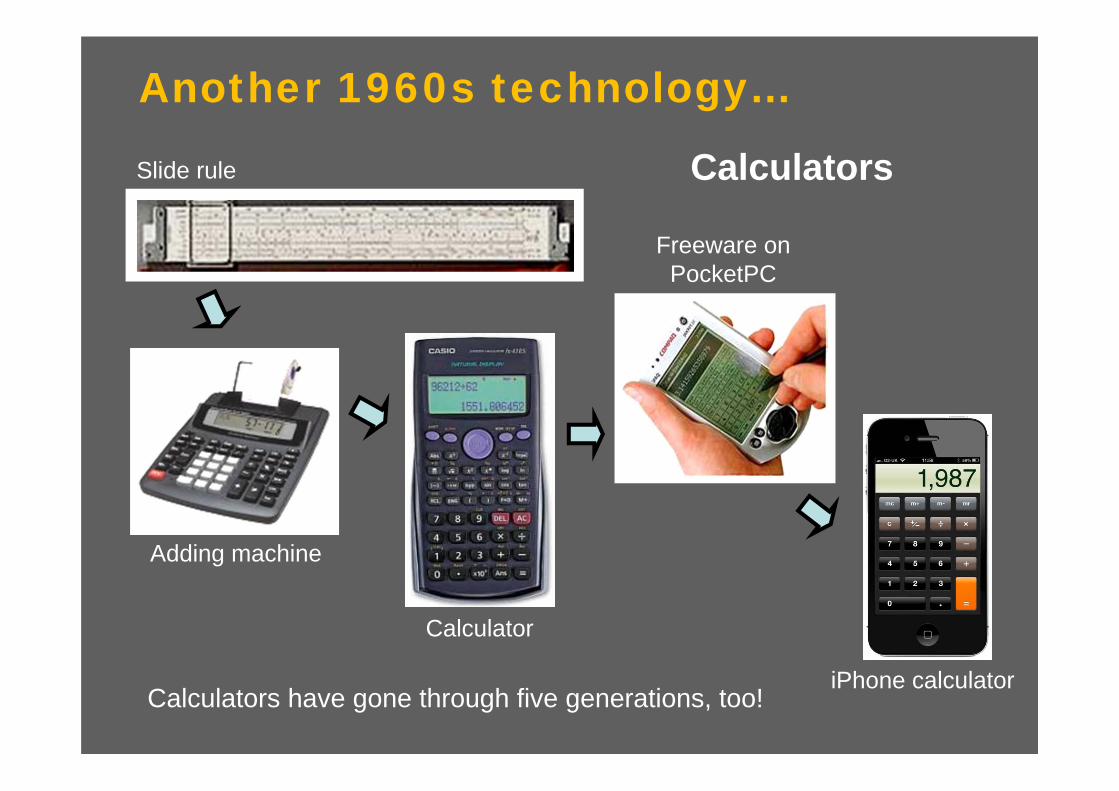
Another 1960s technology…
Slide rule
Adding machine
Calculator
Freeware on PocketPC
iPhone calculator
Calculators
Calculators have gone through five generations, too!
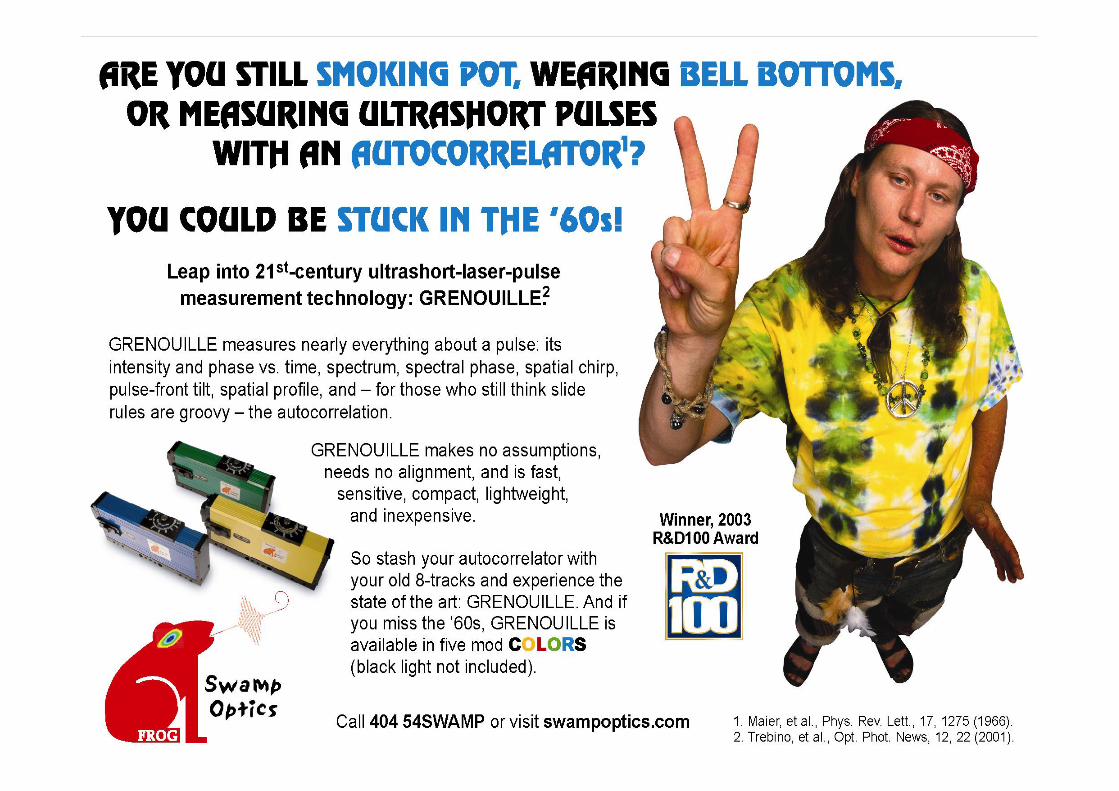
Ad
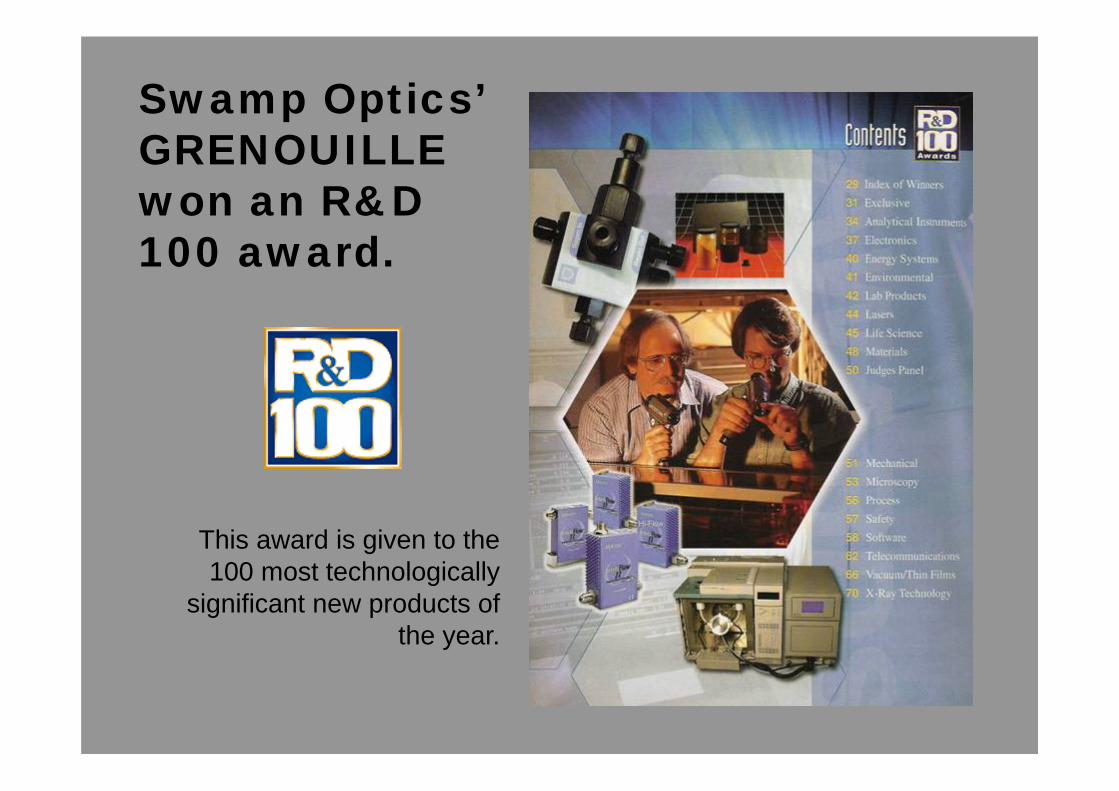
Swamp Optics’ GRENOUILLE won an R&D 100 award.
This award is given to the 100 most technologically
significant new products of the year.
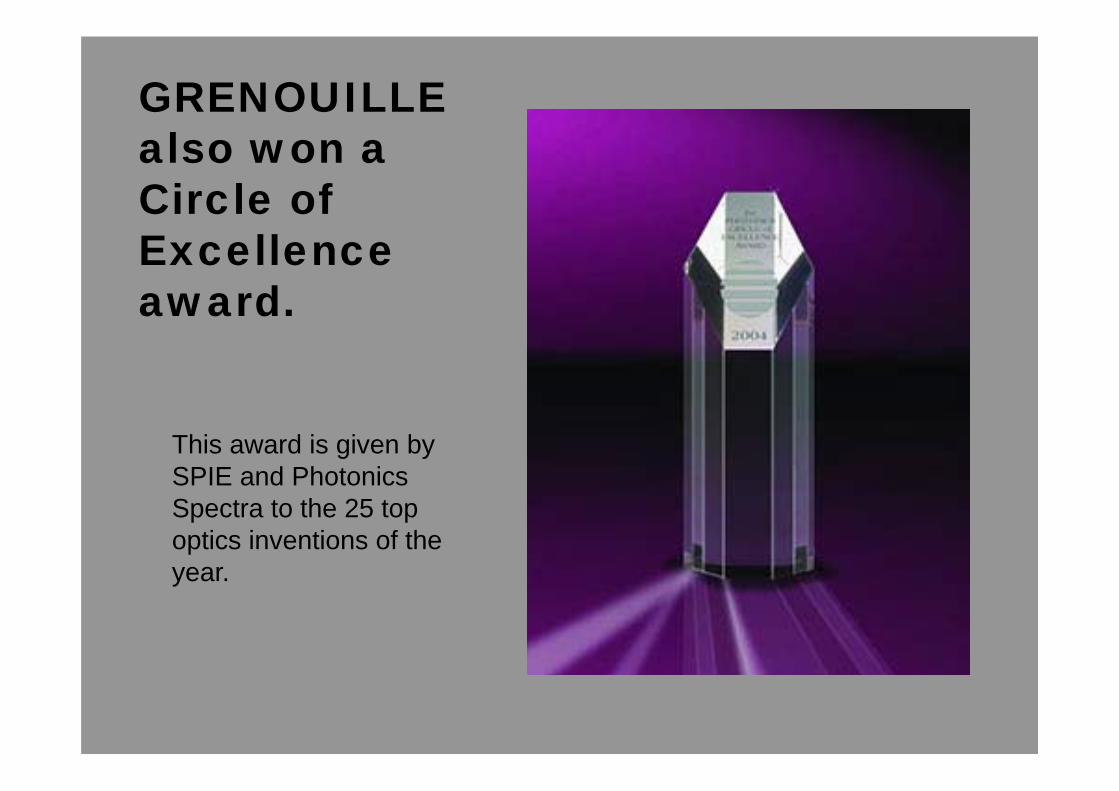
GRENOUILLE also won a Circle of Excellence award.
This award is given by SPIE and Photonics Spectra to the 25 top optics inventions of the year.
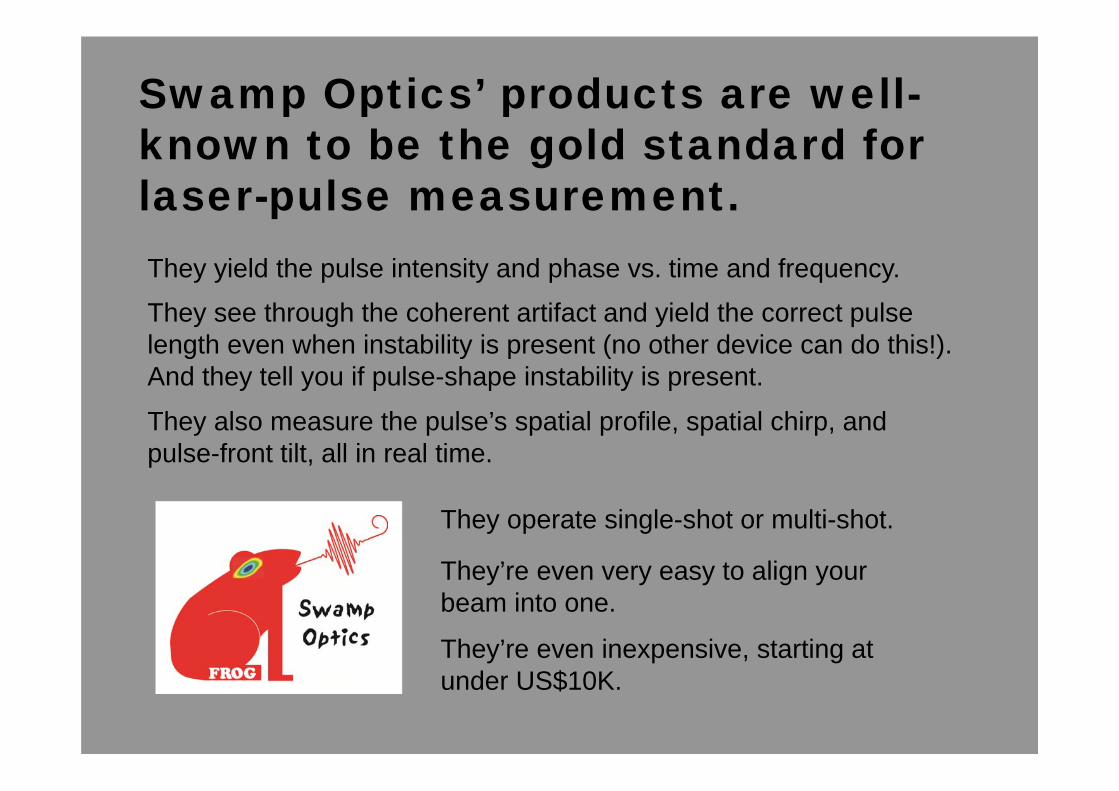
Swamp Optics’ products are well-known to be the gold standard for laser-pulse measurement.They yield the pulse intensity and phase vs. time and frequency.
They operate single-shot or multi-shot.
They also measure the pulse’s spatial profile, spatial chirp, and pulse-front tilt, all in real time.
They see through the coherent artifact and yield the correct pulse length even when instability is present (no other device can do this!). And they tell you if pulse-shape instability is present.
They’re even inexpensive, starting at under US$10K.
They’re even very easy to align your beam into one.
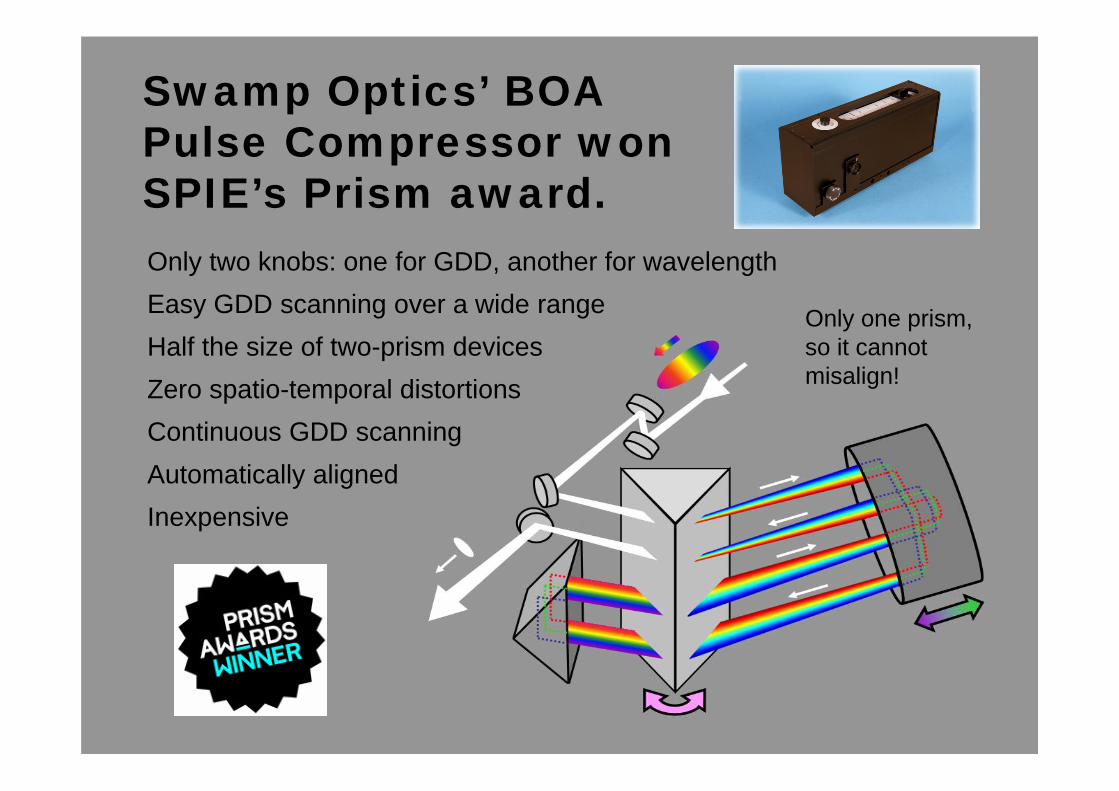
Swamp Optics’ BOA Pulse Compressor won SPIE’s Prism award. Only two knobs: one for GDD, another for wavelengthEasy GDD scanning over a wide rangeHalf the size of two-prism devices Zero spatio-temporal distortionsContinuous GDD scanningAutomatically alignedInexpensive
Only one prism, so it cannot misalign!
To learn more…
www.swampoptics.com
www.frog.gatech.edu
And if you read only one ultrashort-pulse-measurement
book this year, make it this one!
If you have an interesting pulse-measurement problem, let us know!
Swamp Optics manufactures FROGs and GRENOUILLEs
to measure pulses from 4fs to 4ns!
Starting at under $10K.