Embed Size (px)
Citation preview

University of TrentoUniversity of BresciaUniversity of PadovaUniversity of TriesteUniversity of Udine
University IUAV of Venezia
Giulia Franceschini
THE MECHANICS OF
HUMAN BRAIN TISSUE
Tutor: Prof. Davide BigoniCo-tutor: Prof. Gerhard A. Holzapfel
Trento, febbraio 2006
UNIVERSITY OF TRENTOModelling, Preservation and Control of Materials and Structures
Ph. D. HEAD’S: Prof. Oreste S. Bursi
Final Examination: 14th February 2006
Boards of examiners:
Prof. Davide Bigoni, University of TrentoProf. David P. Stoten, University of Bristol, UKProf. Ray W. Ogden, University of Glasgow, ScotlandProf. Enrico Spacone, University ”G. D’Annunzio” PescaraProf. Behrouz Gatmiri, Ecole Nationale des Ponts et Chaussees
Summary
Slow, large deformations of human brain tissue - accompanying cranialvault deformation induced by positional plagiocephaly, occurring during hy-drocephalus, and in the convolutional development - has surprisingly receivedscarce mechanical investigation. Since the effects of these deformations maybe important, we performed a systematic series of in vitro experiments onhuman brain tissue, revealing the following features:
• under uniaxial (quasi-static), cyclic loading, brain tissue exhibits a pecu-liar nonlinear mechanical behaviour, exhibiting hysteresis, Mullins effectand residual strain, qualitatively similar to that observed in filled elas-tomers. As a consequence, the loading and unloading uniaxial curveshave been found to follow the Ogden nonlinear elastic theory of rubber(and its variants to include Mullins effect and permanent strain);
• loaded up to failure, the ”shape” of the stress/strain curve qualitativelychanges, evidencing softening related to local failure;
• uniaxial (quasi-static) strain experiments under controlled drainage con-ditions provide the first direct evidence that the tissue obeys consolida-tion theory involving fluid migration, with properties similar to fine soils,but having much smaller volumetric compressibility;
• our experimental findings also support the existence of a viscous com-ponent of the solid phase deformation.
Brain tissue should, therefore, be modelled as a porous, fluid-saturated,nonlinear solid with very small volumetric (drained) compressibility.
3
Sommario
In patologie quali la plagiocefalia, l’idrocefalo o durante lo sviluppo fetaledelle circonvoluzioni, il tessuto cerebrale risulta soggetto a pressioni di notev-ole entita e di conseguenza a grandi deformazioni che si sviluppano lentamentenel tempo. Finora lo studio meccanico di tali deformazioni e stato piuttostotrascurato, ma tenuto conto che i loro effetti possono essere di rilevante impor-tanza, si e deciso di eseguire una campagna sperimentale in vitro su campionidi tessuto cerebrale umano.
Tali esperimenti hanno permesso di mettere in evidenza le seguenti carat-teristiche:
• quando sottoposto a carichi ciclici uniassiali (quasi-statici) il tessutocerebrale presenta un comportamento non lineare, isteretico, eviden-ziando un effetto Mullins e una deformazione permanente, qualitativa-mente simile a quello che si osserva nei polimeri rinforzati. Si e pertantotrovato che le curve di carico e scarico seguono la teoria elastica di Og-den per le gomme (e le relative variazioni che tengono conto dell’effettoMullins e della deformazione permanente);
• una volta che il campione viene caricato fino a rottura, la forma dellacurva di tensione/deformazione cambia qualitativamente, mettendo inevidenza il softening relativo alla rottura locale;
• gli esperimenti a deformazione uniassiale (quasi-statica) a drenaggio con-trollato, forniscono la prima evidenza diretta che il tessuto segue la teoriadella consolidazione (riguardante la migrazione di fluido), con proprietasimili a quelle dei terreni limosi, ma con una comprimibilita volumetricamolto inferiore;
• i risultati sperimentali supportano inoltre la presenza di una componenteviscosa della deformazione relativamente alla parte solida.
Il tessuto cerebrale dovrebbe, quindi, essere modellato come un solido nonlineare, poroso e saturo con comprimibilita (drenata) molto piccola.
4
Contents
1 Introduction 9
2 Anatomy 132.1 Introduction . . . . . . . . . . . . . . . . . . . . . . . . . . . . . 132.2 The Nervous System . . . . . . . . . . . . . . . . . . . . . . . . 132.3 The nerve cell . . . . . . . . . . . . . . . . . . . . . . . . . . . . 132.4 The Central Nervous System . . . . . . . . . . . . . . . . . . . 14
2.4.1 The scalp and skull . . . . . . . . . . . . . . . . . . . . . 152.4.2 Meninges . . . . . . . . . . . . . . . . . . . . . . . . . . 162.4.3 Cerebrospinal Fluid Spaces . . . . . . . . . . . . . . . . 17
2.5 Brain . . . . . . . . . . . . . . . . . . . . . . . . . . . . . . . . 182.6 Development of the brain . . . . . . . . . . . . . . . . . . . . . 212.7 Hydrocephalus . . . . . . . . . . . . . . . . . . . . . . . . . . . 212.8 Cerebral edema . . . . . . . . . . . . . . . . . . . . . . . . . . . 23
3 The State-of-the-art 253.1 Introduction . . . . . . . . . . . . . . . . . . . . . . . . . . . . . 253.2 Artificial and intentional cranial deformations . . . . . . . . . . 253.3 The State-of-the-art on mechanical testing of brain tissue . . . 273.4 Slow deformation of brain tissue calls for experimental investi-
gation . . . . . . . . . . . . . . . . . . . . . . . . . . . . . . . . 28
4 Uniaxial cyclic tension/compression experiments 334.1 Introduction . . . . . . . . . . . . . . . . . . . . . . . . . . . . . 334.2 Uniaxial testing device . . . . . . . . . . . . . . . . . . . . . . . 334.3 Uniaxial behavior . . . . . . . . . . . . . . . . . . . . . . . . . . 37
5
6 Contents
4.4 The Ogden theory . . . . . . . . . . . . . . . . . . . . . . . . . 414.5 The Mullins effect . . . . . . . . . . . . . . . . . . . . . . . . . 444.6 The Mullins effect with permanent set . . . . . . . . . . . . . . 464.7 Damage evolution and fracture process . . . . . . . . . . . . . . 49
5 Uniaxial deformation at free drainage 535.1 Introduction . . . . . . . . . . . . . . . . . . . . . . . . . . . . . 535.2 The oedometric test . . . . . . . . . . . . . . . . . . . . . . . . 545.3 The Terzaghi theory . . . . . . . . . . . . . . . . . . . . . . . . 575.4 A comparison with the Terzaghi theory . . . . . . . . . . . . . 595.5 Is viscosity present in the solid phase? . . . . . . . . . . . . . . 625.6 A viscous correction to Terzaghi theory . . . . . . . . . . . . . 635.7 A note on the consolidation theory . . . . . . . . . . . . . . . . 65
6 Conclusion 77
A Additional results from compression/tension tests 79A.1 Introduction . . . . . . . . . . . . . . . . . . . . . . . . . . . . . 79A.2 Mechanical Brain behavior . . . . . . . . . . . . . . . . . . . . . 79
A.2.1 Specimens harvested from corpus callosum . . . . . . . 79A.2.2 Specimens harvested from frontal lobe in frontal direction 81A.2.3 Specimens harvested from frontal lobe in sagittal direction 82A.2.4 Specimens harvested from medulla oblongata . . . . . . 83A.2.5 Specimens harvested from occipital lobe in sagittal di-
rection . . . . . . . . . . . . . . . . . . . . . . . . . . . . 84A.2.6 Specimens harvested from occipital lobe in frontal di-
rection . . . . . . . . . . . . . . . . . . . . . . . . . . . . 87A.2.7 Specimens harvested from parietal lobe in frontal direction 88A.2.8 Specimens harvested from parietal lobe in sagittal di-
rection . . . . . . . . . . . . . . . . . . . . . . . . . . . . 90A.2.9 Specimens harvested from thalamus in sagittal direction 92A.2.10 Specimens harvested from thalamus in frontal direction 93
B Additional results about Ogden curves 95B.1 Introduction . . . . . . . . . . . . . . . . . . . . . . . . . . . . . 95B.2 The Ogden theory . . . . . . . . . . . . . . . . . . . . . . . . . 95

Contents 7
C Additional results about Mullins curves 107C.1 Introduction . . . . . . . . . . . . . . . . . . . . . . . . . . . . . 107C.2 Mullins effect . . . . . . . . . . . . . . . . . . . . . . . . . . . . 107
D Additional results on fracture process 111D.1 Introduction . . . . . . . . . . . . . . . . . . . . . . . . . . . . . 111D.2 Damage evolution and fracture process . . . . . . . . . . . . . . 111
Bibliography 115

8 Contents
Chapter 1
Introduction
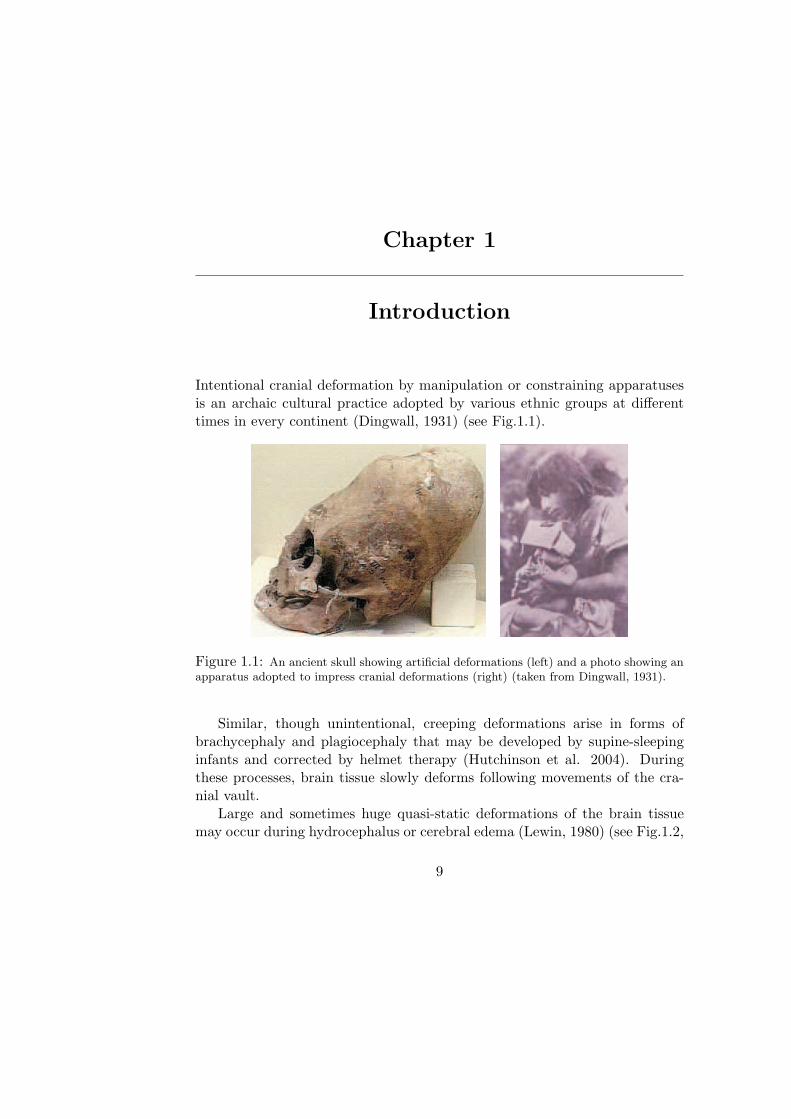
Intentional cranial deformation by manipulation or constraining apparatusesis an archaic cultural practice adopted by various ethnic groups at differenttimes in every continent (Dingwall, 1931) (see Fig.1.1).
Figure 1.1: An ancient skull showing artificial deformations (left) and a photo showing anapparatus adopted to impress cranial deformations (right) (taken from Dingwall, 1931).
Similar, though unintentional, creeping deformations arise in forms ofbrachycephaly and plagiocephaly that may be developed by supine-sleepinginfants and corrected by helmet therapy (Hutchinson et al. 2004). Duringthese processes, brain tissue slowly deforms following movements of the cra-nial vault.
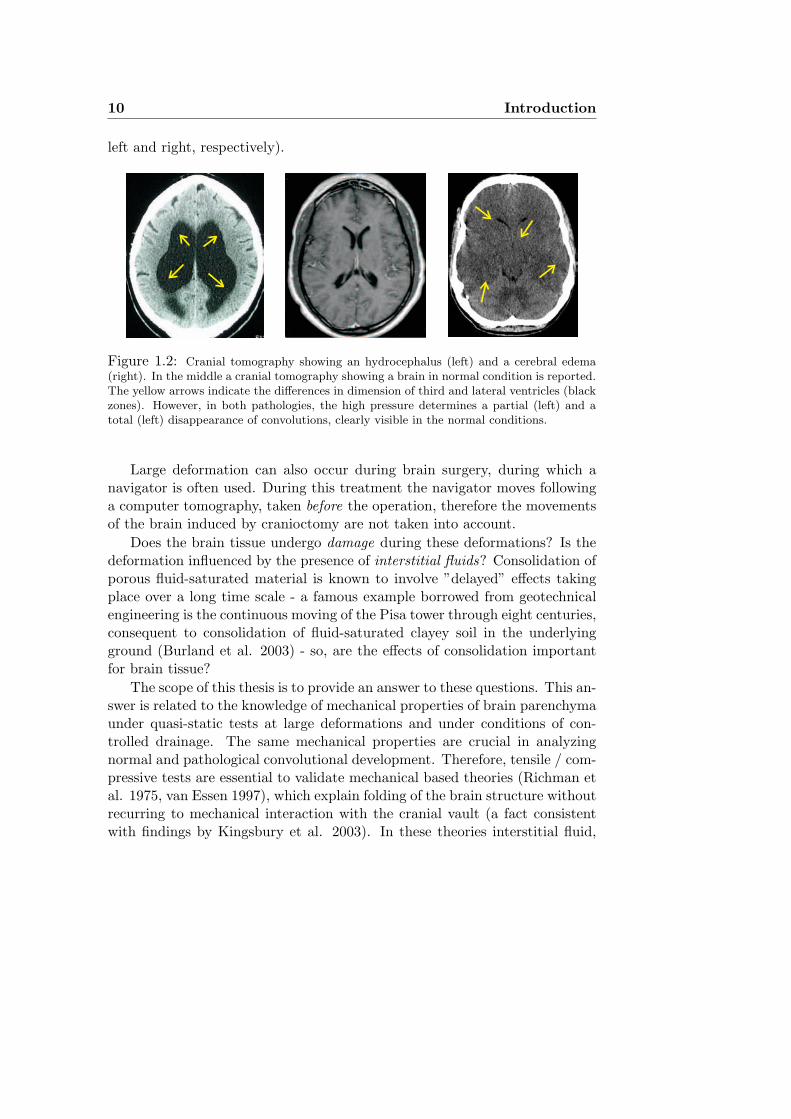
Large and sometimes huge quasi-static deformations of the brain tissuemay occur during hydrocephalus or cerebral edema (Lewin, 1980) (see Fig.1.2,
9
10 Introduction
left and right, respectively).
Figure 1.2: Cranial tomography showing an hydrocephalus (left) and a cerebral edema(right). In the middle a cranial tomography showing a brain in normal condition is reported.The yellow arrows indicate the differences in dimension of third and lateral ventricles (blackzones). However, in both pathologies, the high pressure determines a partial (left) and atotal (left) disappearance of convolutions, clearly visible in the normal conditions.
Large deformation can also occur during brain surgery, during which anavigator is often used. During this treatment the navigator moves followinga computer tomography, taken before the operation, therefore the movementsof the brain induced by cranioctomy are not taken into account.
Does the brain tissue undergo damage during these deformations? Is thedeformation influenced by the presence of interstitial fluids? Consolidation ofporous fluid-saturated material is known to involve ”delayed” effects takingplace over a long time scale - a famous example borrowed from geotechnicalengineering is the continuous moving of the Pisa tower through eight centuries,consequent to consolidation of fluid-saturated clayey soil in the underlyingground (Burland et al. 2003) - so, are the effects of consolidation importantfor brain tissue?
The scope of this thesis is to provide an answer to these questions. This an-swer is related to the knowledge of mechanical properties of brain parenchymaunder quasi-static tests at large deformations and under conditions of con-trolled drainage. The same mechanical properties are crucial in analyzingnormal and pathological convolutional development. Therefore, tensile / com-pressive tests are essential to validate mechanical based theories (Richman etal. 1975, van Essen 1997), which explain folding of the brain structure withoutrecurring to mechanical interaction with the cranial vault (a fact consistentwith findings by Kingsbury et al. 2003). In these theories interstitial fluid,
11
although believed of fundamental relevance in different situations involvingbrain deformation, for instance hydrocepalus (Hakim et al. 1976) does notplay a role. We will see that this can be justified on the basis of the resultsthat will be presented.
Motivated mainly by the modelling of traumatic brain injury, which of-ten occurs under dynamic conditions, efforts have been made to measure themechanical properties of brain tissue, starting from the pioneering works ofFallenstein et al.(1969) and Galford and McElhaney (1969), but the situationremains rather unsatisfactory (see 3 for a review). In particular, it is a matterof debate whether brain tissue should be regarded as a highly viscous gel oras a solid or as a fluid-saturated solid; if it is a compressible material or if itis only capable of isochoric deformation; if it can be modelled using the linearor the nonlinear theory of elasticity with or without anisotropy; if it exhibitsviscoelastic behavior or if it exhibits permanent deformations. Mechanicalsimulations have been performed by employing each of the above-mentionedmodel assumptions, see, for example, the recent review by Kyriacou et al.(2002). Moreover, the quasi-static behavior up to failure did not receive sub-stantial attention and the role of interstitial fluid, although believed to beimportant, has never been experimentally discriminated from other factorspossibly playing similar roles, such as viscosity.
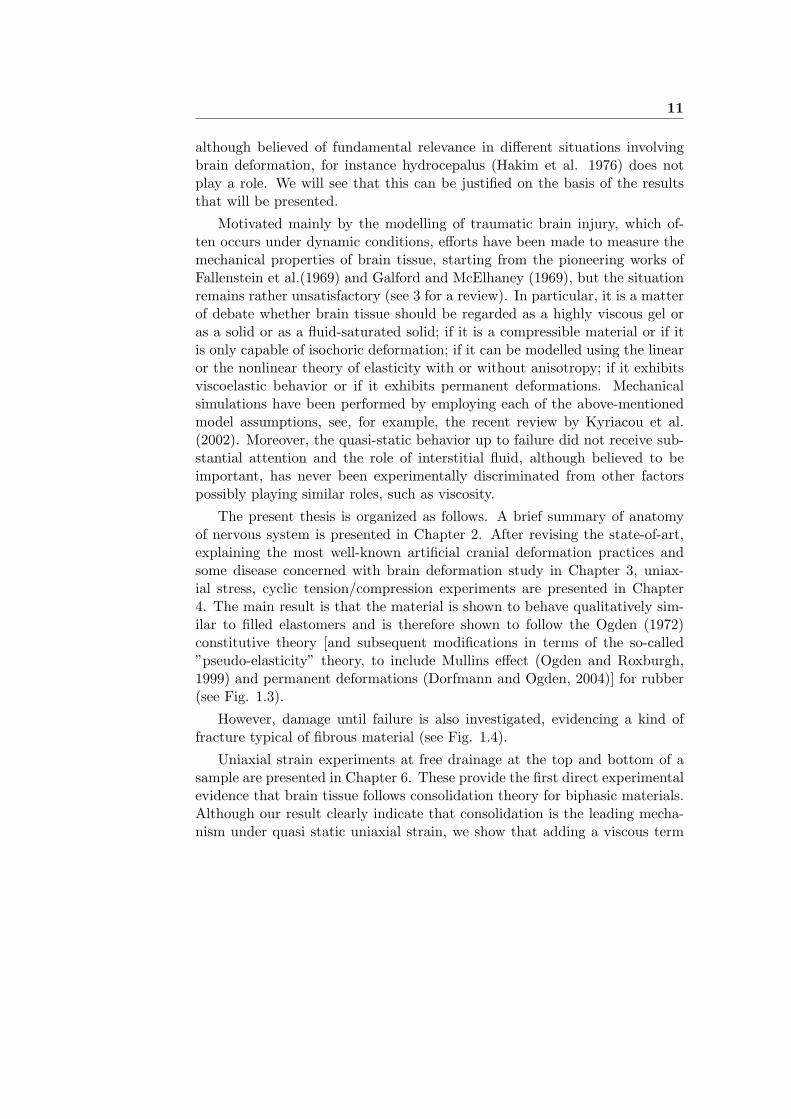
The present thesis is organized as follows. A brief summary of anatomyof nervous system is presented in Chapter 2. After revising the state-of-art,explaining the most well-known artificial cranial deformation practices andsome disease concerned with brain deformation study in Chapter 3, uniax-ial stress, cyclic tension/compression experiments are presented in Chapter4. The main result is that the material is shown to behave qualitatively sim-ilar to filled elastomers and is therefore shown to follow the Ogden (1972)constitutive theory [and subsequent modifications in terms of the so-called”pseudo-elasticity” theory, to include Mullins effect (Ogden and Roxburgh,1999) and permanent deformations (Dorfmann and Ogden, 2004)] for rubber(see Fig. 1.3).
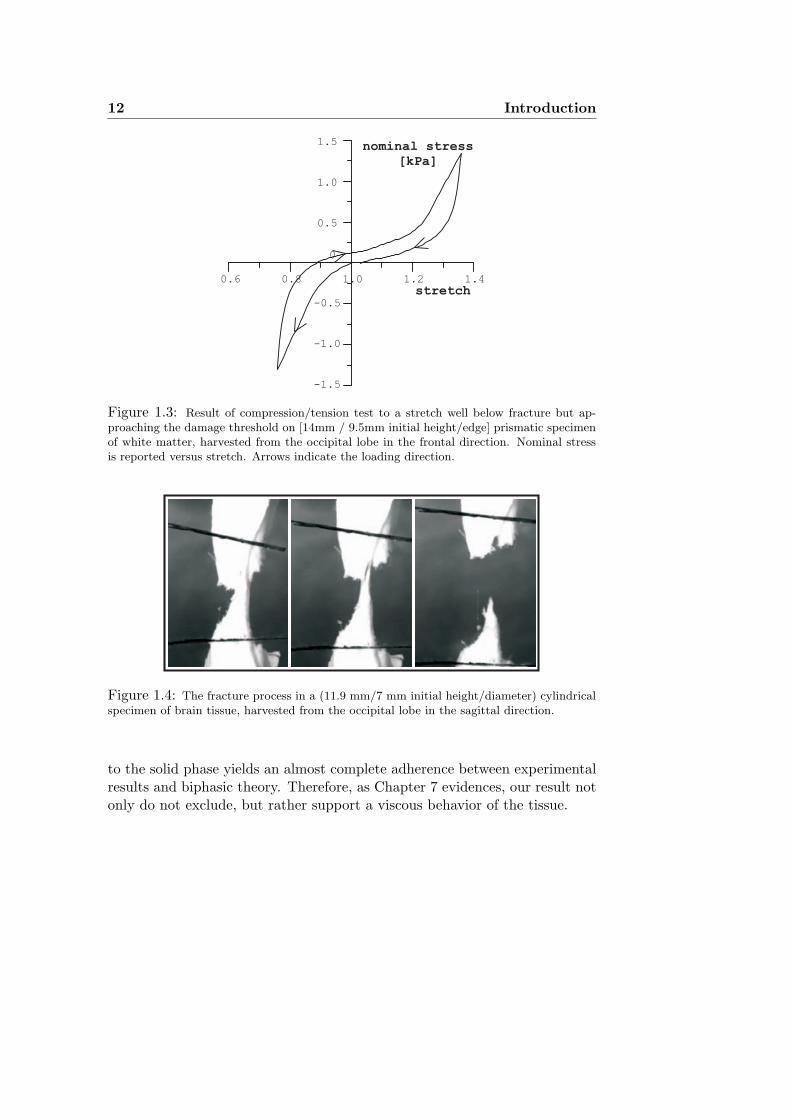
However, damage until failure is also investigated, evidencing a kind offracture typical of fibrous material (see Fig. 1.4).
Uniaxial strain experiments at free drainage at the top and bottom of asample are presented in Chapter 6. These provide the first direct experimentalevidence that brain tissue follows consolidation theory for biphasic materials.Although our result clearly indicate that consolidation is the leading mecha-nism under quasi static uniaxial strain, we show that adding a viscous term
12 Introduction
1.5
1.0
0.5
0
-0.5
-1.0
-1.5
0.6 0.8 1.0 1.2 1.4
nominal stress
[kPa]
stretch
Figure 1.3: Result of compression/tension test to a stretch well below fracture but ap-proaching the damage threshold on [14mm / 9.5mm initial height/edge] prismatic specimenof white matter, harvested from the occipital lobe in the frontal direction. Nominal stressis reported versus stretch. Arrows indicate the loading direction.
Figure 1.4: The fracture process in a (11.9 mm/7 mm initial height/diameter) cylindricalspecimen of brain tissue, harvested from the occipital lobe in the sagittal direction.
to the solid phase yields an almost complete adherence between experimentalresults and biphasic theory. Therefore, as Chapter 7 evidences, our result notonly do not exclude, but rather support a viscous behavior of the tissue.
Chapter 2
Anatomy
2.1 Introduction
This chapter is a brief summary of the head anatomy, starting with the Ner-vous System and focusing primarily on the brain anatomy. It is intended togive a basic description of brain from both a microscopic and a macroscopicpoint of view.
2.2 The Nervous System
The nervous system is the most complicated and the most highly organizedof the various systems which form the human body. It is responsible for theintegration and control of all the body’s functions and may be divided in twoparts: the central nervous system (CNS) and the peripheral nervous system.The former is associated with the functions of the special senses and with thevoluntary movements of the body and consists of all nervous tissue enclosedby bone, e.g. the brain and the spinal cord. The peripheral nervous systemconsists of all the nervous tissue not enclosed by bone and it enables the bodyto detect and respond to both internal and external stimuli.
2.3 The nerve cell
The Central Nervous System consists of the brain and spinal cord. At amicroscopic level, the CNS is primarily a network of two kinds of nervoustissue, white and gray. The white nervous tissue (white matter) consistsof axons, whereas the gray nervous tissue (gray matter) consists mainly of
13
14 Anatomy
nerve-cell bodies concentrated in locations on the surfaces of the brain anddeep within the brain.
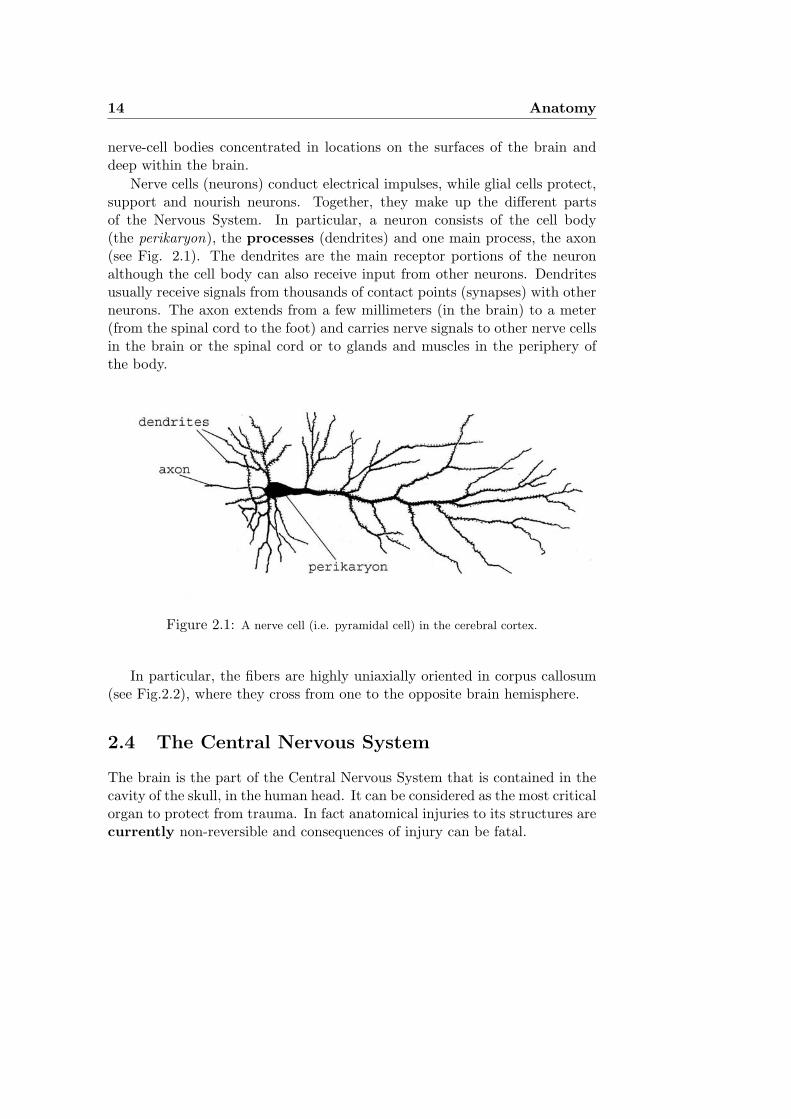
Nerve cells (neurons) conduct electrical impulses, while glial cells protect,support and nourish neurons. Together, they make up the different partsof the Nervous System. In particular, a neuron consists of the cell body(the perikaryon), the processes (dendrites) and one main process, the axon(see Fig. 2.1). The dendrites are the main receptor portions of the neuronalthough the cell body can also receive input from other neurons. Dendritesusually receive signals from thousands of contact points (synapses) with otherneurons. The axon extends from a few millimeters (in the brain) to a meter(from the spinal cord to the foot) and carries nerve signals to other nerve cellsin the brain or the spinal cord or to glands and muscles in the periphery ofthe body.
Figure 2.1: A nerve cell (i.e. pyramidal cell) in the cerebral cortex.
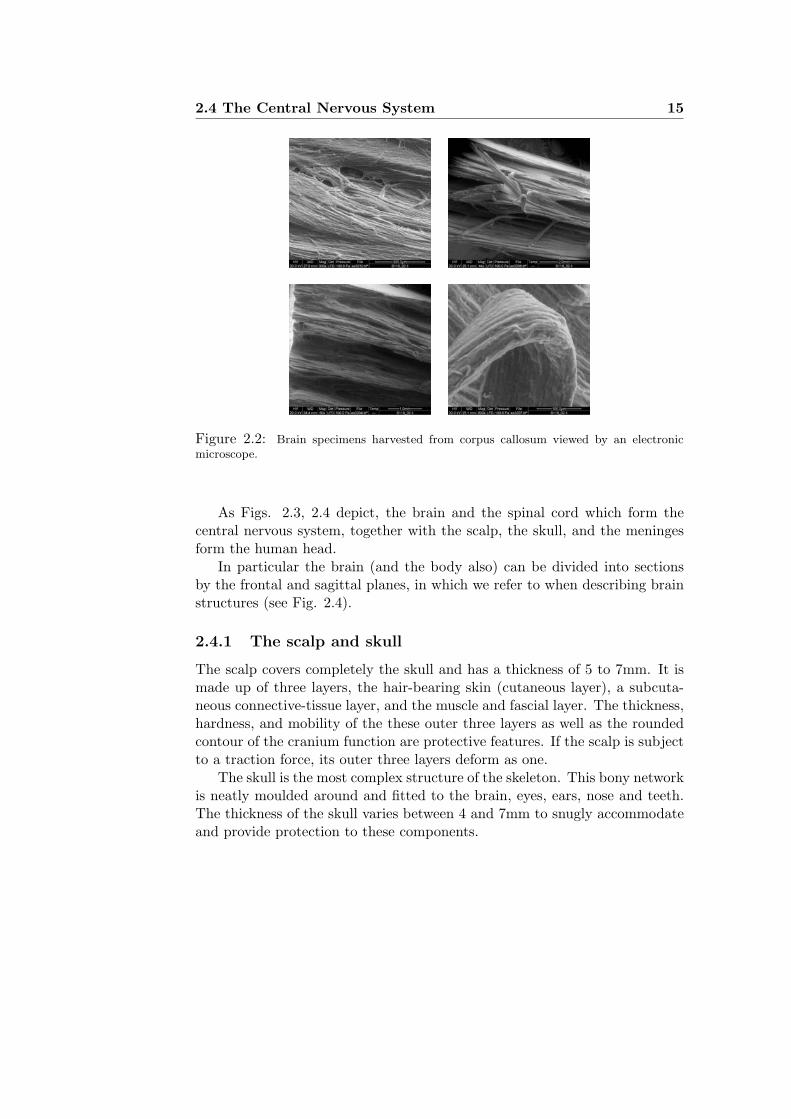
In particular, the fibers are highly uniaxially oriented in corpus callosum(see Fig.2.2), where they cross from one to the opposite brain hemisphere.
2.4 The Central Nervous System
The brain is the part of the Central Nervous System that is contained in thecavity of the skull, in the human head. It can be considered as the most criticalorgan to protect from trauma. In fact anatomical injuries to its structures arecurrently non-reversible and consequences of injury can be fatal.
2.4 The Central Nervous System 15
Figure 2.2: Brain specimens harvested from corpus callosum viewed by an electronicmicroscope.
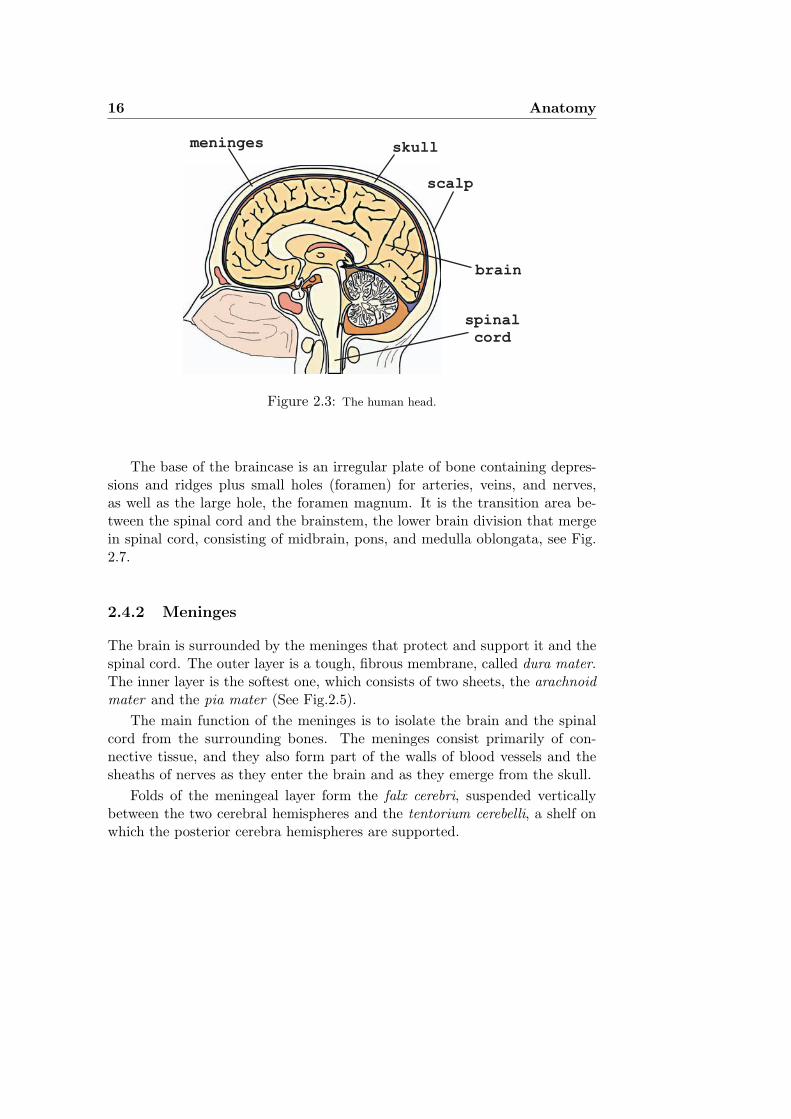
As Figs. 2.3, 2.4 depict, the brain and the spinal cord which form thecentral nervous system, together with the scalp, the skull, and the meningesform the human head.
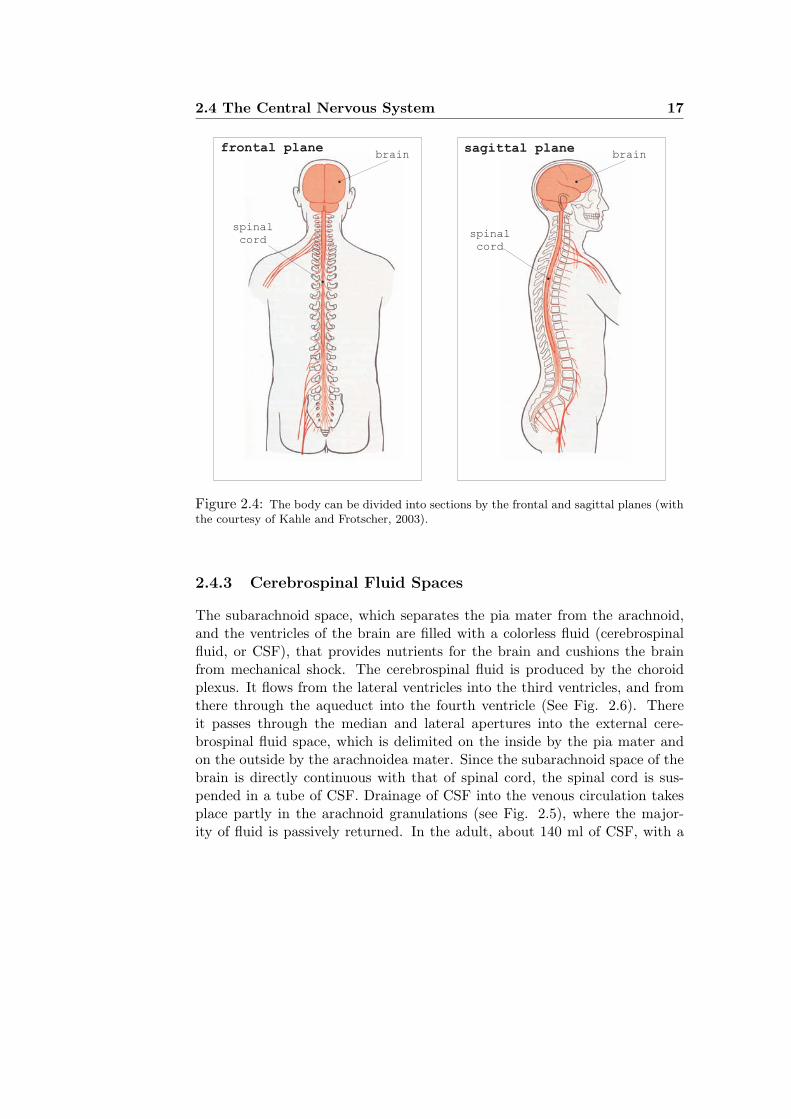
In particular the brain (and the body also) can be divided into sectionsby the frontal and sagittal planes, in which we refer to when describing brainstructures (see Fig. 2.4).
2.4.1 The scalp and skull
The scalp covers completely the skull and has a thickness of 5 to 7mm. It ismade up of three layers, the hair-bearing skin (cutaneous layer), a subcuta-neous connective-tissue layer, and the muscle and fascial layer. The thickness,hardness, and mobility of the these outer three layers as well as the roundedcontour of the cranium function are protective features. If the scalp is subjectto a traction force, its outer three layers deform as one.
The skull is the most complex structure of the skeleton. This bony networkis neatly moulded around and fitted to the brain, eyes, ears, nose and teeth.The thickness of the skull varies between 4 and 7mm to snugly accommodateand provide protection to these components.
16 Anatomy
skull
scalp
meninges
brain
spinal
cord
Figure 2.3: The human head.
The base of the braincase is an irregular plate of bone containing depres-sions and ridges plus small holes (foramen) for arteries, veins, and nerves,as well as the large hole, the foramen magnum. It is the transition area be-tween the spinal cord and the brainstem, the lower brain division that mergein spinal cord, consisting of midbrain, pons, and medulla oblongata, see Fig.2.7.
2.4.2 Meninges
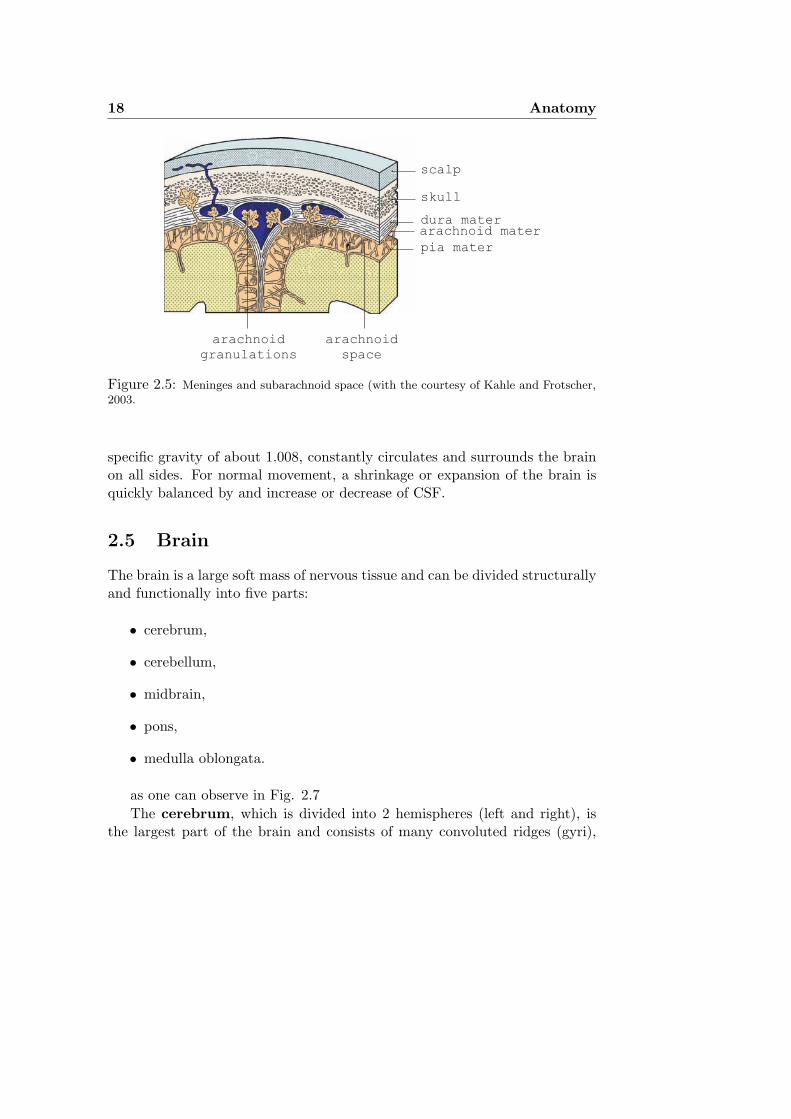
The brain is surrounded by the meninges that protect and support it and thespinal cord. The outer layer is a tough, fibrous membrane, called dura mater.The inner layer is the softest one, which consists of two sheets, the arachnoidmater and the pia mater (See Fig.2.5).
The main function of the meninges is to isolate the brain and the spinalcord from the surrounding bones. The meninges consist primarily of con-nective tissue, and they also form part of the walls of blood vessels and thesheaths of nerves as they enter the brain and as they emerge from the skull.
Folds of the meningeal layer form the falx cerebri, suspended verticallybetween the two cerebral hemispheres and the tentorium cerebelli, a shelf onwhich the posterior cerebra hemispheres are supported.
2.4 The Central Nervous System 17
frontal plane sagittal planebrain
spinal
cord
brain
spinal
cord
Figure 2.4: The body can be divided into sections by the frontal and sagittal planes (withthe courtesy of Kahle and Frotscher, 2003).
2.4.3 Cerebrospinal Fluid Spaces
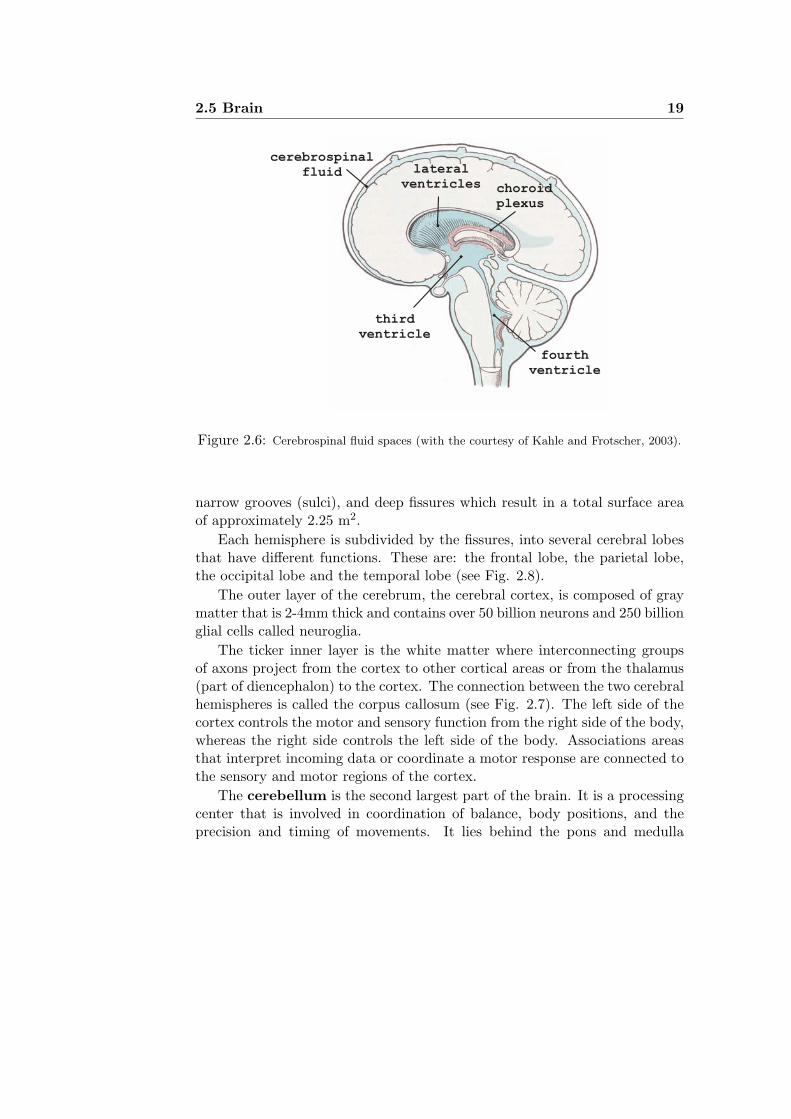
The subarachnoid space, which separates the pia mater from the arachnoid,and the ventricles of the brain are filled with a colorless fluid (cerebrospinalfluid, or CSF), that provides nutrients for the brain and cushions the brainfrom mechanical shock. The cerebrospinal fluid is produced by the choroidplexus. It flows from the lateral ventricles into the third ventricles, and fromthere through the aqueduct into the fourth ventricle (See Fig. 2.6). Thereit passes through the median and lateral apertures into the external cere-brospinal fluid space, which is delimited on the inside by the pia mater andon the outside by the arachnoidea mater. Since the subarachnoid space of thebrain is directly continuous with that of spinal cord, the spinal cord is sus-pended in a tube of CSF. Drainage of CSF into the venous circulation takesplace partly in the arachnoid granulations (see Fig. 2.5), where the major-ity of fluid is passively returned. In the adult, about 140 ml of CSF, with a
18 Anatomy
scalp
skull
dura materarachnoid mater
pia mater
arachnoid
space
arachnoid
granulations
Figure 2.5: Meninges and subarachnoid space (with the courtesy of Kahle and Frotscher,2003.
specific gravity of about 1.008, constantly circulates and surrounds the brainon all sides. For normal movement, a shrinkage or expansion of the brain isquickly balanced by and increase or decrease of CSF.
2.5 Brain
The brain is a large soft mass of nervous tissue and can be divided structurallyand functionally into five parts:
• cerebrum,
• cerebellum,
• midbrain,
• pons,
• medulla oblongata.
as one can observe in Fig. 2.7The cerebrum, which is divided into 2 hemispheres (left and right), is
the largest part of the brain and consists of many convoluted ridges (gyri),
2.5 Brain 19
lateral
ventricles
third
ventricle
fourth
ventricle
cerebrospinal
fluid
choroid
plexus
Figure 2.6: Cerebrospinal fluid spaces (with the courtesy of Kahle and Frotscher, 2003).
narrow grooves (sulci), and deep fissures which result in a total surface areaof approximately 2.25 m2.
Each hemisphere is subdivided by the fissures, into several cerebral lobesthat have different functions. These are: the frontal lobe, the parietal lobe,the occipital lobe and the temporal lobe (see Fig. 2.8).
The outer layer of the cerebrum, the cerebral cortex, is composed of graymatter that is 2-4mm thick and contains over 50 billion neurons and 250 billionglial cells called neuroglia.
The ticker inner layer is the white matter where interconnecting groupsof axons project from the cortex to other cortical areas or from the thalamus(part of diencephalon) to the cortex. The connection between the two cerebralhemispheres is called the corpus callosum (see Fig. 2.7). The left side of thecortex controls the motor and sensory function from the right side of the body,whereas the right side controls the left side of the body. Associations areasthat interpret incoming data or coordinate a motor response are connected tothe sensory and motor regions of the cortex.
The cerebellum is the second largest part of the brain. It is a processingcenter that is involved in coordination of balance, body positions, and theprecision and timing of movements. It lies behind the pons and medulla

20 Anatomy
cerebellum
third ventricle
corpus callosum
cerebrum
midbrain
pons
medulla oblongata
thalamus
choroid plexus
Figure 2.7: Longitudinal median section through the brain (with the courtesy of Kahleand Frotscher, 2003).
frontal lobeparietal lobe
occipital lobe
temporal lobe
Figure 2.8: Lateral view of the hemisphere (with the courtesy of Kahle and Frotscher,2003).
2.6 Development of the brain 21
oblongata. The superior surface is covered by the cerebrum, separated by afold of dura mater, called the tentorium cerebelli. Cerebellum surface is notconvoluted like that of the cerebrum, but it is traversed by numerous curvedsulci, which vary in depth at different parts. Like in the cerebral hemispheres,the outer cortex is made up of gray matter while the inner surface consists ofwhite matter.
The midbrain, connecting the cerebral hemispheres above the pons, alsocontains gray matter. Within the midbrain, a narrow canal (cerebral aque-duct) connects the third and the fourth ventricles.
The pons is situated below the midbrain, in front of cerebellum and abovethe medulla oblongata. It consists of white matter nerve fibers connecting thecerebellar hemispheres. Some small nuclei of gray matter lie deep within thesuperficial portion.
The medulla oblongata, which connects the pons above and the spinalcord below, is the lowermost portion of the brain stem.
2.6 Development of the brain
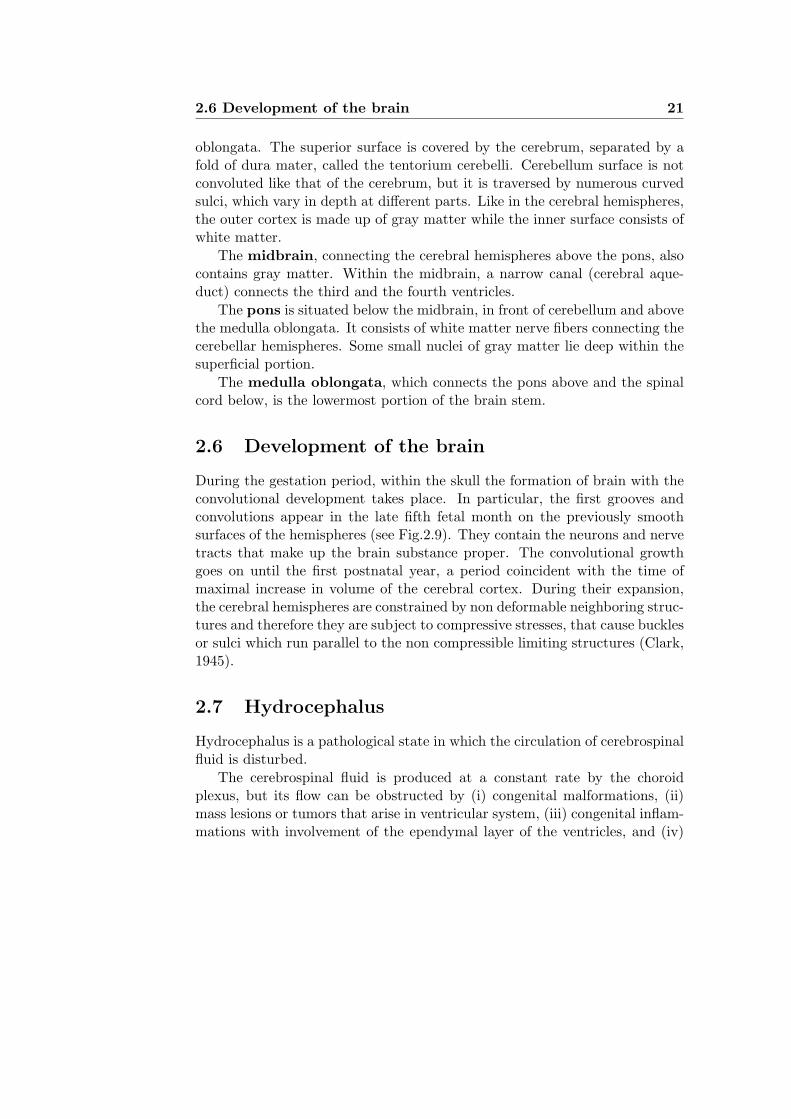
During the gestation period, within the skull the formation of brain with theconvolutional development takes place. In particular, the first grooves andconvolutions appear in the late fifth fetal month on the previously smoothsurfaces of the hemispheres (see Fig.2.9). They contain the neurons and nervetracts that make up the brain substance proper. The convolutional growthgoes on until the first postnatal year, a period coincident with the time ofmaximal increase in volume of the cerebral cortex. During their expansion,the cerebral hemispheres are constrained by non deformable neighboring struc-tures and therefore they are subject to compressive stresses, that cause bucklesor sulci which run parallel to the non compressible limiting structures (Clark,1945).
2.7 Hydrocephalus
Hydrocephalus is a pathological state in which the circulation of cerebrospinalfluid is disturbed.
The cerebrospinal fluid is produced at a constant rate by the choroidplexus, but its flow can be obstructed by (i) congenital malformations, (ii)mass lesions or tumors that arise in ventricular system, (iii) congenital inflam-mations with involvement of the ependymal layer of the ventricles, and (iv)
22 Anatomy
40 days third month
sixth monthforth month
E
F
A
C
B
D
E
F
A
C
B
D
E
F
A
C
B
D
E
F
A
D
Figure 2.9: The brain in human embryos of different ages (with the courtesy of Kahleand Frotscher, 2003). Gestational growth of cerebral hemispheres (A), diencephalon (B),midbrain (C), cerebellum (D), pons (E) and medulla oblongata (F), is shown.
perinatal ventricular hemorrhages. In other cases, we have (v) an imbalancebetween CSF production and absorbtion (production exceeding absorption).
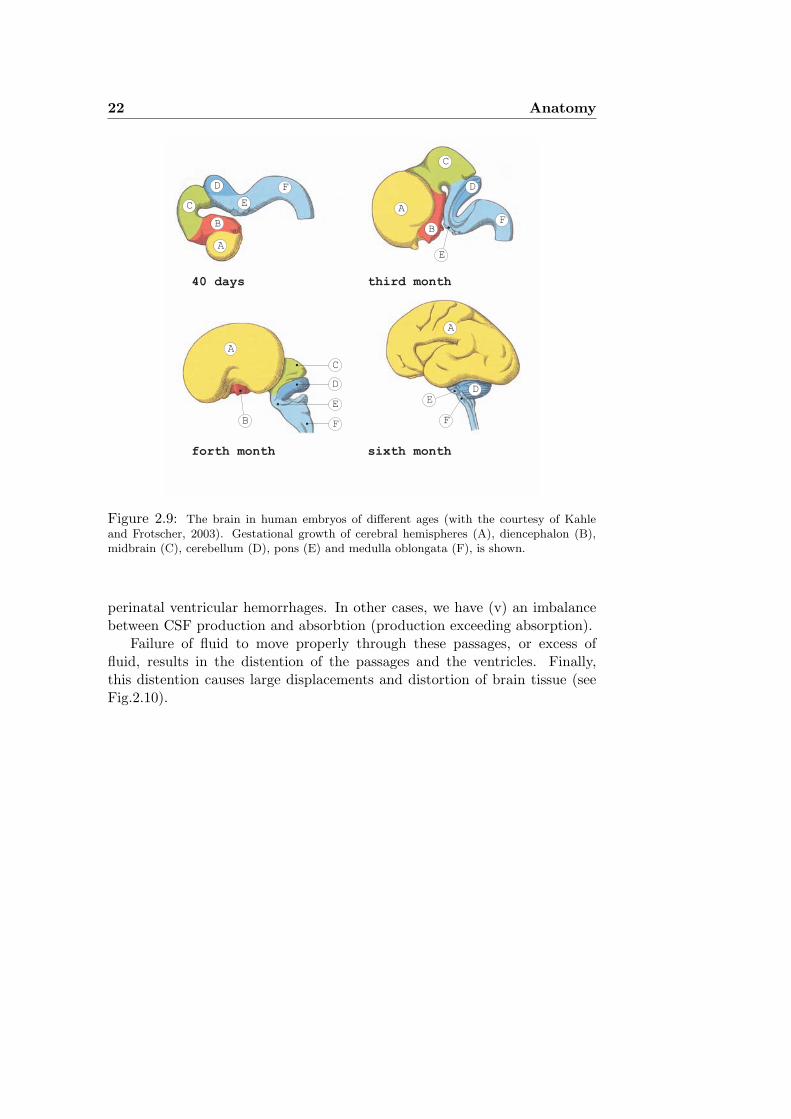
Failure of fluid to move properly through these passages, or excess offluid, results in the distention of the passages and the ventricles. Finally,this distention causes large displacements and distortion of brain tissue (seeFig.2.10).
2.8 Cerebral edema 23
Figure 2.10: CT (Computed Tomography) of brain showing three different cases of severehydrocephalus.
2.8 Cerebral edema
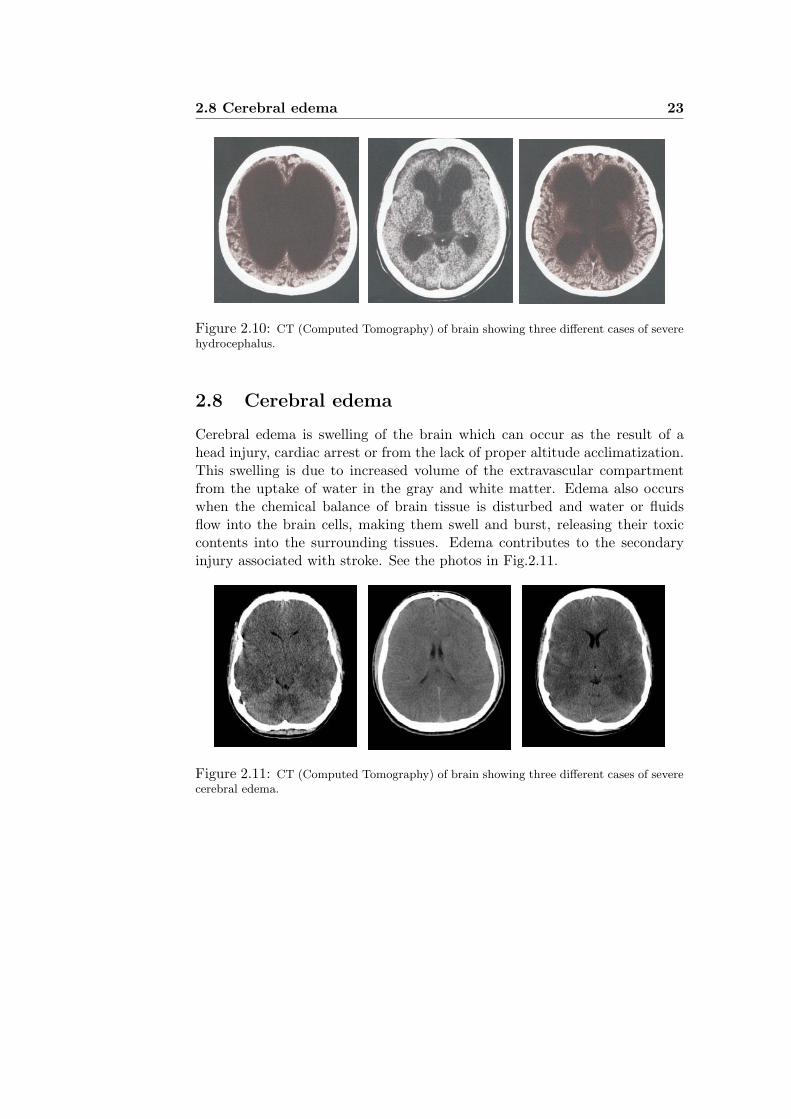
Cerebral edema is swelling of the brain which can occur as the result of ahead injury, cardiac arrest or from the lack of proper altitude acclimatization.This swelling is due to increased volume of the extravascular compartmentfrom the uptake of water in the gray and white matter. Edema also occurswhen the chemical balance of brain tissue is disturbed and water or fluidsflow into the brain cells, making them swell and burst, releasing their toxiccontents into the surrounding tissues. Edema contributes to the secondaryinjury associated with stroke. See the photos in Fig.2.11.
Figure 2.11: CT (Computed Tomography) of brain showing three different cases of severecerebral edema.

24 Anatomy
Chapter 3
The State-of-the-art
3.1 Introduction
Within this chapter it is intended to give a review of the-state-of-art in lit-erature about brain mechanics, starting to explain some artificial intentionaland unintentional technics applied to obtain cranial deformation.
3.2 Artificial and intentional cranial deformations
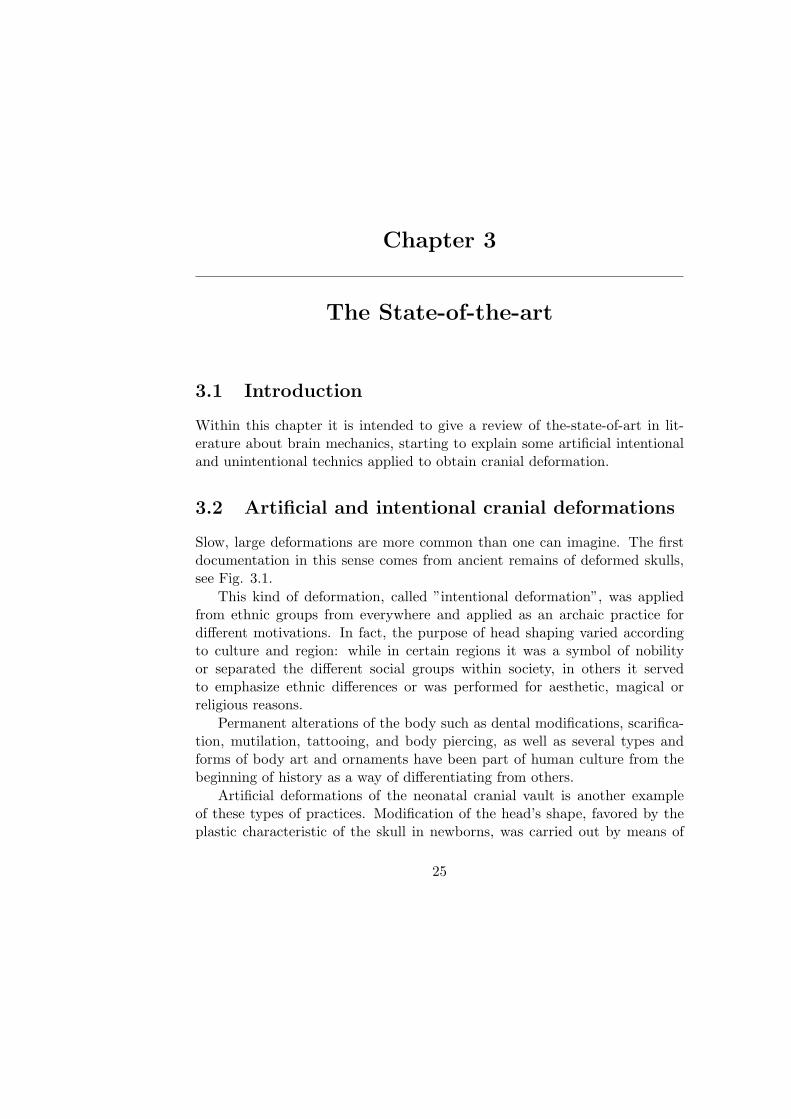
Slow, large deformations are more common than one can imagine. The firstdocumentation in this sense comes from ancient remains of deformed skulls,see Fig. 3.1.
This kind of deformation, called ”intentional deformation”, was appliedfrom ethnic groups from everywhere and applied as an archaic practice fordifferent motivations. In fact, the purpose of head shaping varied accordingto culture and region: while in certain regions it was a symbol of nobilityor separated the different social groups within society, in others it servedto emphasize ethnic differences or was performed for aesthetic, magical orreligious reasons.
Permanent alterations of the body such as dental modifications, scarifica-tion, mutilation, tattooing, and body piercing, as well as several types andforms of body art and ornaments have been part of human culture from thebeginning of history as a way of differentiating from others.
Artificial deformations of the neonatal cranial vault is another exampleof these types of practices. Modification of the head’s shape, favored by theplastic characteristic of the skull in newborns, was carried out by means of
25
26 The State-of-the-art
a) Akhenaten’s skull
(Cairo Museum)
b) The Medall skull
(Royal College of Surgeons)
Figure 3.1: Ancient discovered skulls showing traces of artificial deformations (Dingwall,1931).
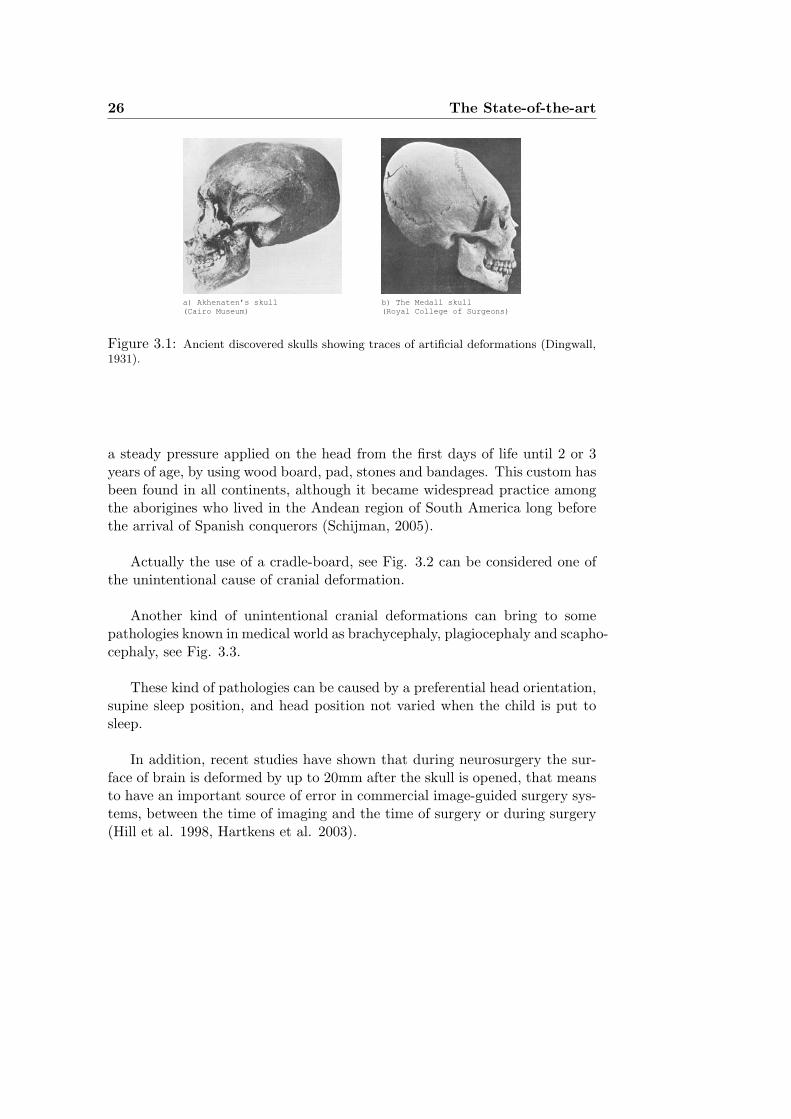
a steady pressure applied on the head from the first days of life until 2 or 3years of age, by using wood board, pad, stones and bandages. This custom hasbeen found in all continents, although it became widespread practice amongthe aborigines who lived in the Andean region of South America long beforethe arrival of Spanish conquerors (Schijman, 2005).
Actually the use of a cradle-board, see Fig. 3.2 can be considered one ofthe unintentional cause of cranial deformation.
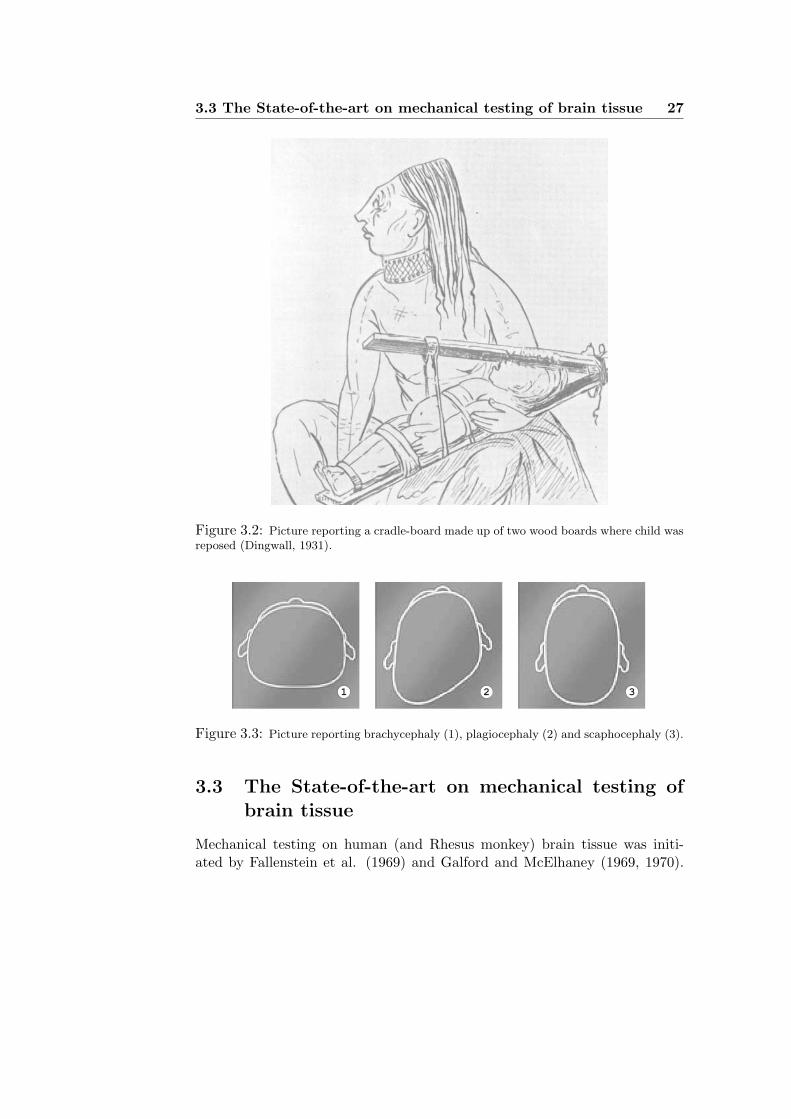
Another kind of unintentional cranial deformations can bring to somepathologies known in medical world as brachycephaly, plagiocephaly and scapho-cephaly, see Fig. 3.3.
These kind of pathologies can be caused by a preferential head orientation,supine sleep position, and head position not varied when the child is put tosleep.
In addition, recent studies have shown that during neurosurgery the sur-face of brain is deformed by up to 20mm after the skull is opened, that meansto have an important source of error in commercial image-guided surgery sys-tems, between the time of imaging and the time of surgery or during surgery(Hill et al. 1998, Hartkens et al. 2003).
3.3 The State-of-the-art on mechanical testing of brain tissue 27
Figure 3.2: Picture reporting a cradle-board made up of two wood boards where child wasreposed (Dingwall, 1931).
1 2 3
Figure 3.3: Picture reporting brachycephaly (1), plagiocephaly (2) and scaphocephaly (3).
3.3 The State-of-the-art on mechanical testing ofbrain tissue
Mechanical testing on human (and Rhesus monkey) brain tissue was initi-ated by Fallenstein et al. (1969) and Galford and McElhaney (1969, 1970).
28 The State-of-the-art
Cyclic shear tests have been performed by the former authors, while creepand relaxation experiments have been conducted under tension by the latter.Both these works refer to a small deformation range and are aimed at the un-derstanding of dynamic properties, as related to traumatic brain injury (seethe reviews by Hardy et al. (1994) and Goldsmith (2001)). These pioneer-ing works stimulated a continued research in which the brain parenchyma isassumed to be single-phase, incompressible and viscoelastic. In particular,oscillatory tests on porcine, bovine and rat brain specimens at small strainwere performed by: Shuck and Advani (1972), proposing a failure criterion forbrain tissue, Bilston et al. (1997) and Darvish and Crandall (2001), findingnonlinear effects already at, respectively, 0.1% and 1% strain, Arbogast andMargulies (1998), analyzing high frequency response, Thibault and Margulies(1998) and Gefen et al. (2003), determining some age-dependent changesin mechanical properties. Large deformations, involving in particular uniax-ial compression, were initiated by Estes and McElhaney (1970), who foundthe characteristic stress/strain curves concave upward for human and Rhesusmonkey brain tissues. These experiments were followed by other investiga-tions, mainly performed on porcine or bovine specimens and involving largestrains, in particular, by Miller and Chinzei (1997), performing compressivestress/relaxation experiments and showing a strong dependence on strain rate,Donnelly and Medige (1997), presenting results which support nonlinear vis-coelasticity, obtained with a single-pulse, high-strain-rate shear test on freshhuman cadaver brain specimens, Bilston et al. (2001), reporting failure strainsunder large shear deformation, Prange and Margulies (2002), presenting re-sults of shear and compression tests with stretches ranging between 0.5 and1.6. Miller et al. (2000) and Gefen and Margulies (2004) have compared invivo and in vitro responses to mechanical tests on porcine brain. The formerauthors have found (as already suggested by Metz et al., 1970) that in vivoand in vitro mechanical properties remain within the same order of magnitude,while the latter authors have reached an opposite conclusion.
3.4 Slow deformation of brain tissue calls for exper-imental investigation
It is crucial to observe from the above state-of-the-art that: (i) a linear (orsometime nonlinear) viscoelastic behaviour is always assumed to govern me-chanical deformation of the brain; (ii) a systematic investigation of large-strain, quasi-static, cyclic behaviour including damage and fracture of human
3.4 Slow deformation of brain tissue calls for experimentalinvestigation 29
brain tissue still does not exist; (iii) the effect of interstitial fluid has neverbeen directly investigated and (iv) never discriminated from viscosity. Hakimand co-workers present a series of data supporting a two-phase theory forbrain parenchyma and emphasise the role of interstitial fluids on mechanicsof brain tissue during hydrocephalus (Hakim and Adams 1965; Hakim andBurton 1974; Hakim et al. 1976; Hakim and Hakim 1984; Hakim et al. 2001).We believe that there are many physiological instances pointing to biphasicrepresentation. For instance, the effects of perfusion exhibited by Guillaumeet al. (1997), the volumetric shrinking of the brain tissue following hyperos-motic drugs administration (such as mannitol, Bell et al. 1987; Schrot andMuizelaar, 2002), and the nature of cerebral edema itself show that the hy-drated nature of brain parenchyma cannot be ignored. Surprisingly, no directexperimental evidence has been attempted to give evidence to the two-phasicnature of brain parenchyma. Large, slow brain deformations are believed toplay a crucial role during hydrocephalus, cerebral edema, convolutional devel-opment, and possibly in many other circumstances that may include roboticsurgery and implantation. In geotechnical engineering, the understanding ofthe mechanical role of interstitial fluid in soils, which essentially follow the the-ories by Terzaghi (1943) and Biot (1941), generated a real scientific revolution(de Boer, 1999). Accordingly, the experimental investigation of the behaviourof brain tissue subject to slow and large deformations, with consideration ofinterstitial fluid, deserves appropriate attention.
30 The State-of-the-art
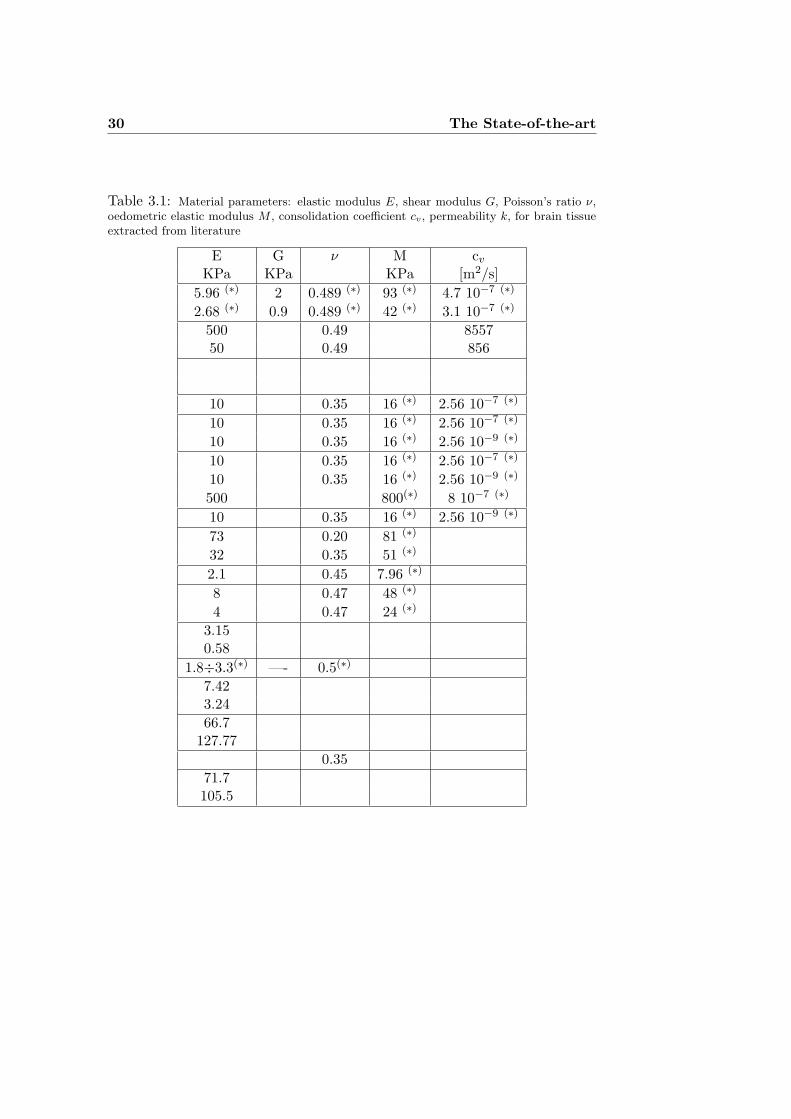
Table 3.1: Material parameters: elastic modulus E, shear modulus G, Poisson’s ratio ν,oedometric elastic modulus M , consolidation coefficient cv, permeability k, for brain tissueextracted from literature
E G ν M cv
KPa KPa KPa [m2/s]5.96 (∗) 2 0.489 (∗) 93 (∗) 4.7 10−7 (∗)
2.68 (∗) 0.9 0.489 (∗) 42 (∗) 3.1 10−7 (∗)
500 0.49 855750 0.49 856
10 0.35 16 (∗) 2.56 10−7 (∗)
10 0.35 16 (∗) 2.56 10−7 (∗)
10 0.35 16 (∗) 2.56 10−9 (∗)
10 0.35 16 (∗) 2.56 10−7 (∗)
10 0.35 16 (∗) 2.56 10−9 (∗)
500 800(∗) 8 10−7 (∗)
10 0.35 16 (∗) 2.56 10−9 (∗)
73 0.20 81 (∗)
32 0.35 51 (∗)
2.1 0.45 7.96 (∗)
8 0.47 48 (∗)
4 0.47 24 (∗)
3.150.58
1.8÷3.3(∗) —- 0.5(∗)
7.423.2466.7
127.770.35
71.7105.5
3.4 Slow deformation of brain tissue calls for experimentalinvestigation 31
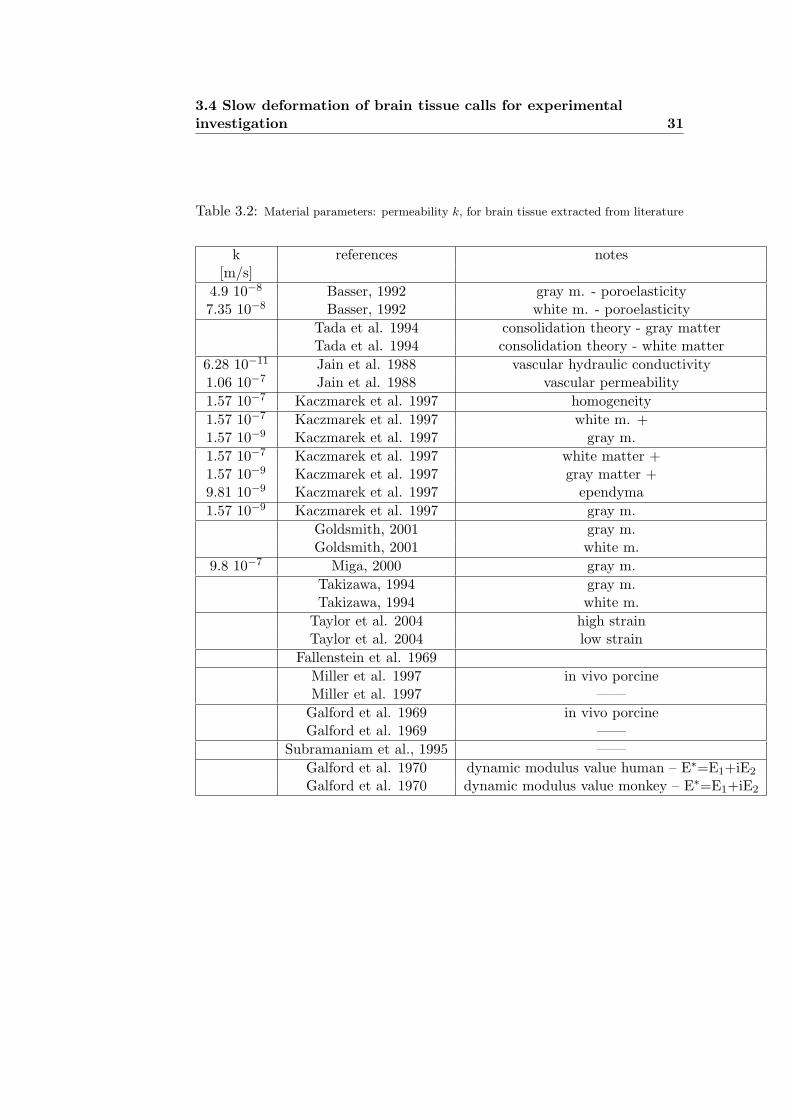
Table 3.2: Material parameters: permeability k, for brain tissue extracted from literature
k references notes[m/s]
4.9 10−8 Basser, 1992 gray m. - poroelasticity7.35 10−8 Basser, 1992 white m. - poroelasticity
Tada et al. 1994 consolidation theory - gray matterTada et al. 1994 consolidation theory - white matter
6.28 10−11 Jain et al. 1988 vascular hydraulic conductivity1.06 10−7 Jain et al. 1988 vascular permeability1.57 10−7 Kaczmarek et al. 1997 homogeneity1.57 10−7 Kaczmarek et al. 1997 white m. +1.57 10−9 Kaczmarek et al. 1997 gray m.1.57 10−7 Kaczmarek et al. 1997 white matter +1.57 10−9 Kaczmarek et al. 1997 gray matter +9.81 10−9 Kaczmarek et al. 1997 ependyma1.57 10−9 Kaczmarek et al. 1997 gray m.
Goldsmith, 2001 gray m.Goldsmith, 2001 white m.
9.8 10−7 Miga, 2000 gray m.Takizawa, 1994 gray m.Takizawa, 1994 white m.
Taylor et al. 2004 high strainTaylor et al. 2004 low strain
Fallenstein et al. 1969Miller et al. 1997 in vivo porcineMiller et al. 1997 ——
Galford et al. 1969 in vivo porcineGalford et al. 1969 ——
Subramaniam et al., 1995 ——Galford et al. 1970 dynamic modulus value human – E∗=E1+iE2
Galford et al. 1970 dynamic modulus value monkey – E∗=E1+iE2

32 The State-of-the-art

Chapter 4
Uniaxial cyclic tension/compression
experiments
4.1 Introduction
In this chapter a description of experimental set and experimental results arefurnished. After a deep description of testing device, several curves resultsare shown (additional results can be found in Appendix A) and finally acomparison with existing theories is given. One can observe that the Ogdennonlinear elastic theory of rubber (and its variants to include Mullins effectand permanent strain) has been found to describe with great accuracy allloading and unloading curves separately and taken in the whole cycles.
4.2 Uniaxial testing device
In order to answer the previous-mentioned issues (chapter 3), and to lay thefoundation for a physically-motivated mechanical model for slow, large de-formation of brain tissues, we have performed a systematic series of in vitroexperiments on human tissue excised during autopsy within 12 h of death(use of autopsy material from human subjects was approved by the EthicsCommittee, Medical University of Graz, Austria).
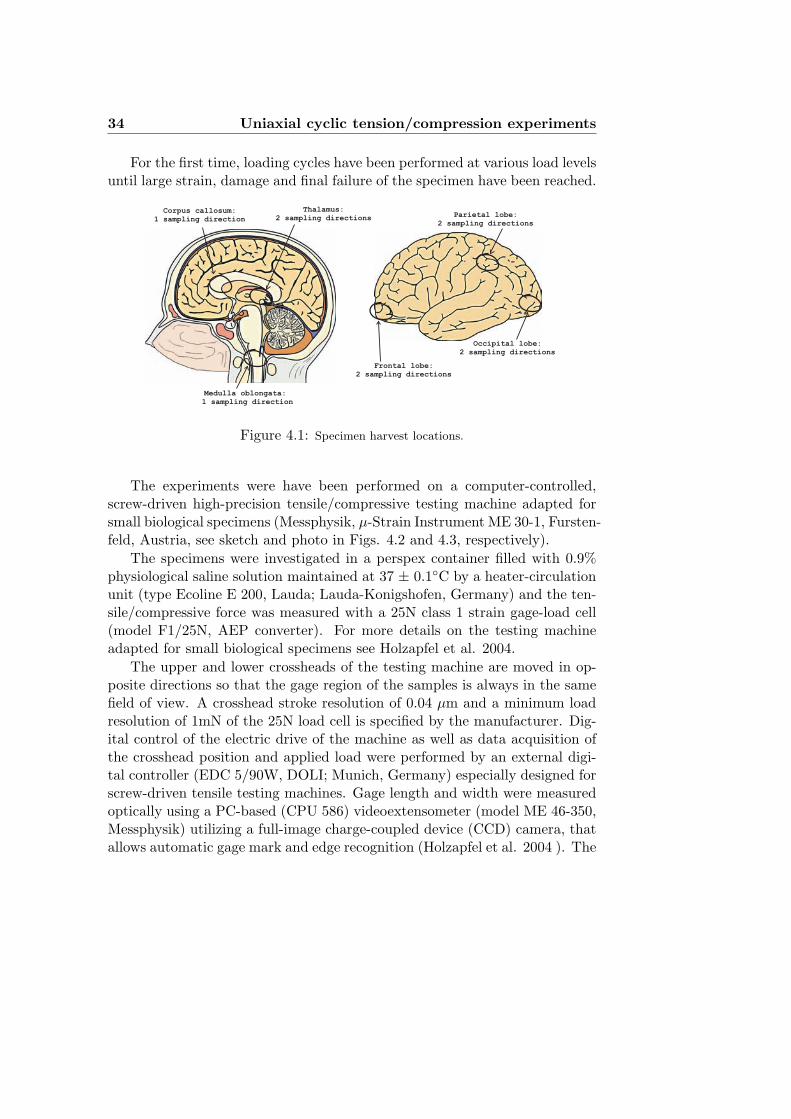
Uniaxial, quasi-static cyclic tension/compression (or compression/tension)test at a speed of 5 mm/min (corresponding to initial strain rates rangingbetween 5.5 and 9.3 10−3 s−1) were performed on 86 cylindrical and prismaticspecimens taken at different orientations and different locations within thebrain (see Fig. 4.1).
33
34 Uniaxial cyclic tension/compression experiments
For the first time, loading cycles have been performed at various load levelsuntil large strain, damage and final failure of the specimen have been reached.
Medulla oblongata:
1 sampling direction
Thalamus:
2 sampling directionsCorpus callosum:
1 sampling direction
Frontal lobe:
2 sampling directions
Parietal lobe:
2 sampling directions
Occipital lobe:
2 sampling directions
Figure 4.1: Specimen harvest locations.
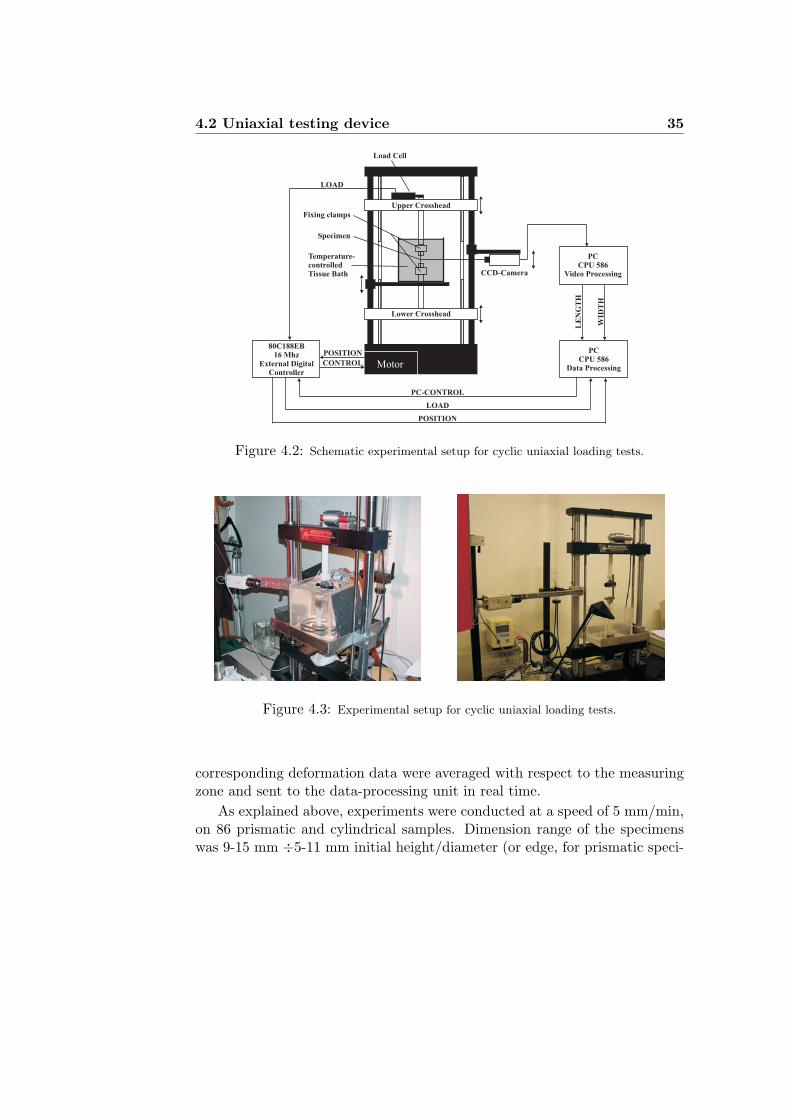
The experiments were have been performed on a computer-controlled,screw-driven high-precision tensile/compressive testing machine adapted forsmall biological specimens (Messphysik, µ-Strain Instrument ME 30-1, Fursten-feld, Austria, see sketch and photo in Figs. 4.2 and 4.3, respectively).
The specimens were investigated in a perspex container filled with 0.9%physiological saline solution maintained at 37 ± 0.1◦C by a heater-circulationunit (type Ecoline E 200, Lauda; Lauda-Konigshofen, Germany) and the ten-sile/compressive force was measured with a 25N class 1 strain gage-load cell(model F1/25N, AEP converter). For more details on the testing machineadapted for small biological specimens see Holzapfel et al. 2004.
The upper and lower crossheads of the testing machine are moved in op-posite directions so that the gage region of the samples is always in the samefield of view. A crosshead stroke resolution of 0.04 µm and a minimum loadresolution of 1mN of the 25N load cell is specified by the manufacturer. Dig-ital control of the electric drive of the machine as well as data acquisition ofthe crosshead position and applied load were performed by an external digi-tal controller (EDC 5/90W, DOLI; Munich, Germany) especially designed forscrew-driven tensile testing machines. Gage length and width were measuredoptically using a PC-based (CPU 586) videoextensometer (model ME 46-350,Messphysik) utilizing a full-image charge-coupled device (CCD) camera, thatallows automatic gage mark and edge recognition (Holzapfel et al. 2004 ). The
4.2 Uniaxial testing device 35
Motor
Load Cell
Specimen
Temperature-controlledTissue Bath
Fixing clamps
CCD-Camera
80C188EB16 Mhz
External DigitalController
POSITION
LOAD
PCCPU 586
Video Processing
PCCPU 586
Data Processing
LE
NG
TH
WID
TH
PC-CONTROL
LOAD
POSITION
CONTROL
Upper Crosshead
Lower Crosshead
Figure 4.2: Schematic experimental setup for cyclic uniaxial loading tests.
Figure 4.3: Experimental setup for cyclic uniaxial loading tests.
corresponding deformation data were averaged with respect to the measuringzone and sent to the data-processing unit in real time.
As explained above, experiments were conducted at a speed of 5 mm/min,on 86 prismatic and cylindrical samples. Dimension range of the specimenswas 9-15 mm ÷5-11 mm initial height/diameter (or edge, for prismatic speci-
36 Uniaxial cyclic tension/compression experiments
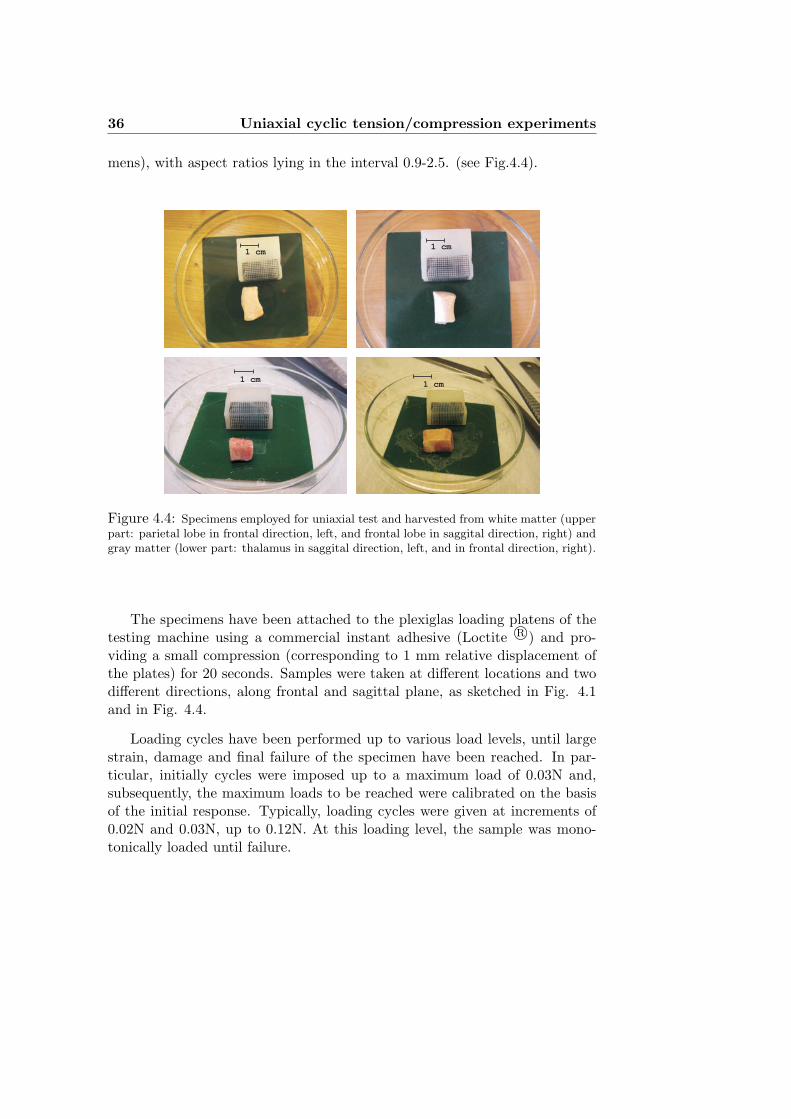
mens), with aspect ratios lying in the interval 0.9-2.5. (see Fig.4.4).
1 cm1 cm
1 cm1 cm
Figure 4.4: Specimens employed for uniaxial test and harvested from white matter (upperpart: parietal lobe in frontal direction, left, and frontal lobe in saggital direction, right) andgray matter (lower part: thalamus in saggital direction, left, and in frontal direction, right).
The specimens have been attached to the plexiglas loading platens of thetesting machine using a commercial instant adhesive (Loctite R©) and pro-viding a small compression (corresponding to 1 mm relative displacement ofthe plates) for 20 seconds. Samples were taken at different locations and twodifferent directions, along frontal and sagittal plane, as sketched in Fig. 4.1and in Fig. 4.4.
Loading cycles have been performed up to various load levels, until largestrain, damage and final failure of the specimen have been reached. In par-ticular, initially cycles were imposed up to a maximum load of 0.03N and,subsequently, the maximum loads to be reached were calibrated on the basisof the initial response. Typically, loading cycles were given at increments of0.02N and 0.03N, up to 0.12N. At this loading level, the sample was mono-tonically loaded until failure.
4.3 Uniaxial behavior 37
4.3 Uniaxial behavior
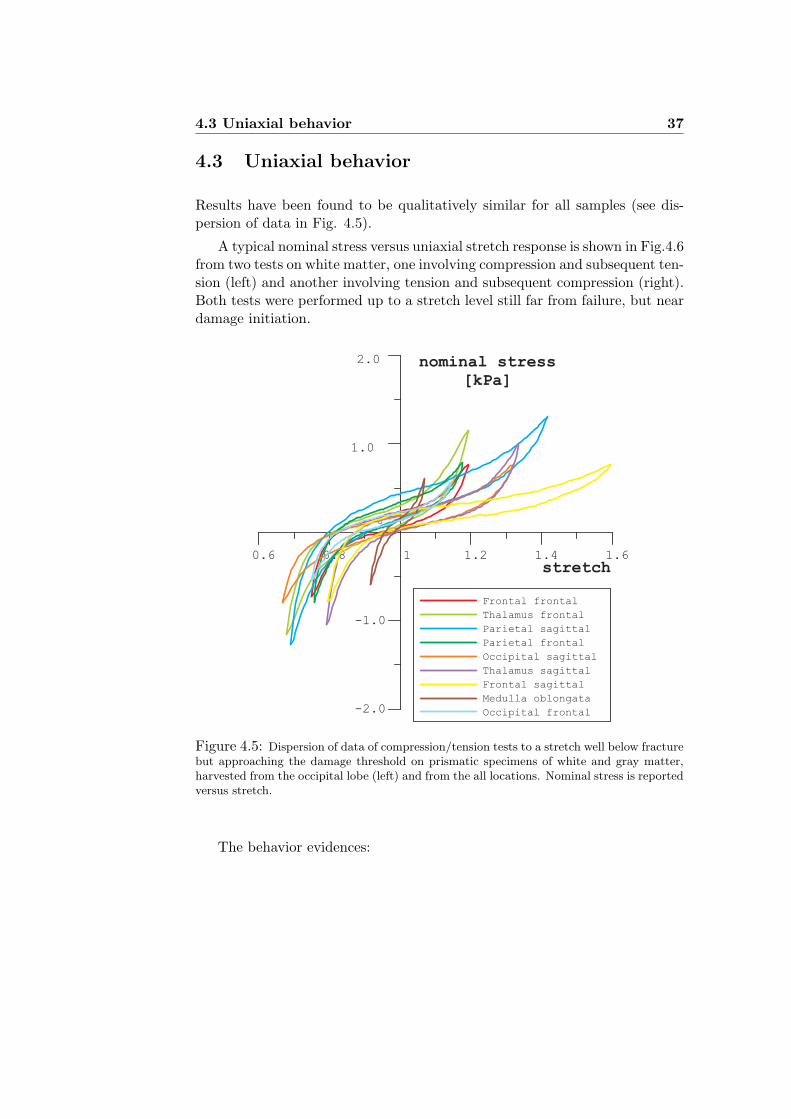
Results have been found to be qualitatively similar for all samples (see dis-persion of data in Fig. 4.5).
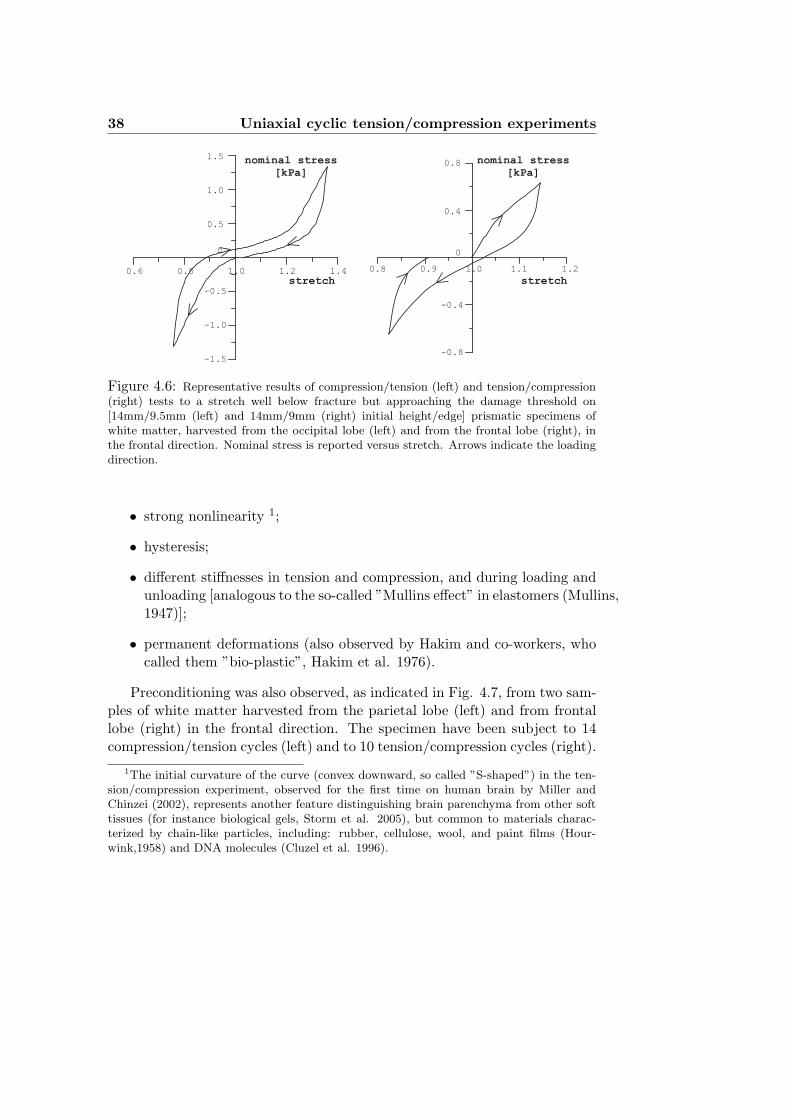
A typical nominal stress versus uniaxial stretch response is shown in Fig.4.6from two tests on white matter, one involving compression and subsequent ten-sion (left) and another involving tension and subsequent compression (right).Both tests were performed up to a stretch level still far from failure, but neardamage initiation.
0.6 0.8 1 1.2 1.4 1.6
-2.0
-1.0
0
1.0
2.0
Frontal frontal
Thalamus frontal
Parietal sagittal
Parietal frontal
Occipital sagittal
Thalamus sagittal
Frontal sagittal
Medulla oblongata
Occipital frontal
stretch
nominal stress
[kPa]
Figure 4.5: Dispersion of data of compression/tension tests to a stretch well below fracturebut approaching the damage threshold on prismatic specimens of white and gray matter,harvested from the occipital lobe (left) and from the all locations. Nominal stress is reportedversus stretch.
The behavior evidences:
38 Uniaxial cyclic tension/compression experiments
1.5
1.0
0.5
0
-0.5
-1.0
-1.5
0.6 0.8 1.0 1.2 1.4 1.21.11.00.90.8
0.8
0.4
0
-0.4
-0.8
nominal stress
[kPa]
stretch
nominal stress
[kPa]
stretch
Figure 4.6: Representative results of compression/tension (left) and tension/compression(right) tests to a stretch well below fracture but approaching the damage threshold on[14mm/9.5mm (left) and 14mm/9mm (right) initial height/edge] prismatic specimens ofwhite matter, harvested from the occipital lobe (left) and from the frontal lobe (right), inthe frontal direction. Nominal stress is reported versus stretch. Arrows indicate the loadingdirection.
• strong nonlinearity 1;
• hysteresis;
• different stiffnesses in tension and compression, and during loading andunloading [analogous to the so-called ”Mullins effect” in elastomers (Mullins,1947)];
• permanent deformations (also observed by Hakim and co-workers, whocalled them ”bio-plastic”, Hakim et al. 1976).
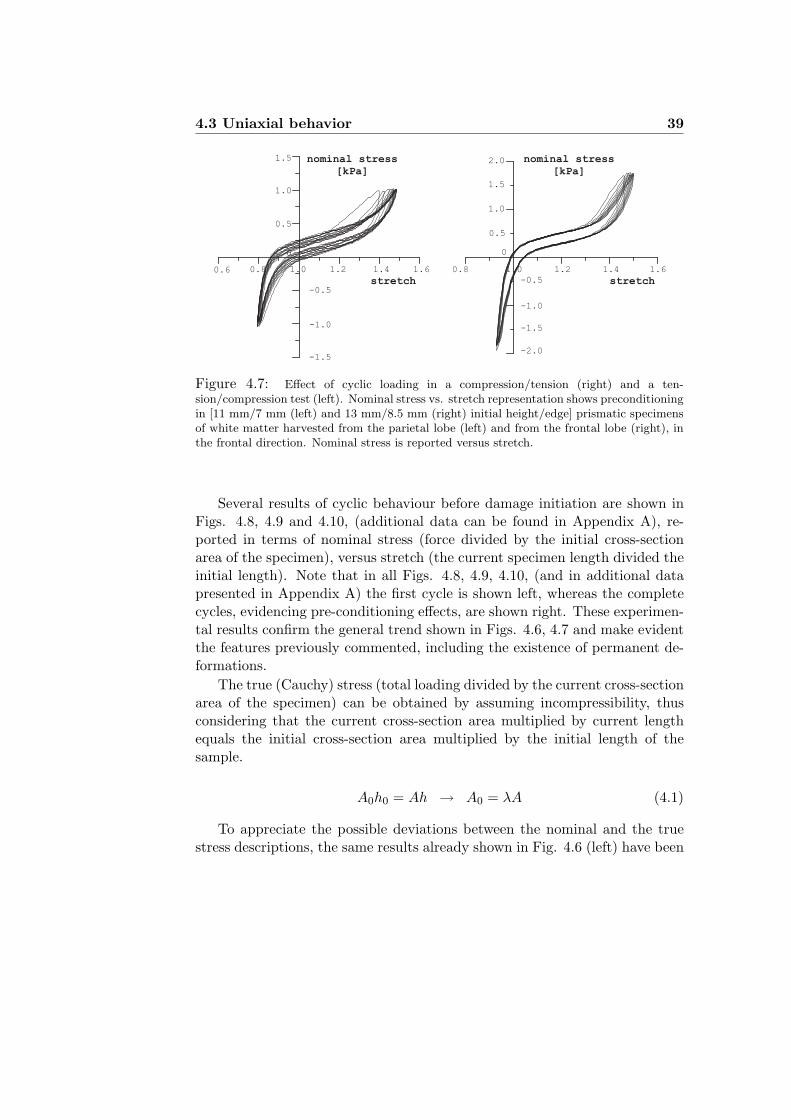
Preconditioning was also observed, as indicated in Fig. 4.7, from two sam-ples of white matter harvested from the parietal lobe (left) and from frontallobe (right) in the frontal direction. The specimen have been subject to 14compression/tension cycles (left) and to 10 tension/compression cycles (right).
1The initial curvature of the curve (convex downward, so called ”S-shaped”) in the ten-sion/compression experiment, observed for the first time on human brain by Miller andChinzei (2002), represents another feature distinguishing brain parenchyma from other softtissues (for instance biological gels, Storm et al. 2005), but common to materials charac-terized by chain-like particles, including: rubber, cellulose, wool, and paint films (Hour-wink,1958) and DNA molecules (Cluzel et al. 1996).
4.3 Uniaxial behavior 39
1.6
1.5
-0.5
0
-1.0
-1.5
stretch
1.41.21.00.80.6
1.0
0.5
nominal stress
[kPa]
1.61.41.21.00.8
2.0
1.0
0
-1.0
-2.0
1.5
0.5
-1.5
-0.5 stretch
nominal stress
[kPa]
Figure 4.7: Effect of cyclic loading in a compression/tension (right) and a ten-sion/compression test (left). Nominal stress vs. stretch representation shows preconditioningin [11 mm/7 mm (left) and 13 mm/8.5 mm (right) initial height/edge] prismatic specimensof white matter harvested from the parietal lobe (left) and from the frontal lobe (right), inthe frontal direction. Nominal stress is reported versus stretch.
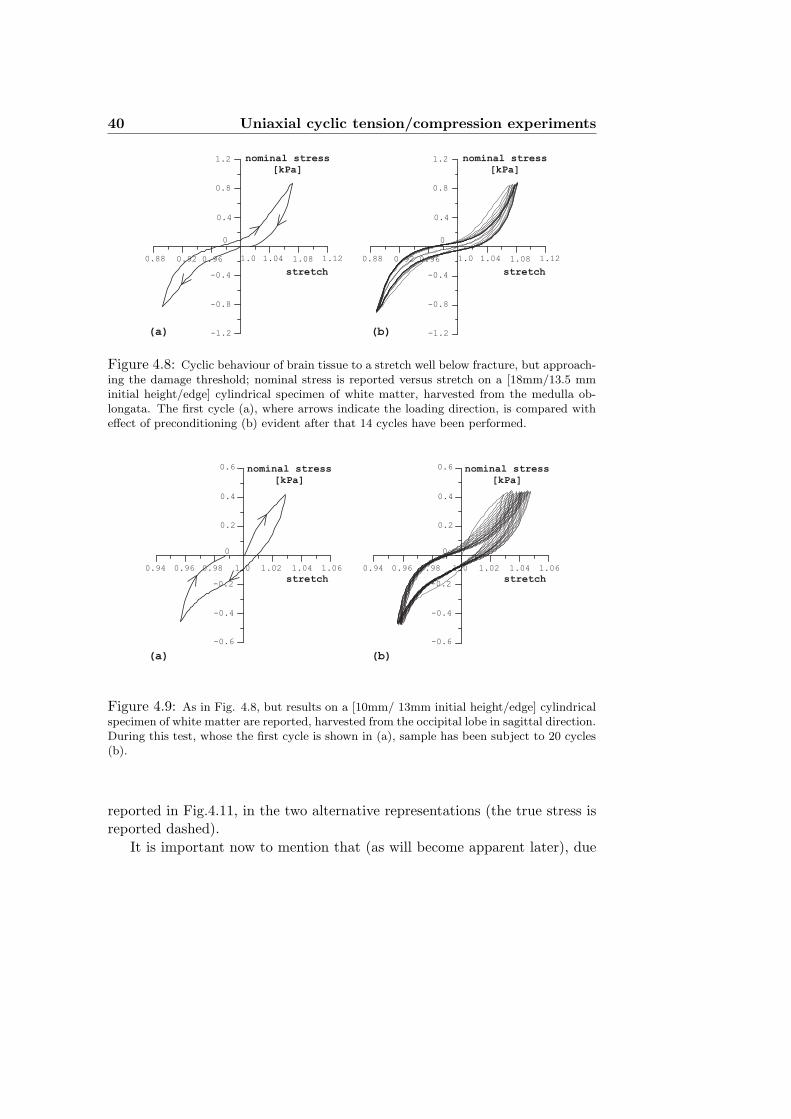
Several results of cyclic behaviour before damage initiation are shown inFigs. 4.8, 4.9 and 4.10, (additional data can be found in Appendix A), re-ported in terms of nominal stress (force divided by the initial cross-sectionarea of the specimen), versus stretch (the current specimen length divided theinitial length). Note that in all Figs. 4.8, 4.9, 4.10, (and in additional datapresented in Appendix A) the first cycle is shown left, whereas the completecycles, evidencing pre-conditioning effects, are shown right. These experimen-tal results confirm the general trend shown in Figs. 4.6, 4.7 and make evidentthe features previously commented, including the existence of permanent de-formations.
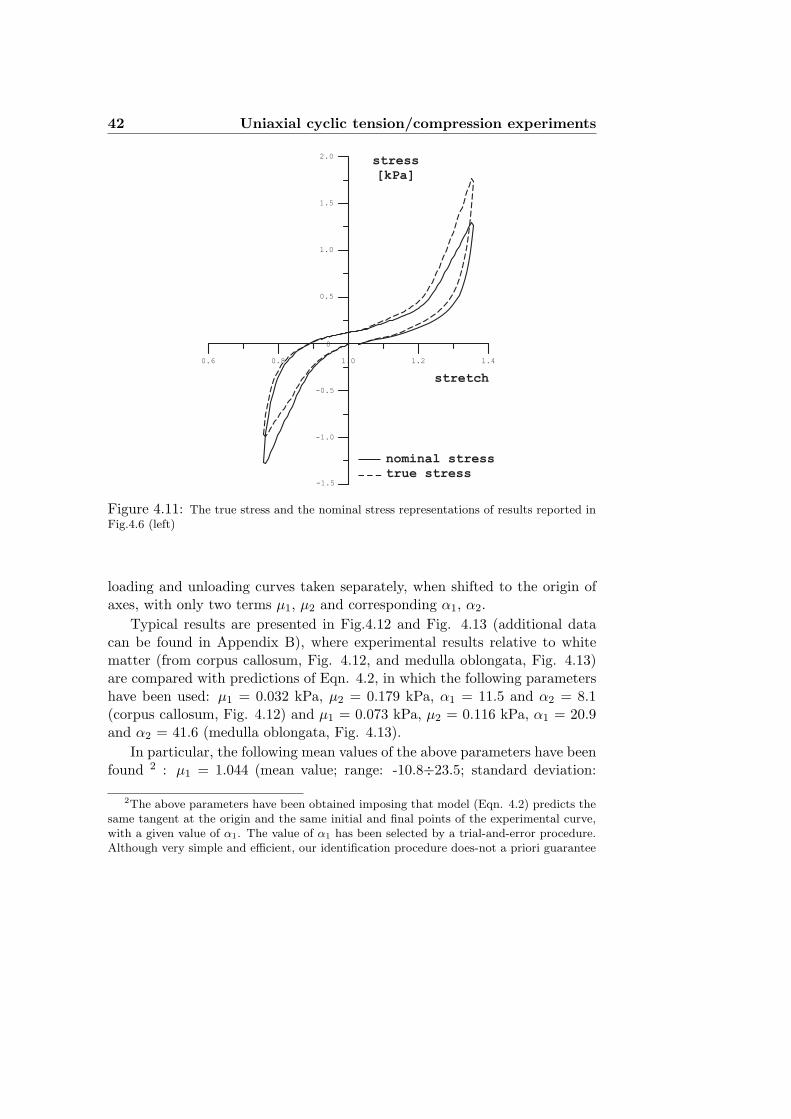
The true (Cauchy) stress (total loading divided by the current cross-sectionarea of the specimen) can be obtained by assuming incompressibility, thusconsidering that the current cross-section area multiplied by current lengthequals the initial cross-section area multiplied by the initial length of thesample.
A0h0 = Ah → A0 = λA (4.1)
To appreciate the possible deviations between the nominal and the truestress descriptions, the same results already shown in Fig. 4.6 (left) have been
40 Uniaxial cyclic tension/compression experiments
stretch
nominal stress
[kPa]
1.2
0.8
-0.8
0
-1.2
1.121.081.0
0.4
-0.4
1.040.88 0.92 0.96
(a)
stretch
nominal stress
[kPa]
(b)
1.2
0.8
-0.8
0
-1.2
1.121.081.0
0.4
-0.4
1.040.88 0.92 0.96
Figure 4.8: Cyclic behaviour of brain tissue to a stretch well below fracture, but approach-ing the damage threshold; nominal stress is reported versus stretch on a [18mm/13.5 mminitial height/edge] cylindrical specimen of white matter, harvested from the medulla ob-longata. The first cycle (a), where arrows indicate the loading direction, is compared witheffect of preconditioning (b) evident after that 14 cycles have been performed.
0.6
0.4
0.2
-0.2
-0.4
-0.6
0
0.94 0.96 0.98 1.0 1.02 1.04 1.06
(a)
nominal stress
[kPa]
stretch
1
nominal stress
[kPa]
stretch
0.6
0.4
0.2
-0.2
-0.4
-0.6
0
0.94 0.96 0.98 1.0 1.02 1.04 1.06
(b)
Figure 4.9: As in Fig. 4.8, but results on a [10mm/ 13mm initial height/edge] cylindricalspecimen of white matter are reported, harvested from the occipital lobe in sagittal direction.During this test, whose the first cycle is shown in (a), sample has been subject to 20 cycles(b).
reported in Fig.4.11, in the two alternative representations (the true stress isreported dashed).
It is important now to mention that (as will become apparent later), due
4.4 The Ogden theory 41
1.5
1.0
0.5
0
-1.5
-1.0
-0.5
0.8 1.2 1.4 1.6 1.81.0
nominal stress
[kPa]
stretch
(a)
1
1.5
1.0
0.5
-1.5
-1.0
-0.5
0.8 1.2 1.4 1.6 1.81.0
nominal stress
[kPa]
stretch
(b)
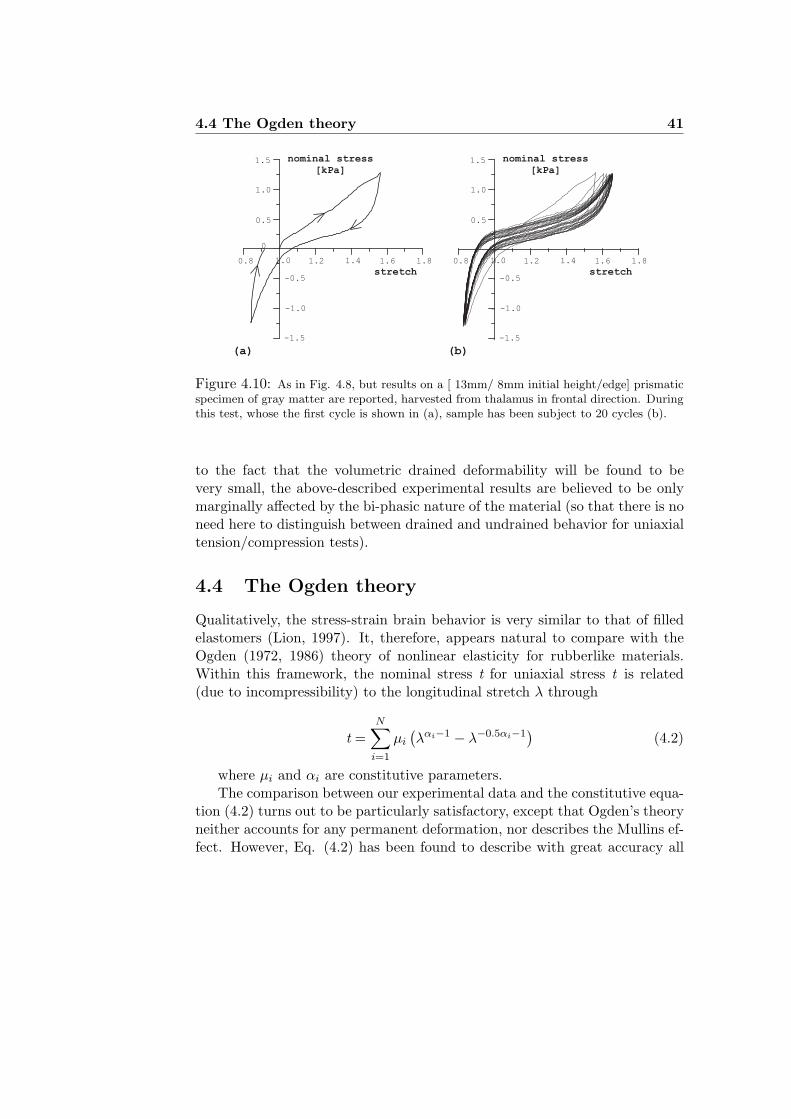
Figure 4.10: As in Fig. 4.8, but results on a [ 13mm/ 8mm initial height/edge] prismaticspecimen of gray matter are reported, harvested from thalamus in frontal direction. Duringthis test, whose the first cycle is shown in (a), sample has been subject to 20 cycles (b).
to the fact that the volumetric drained deformability will be found to bevery small, the above-described experimental results are believed to be onlymarginally affected by the bi-phasic nature of the material (so that there is noneed here to distinguish between drained and undrained behavior for uniaxialtension/compression tests).
4.4 The Ogden theory
Qualitatively, the stress-strain brain behavior is very similar to that of filledelastomers (Lion, 1997). It, therefore, appears natural to compare with theOgden (1972, 1986) theory of nonlinear elasticity for rubberlike materials.Within this framework, the nominal stress t for uniaxial stress t is related(due to incompressibility) to the longitudinal stretch λ through
t =N∑
i=1
µi
(λαi−1 − λ−0.5αi−1
)(4.2)
where µi and αi are constitutive parameters.The comparison between our experimental data and the constitutive equa-
tion (4.2) turns out to be particularly satisfactory, except that Ogden’s theoryneither accounts for any permanent deformation, nor describes the Mullins ef-fect. However, Eq. (4.2) has been found to describe with great accuracy all
42 Uniaxial cyclic tension/compression experiments
stress
[kPa]
stretch
1.5
1.0
0.5
-0.5
-1.0
-1.5
0.6 1.0 1.2 1.40.8
0
2.0
nominal stress
true stress
Figure 4.11: The true stress and the nominal stress representations of results reported inFig.4.6 (left)
loading and unloading curves taken separately, when shifted to the origin ofaxes, with only two terms µ1, µ2 and corresponding α1, α2.
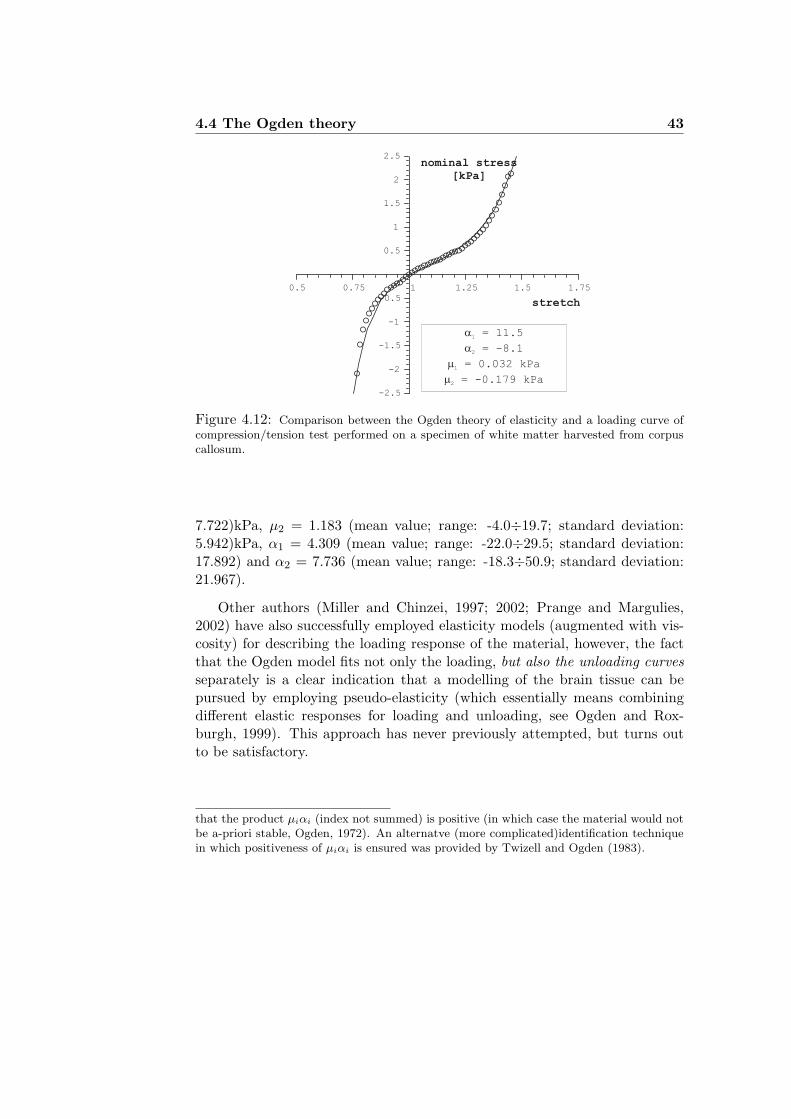
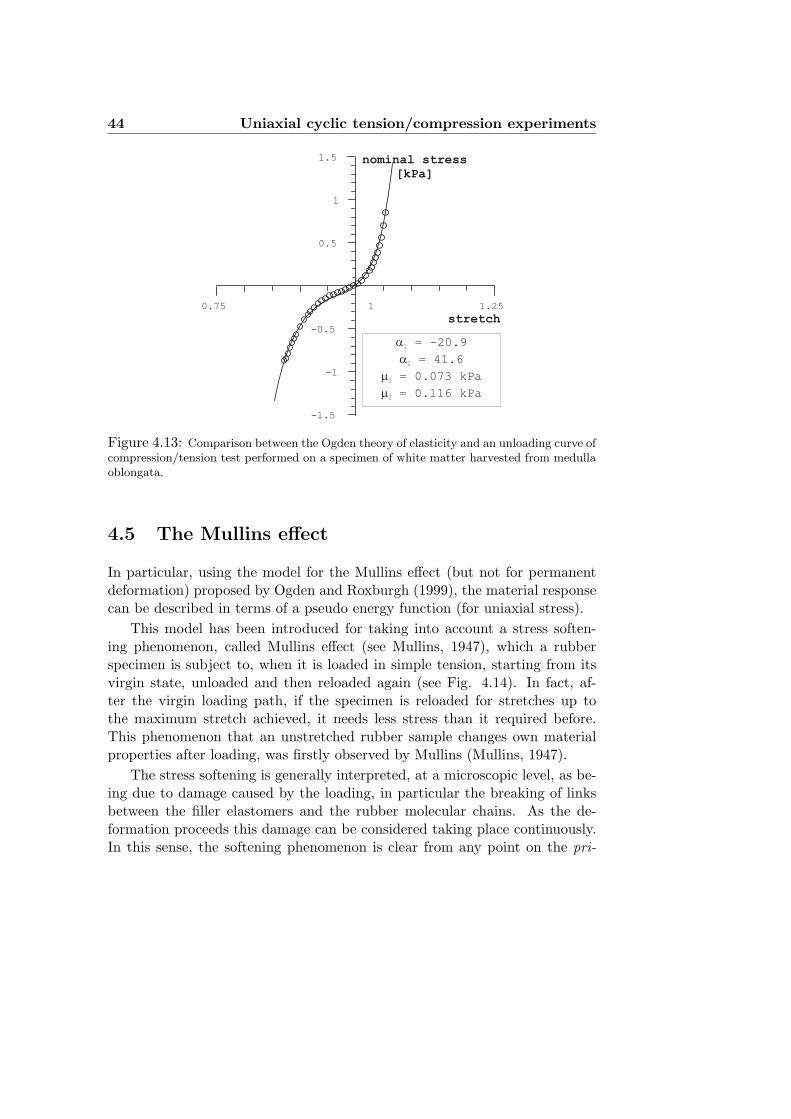
Typical results are presented in Fig.4.12 and Fig. 4.13 (additional datacan be found in Appendix B), where experimental results relative to whitematter (from corpus callosum, Fig. 4.12, and medulla oblongata, Fig. 4.13)are compared with predictions of Eqn. 4.2, in which the following parametershave been used: µ1 = 0.032 kPa, µ2 = 0.179 kPa, α1 = 11.5 and α2 = 8.1(corpus callosum, Fig. 4.12) and µ1 = 0.073 kPa, µ2 = 0.116 kPa, α1 = 20.9and α2 = 41.6 (medulla oblongata, Fig. 4.13).
In particular, the following mean values of the above parameters have beenfound 2 : µ1 = 1.044 (mean value; range: -10.8÷23.5; standard deviation:
2The above parameters have been obtained imposing that model (Eqn. 4.2) predicts thesame tangent at the origin and the same initial and final points of the experimental curve,with a given value of α1. The value of α1 has been selected by a trial-and-error procedure.Although very simple and efficient, our identification procedure does-not a priori guarantee
4.4 The Ogden theory 43
a
a
m
m
1
2
1
2
= 11.5
= -8.1
= 0.032 kPa
= -0.179 kPa
0.5 0.75 1 1.25 1.5 1.75
-2.5
-2
-1.5
-1
-0.5
0.5
1
1.5
2
2.5
stretch
nominal stress
[kPa]
Figure 4.12: Comparison between the Ogden theory of elasticity and a loading curve ofcompression/tension test performed on a specimen of white matter harvested from corpuscallosum.
7.722)kPa, µ2 = 1.183 (mean value; range: -4.0÷19.7; standard deviation:5.942)kPa, α1 = 4.309 (mean value; range: -22.0÷29.5; standard deviation:17.892) and α2 = 7.736 (mean value; range: -18.3÷50.9; standard deviation:21.967).
Other authors (Miller and Chinzei, 1997; 2002; Prange and Margulies,2002) have also successfully employed elasticity models (augmented with vis-cosity) for describing the loading response of the material, however, the factthat the Ogden model fits not only the loading, but also the unloading curvesseparately is a clear indication that a modelling of the brain tissue can bepursued by employing pseudo-elasticity (which essentially means combiningdifferent elastic responses for loading and unloading, see Ogden and Rox-burgh, 1999). This approach has never previously attempted, but turns outto be satisfactory.
that the product µiαi (index not summed) is positive (in which case the material would notbe a-priori stable, Ogden, 1972). An alternatve (more complicated)identification techniquein which positiveness of µiαi is ensured was provided by Twizell and Ogden (1983).
44 Uniaxial cyclic tension/compression experiments
0.75 1 1.25
-1.5
-1
-0.5
0.5
1
1.5 nominal stress
[kPa]
stretch
a
a
m
m
1
2
1
2
= -20.9
= 41.6
= 0.073 kPa
= 0.116 kPa
Figure 4.13: Comparison between the Ogden theory of elasticity and an unloading curve ofcompression/tension test performed on a specimen of white matter harvested from medullaoblongata.
4.5 The Mullins effect
In particular, using the model for the Mullins effect (but not for permanentdeformation) proposed by Ogden and Roxburgh (1999), the material responsecan be described in terms of a pseudo energy function (for uniaxial stress).
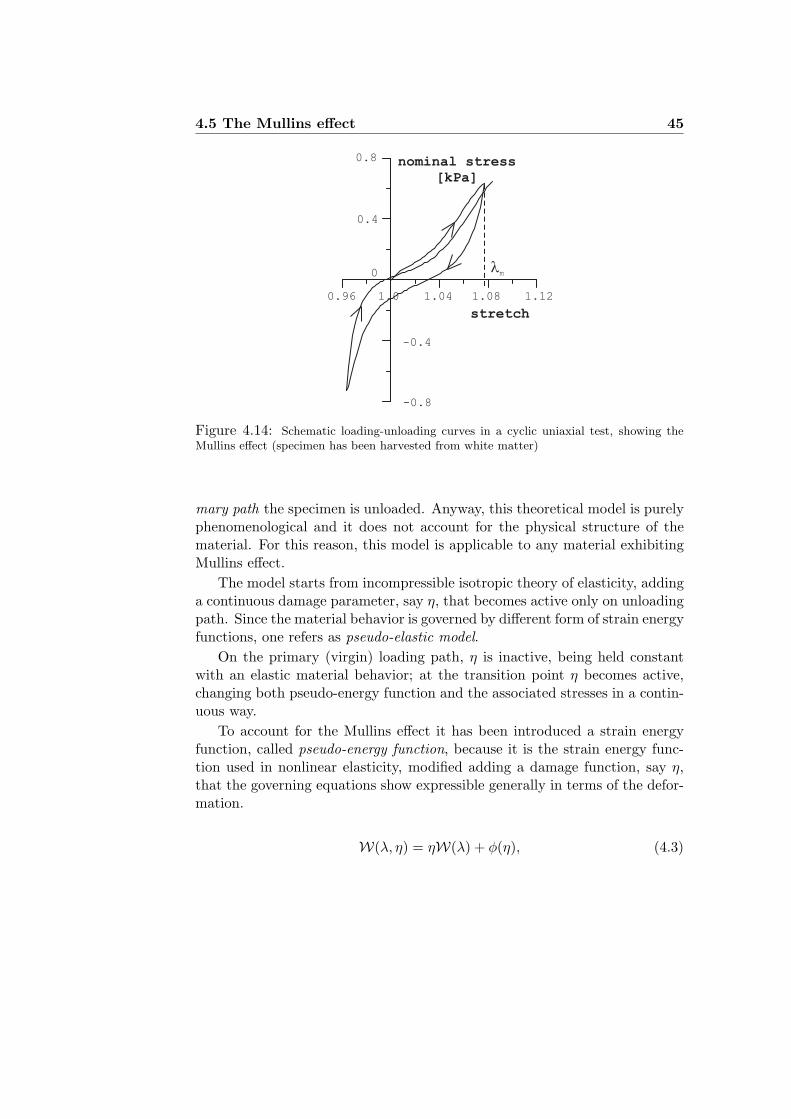
This model has been introduced for taking into account a stress soften-ing phenomenon, called Mullins effect (see Mullins, 1947), which a rubberspecimen is subject to, when it is loaded in simple tension, starting from itsvirgin state, unloaded and then reloaded again (see Fig. 4.14). In fact, af-ter the virgin loading path, if the specimen is reloaded for stretches up tothe maximum stretch achieved, it needs less stress than it required before.This phenomenon that an unstretched rubber sample changes own materialproperties after loading, was firstly observed by Mullins (Mullins, 1947).
The stress softening is generally interpreted, at a microscopic level, as be-ing due to damage caused by the loading, in particular the breaking of linksbetween the filler elastomers and the rubber molecular chains. As the de-formation proceeds this damage can be considered taking place continuously.In this sense, the softening phenomenon is clear from any point on the pri-
4.5 The Mullins effect 45
1.0 1.121.04 1.080.96
0.8
0.4
-0.4
-0.8
0
stretch
nominal stress
[kPa]
lm
Figure 4.14: Schematic loading-unloading curves in a cyclic uniaxial test, showing theMullins effect (specimen has been harvested from white matter)
mary path the specimen is unloaded. Anyway, this theoretical model is purelyphenomenological and it does not account for the physical structure of thematerial. For this reason, this model is applicable to any material exhibitingMullins effect.
The model starts from incompressible isotropic theory of elasticity, addinga continuous damage parameter, say η, that becomes active only on unloadingpath. Since the material behavior is governed by different form of strain energyfunctions, one refers as pseudo-elastic model.
On the primary (virgin) loading path, η is inactive, being held constantwith an elastic material behavior; at the transition point η becomes active,changing both pseudo-energy function and the associated stresses in a contin-uous way.
To account for the Mullins effect it has been introduced a strain energyfunction, called pseudo-energy function, because it is the strain energy func-tion used in nonlinear elasticity, modified adding a damage function, say η,that the governing equations show expressible generally in terms of the defor-mation.
W(λ, η) = ηW(λ) + φ(η), (4.3)
46 Uniaxial cyclic tension/compression experiments
where W(λ) is the strain energy function corresponding to the Ogdenmodel
W(λ) =N∑
i=1
µi(λαi + 2λ−αi/2 − 3)/αi, (4.4)
so that the nominal stress turns out to be that given by Eqn. (4.2), butmultiplied by η, the following function of the current stretch
η = 1− 1rerf
[1m
(W(λm)−W(λ))]
, (4.5)
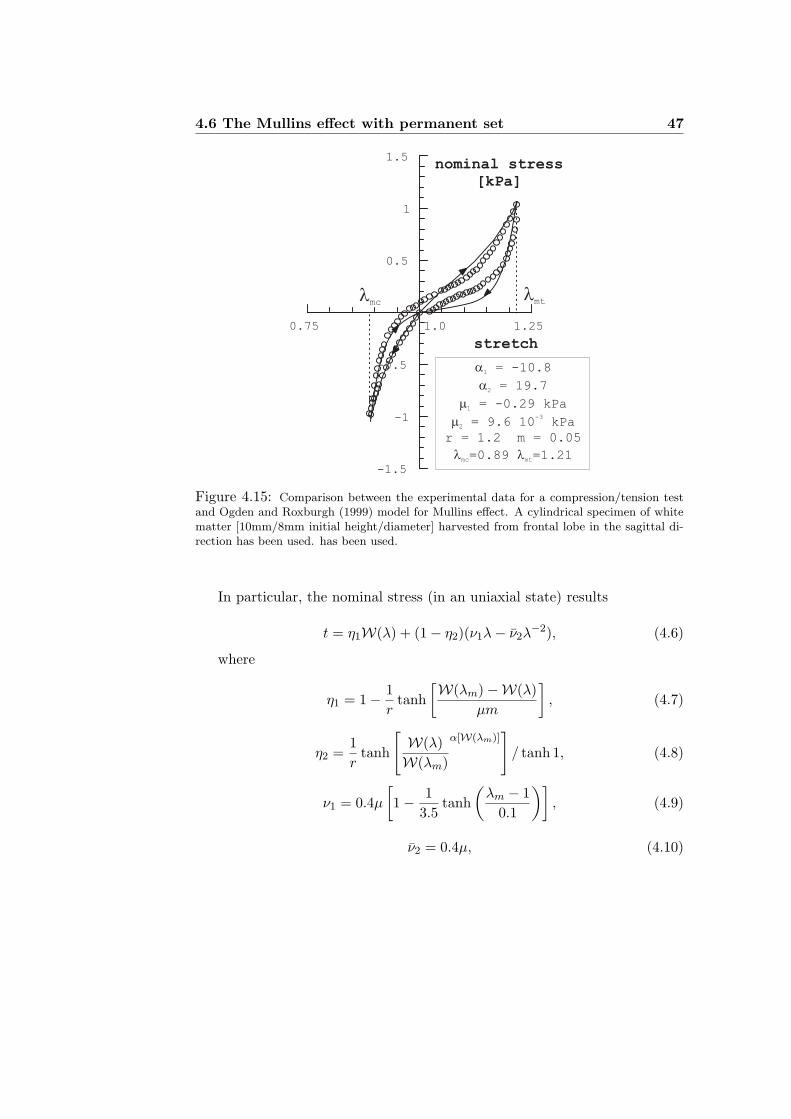
in which r and m are material parameters and λm represents the stretchat which unloading initiates. Therefore, along the primary loading path, ηis hold constant and equal to unity, whereas parameter η begins decreasingstarting from λ = λm, to account for the stress softening during unloading.Except that permanent deformations are not captured, we have found a goodagreement of our data with the above model, as shown in Fig.4.15 and Fig.4.16, where two specimens of white matter have been considered.
In particular, the parameters r and m have the following physical inter-pretations. The parameter r is a measure of the extent of the damage relativeto the virgin state; from eqn. 4.5 we can note that larger value of r, lead to ηvalue near to unity that is for large value of r we do not go very far from thevirgin state (primary loading path).
4.6 The Mullins effect with permanent set
The residual strain upon unloading can be accounted for by employing theDorfmann and Ogden (2004) model for rubber materials. They introduced apseudo strain-energy function depending on two parameters, η1 and η2. Theformer is associated to the Mullins effect (thus playing the role of η in the Og-den and Roxburgh model) and is referred to as damage or softening variable,the latter to the permanent strain and is called residual strain variable. Boththese variables depend on the maximum stretch achieved previously.
Even now, the parameters η1 and η2 can be active or inactive, changingthe material properties when they pass from a state to another one. Duringtheir inactivity, they are held constant, becoming active when the unloadingpath has started from any point on the primary loading path. From this pointthe pseudo-energy function changes continuously as the stress does.
4.6 The Mullins effect with permanent set 47
stretch
nominal stress
[kPa]
a
a
m
m
l l
1
2
1
2
mc mt
= -10.8
= 19.7
= -0.29 kPa
= 9.6 10 kPa
r = 1.2 m = 0.05
=0.89 =1.21
-3
0.75 1.0 1.25
-1.5
-1
-0.5
0.5
1
1.5
lmc
lmt
Figure 4.15: Comparison between the experimental data for a compression/tension testand Ogden and Roxburgh (1999) model for Mullins effect. A cylindrical specimen of whitematter [10mm/8mm initial height/diameter] harvested from frontal lobe in the sagittal di-rection has been used. has been used.
In particular, the nominal stress (in an uniaxial state) results
t = η1W(λ) + (1− η2)(ν1λ− ν2λ−2), (4.6)
where
η1 = 1− 1r
tanh[W(λm)−W(λ)
µm
], (4.7)
η2 =1r
tanh
[W(λ)W(λm)
α[W(λm)]]
/ tanh 1, (4.8)
ν1 = 0.4µ
[1− 1
3.5tanh
(λm − 1
0.1
)], (4.9)
ν2 = 0.4µ, (4.10)
48 Uniaxial cyclic tension/compression experiments
0.75 1.0 1.25 1.5
-1.5
-1
-0.5
0.5
1
1.5
stretch
nominal stress
[kPa]
a
a
m
m
l l
1
2
1
2
mc mt
= 23.5
= -4.0
= 8.32 10 kPa
= -0.41 kPa
r = 1.6 m = 0.035
=0.77 =1.36
-4
lmc
lmt
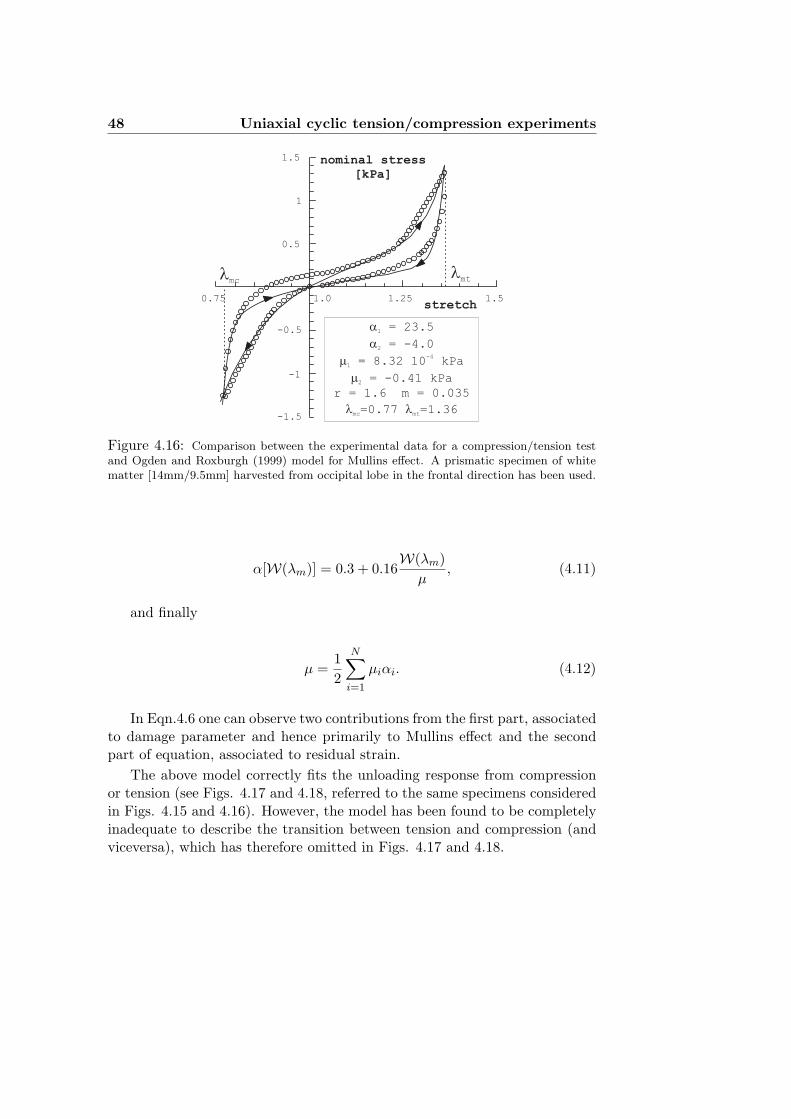
Figure 4.16: Comparison between the experimental data for a compression/tension testand Ogden and Roxburgh (1999) model for Mullins effect. A prismatic specimen of whitematter [14mm/9.5mm] harvested from occipital lobe in the frontal direction has been used.
α[W(λm)] = 0.3 + 0.16W(λm)
µ, (4.11)
and finally
µ =12
N∑
i=1
µiαi. (4.12)
In Eqn.4.6 one can observe two contributions from the first part, associatedto damage parameter and hence primarily to Mullins effect and the secondpart of equation, associated to residual strain.
The above model correctly fits the unloading response from compressionor tension (see Figs. 4.17 and 4.18, referred to the same specimens consideredin Figs. 4.15 and 4.16). However, the model has been found to be completelyinadequate to describe the transition between tension and compression (andviceversa), which has therefore omitted in Figs. 4.17 and 4.18.
4.7 Damage evolution and fracture process 49
0.75 1.0 1.25
-1.5
-1
-0.5
0.5
1
1.5
stretch
nominal stress
[kPa]
a
a
m
m
l
1 = -10.8
2 = 19.7
1 = -0.29 kPa
2 = 9.6 10 kPa
r = 1.2 m = 0.03
=0.89
-3
m
lm
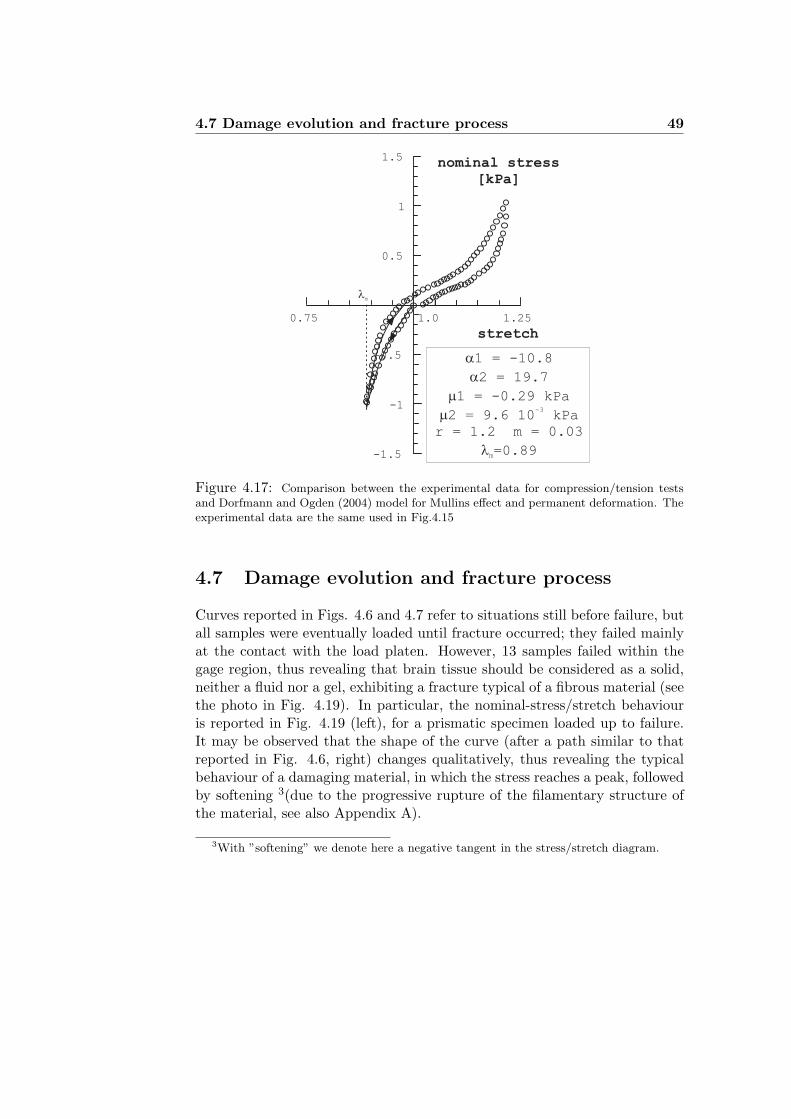
Figure 4.17: Comparison between the experimental data for compression/tension testsand Dorfmann and Ogden (2004) model for Mullins effect and permanent deformation. Theexperimental data are the same used in Fig.4.15
4.7 Damage evolution and fracture process
Curves reported in Figs. 4.6 and 4.7 refer to situations still before failure, butall samples were eventually loaded until fracture occurred; they failed mainlyat the contact with the load platen. However, 13 samples failed within thegage region, thus revealing that brain tissue should be considered as a solid,neither a fluid nor a gel, exhibiting a fracture typical of a fibrous material (seethe photo in Fig. 4.19). In particular, the nominal-stress/stretch behaviouris reported in Fig. 4.19 (left), for a prismatic specimen loaded up to failure.It may be observed that the shape of the curve (after a path similar to thatreported in Fig. 4.6, right) changes qualitatively, thus revealing the typicalbehaviour of a damaging material, in which the stress reaches a peak, followedby softening 3(due to the progressive rupture of the filamentary structure ofthe material, see also Appendix A).
3With ”softening” we denote here a negative tangent in the stress/stretch diagram.
50 Uniaxial cyclic tension/compression experiments
0.75 1.0 1.25 1.5
-1.5
-1
-0.5
0.5
1
1.5
stretch
nominal stress
[kPa]
a
a
m
m
l
1 = 23.5
2 = -4.0
1 = 8.32 10 kPa
2 = -0.41 kPa
r = 0.75 m = 0.11
=0.77
-4
m
lm
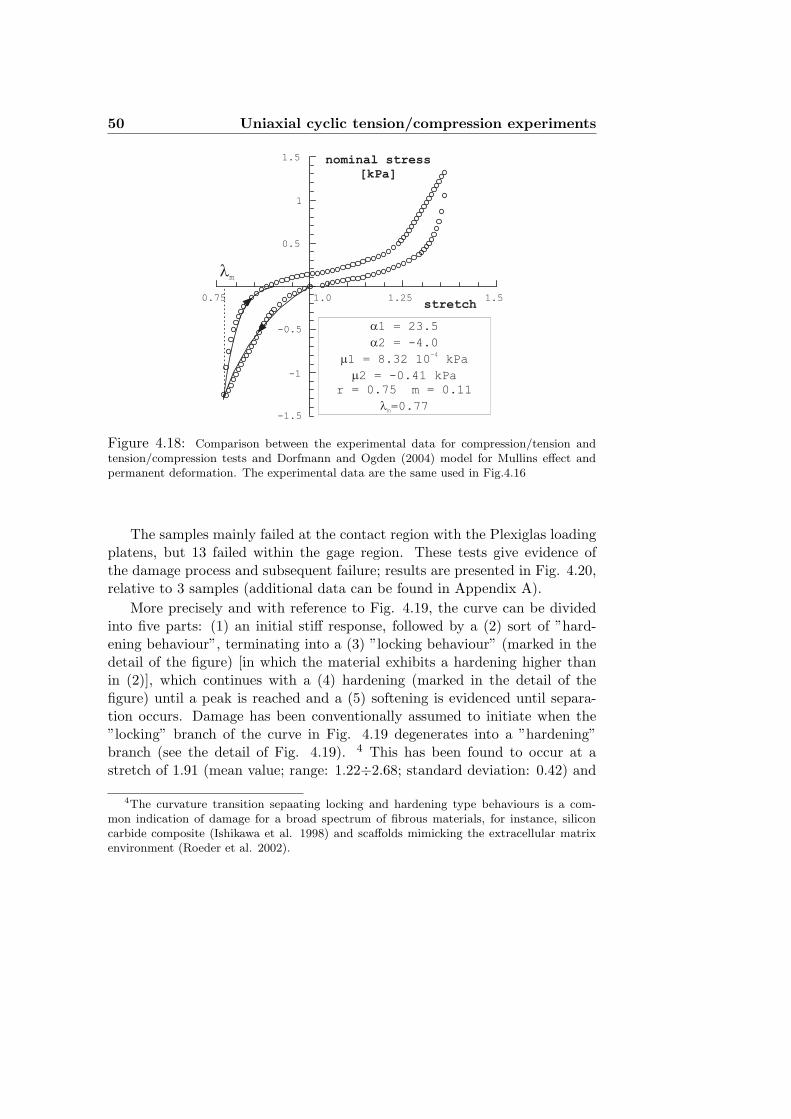
Figure 4.18: Comparison between the experimental data for compression/tension andtension/compression tests and Dorfmann and Ogden (2004) model for Mullins effect andpermanent deformation. The experimental data are the same used in Fig.4.16
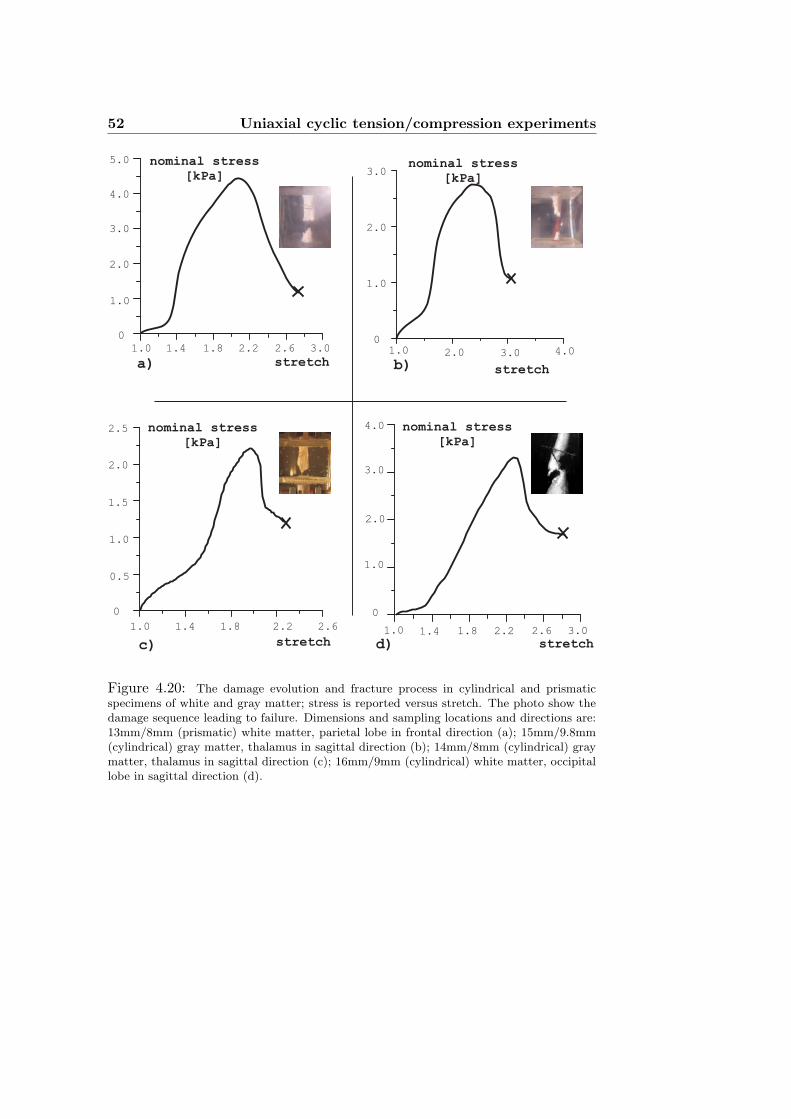
The samples mainly failed at the contact region with the Plexiglas loadingplatens, but 13 failed within the gage region. These tests give evidence ofthe damage process and subsequent failure; results are presented in Fig. 4.20,relative to 3 samples (additional data can be found in Appendix A).
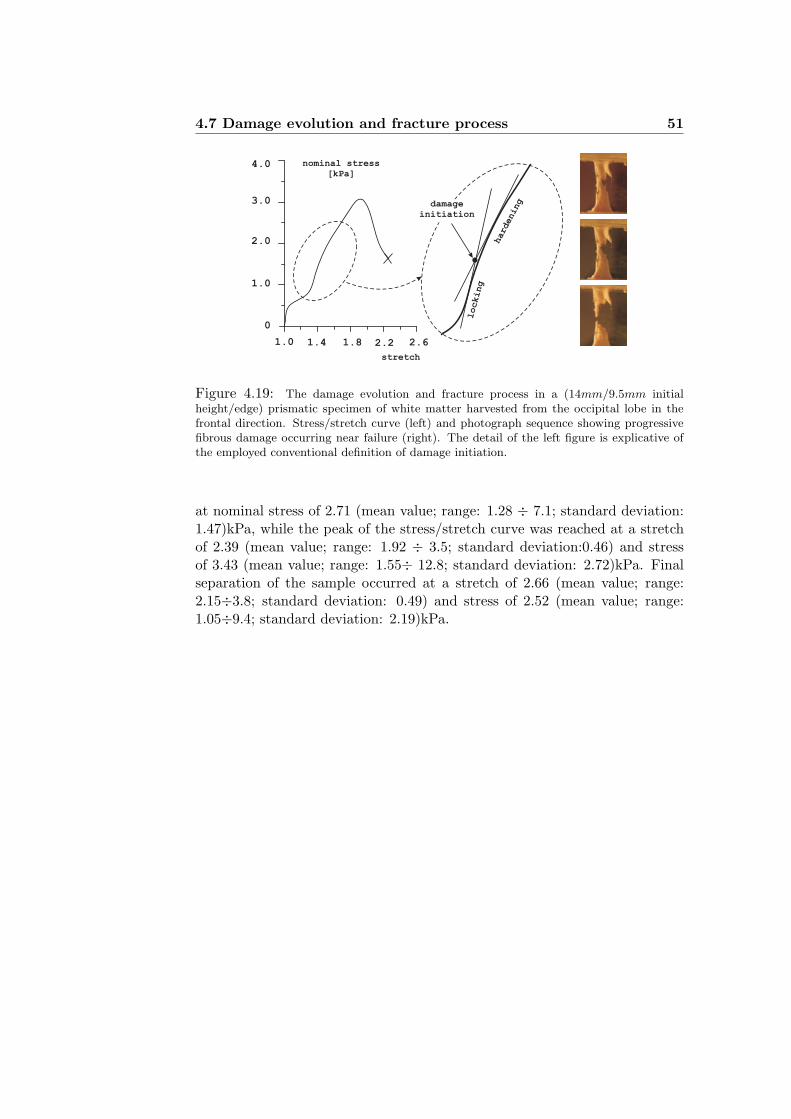
More precisely and with reference to Fig. 4.19, the curve can be dividedinto five parts: (1) an initial stiff response, followed by a (2) sort of ”hard-ening behaviour”, terminating into a (3) ”locking behaviour” (marked in thedetail of the figure) [in which the material exhibits a hardening higher thanin (2)], which continues with a (4) hardening (marked in the detail of thefigure) until a peak is reached and a (5) softening is evidenced until separa-tion occurs. Damage has been conventionally assumed to initiate when the”locking” branch of the curve in Fig. 4.19 degenerates into a ”hardening”branch (see the detail of Fig. 4.19). 4 This has been found to occur at astretch of 1.91 (mean value; range: 1.22÷2.68; standard deviation: 0.42) and
4The curvature transition sepaating locking and hardening type behaviours is a com-mon indication of damage for a broad spectrum of fibrous materials, for instance, siliconcarbide composite (Ishikawa et al. 1998) and scaffolds mimicking the extracellular matrixenvironment (Roeder et al. 2002).
4.7 Damage evolution and fracture process 51
stretch
4.0
3.0
2.0
1.0
1.0 1.4 1.8 2.2 2.6
nominal stress
[kPa]
0
damage
initiation
locking
hardening
Figure 4.19: The damage evolution and fracture process in a (14mm/9.5mm initialheight/edge) prismatic specimen of white matter harvested from the occipital lobe in thefrontal direction. Stress/stretch curve (left) and photograph sequence showing progressivefibrous damage occurring near failure (right). The detail of the left figure is explicative ofthe employed conventional definition of damage initiation.
at nominal stress of 2.71 (mean value; range: 1.28 ÷ 7.1; standard deviation:1.47)kPa, while the peak of the stress/stretch curve was reached at a stretchof 2.39 (mean value; range: 1.92 ÷ 3.5; standard deviation:0.46) and stressof 3.43 (mean value; range: 1.55÷ 12.8; standard deviation: 2.72)kPa. Finalseparation of the sample occurred at a stretch of 2.66 (mean value; range:2.15÷3.8; standard deviation: 0.49) and stress of 2.52 (mean value; range:1.05÷9.4; standard deviation: 2.19)kPa.
52 Uniaxial cyclic tension/compression experiments
2.5 nominal stress
[kPa]
2.0
1.5
0.5
0
1.0
1.0
1.4 1.8 2.2 2.6
c) stretch
stretch
5.0 nominal stress
[kPa]
4.0
3.0
2.0
1.0
0
1.0 1.4 1.8 2.2 2.6 3.0
a)stretch
3.02.0 4.0
nominal stress
[kPa]3.0
2.0
1.0
0
1.0
b)
d)
4.0
0
3.0
1.0
1.0 2.2
2.0
1.4 1.8 2.6 3.0
stretch
nominal stress
[kPa]
Figure 4.20: The damage evolution and fracture process in cylindrical and prismaticspecimens of white and gray matter; stress is reported versus stretch. The photo show thedamage sequence leading to failure. Dimensions and sampling locations and directions are:13mm/8mm (prismatic) white matter, parietal lobe in frontal direction (a); 15mm/9.8mm(cylindrical) gray matter, thalamus in sagittal direction (b); 14mm/8mm (cylindrical) graymatter, thalamus in sagittal direction (c); 16mm/9mm (cylindrical) white matter, occipitallobe in sagittal direction (d).
Chapter 5
Uniaxial deformation at free drainage
5.1 Introduction
In the pioneering work by Hakim et al. (Hakim et al. 1976) it was pointedout that brain parenchyma should be considered as a fluid-saturated porousmaterial, so that a number of models have been developed, particularly forthe analysis of the hydrocephalus, within the framework of (small or largestrain) poroelasticity (Tada et al. 1994, Kaczmarek et al. 1997). However,the state-of-the-art is certainly not satisfactory. In fact:
• two-phase modelling is currently ignored by many authors and is some-times criticized;
• only few, and indirect, evidences of poroelasticity are yet available. Someexperimental evidence was given by Masserman (1934), who showed thata drainage of cerebrospinal fluid causes a reduction in ventricular size,continuing for 8 hours, and by Miga et al. (2000), who measured certaindisplacements on an in-vivo porcine experimental system, which wereshown to agree with numerical simulations. The latter evidences areto be considered indirect since a non-poroelastic constitutive modellingcould predict similar mechanical responses. An indisputable behaviourlinked to the bi-phasic modelling is the volumetric shrinking of the braindue to the administration of hyperosmotic drugs such as mannitol (Bellet al., 1987) to alleviate elevated intracranial pressure or as a pre-surgicalpreparation. If there was no underpinning link relating the hydratednature of the brain to its tissue matrix, the drug would not inhibitherniation;
53
54 Uniaxial deformation at free drainage
• there is no agreement on the values of material parameters to be used.For instance, the drained volumetric compressibility suggested by Kacz-marek et al. (1997) on the basis of purely speculative arguments is muchhigher than that used by Tada et al. (1994);
• finally, if fundamental to explain deformation during hydrocephalus,why is interstitial fluid neglected in morphogenesis theories?
5.2 The oedometric test
The recourse to a uniaxial strain apparatus with free drainage (so-called ”oe-dometer” or ”consolidometer” in geotechnical engineering, Taylor 1949) iscrucial to discriminate viscous behavior from consolidation. This is indeedpossible since the basic constituents of a brain specimen can be consideredthemselves incompressible (at least at the level of loading at which our ex-periments have been performed), therefore, if consolidation did not occur, theoedometric deformation would simply be zero.
This approach to testing has been employed for articular cartilage andheart muscle (Oloyede and Broom, 1991; Djeard et al., 1992), but never untilnow for brain tissue or other types of soft biological tissues. It provides thefirst direct evidence of poroelastic behavior of brain parenchyma.
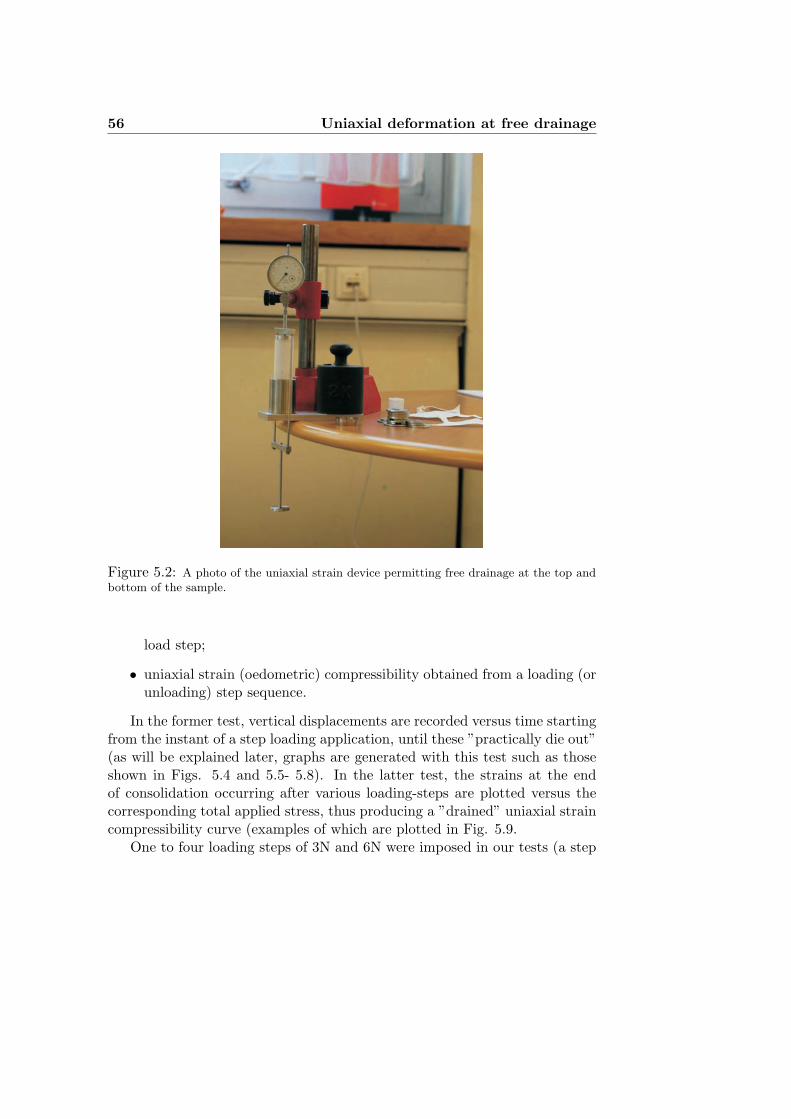
Therefore, to clarify the situation, a miniaturized version of a ”oedometer”has been designed and fabricated (at the University of Trento, with the kindhelp of Mr. Marco Bragagna) for testing cylindrical specimens (30 mm/5-8mm initial diameter/height) of brain parenchyma under free drainage at thetop and bottom surfaces. A sketch and a picture of the device are reportedin Fig. 5.2 and in Fig. 5.2, respectively. It essentially consists of a metal-lic mold (all parts in contact with the samples are made of Inox AISI 304steel) where the specimen is accommodated by hand and subsequently loadedthough a cylindrical piston (made of polytetrafluoroethylens ”PTFE”, a mate-rial selected for its low weight, low friction coefficient, and chemical neutrality)subject to dead loading (through a loading frame made of Anticorodal alu-minum). The contacts at the sample bottom and top are with a filter paper(Schleicher and Schuel n. 595, 110 mm diameter) against a porous metal[a commercial porous brass obtained through cold pressing and employed ingeotechnical oedometers (from Controls S.r.l., Italy)], permitting free drainageof interstitial fluid. The tests have been performed under physiological salinesolution at room temperature (filling a cylindrical plastic container enclosingthe device and thus preventing sample dehydration). Vertical displacement
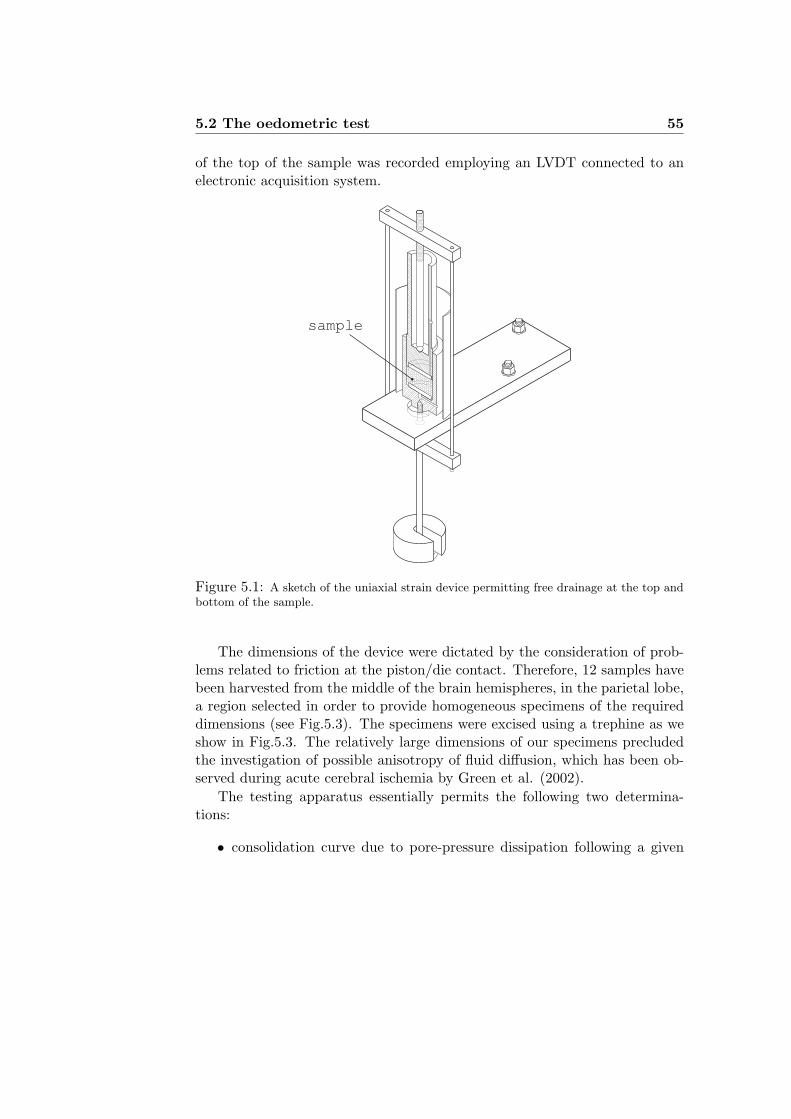
5.2 The oedometric test 55
of the top of the sample was recorded employing an LVDT connected to anelectronic acquisition system.
sample
Figure 5.1: A sketch of the uniaxial strain device permitting free drainage at the top andbottom of the sample.
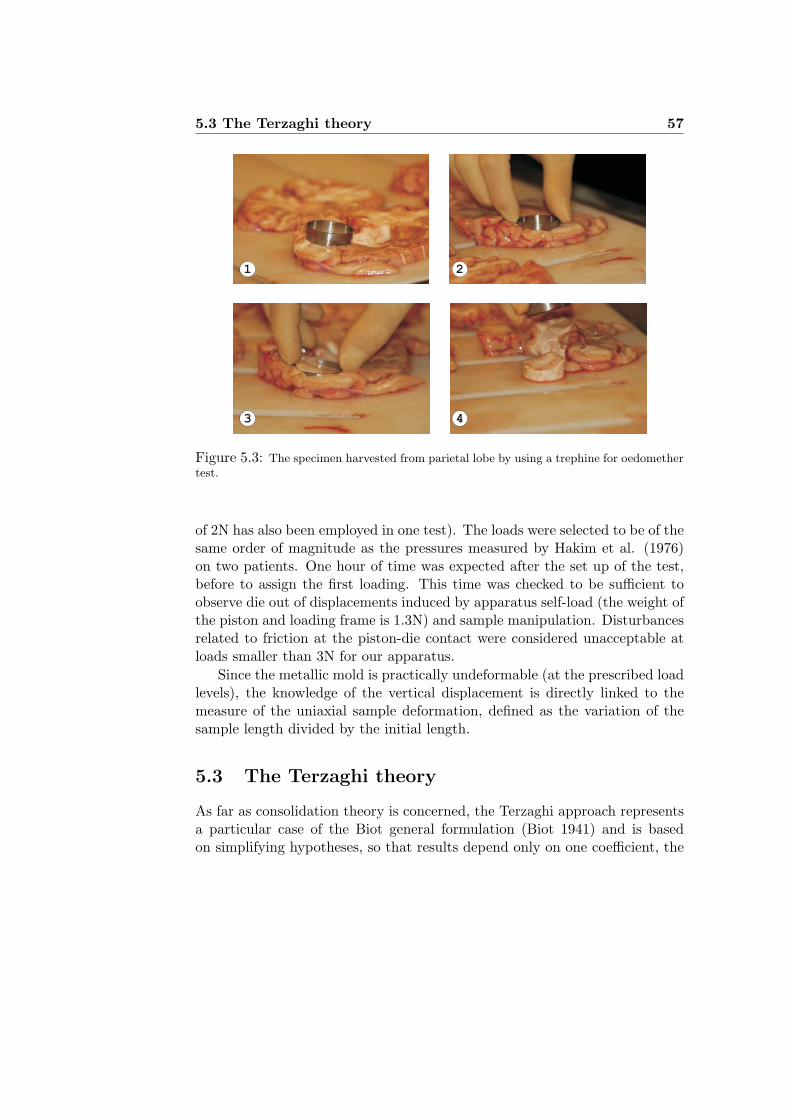
The dimensions of the device were dictated by the consideration of prob-lems related to friction at the piston/die contact. Therefore, 12 samples havebeen harvested from the middle of the brain hemispheres, in the parietal lobe,a region selected in order to provide homogeneous specimens of the requireddimensions (see Fig.5.3). The specimens were excised using a trephine as weshow in Fig.5.3. The relatively large dimensions of our specimens precludedthe investigation of possible anisotropy of fluid diffusion, which has been ob-served during acute cerebral ischemia by Green et al. (2002).
The testing apparatus essentially permits the following two determina-tions:
• consolidation curve due to pore-pressure dissipation following a given
56 Uniaxial deformation at free drainage
Figure 5.2: A photo of the uniaxial strain device permitting free drainage at the top andbottom of the sample.
load step;
• uniaxial strain (oedometric) compressibility obtained from a loading (orunloading) step sequence.
In the former test, vertical displacements are recorded versus time startingfrom the instant of a step loading application, until these ”practically die out”(as will be explained later, graphs are generated with this test such as thoseshown in Figs. 5.4 and 5.5- 5.8). In the latter test, the strains at the endof consolidation occurring after various loading-steps are plotted versus thecorresponding total applied stress, thus producing a ”drained” uniaxial straincompressibility curve (examples of which are plotted in Fig. 5.9.
One to four loading steps of 3N and 6N were imposed in our tests (a step
5.3 The Terzaghi theory 57
1 2
3 4
Figure 5.3: The specimen harvested from parietal lobe by using a trephine for oedomethertest.
of 2N has also been employed in one test). The loads were selected to be of thesame order of magnitude as the pressures measured by Hakim et al. (1976)on two patients. One hour of time was expected after the set up of the test,before to assign the first loading. This time was checked to be sufficient toobserve die out of displacements induced by apparatus self-load (the weight ofthe piston and loading frame is 1.3N) and sample manipulation. Disturbancesrelated to friction at the piston-die contact were considered unacceptable atloads smaller than 3N for our apparatus.
Since the metallic mold is practically undeformable (at the prescribed loadlevels), the knowledge of the vertical displacement is directly linked to themeasure of the uniaxial sample deformation, defined as the variation of thesample length divided by the initial length.
5.3 The Terzaghi theory
As far as consolidation theory is concerned, the Terzaghi approach representsa particular case of the Biot general formulation (Biot 1941) and is basedon simplifying hypotheses, so that results depend only on one coefficient, the
58 Uniaxial deformation at free drainage
consolidation coefficient (Taylor 1949).The average consolidation ratio U is defined as the ratio between the cur-
rent value of the specimen’s shortening and the final specimen’s shortening atthe end of consolidation, so that it ranges between 0 and 1. Test (a) permitsplotting the evolution of the consolidation ratio versus time. This can be com-pared to the prediction of the Biot consolidation theory or its simpler versionproposed by Terzaghi. We follow the Terzaghi theory since we believe thatevidence of consolidation should be sought with reference to the simplest pos-sible theory which is is based on small-strain, linearly elastic behaviour of theporous material skeleton and the Darcy law of filtration. In the oedometricconditions the governing equation becomes
cv∂2pw
∂z2=
∂pw
∂t, (5.1)
where z and t are the space and time variables, respectively, pw is the porefluid pressure, cv is the coefficient of consolidation defined as
cv =kM
γw, (5.2)
in which k is the permeability, M is the elastic oedometric coefficient andγw is the specific weight of the saturating fluid.
The solution of equation 5.2, complemented with the initial and boundaryconditions, respectively,
pw(t = 0) = pw0, pw(z = 0, z = 2H) = 0, (5.3)
corresponding to the oedometric test condition, is
pw =m=∞∑
m=0
4pw0
π(2m + 1)sin
pi(2m + 1)2H
exp−(0.5π(2m+1)2)T , (5.4)
where H is the maximum drainage length (equal to 1/2 of the sampleheight in the oedometric test), pw0 is the initial (constant) value of pressureand
T =cvt
H2. (5.5)
Employing a linear constitutive relation for the elastic porous material andintroducing the following definition of the consolidation ratio
5.4 A comparison with the Terzaghi theory 59
Uz = 1− pw
pw0, (5.6)
which represents the current value of the specimen’s shortening at coor-dinate z divided by the final shortening at the end of the consolidation, eqn.5.6 becomes
Uz = 1−m=infty∑
m=0
4π(2m + 1)
sinπ(2m + 1
2Hexp−(0.5π(2m+1))2T . (5.7)
Note that the consolidation ratio (eqn. 5.7) is a function of the space andtime variables z and t, of the consolidation coefficient cv and sample height2H. Accordingly to the definition previously given, the average consolidationratio results as the average of Uz over the height of the sample, namely
U = 1−m=∞∑
m=0
8π2(2m + 1)2
exp−(0.5π(2m + 1))2T , (5.8)
therefore, the Terzaghi theory predicts, for a given drainage length H, thatthe average consolidation ratio U is a function of time and of the coefficient ofconsolidation cv. It follows that a test of the type (a) (see section 5.2) may beused to evaluate cv. This evaluation is, however, not immediate; it is in factwell-known in geotechnical engineering that when a load step is applied to anoedometer, an immediate displacement occurs, which cannot be related to theTerzaghi theory. This is believed to be only minimal due to the instantaneousdeformation of the sample, but mainly related to ”spurious effects”, such asclosure of possible gaps at the sample/piston contact and movements of themeasurement system. Therefore, two methods are accepted in geotechnicalengineering to eliminate this displacement from results: the Taylor and theCasagrande methods (Holtz & Kovacs 1981).
5.4 A comparison with the Terzaghi theory
By employing the Casagrande method (Holtz & Kovacs 1981), we found theconsolidation coefficient to be 0.37 (mean value; range: 0.01÷2.1; standarddeviation: 0.51)mm2/min. A representative result of one of 12 tests is re-ported in Fig. 5.4, and compared with the predictions of Terzaghi consolida-tion theory for a consolidation coefficient cv = 0.45 mm2/min. In the figure,
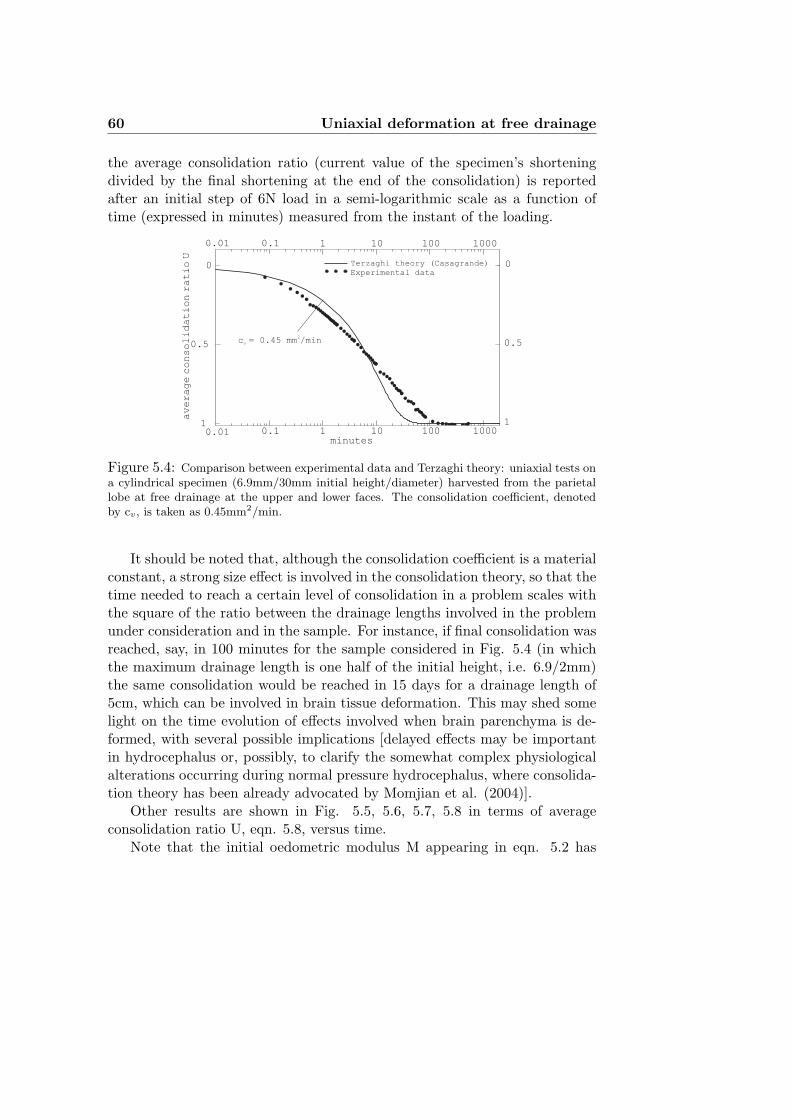
60 Uniaxial deformation at free drainage
the average consolidation ratio (current value of the specimen’s shorteningdivided by the final shortening at the end of the consolidation) is reportedafter an initial step of 6N load in a semi-logarithmic scale as a function oftime (expressed in minutes) measured from the instant of the loading.
0.1 1 10 100 1000
0
0.5
1
0.01 0.1 1 10 100 1000
0
0.5
1
averageconsolidationratioU
Terzaghi theory (Casagrande)
Experimental data
minutes0.01
c = 0.45 mm /minv
2
Figure 5.4: Comparison between experimental data and Terzaghi theory: uniaxial tests ona cylindrical specimen (6.9mm/30mm initial height/diameter) harvested from the parietallobe at free drainage at the upper and lower faces. The consolidation coefficient, denotedby cv, is taken as 0.45mm2/min.
It should be noted that, although the consolidation coefficient is a materialconstant, a strong size effect is involved in the consolidation theory, so that thetime needed to reach a certain level of consolidation in a problem scales withthe square of the ratio between the drainage lengths involved in the problemunder consideration and in the sample. For instance, if final consolidation wasreached, say, in 100 minutes for the sample considered in Fig. 5.4 (in whichthe maximum drainage length is one half of the initial height, i.e. 6.9/2mm)the same consolidation would be reached in 15 days for a drainage length of5cm, which can be involved in brain tissue deformation. This may shed somelight on the time evolution of effects involved when brain parenchyma is de-formed, with several possible implications [delayed effects may be importantin hydrocephalus or, possibly, to clarify the somewhat complex physiologicalalterations occurring during normal pressure hydrocephalus, where consolida-tion theory has been already advocated by Momjian et al. (2004)].
Other results are shown in Fig. 5.5, 5.6, 5.7, 5.8 in terms of averageconsolidation ratio U, eqn. 5.8, versus time.
Note that the initial oedometric modulus M appearing in eqn. 5.2 has
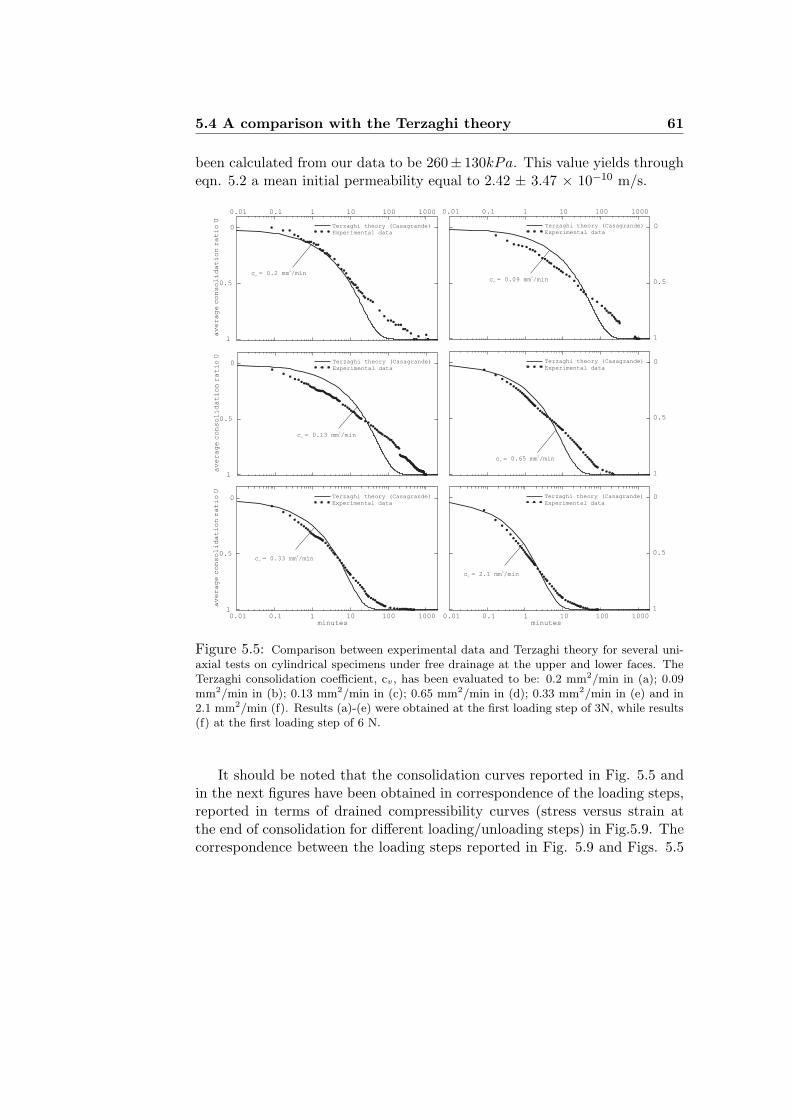
5.4 A comparison with the Terzaghi theory 61
been calculated from our data to be 260± 130kPa. This value yields througheqn. 5.2 a mean initial permeability equal to 2.42 ± 3.47 × 10⁻¹⁰ m/s.
0
0.5
1
0.01 0.1 1 10 100 1000averageconsolidationratioU
Terzaghi theory (Casagrande)
Experimental data
c = 0.2 mm /minv
2
0.01 0.1 1 10 100 1000
0
0.5
1
Terzaghi theory (Casagrande)
Experimental data
c = 0.09 mm /minv
2
0
0.5
1
averageconsolidationratioU
Terzaghi theory (Casagrande)
Experimental data
c = 0.13 mm /minv
2
0
0.5
1
Terzaghi theory (Casagrande)
Experimental data
c = 0.65 mm /minv
2
0.1 1 10 100 1000
0
0.5
1
averageconsolidationratioU
Terzaghi theory (Casagrande)
Experimental data
minutes0.01
c = 0.33 mm /minv
2
0
0.5
1
Terzaghi theory (Casagrande)
Experimental data
c = 2.1 mm /minv
2
0.1 1 10 100 1000minutes
0.01
Figure 5.5: Comparison between experimental data and Terzaghi theory for several uni-axial tests on cylindrical specimens under free drainage at the upper and lower faces. TheTerzaghi consolidation coefficient, cv, has been evaluated to be: 0.2 mm2/min in (a); 0.09mm2/min in (b); 0.13 mm2/min in (c); 0.65 mm2/min in (d); 0.33 mm2/min in (e) and in2.1 mm2/min (f). Results (a)-(e) were obtained at the first loading step of 3N, while results(f) at the first loading step of 6 N.
It should be noted that the consolidation curves reported in Fig. 5.5 andin the next figures have been obtained in correspondence of the loading steps,reported in terms of drained compressibility curves (stress versus strain atthe end of consolidation for different loading/unloading steps) in Fig.5.9. Thecorrespondence between the loading steps reported in Fig. 5.9 and Figs. 5.5
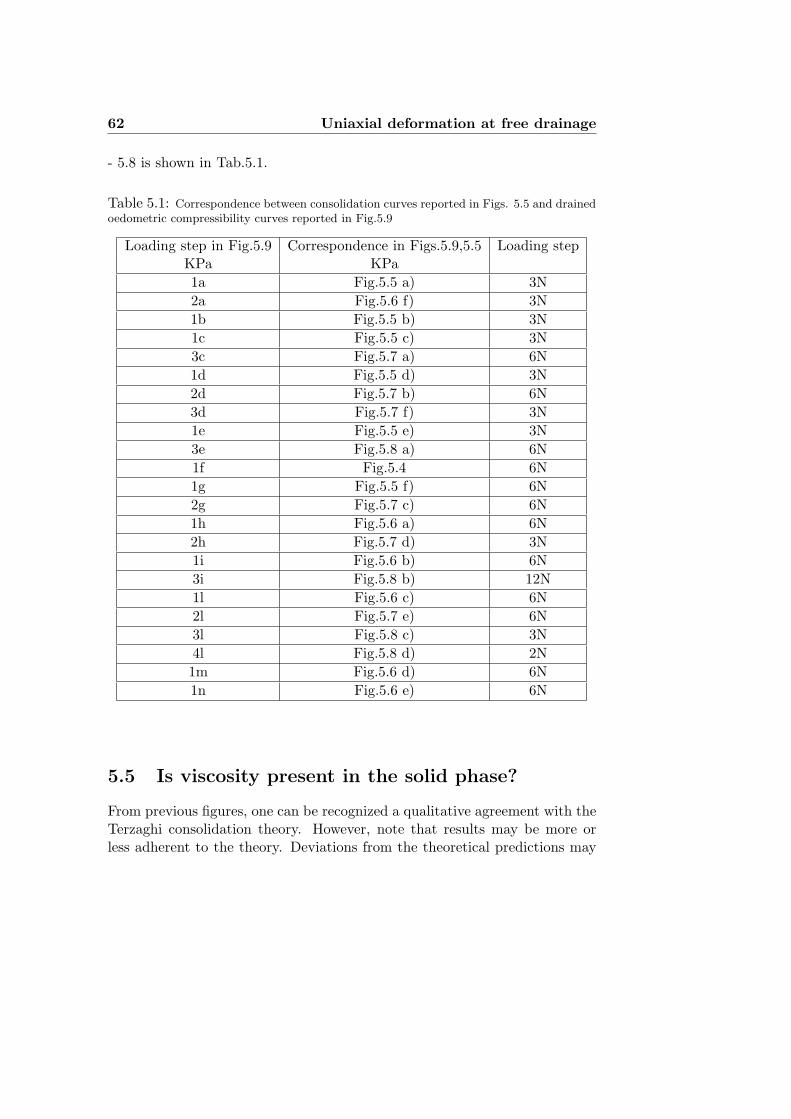
62 Uniaxial deformation at free drainage
- 5.8 is shown in Tab.5.1.
Table 5.1: Correspondence between consolidation curves reported in Figs. 5.5 and drainedoedometric compressibility curves reported in Fig.5.9
Loading step in Fig.5.9 Correspondence in Figs.5.9,5.5 Loading stepKPa KPa1a Fig.5.5 a) 3N2a Fig.5.6 f) 3N1b Fig.5.5 b) 3N1c Fig.5.5 c) 3N3c Fig.5.7 a) 6N1d Fig.5.5 d) 3N2d Fig.5.7 b) 6N3d Fig.5.7 f) 3N1e Fig.5.5 e) 3N3e Fig.5.8 a) 6N1f Fig.5.4 6N1g Fig.5.5 f) 6N2g Fig.5.7 c) 6N1h Fig.5.6 a) 6N2h Fig.5.7 d) 3N1i Fig.5.6 b) 6N3i Fig.5.8 b) 12N1l Fig.5.6 c) 6N2l Fig.5.7 e) 6N3l Fig.5.8 c) 3N4l Fig.5.8 d) 2N1m Fig.5.6 d) 6N1n Fig.5.6 e) 6N
5.5 Is viscosity present in the solid phase?
From previous figures, one can be recognized a qualitative agreement with theTerzaghi consolidation theory. However, note that results may be more orless adherent to the theory. Deviations from the theoretical predictions may
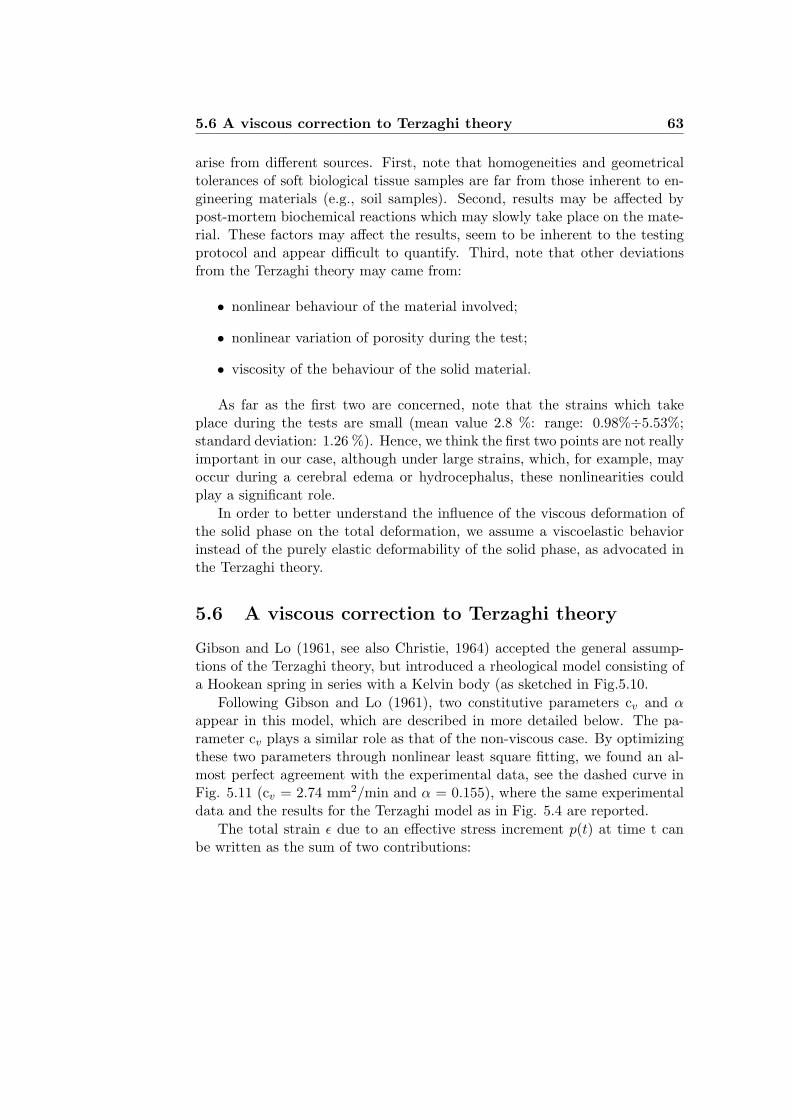
5.6 A viscous correction to Terzaghi theory 63
arise from different sources. First, note that homogeneities and geometricaltolerances of soft biological tissue samples are far from those inherent to en-gineering materials (e.g., soil samples). Second, results may be affected bypost-mortem biochemical reactions which may slowly take place on the mate-rial. These factors may affect the results, seem to be inherent to the testingprotocol and appear difficult to quantify. Third, note that other deviationsfrom the Terzaghi theory may came from:
• nonlinear behaviour of the material involved;
• nonlinear variation of porosity during the test;
• viscosity of the behaviour of the solid material.
As far as the first two are concerned, note that the strains which takeplace during the tests are small (mean value 2.8 %: range: 0.98%÷5.53%;standard deviation: 1.26 %). Hence, we think the first two points are not reallyimportant in our case, although under large strains, which, for example, mayoccur during a cerebral edema or hydrocephalus, these nonlinearities couldplay a significant role.
In order to better understand the influence of the viscous deformation ofthe solid phase on the total deformation, we assume a viscoelastic behaviorinstead of the purely elastic deformability of the solid phase, as advocated inthe Terzaghi theory.
5.6 A viscous correction to Terzaghi theory
Gibson and Lo (1961, see also Christie, 1964) accepted the general assump-tions of the Terzaghi theory, but introduced a rheological model consisting ofa Hookean spring in series with a Kelvin body (as sketched in Fig.5.10.
Following Gibson and Lo (1961), two constitutive parameters cv and αappear in this model, which are described in more detailed below. The pa-rameter cv plays a similar role as that of the non-viscous case. By optimizingthese two parameters through nonlinear least square fitting, we found an al-most perfect agreement with the experimental data, see the dashed curve inFig. 5.11 (cv = 2.74 mm2/min and α = 0.155), where the same experimentaldata and the results for the Terzaghi model as in Fig. 5.4 are reported.
The total strain ε due to an effective stress increment p(t) at time t canbe written as the sum of two contributions:
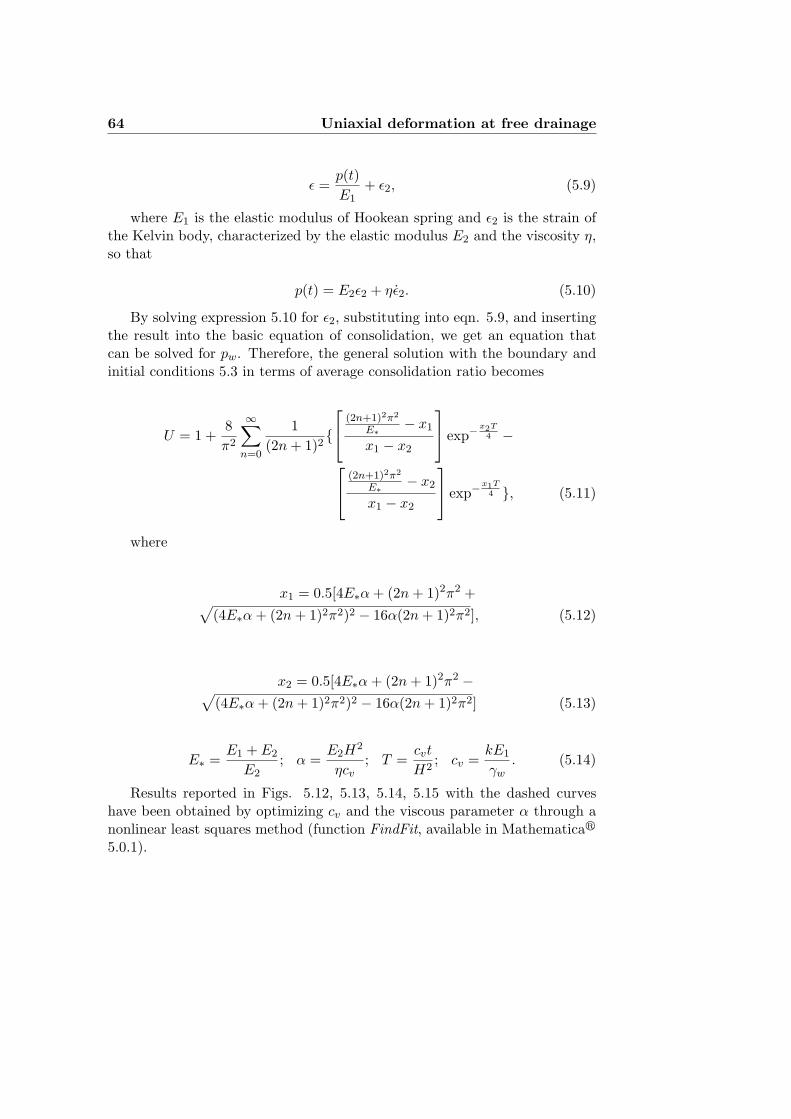
64 Uniaxial deformation at free drainage
ε =p(t)E1
+ ε2, (5.9)
where E1 is the elastic modulus of Hookean spring and ε2 is the strain ofthe Kelvin body, characterized by the elastic modulus E2 and the viscosity η,so that
p(t) = E2ε2 + ηε2. (5.10)
By solving expression 5.10 for ε2, substituting into eqn. 5.9, and insertingthe result into the basic equation of consolidation, we get an equation thatcan be solved for pw. Therefore, the general solution with the boundary andinitial conditions 5.3 in terms of average consolidation ratio becomes
U = 1 +8π2
∞∑
n=0
1(2n + 1)2
{
(2n+1)2π2
E∗ − x1
x1 − x2
exp−
x2T4 −
(2n+1)2π2
E∗ − x2
x1 − x2
exp−
x1T4 }, (5.11)
where
x1 = 0.5[4E∗α + (2n + 1)2π2 +√(4E∗α + (2n + 1)2π2)2 − 16α(2n + 1)2π2], (5.12)
x2 = 0.5[4E∗α + (2n + 1)2π2 −√(4E∗α + (2n + 1)2π2)2 − 16α(2n + 1)2π2] (5.13)
E∗ =E1 + E2
E2; α =
E2H2
ηcv; T =
cvt
H2; cv =
kE1
γw. (5.14)
Results reported in Figs. 5.12, 5.13, 5.14, 5.15 with the dashed curveshave been obtained by optimizing cv and the viscous parameter α through anonlinear least squares method (function FindFit, available in Mathematicar
5.0.1).
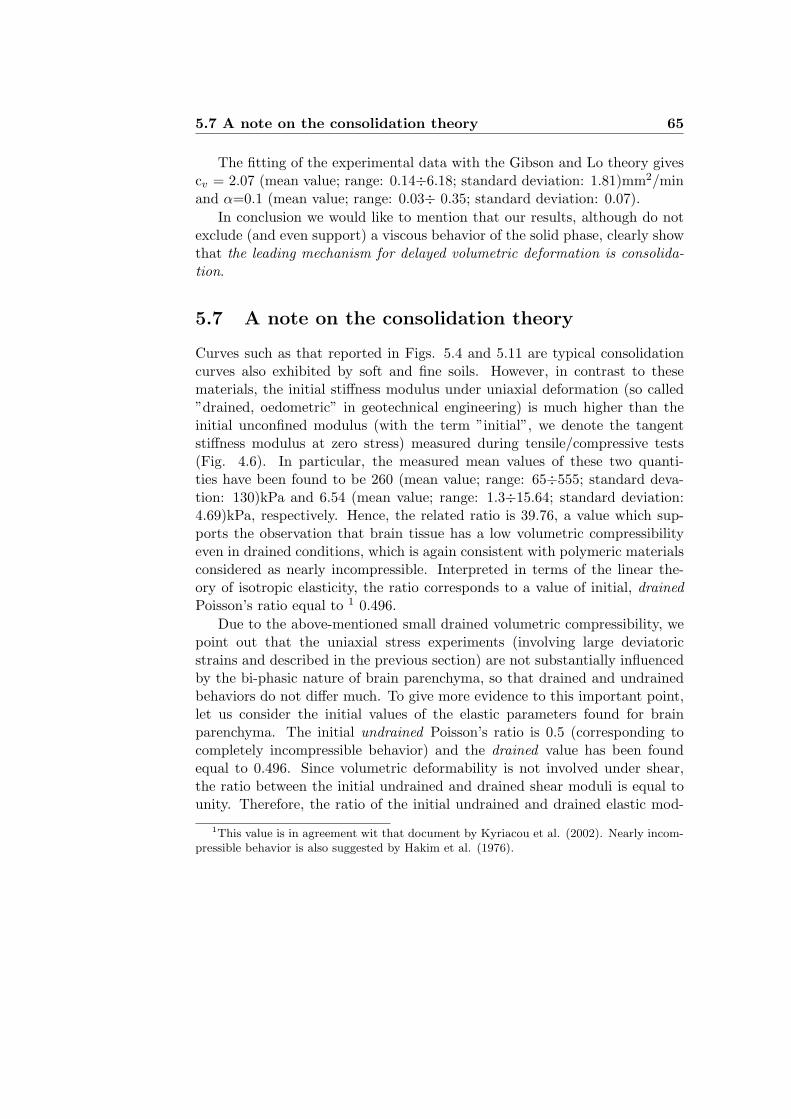
5.7 A note on the consolidation theory 65
The fitting of the experimental data with the Gibson and Lo theory givescv = 2.07 (mean value; range: 0.14÷6.18; standard deviation: 1.81)mm2/minand α=0.1 (mean value; range: 0.03÷ 0.35; standard deviation: 0.07).
In conclusion we would like to mention that our results, although do notexclude (and even support) a viscous behavior of the solid phase, clearly showthat the leading mechanism for delayed volumetric deformation is consolida-tion.
5.7 A note on the consolidation theory
Curves such as that reported in Figs. 5.4 and 5.11 are typical consolidationcurves also exhibited by soft and fine soils. However, in contrast to thesematerials, the initial stiffness modulus under uniaxial deformation (so called”drained, oedometric” in geotechnical engineering) is much higher than theinitial unconfined modulus (with the term ”initial”, we denote the tangentstiffness modulus at zero stress) measured during tensile/compressive tests(Fig. 4.6). In particular, the measured mean values of these two quanti-ties have been found to be 260 (mean value; range: 65÷555; standard deva-tion: 130)kPa and 6.54 (mean value; range: 1.3÷15.64; standard deviation:4.69)kPa, respectively. Hence, the related ratio is 39.76, a value which sup-ports the observation that brain tissue has a low volumetric compressibilityeven in drained conditions, which is again consistent with polymeric materialsconsidered as nearly incompressible. Interpreted in terms of the linear the-ory of isotropic elasticity, the ratio corresponds to a value of initial, drainedPoisson’s ratio equal to 1 0.496.
Due to the above-mentioned small drained volumetric compressibility, wepoint out that the uniaxial stress experiments (involving large deviatoricstrains and described in the previous section) are not substantially influencedby the bi-phasic nature of brain parenchyma, so that drained and undrainedbehaviors do not differ much. To give more evidence to this important point,let us consider the initial values of the elastic parameters found for brainparenchyma. The initial undrained Poisson’s ratio is 0.5 (corresponding tocompletely incompressible behavior) and the drained value has been foundequal to 0.496. Since volumetric deformability is not involved under shear,the ratio between the initial undrained and drained shear moduli is equal tounity. Therefore, the ratio of the initial undrained and drained elastic mod-
1This value is in agreement wit that document by Kyriacou et al. (2002). Nearly incom-pressible behavior is also suggested by Hakim et al. (1976).
66 Uniaxial deformation at free drainage
uli results equal to (1+0.5)/(1+0.496)=1.00267, so that the two moduli arepractically identical and uniaxial stress test becomes rather insensitive to thedrainage conditions.
The above finding is important since it reconciles different approaches tomechanical modeling of brain parenchyma: due to the fact that volumetricdrained compressibility is small when compared to the unconfined deforma-bility, consolidation theory becomes dominant in problems that involve highvalues of mean stresses applied for considerable time (as, for instance, duringhydrocephalus or deformations accompanying slow cranial movements), whileit plays the role of, say, a ”correction” to a single phase nonlinear theory, whenlarge deviatoric deformations occur (as, for instance, during convolutional de-velopment).
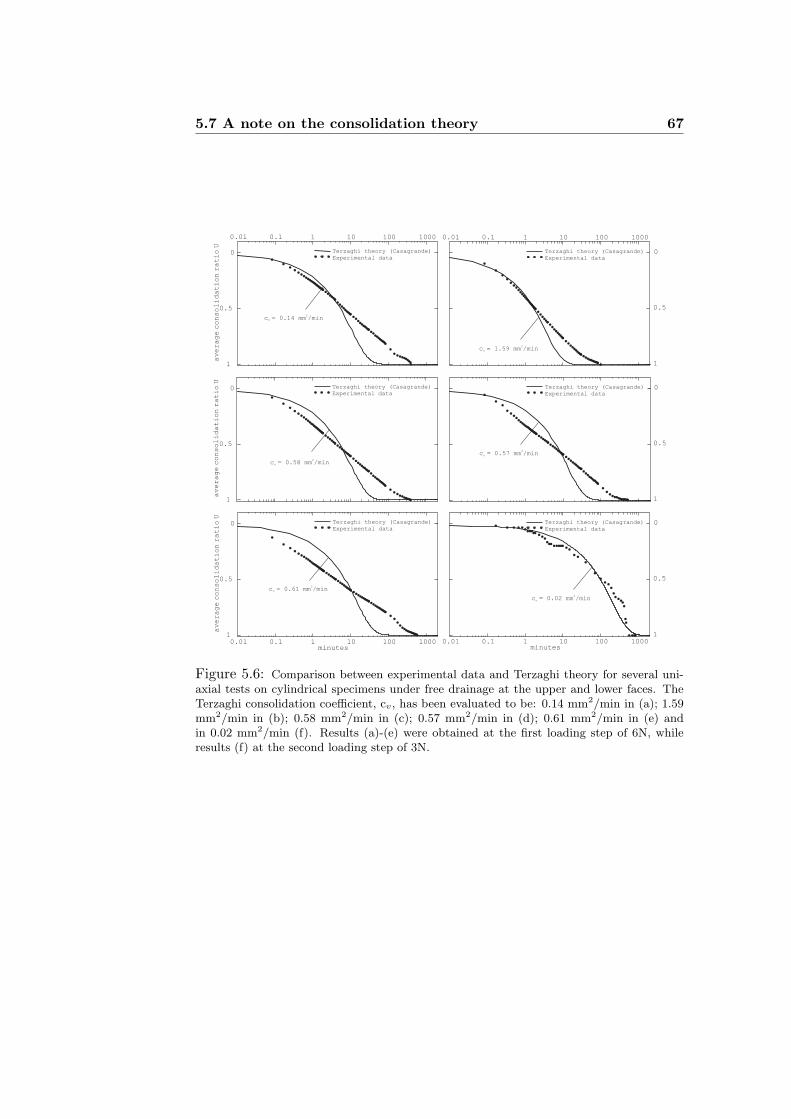
5.7 A note on the consolidation theory 67
0
0.5
1
0.01 0.1 1 10 100 1000
averageconsolidationratioU
Terzaghi theory (Casagrande)
Experimental data
c = 0.14 mm /minv
2
0.01 0.1 1 10 100 1000
0
0.5
1
Terzaghi theory (Casagrande)
Experimental data
c = 1.59 mm /minv
2
0
0.5
1
averageconsolidationratioU
Terzaghi theory (Casagrande)
Experimental data
c = 0.58 mm /minv
2
0
0.5
1
Terzaghi theory (Casagrande)
Experimental data
c = 0.57 mm /minv
2
0.1 1 10 100 1000
0
0.5
1
averageconsolidationratioU
Terzaghi theory (Casagrande)
Experimental data
minutes0.01
c = 0.61 mm /minv
2
0.1 1 10 100 1000
0
0.5
1
Terzaghi theory (Casagrande)
Experimental data
minutes0.01
c = 0.02 mm /minv
2
Figure 5.6: Comparison between experimental data and Terzaghi theory for several uni-axial tests on cylindrical specimens under free drainage at the upper and lower faces. TheTerzaghi consolidation coefficient, cv, has been evaluated to be: 0.14 mm2/min in (a); 1.59mm2/min in (b); 0.58 mm2/min in (c); 0.57 mm2/min in (d); 0.61 mm2/min in (e) andin 0.02 mm2/min (f). Results (a)-(e) were obtained at the first loading step of 6N, whileresults (f) at the second loading step of 3N.
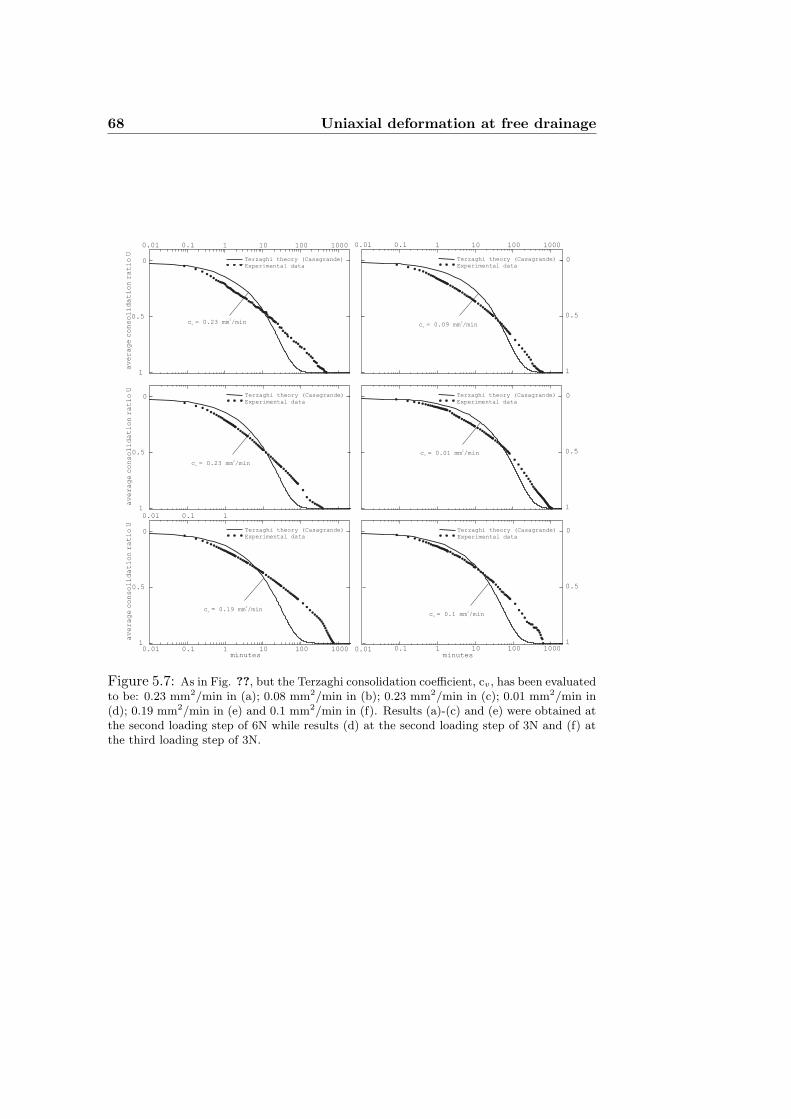
68 Uniaxial deformation at free drainage
0
0.5
1
0.01 0.1 1 10 100 1000
averageconsolidationratioU
Terzaghi theory (Casagrande)
Experimental data
c = 0.23 mm /minv
2
0.01 0.1 1 10 100 1000
0
0.5
1
Terzaghi theory (Casagrande)
Experimental data
c = 0.09 mm /minv
2
0
0.5
1
averageconsolidationratioU
Terzaghi theory (Casagrande)
Experimental data
c = 0.23 mm /minv
2
0
0.5
1
Terzaghi theory (Casagrande)
Experimental data
c = 0.01 mm /minv
2
0.1 1 10 100 1000
0
0.5
1
0.01 0.1 1
averageconsolidationratioU
Terzaghi theory (Casagrande)
Experimental data
minutes0.01
c = 0.19 mm /minv
2
0.1 1 10 100 1000
0
0.5
1
Terzaghi theory (Casagrande)
Experimental data
minutes0.01
c = 0.1 mm /minv
2
Figure 5.7: As in Fig. ??, but the Terzaghi consolidation coefficient, cv, has been evaluatedto be: 0.23 mm2/min in (a); 0.08 mm2/min in (b); 0.23 mm2/min in (c); 0.01 mm2/min in(d); 0.19 mm2/min in (e) and 0.1 mm2/min in (f). Results (a)-(c) and (e) were obtained atthe second loading step of 6N while results (d) at the second loading step of 3N and (f) atthe third loading step of 3N.
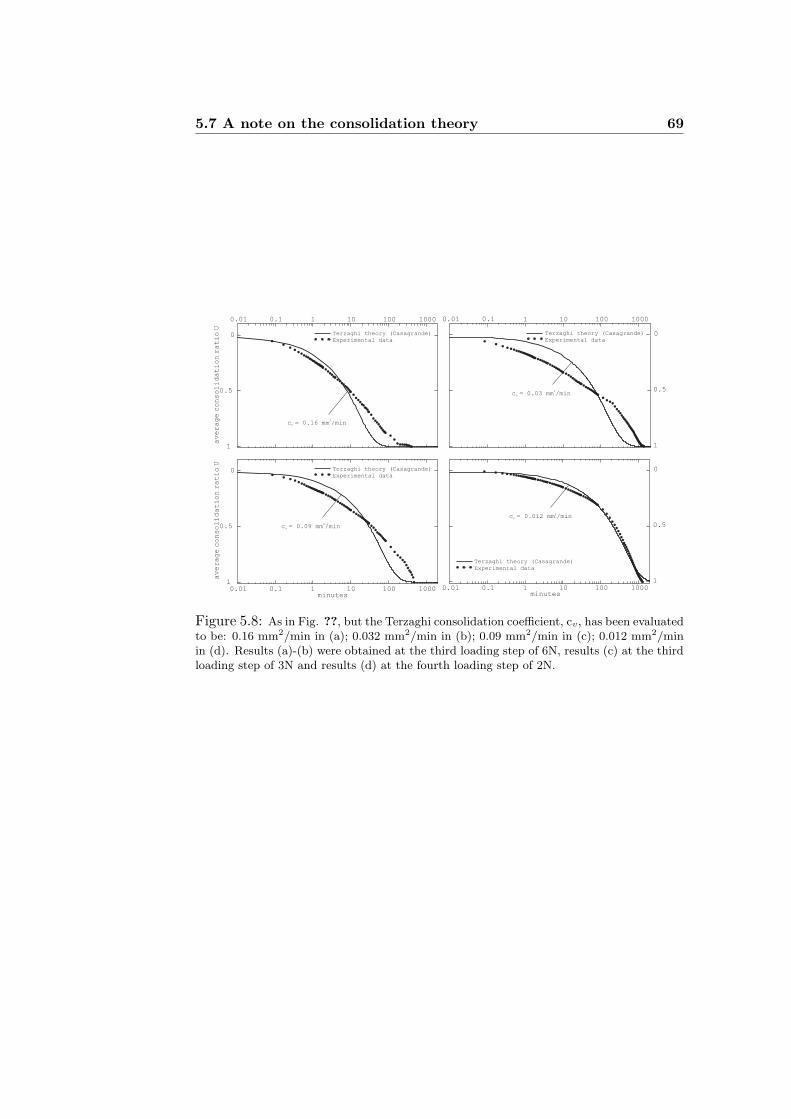
5.7 A note on the consolidation theory 69
0
0.5
1
0.01 0.1 1 10 100 1000
averageconsolidationratioU
Terzaghi theory (Casagrande)
Experimental data
c = 0.16 mm /minv
2
0.01 0.1 1 10 100 1000
0
0.5
1
Terzaghi theory (Casagrande)
Experimental data
c = 0.03 mm /minv
2
0.1 1 10 100 1000
0
0.5
1
averageconsolidationratioU
Terzaghi theory (Casagrande)
Experimental data
minutes0.01
c = 0.09 mm /minv
2
0.1 1 10 100 1000
0
0.5
1
Terzaghi theory (Casagrande)
Experimental data
minutes0.01
c = 0.012 mm /minv
2
Figure 5.8: As in Fig. ??, but the Terzaghi consolidation coefficient, cv, has been evaluatedto be: 0.16 mm2/min in (a); 0.032 mm2/min in (b); 0.09 mm2/min in (c); 0.012 mm2/minin (d). Results (a)-(b) were obtained at the third loading step of 6N, results (c) at the thirdloading step of 3N and results (d) at the fourth loading step of 2N.
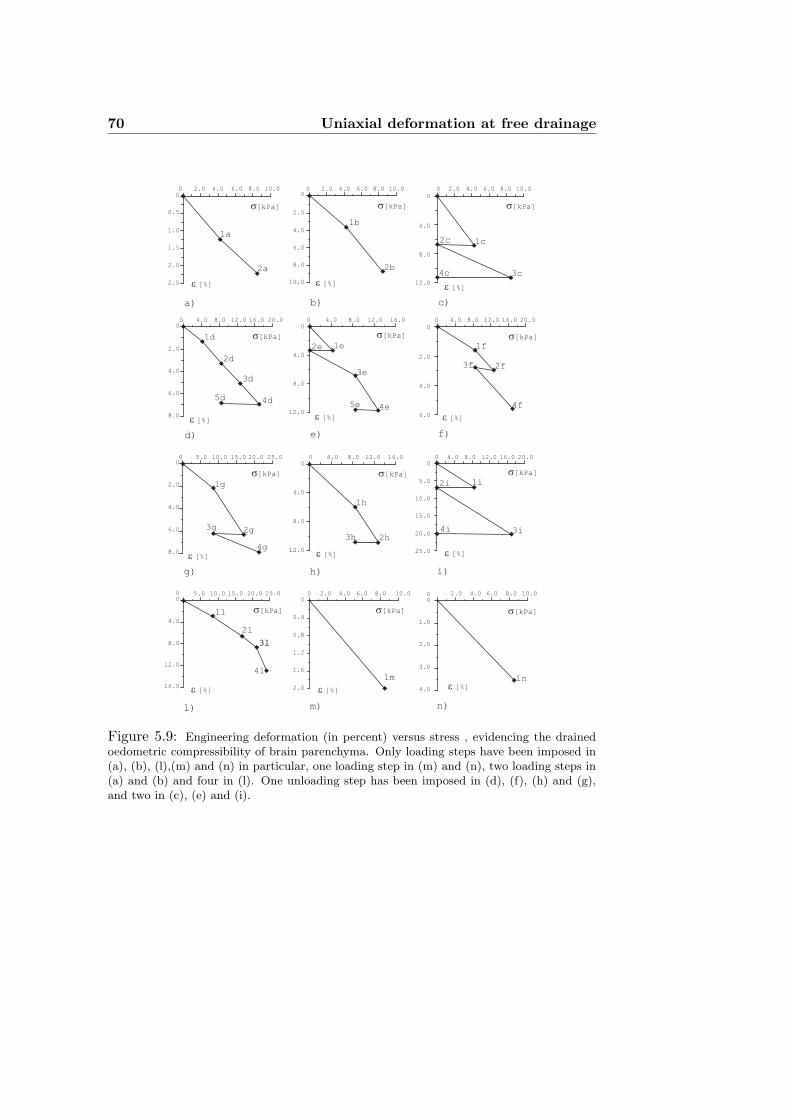
70 Uniaxial deformation at free drainage
0
2.0
4.0
6.0
8.0
10.0
s[kPa]
e [%]
0 2.0 4.0 8.06.0 10.0
a)
0
2.0
4.0
6.0
8.0
0 4.0 8.0 16.012.0 20.0
s[kPa]
e [%]
b)
0 4.0 8.0 16.012.0
0
4.0
8.0
12.0
s[kPa]
e [%]
e)
0 4.0 8.0 16.012.0
0
2.0
4.0
6.0
20.0
s[kPa]
e [%]
f)
s[kPa]
e [%]
0 2.0 4.0 8.06.0 10.00
0.5
1.0
1.5
2.0
2.5
0
4.0
8.0
12.0
0 2.0 4.0 8.06.0 10.0
s[kPa]
e [%]
c)
d)
0
2.0
4.0
8.0
0 5.0 10.0 25.020.0
6.0
15.0
s[kPa]
e [%]
0 4.0 8.0 16.012.00
4.0
8.0
12.0
s[kPa]
e [%]
0 4.0 8.0 16.012.0 20.00
5.0
10.0
15.0
20.0
25.0
s[kPa]
e [%]
0 5.0 10.0 20.015.0 25.00
4.0
8.0
12.0
16.0
s[kPa]
e [%]
l)
h) i)g)
1a
2a
1b
2b
1c2c
3c4c
1d
2d
3d
4d
1e2e
3e
4e
5d5e
1f
2f3f
4f
1g
2g3g
4g
1h
2h3h
1i2i
3i4i
1l
2l
3l
4l
0 2.0 4.0 6.0 8.0 10.00
0.4
0.8
1.2
1.6
2.0
s[kPa]
e [%]
1m
m) n)
0 2.0 4.0 6.0 8.0 10.00
1.0
2.0
3.0
4.0 e [%]
s[kPa]
1n
3l
Figure 5.9: Engineering deformation (in percent) versus stress , evidencing the drainedoedometric compressibility of brain parenchyma. Only loading steps have been imposed in(a), (b), (l),(m) and (n) in particular, one loading step in (m) and (n), two loading steps in(a) and (b) and four in (l). One unloading step has been imposed in (d), (f), (h) and (g),and two in (c), (e) and (i).
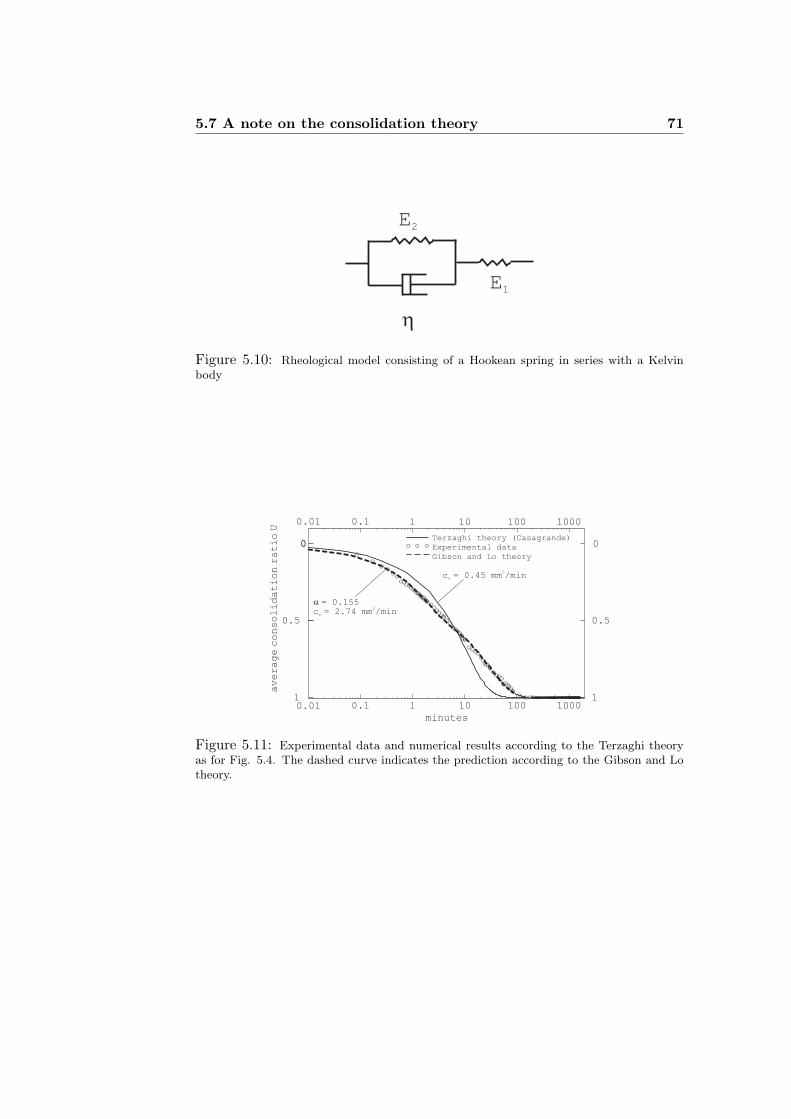
5.7 A note on the consolidation theory 71
E2
h
E1
Figure 5.10: Rheological model consisting of a Hookean spring in series with a Kelvinbody
0.1 1 10 100 1000
minutes
0
0.5
1
averageconsolidationratioU
0.01 0.1 1 10 100 1000
0
0.5
1
Terzaghi theory (Casagrande)
Experimental data
Gibson and Lo theory
0.01
0
c = 0.45 mm /minv
2
a = 0.155c = 2.74 mm /minv
2
Figure 5.11: Experimental data and numerical results according to the Terzaghi theoryas for Fig. 5.4. The dashed curve indicates the prediction according to the Gibson and Lotheory.
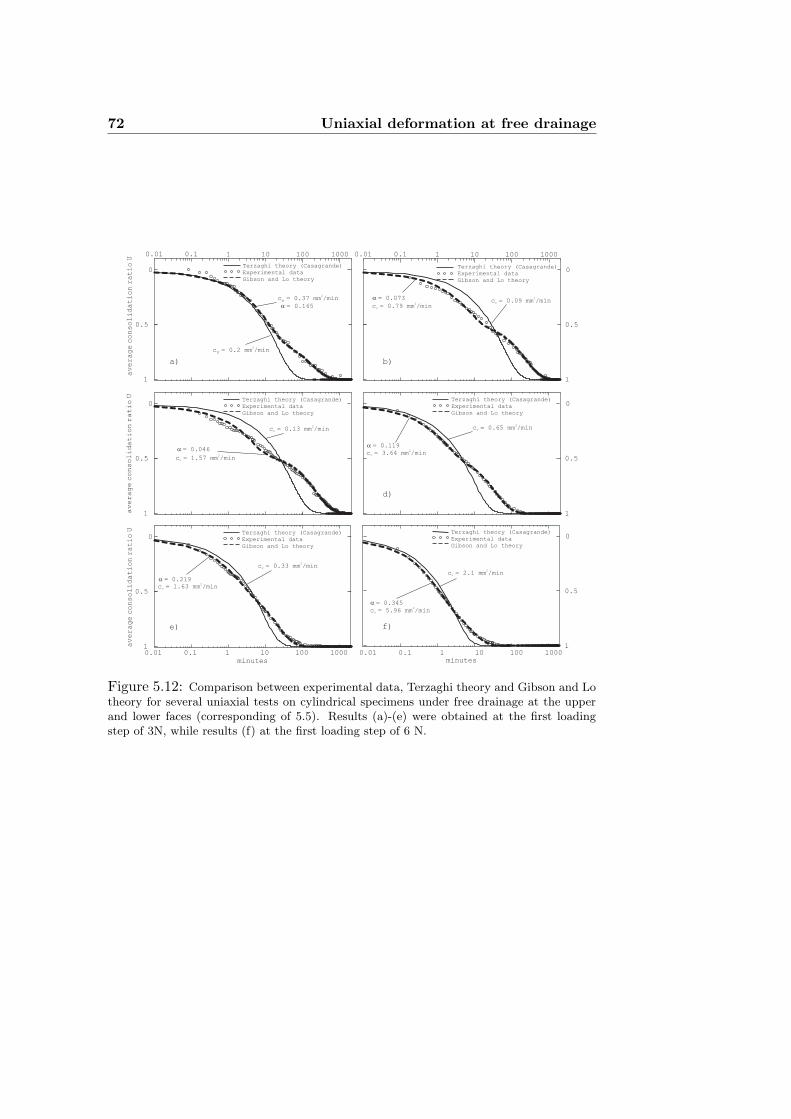
72 Uniaxial deformation at free drainage
Terzaghi theory (Casagrande)
Experimental data
Gibson and Lo theory
0
0.5
1
averageconsolidationratioU
0.01 0.1 1 10 100 1000
c = 0.2 mm /minv2
a = 0.165
c = 0.37 mm /minv2
a)
0.01 0.1 1 10 100 1000
0
0.5
1
c = 0.09 mm /minv
2a = 0.073
c = 0.79 mm /minv
2
b)
Terzaghi theory (Casagrande)
Experimental data
Gibson and Lo theory
0
0.5
1
c = 0.65 mm /minv
2
a = 0.119
c = 3.64 mm /minv
2
d)
Terzaghi theory (Casagrande)
Experimental data
Gibson and Lo theory
averageconsolidationratioU
c = 0.33 mm /minv
2
a = 0.219
c = 1.63 mm /minv
2
0.1 1 10 100 1000
minutes
0
0.5
10.01
e)
Terzaghi theory (Casagrande)
Experimental data
Gibson and Lo theory
minutes
0
0.5
1
c = 2.1 mm /minv
2
a = 0.345
c = 5.96 mm /minv
2
f)
Terzaghi theory (Casagrande)
Experimental data
Gibson and Lo theory
0.1 1 10 100 10000.01
0
0.5
1averageconsolidationratioU
Terzaghi theory (Casagrande)
Experimental data
Gibson and Lo theory
c = 0.13 mm /minv
2
a = 0.046
c = 1.57 mm /minv
2
Figure 5.12: Comparison between experimental data, Terzaghi theory and Gibson and Lotheory for several uniaxial tests on cylindrical specimens under free drainage at the upperand lower faces (corresponding of 5.5). Results (a)-(e) were obtained at the first loadingstep of 3N, while results (f) at the first loading step of 6 N.
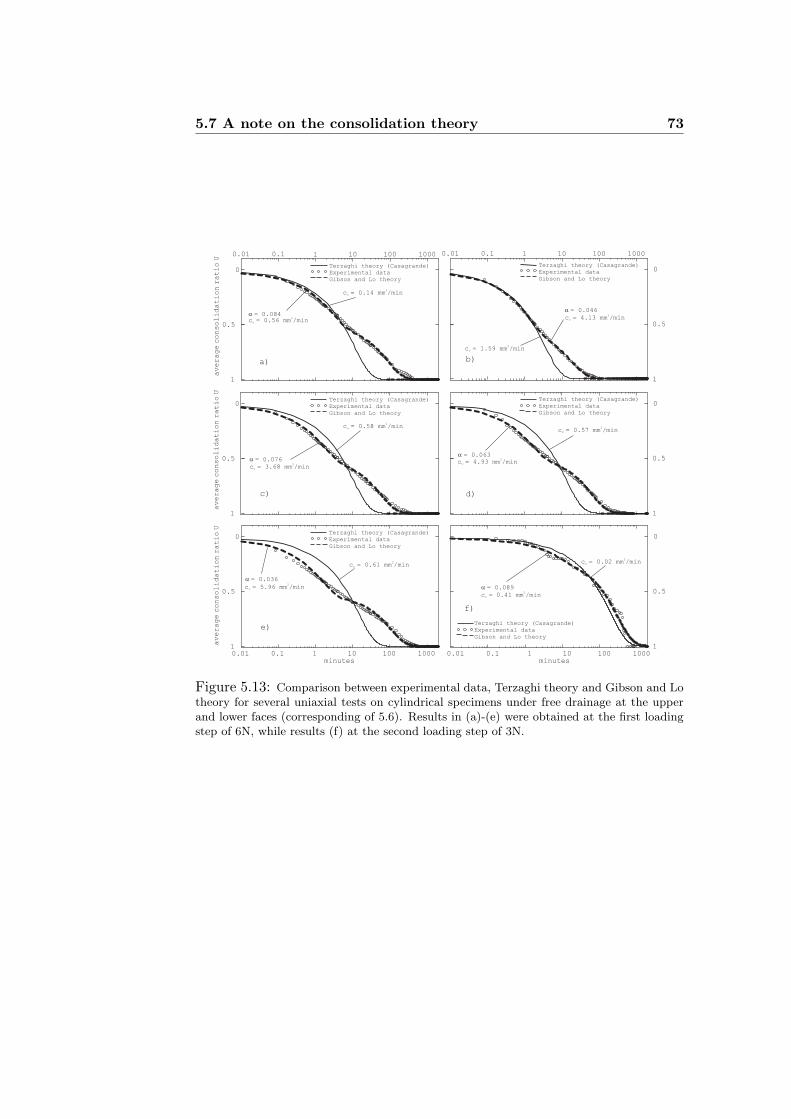
5.7 A note on the consolidation theory 73
0
0.5
1
averageconsolidationratioU
0.01 0.1 1 10 100 1000
c = 0.14 mm /minv
2
a = 0.084c = 0.56 mm /minv
2
a)
Terzaghi theory (Casagrande)
Experimental data
Gibson and Lo theory
0
0.5
1
averageconsolidationratioU
c = 0.58 mm /minv
2
a = 0.076
c = 3.68 mm /minv
2
c)
Terzaghi theory (Casagrande)
Experimental data
Gibson and Lo theory
0.01 0.1 1 10 100 1000
0
0.5
1
c = 1.59 mm /minv
2
a = 0.046
c = 4.13 mm /minv
2
b)
Terzaghi theory (Casagrande)
Experimental data
Gibson and Lo theory
0
0.5
1
c = 0.57 mm /minv
2
a = 0.063c = 4.93 mm /minv
2
d)
Terzaghi theory (Casagrande)
Experimental data
Gibson and Lo theory
0.1 1 10 100 1000
0
0.5
1
averageconsolidationratioU
0.01
c = 0.61 mm /minv
2
a = 0.036
c = 5.96 mm /minv
2
e)
Terzaghi theory (Casagrande)
Experimental data
Gibson and Lo theory
minutes
0
0.5
1
c = 0.02 mm /minv
2
a = 0.089
c = 0.41 mm /minv
2
f)
Terzaghi theory (Casagrande)
Experimental data
Gibson and Lo theory
0.1 1 10 100 10000.01minutes
Figure 5.13: Comparison between experimental data, Terzaghi theory and Gibson and Lotheory for several uniaxial tests on cylindrical specimens under free drainage at the upperand lower faces (corresponding of 5.6). Results in (a)-(e) were obtained at the first loadingstep of 6N, while results (f) at the second loading step of 3N.
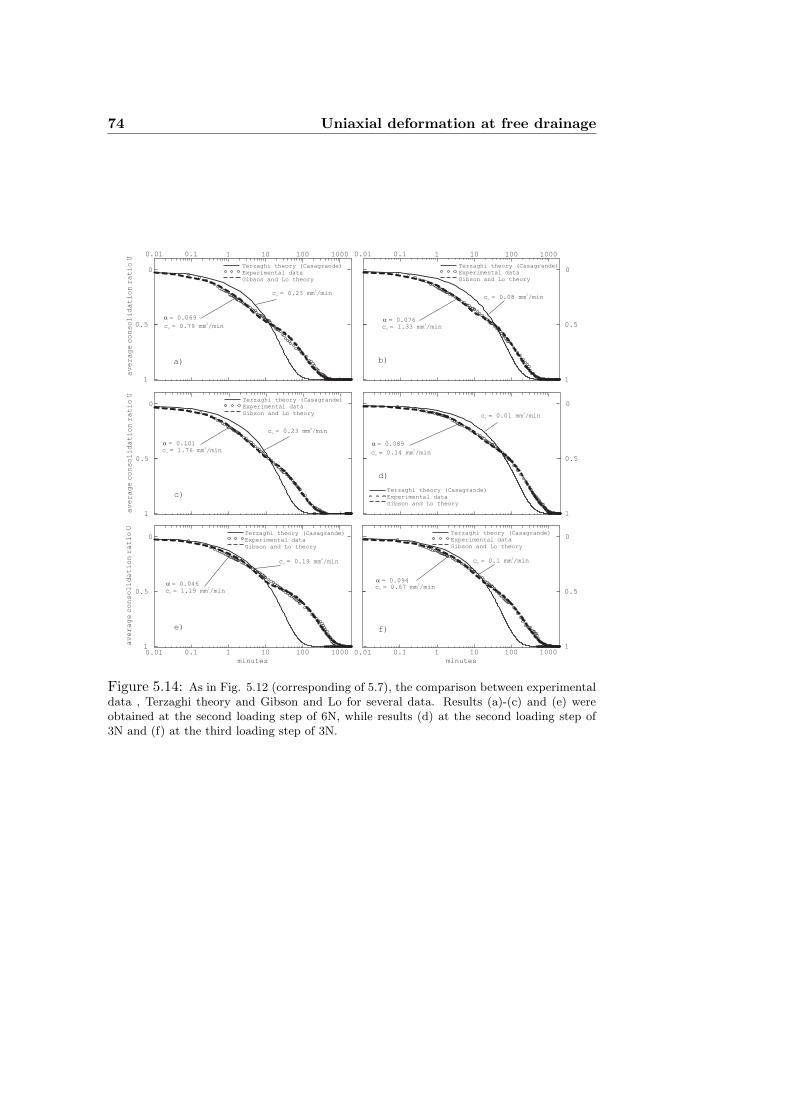
74 Uniaxial deformation at free drainage
0
0.5
1
averageconsolidationratioU
0.01 0.1 1 10 100 1000
c = 0.23 mm /minv
2
a = 0.069
c = 0.79 mm /minv
2
0.01 0.1 1 10 100 1000
0
0.5
1
c = 0.08 mm /minv
2
a = 0.076c = 1.33 mm /minv
2
0
0.5
1averageconsolidationratioU
c = 0.23 mm /minv
2
a = 0.101c = 1.76 mm /minv
2
0
0.5
1
c = 0.01 mm /minv
2
a = 0.089
c = 0.14 mm /minv
2
0.1 1 10 100 1000
minutes
0
0.5
1
averageconsolidationratioU
0.01
a = 0.046
c = 1.19 mm /minv
2
c = 0.19 mm /minv
2
a) b)
c)
d)
e)
Terzaghi theory (Casagrande)
Experimental data
Gibson and Lo theory
Terzaghi theory (Casagrande)
Experimental data
Gibson and Lo theory
Terzaghi theory (Casagrande)
Experimental data
Gibson and Lo theory
Terzaghi theory (Casagrande)
Experimental data
Gibson and Lo theory
Terzaghi theory (Casagrande)
Experimental data
Gibson and Lo theory
0.1 1 10 100 1000
minutes
0
0.5
10.01
c = 0.1 mm /minv
2
a = 0.094c = 0.67 mm /minv
2
f)
Terzaghi theory (Casagrande)
Experimental data
Gibson and Lo theory
Figure 5.14: As in Fig. 5.12 (corresponding of 5.7), the comparison between experimentaldata , Terzaghi theory and Gibson and Lo for several data. Results (a)-(c) and (e) wereobtained at the second loading step of 6N, while results (d) at the second loading step of3N and (f) at the third loading step of 3N.
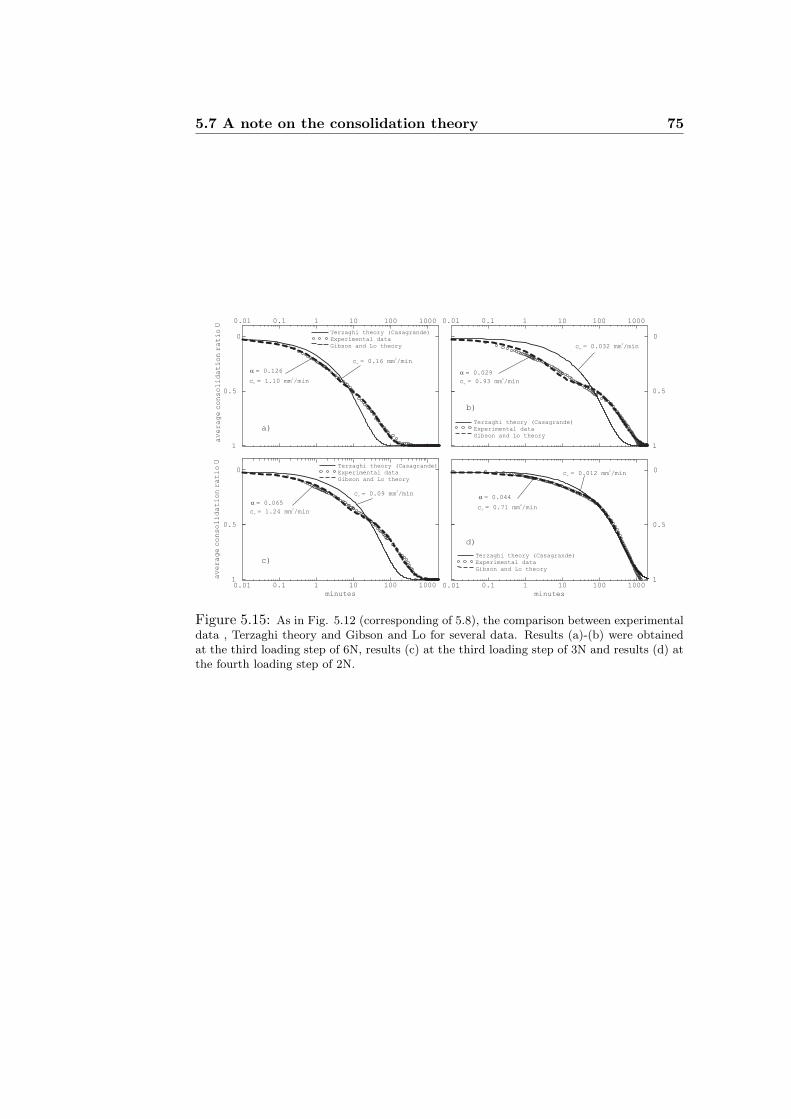
5.7 A note on the consolidation theory 75
0
0.5
1
averageconsolidationratioU
0.01 0.1 1 10 100 1000
c = 0.16 mm /minv
2
a = 0.126
c = 1.10 mm /minv
2
a)
Terzaghi theory (Casagrande)
Experimental data
Gibson and Lo theory
0.1 1 10
minutes
0
0.5
1averageconsolidationratioU
0.01
c = 0.09 mm /minv
2
a = 0.065
c = 1.24 mm /minv
2
100 1000
c)
Terzaghi theory (Casagrande)
Experimental data
Gibson and Lo theory
0.01 0.1 1 10 100 1000
0
0.5
1
c = 0.032 mm /minv
2
a = 0.029
c = 0.93 mm /minv
2
b)
Terzaghi theory (Casagrande)
Experimental data
Gibson and Lo theory
0.1 1 10 100 1000
minutes
0
0.5
10.01
c = 0.012 mm /minv
2
a = 0.044
c = 0.71 mm /minv
2
d)
Terzaghi theory (Casagrande)
Experimental data
Gibson and Lo theory
Figure 5.15: As in Fig. 5.12 (corresponding of 5.8), the comparison between experimentaldata , Terzaghi theory and Gibson and Lo for several data. Results (a)-(b) were obtainedat the third loading step of 6N, results (c) at the third loading step of 3N and results (d) atthe fourth loading step of 2N.

76 Uniaxial deformation at free drainage
Chapter 6
Conclusion
Brain tissue have been found to present distinctive mechanical properties,making them qualitatively similar to filled elastomers under cyclic uniax-ial stress and to fine soils obeying consolidation theory under oedometricconditions. However, unlike soils and again similarly to elastomers, the ra-tio between initial oedometric modulus and initial elastic modulus is large.Our results suggest that mechanical modeling of brain tissue should involvea porosity model to account for the intrinsic porosity of the brain matter,at least in situations where substantial volumetric deformations are involved(during for instance hydrocephalus). Moreover, the drained behavior of brainparenchyma should be treated as a nearly incompressible, nonlinear material,capable of permanent deformations and qualitatively similar to rubber-likematerials. Although in the present thesis we did not attempt to develop aconstitutive model for the description of the mechanical behaviour of braintissue under arbitrary dformations, we have shown that this model shouldreduce to Terzaghi theory, when small deformations occur due to the consoli-dation, and to a theory describing nearly incompressible rubber-like materials,when large deviatoric deformation are involved.
77

78 Conclusion
Appendix A
Additional results from
compression/tension tests
A.1 Introduction
In this chapter additional results about uniaxial cyclic tests are reported.
A.2 Mechanical Brain behavior
Several results of cyclic behavior before damage initiation are shown in theFigure below, reported in terms of nominal stress (force divided by the initialcross-section area of the specimen), versus stretch (current specimen lengthdivided by the initial length).
A.2.1 Specimens harvested from corpus callosum
79
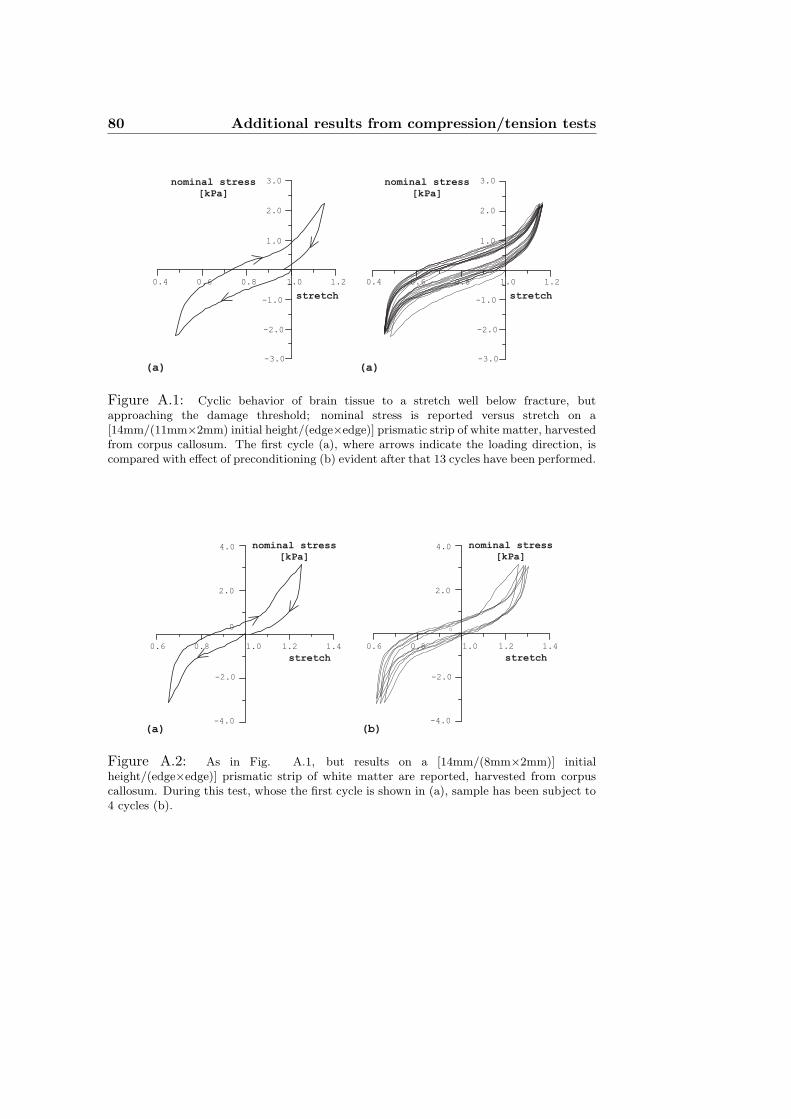
80 Additional results from compression/tension tests
3.0
1.0
-1.0
-2.0
2.0
-3.0
1.21.00.80.60.4
stretch
nominal stress
[kPa]
(a)
3.0
1.0
-1.0
-2.0
2.0
-3.0
1.21.00.80.60.4
stretch
nominal stress
[kPa]
(a)
Figure A.1: Cyclic behavior of brain tissue to a stretch well below fracture, butapproaching the damage threshold; nominal stress is reported versus stretch on a[14mm/(11mm×2mm) initial height/(edge×edge)] prismatic strip of white matter, harvestedfrom corpus callosum. The first cycle (a), where arrows indicate the loading direction, iscompared with effect of preconditioning (b) evident after that 13 cycles have been performed.
0.6 0.8 1.2 1.4
nominal stress
[kPa]
stretch
4.0
0
-2.0
2.0
-4.0
(b)
1.00.6 0.8 1.2 1.4
nominal stress
[kPa]
stretch
4.0
-2.0
2.0
-4.0
(a)
1.0
0
Figure A.2: As in Fig. A.1, but results on a [14mm/(8mm×2mm)] initialheight/(edge×edge)] prismatic strip of white matter are reported, harvested from corpuscallosum. During this test, whose the first cycle is shown in (a), sample has been subject to4 cycles (b).

A.2 Mechanical Brain behavior 81
A.2.2 Specimens harvested from frontal lobe in frontal direc-tion
stretch
nominal stress
[kPa]
0.7 0.8 0.9 1.0 1.1 1.2
0.8
0.4
0
-0.4
-0.8(a)
stretch
nominal stress
[kPa]
0.7 0.8 0.9 1.0 1.1 1.2
0.8
0.4
0
-0.4
-0.8(b)
Figure A.3: As in Fig. A.1, but results on a [ 14mm/ 8mm initial height/edge] prismaticspecimen of white matter are reported, harvested from the frontal lobe in frontal direction.During this test, whose the first cycle is shown in (a), sample has been subject to 15 cycles(b).
2.0
1.0
-1.0
-2.0
0.8 1.0 1.2 1.4 1.6 1.8
0
stretch
nominal stress
[kPa]
(b)
2.0
1.0
-1.0
-2.0
0.8 1.0 1.2 1.4 1.6 1.8
0
stretch
nominal stress
[kPa]
(a)
Figure A.4: As in Fig. A.1, but results on a [ 14mm/ 9mm initial height/edge] frontalspecimen of white matter are reported, harvested from frontal lobe in frontal direction.During this test, whose the first cycle is shown in (a), sample has been subject to 8 cycles(b).
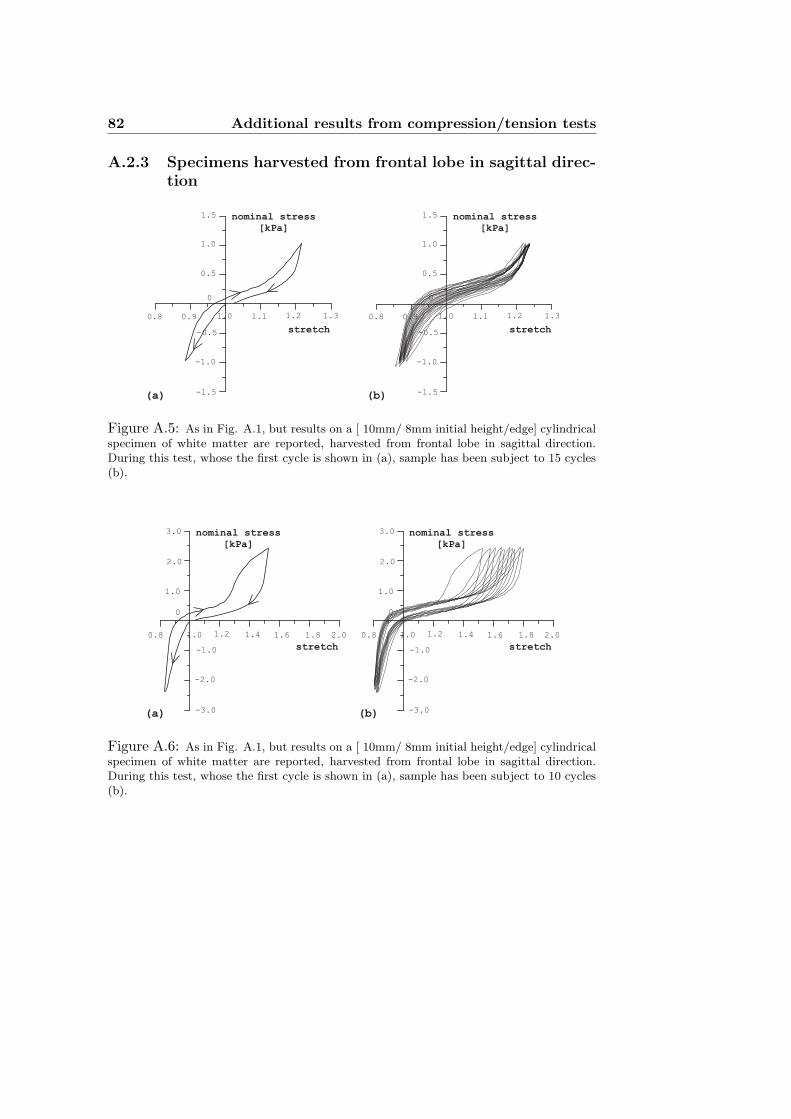
82 Additional results from compression/tension tests
A.2.3 Specimens harvested from frontal lobe in sagittal direc-tion
stretch
nominal stress
[kPa]
1.21.11.00.8 1.30.9
1.0
0.5
-1.5
-1.0
-0.5
1.5
0
(a)
stretch
nominal stress
[kPa]
(b)
1.21.11.00.8 1.30.9
1.0
0.5
-1.5
-1.0
-0.5
1.5
0
Figure A.5: As in Fig. A.1, but results on a [ 10mm/ 8mm initial height/edge] cylindricalspecimen of white matter are reported, harvested from frontal lobe in sagittal direction.During this test, whose the first cycle is shown in (a), sample has been subject to 15 cycles(b).
1.6
stretch
1.41.2
nominal stress
[kPa]
3.0
2.0
1.0
-3.0
-2.0
-1.0
1.00.8 1.8 2.0
(b)
1.6
stretch
1.41.2
nominal stress
[kPa]
3.0
2.0
1.0
-3.0
-2.0
-1.0
1.00.8 1.8 2.0
(a)
0 0
Figure A.6: As in Fig. A.1, but results on a [ 10mm/ 8mm initial height/edge] cylindricalspecimen of white matter are reported, harvested from frontal lobe in sagittal direction.During this test, whose the first cycle is shown in (a), sample has been subject to 10 cycles(b).
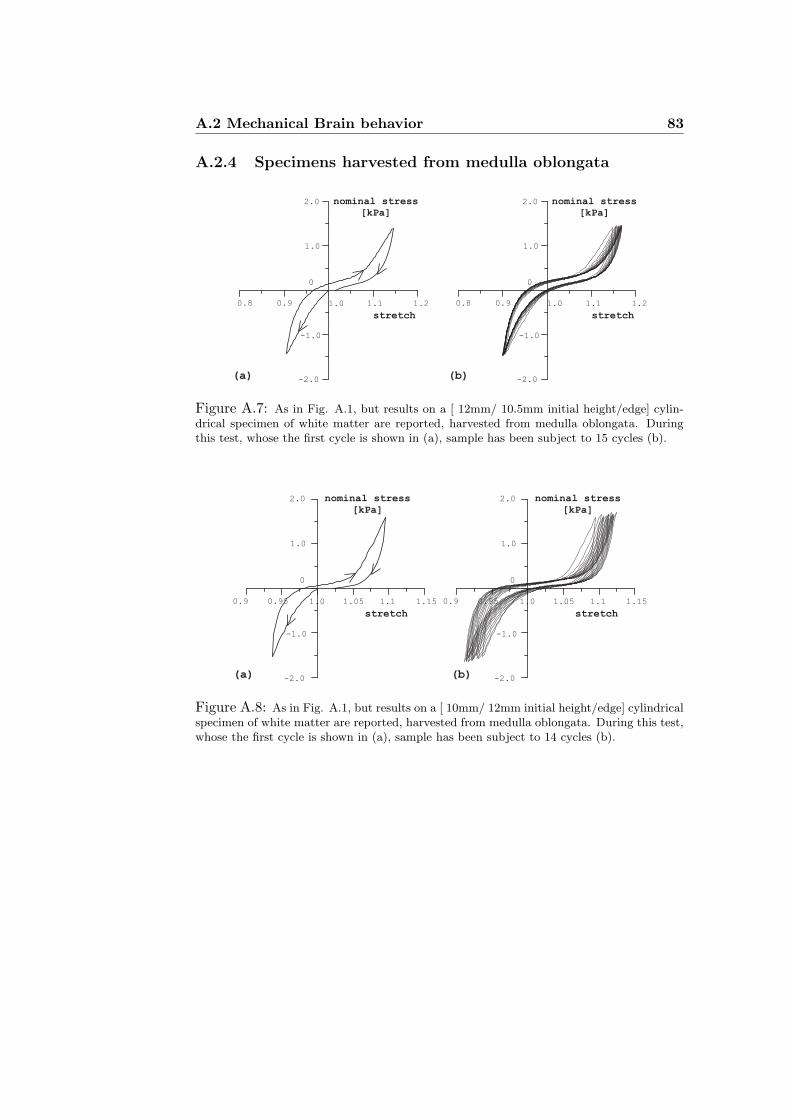
A.2 Mechanical Brain behavior 83
A.2.4 Specimens harvested from medulla oblongata
2.0
1.0
-1.0
0
-2.0
1.21.11.00.90.8
stretch
nominal stress
[kPa]
(b)
2.0
1.0
-1.0
0
-2.0
1.21.11.00.90.8
stretch
nominal stress
[kPa]
(a)
Figure A.7: As in Fig. A.1, but results on a [ 12mm/ 10.5mm initial height/edge] cylin-drical specimen of white matter are reported, harvested from medulla oblongata. Duringthis test, whose the first cycle is shown in (a), sample has been subject to 15 cycles (b).
2.0
1.0
-1.0
0
-2.0
1.151.051.00.950.9
stretch
nominal stress
[kPa]
(b)(a)
1.1
2.0
1.0
-1.0
0
-2.0
1.151.051.00.950.9
stretch
nominal stress
[kPa]
1.1
Figure A.8: As in Fig. A.1, but results on a [ 10mm/ 12mm initial height/edge] cylindricalspecimen of white matter are reported, harvested from medulla oblongata. During this test,whose the first cycle is shown in (a), sample has been subject to 14 cycles (b).
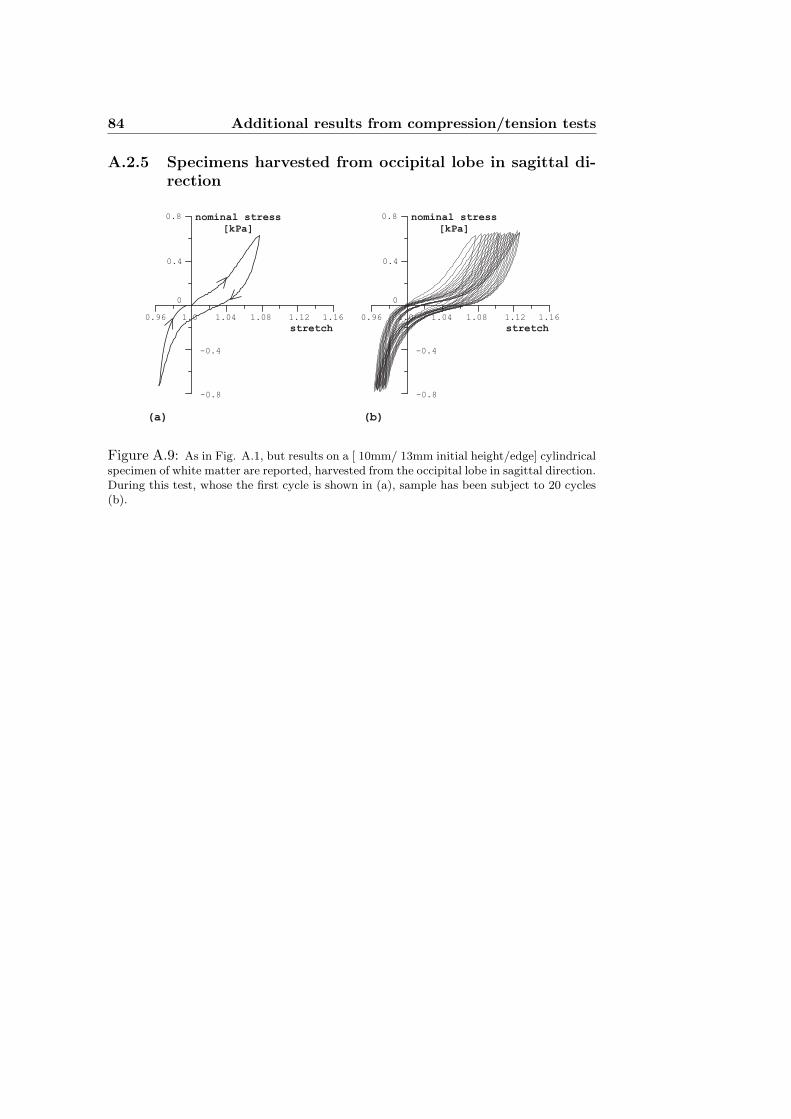
84 Additional results from compression/tension tests
A.2.5 Specimens harvested from occipital lobe in sagittal di-rection
1.0 1.121.04 1.08 1.160.96
0.8
0.4
-0.4
-0.8
0
stretch
nominal stress
[kPa]
(b)
1.0 1.121.04 1.08 1.160.96
0.8
0.4
-0.4
-0.8
0
stretch
nominal stress
[kPa]
(a)
Figure A.9: As in Fig. A.1, but results on a [ 10mm/ 13mm initial height/edge] cylindricalspecimen of white matter are reported, harvested from the occipital lobe in sagittal direction.During this test, whose the first cycle is shown in (a), sample has been subject to 20 cycles(b).
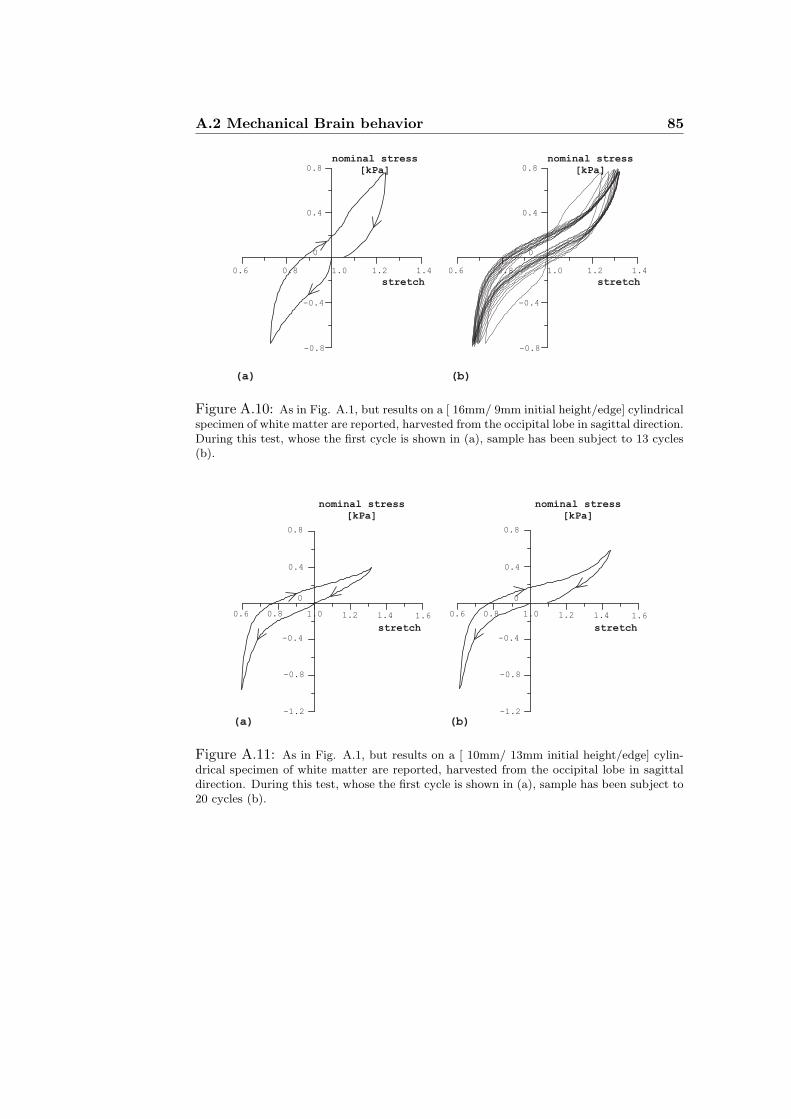
A.2 Mechanical Brain behavior 85
nominal stress
[kPa]0.8
0.4
-0.4
-0.8
1.41.21.00.80.6
0
stretch
(b)
nominal stress
[kPa]0.8
0.4
-0.4
-0.8
1.41.21.00.80.6
0
stretch
(a)
Figure A.10: As in Fig. A.1, but results on a [ 16mm/ 9mm initial height/edge] cylindricalspecimen of white matter are reported, harvested from the occipital lobe in sagittal direction.During this test, whose the first cycle is shown in (a), sample has been subject to 13 cycles(b).
stretch
nominal stress
[kPa]
0.8
0.4
-0.4
-0.8
0
-1.2
1.61.41.21.00.80.6
(b)
stretch
nominal stress
[kPa]
0.8
0.4
-0.4
-0.8
0
-1.2
1.61.41.21.00.80.6
(a)
Figure A.11: As in Fig. A.1, but results on a [ 10mm/ 13mm initial height/edge] cylin-drical specimen of white matter are reported, harvested from the occipital lobe in sagittaldirection. During this test, whose the first cycle is shown in (a), sample has been subject to20 cycles (b).
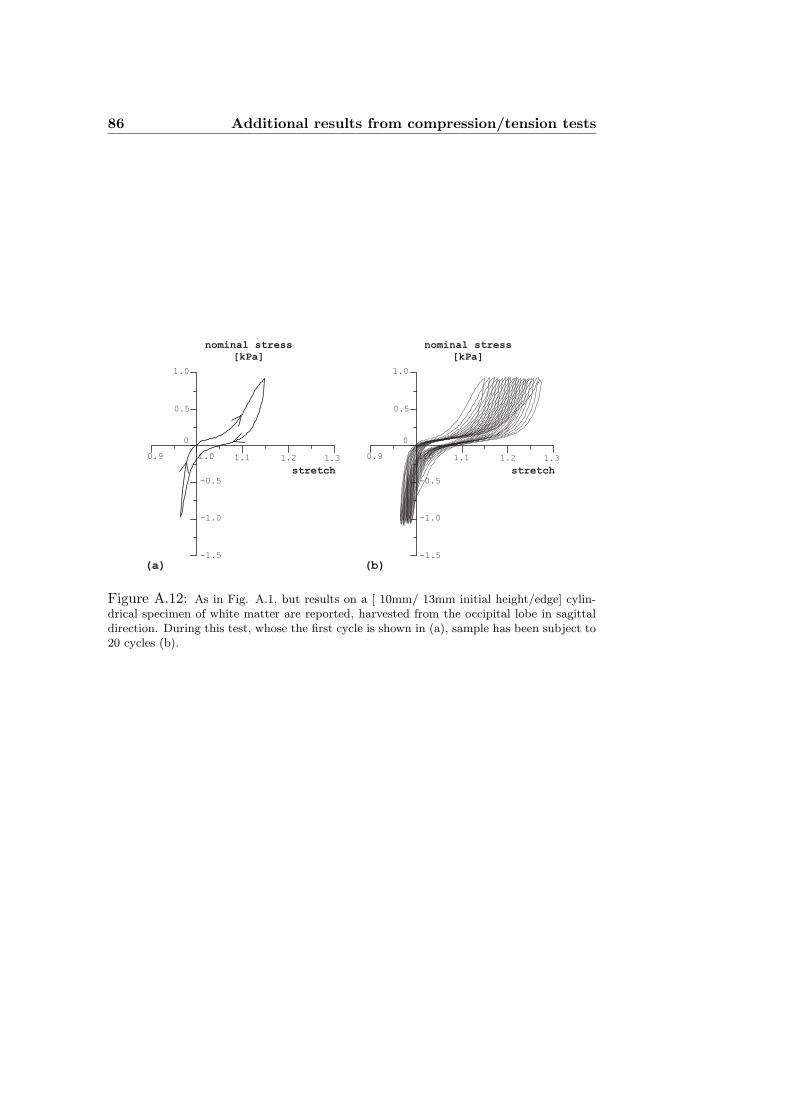
86 Additional results from compression/tension tests
stretch
nominal stress
[kPa]
1.0
0.5
-0.5
-1.0
0
1.31.21.11.00.9
(b)-1.5
stretch
nominal stress
[kPa]
1.0
0.5
-0.5
-1.0
0
1.31.21.11.00.9
(a)-1.5
Figure A.12: As in Fig. A.1, but results on a [ 10mm/ 13mm initial height/edge] cylin-drical specimen of white matter are reported, harvested from the occipital lobe in sagittaldirection. During this test, whose the first cycle is shown in (a), sample has been subject to20 cycles (b).
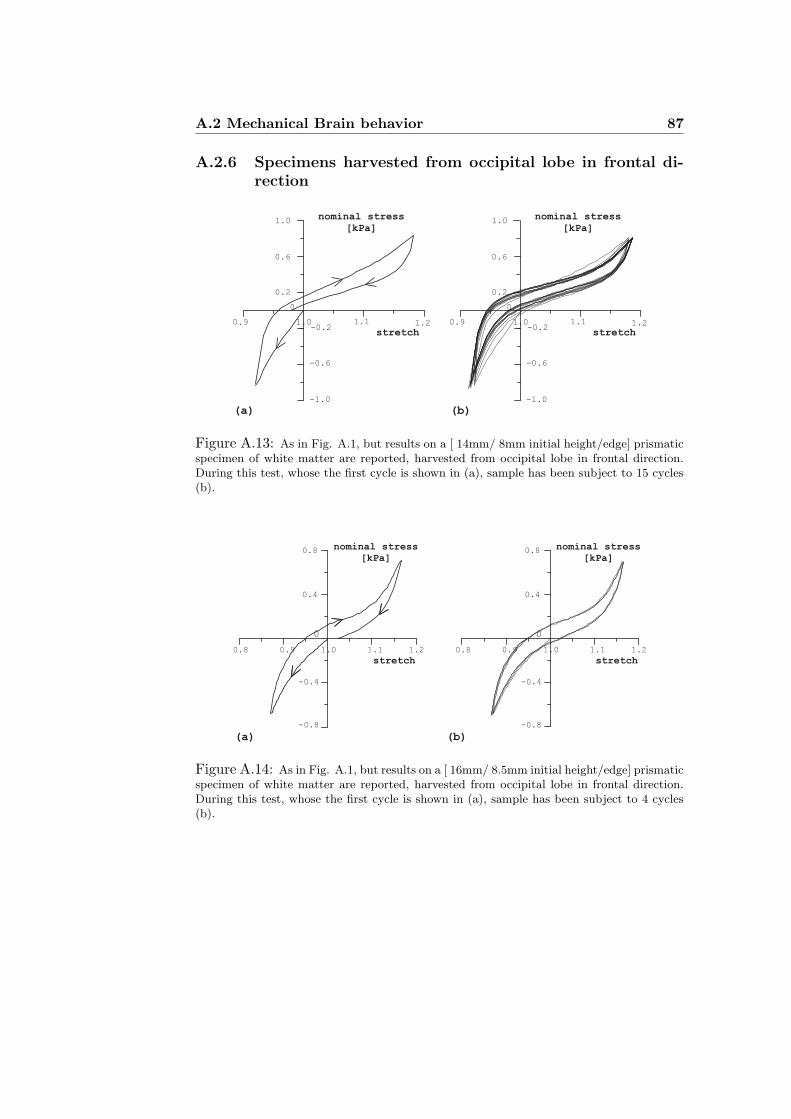
A.2 Mechanical Brain behavior 87
A.2.6 Specimens harvested from occipital lobe in frontal di-rection
nominal stress
[kPa]
nominal stress
[kPa]
stretch
0
1.11.0 1.20.9
(b)
1.0
0.6
0.2
-1.0
-0.6
-0.2stretch
0
1.11.0 1.20.9
(a)
1.0
0.6
0.2
-1.0
-0.6
-0.2
Figure A.13: As in Fig. A.1, but results on a [ 14mm/ 8mm initial height/edge] prismaticspecimen of white matter are reported, harvested from occipital lobe in frontal direction.During this test, whose the first cycle is shown in (a), sample has been subject to 15 cycles(b).
nominal stress
[kPa]
stretch
0.8
0.4
-0.4
-0.8
0
1.21.11.00.90.8
(a)
nominal stress
[kPa]
stretch
0.8
0.4
-0.4
-0.8
0
1.21.11.00.90.8
(b)
Figure A.14: As in Fig. A.1, but results on a [ 16mm/ 8.5mm initial height/edge] prismaticspecimen of white matter are reported, harvested from occipital lobe in frontal direction.During this test, whose the first cycle is shown in (a), sample has been subject to 4 cycles(b).
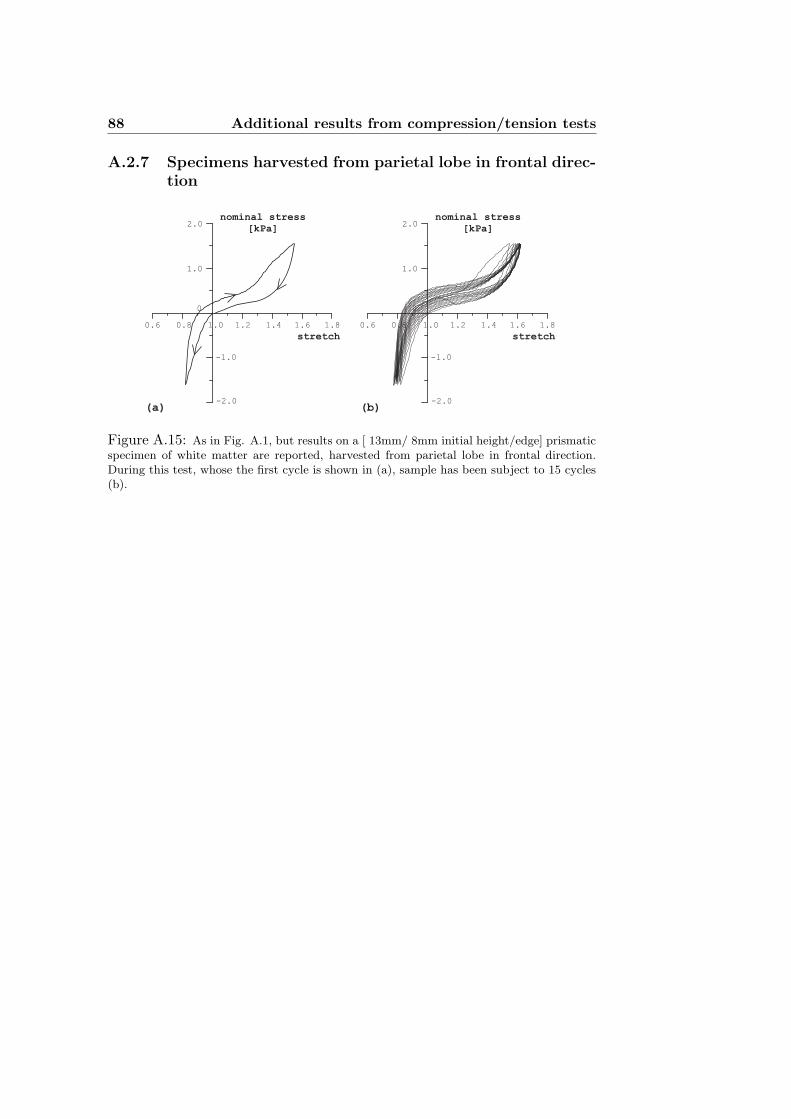
88 Additional results from compression/tension tests
A.2.7 Specimens harvested from parietal lobe in frontal direc-tion
stretch
nominal stress
[kPa]2.0
-1.0
-2.0
1.0
1.0
0.8 1.2 1.4 1.6 1.80.6
0
(b)
stretch
nominal stress
[kPa]2.0
-1.0
-2.0
1.0
1.0
0.8 1.2 1.4 1.6 1.80.6
0
(a)
Figure A.15: As in Fig. A.1, but results on a [ 13mm/ 8mm initial height/edge] prismaticspecimen of white matter are reported, harvested from parietal lobe in frontal direction.During this test, whose the first cycle is shown in (a), sample has been subject to 15 cycles(b).
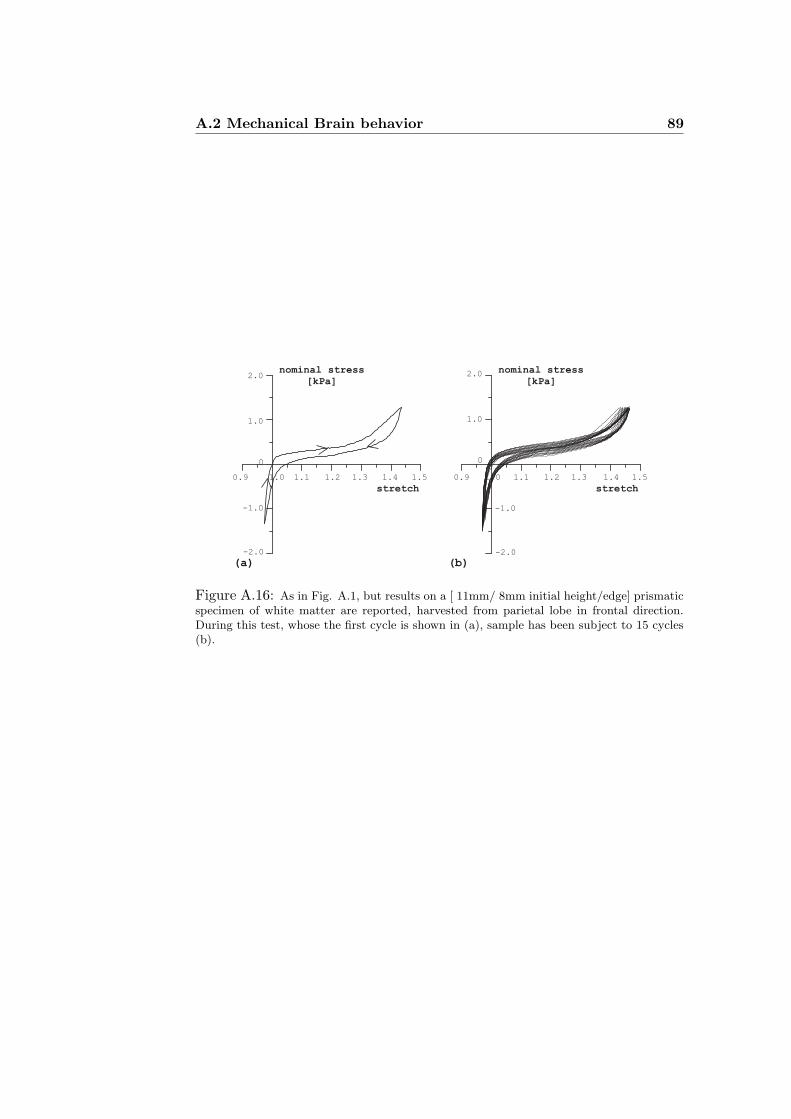
A.2 Mechanical Brain behavior 89
stretch
nominal stress
[kPa]
1.41.31.10.9
2.0
1.0
-1.0
-2.0
0
1.0 1.2 1.5
(b)
stretch
nominal stress
[kPa]
1.41.31.10.9
2.0
1.0
-1.0
-2.0
0
1.0 1.2 1.5
(a)
Figure A.16: As in Fig. A.1, but results on a [ 11mm/ 8mm initial height/edge] prismaticspecimen of white matter are reported, harvested from parietal lobe in frontal direction.During this test, whose the first cycle is shown in (a), sample has been subject to 15 cycles(b).
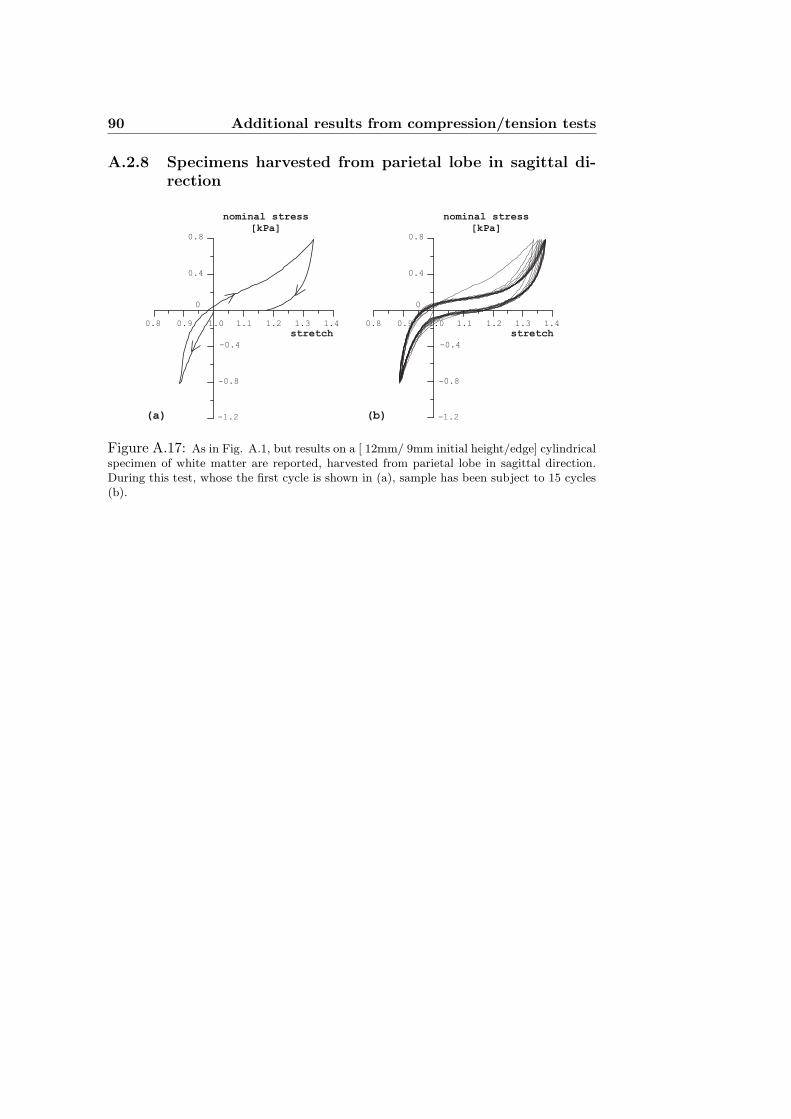
90 Additional results from compression/tension tests
A.2.8 Specimens harvested from parietal lobe in sagittal di-rection
stretch
nominal stress
[kPa]0.8
0.4
0
-0.8
-1.2
0.8
-0.4
0.9 1.0 1.1 1.2 1.3 1.4
(a)
stretch
nominal stress
[kPa]0.8
0.4
0
-0.8
-1.2
0.8
-0.4
0.9 1.0 1.1 1.2 1.3 1.4
(b)
Figure A.17: As in Fig. A.1, but results on a [ 12mm/ 9mm initial height/edge] cylindricalspecimen of white matter are reported, harvested from parietal lobe in sagittal direction.During this test, whose the first cycle is shown in (a), sample has been subject to 15 cycles(b).
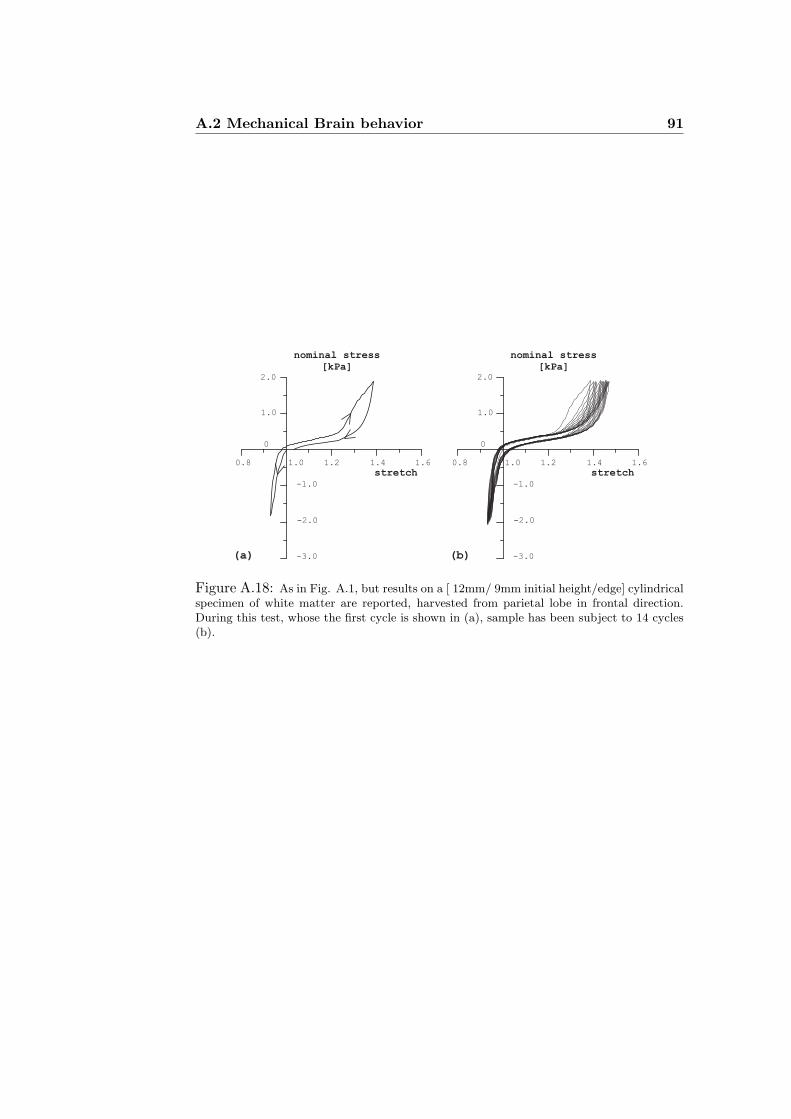
A.2 Mechanical Brain behavior 91
stretch
nominal stress
[kPa]
-2.0
-3.0
-1.0
1.0 1.2 1.4 1.60.8
1.0
2.0
0
(b)
stretch
nominal stress
[kPa]
-2.0
-3.0
-1.0
1.0 1.2 1.4 1.60.8
1.0
2.0
0
(a)
Figure A.18: As in Fig. A.1, but results on a [ 12mm/ 9mm initial height/edge] cylindricalspecimen of white matter are reported, harvested from parietal lobe in frontal direction.During this test, whose the first cycle is shown in (a), sample has been subject to 14 cycles(b).
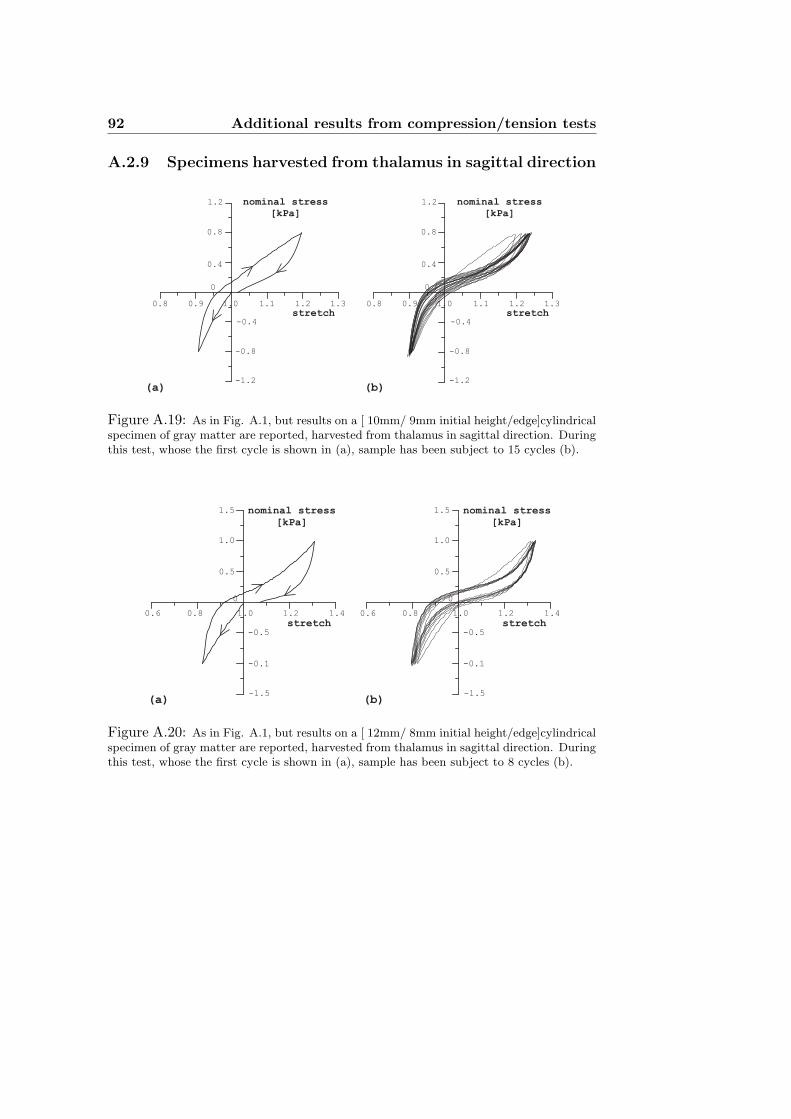
92 Additional results from compression/tension tests
A.2.9 Specimens harvested from thalamus in sagittal direction
1.3
1.2
1.21.11.00.90.8
0.8
0.4
0
-0.4
-0.8
-1.2
nominal stress
[kPa]
stretch
(a)
nominal stress
[kPa]
stretch
(b)
1.3
1.2
1.21.11.00.90.8
0.8
0.4
0
-0.4
-0.8
-1.2
Figure A.19: As in Fig. A.1, but results on a [ 10mm/ 9mm initial height/edge]cylindricalspecimen of gray matter are reported, harvested from thalamus in sagittal direction. Duringthis test, whose the first cycle is shown in (a), sample has been subject to 15 cycles (b).
nominal stress
[kPa]
stretch
1.5
1.0
0.5
0
-0.5
-0.1
-1.5
1.41.21.00.80.6
(b)
nominal stress
[kPa]
stretch
1.5
1.0
0.5
0
-0.5
-0.1
-1.5
1.41.21.00.80.6
(a)
Figure A.20: As in Fig. A.1, but results on a [ 12mm/ 8mm initial height/edge]cylindricalspecimen of gray matter are reported, harvested from thalamus in sagittal direction. Duringthis test, whose the first cycle is shown in (a), sample has been subject to 8 cycles (b).
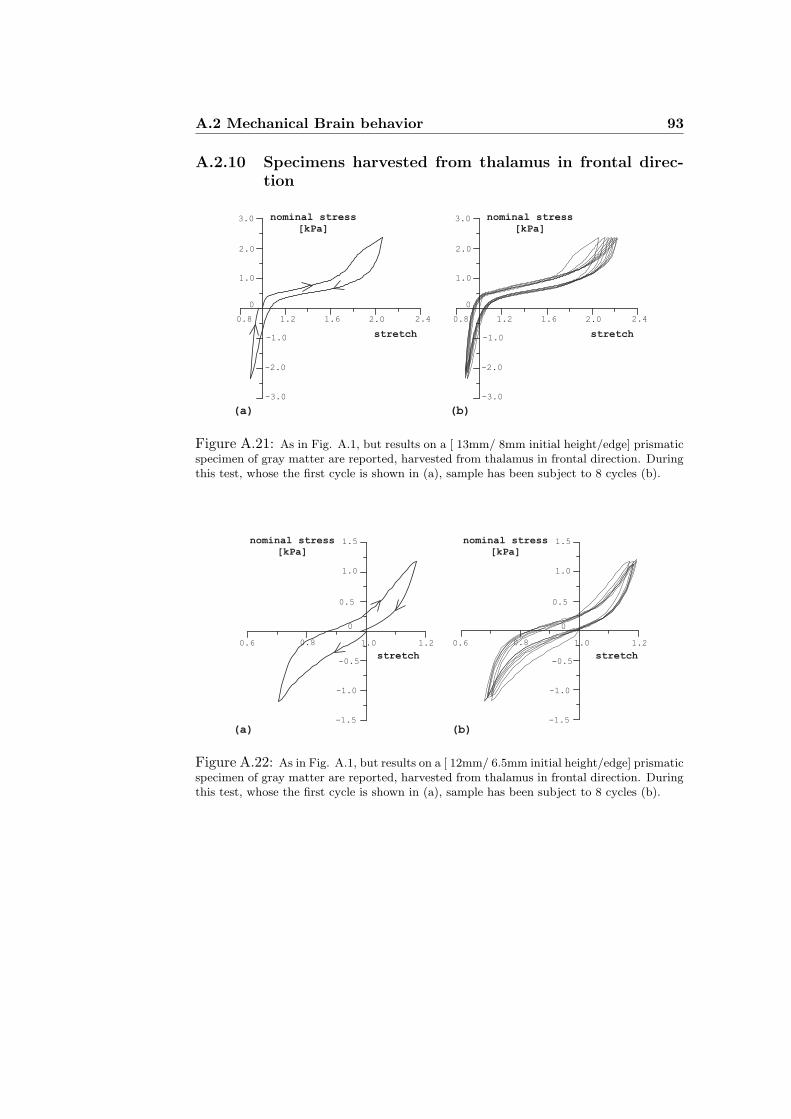
A.2 Mechanical Brain behavior 93
A.2.10 Specimens harvested from thalamus in frontal direc-tion
3.0
2.0
1.0
0
-3.0
-2.0
-1.0
0.8 1.2 2.01.6 2.4
stretch
(b)
nominal stress
[kPa]
3.0
2.0
1.0
0
-3.0
-2.0
-1.0
0.8 1.2 2.01.6 2.4
stretch
(a)
nominal stress
[kPa]
Figure A.21: As in Fig. A.1, but results on a [ 13mm/ 8mm initial height/edge] prismaticspecimen of gray matter are reported, harvested from thalamus in frontal direction. Duringthis test, whose the first cycle is shown in (a), sample has been subject to 8 cycles (b).
1.21.00.8
1.5
1.0
-0.5
0.6
0
-1.0
-1.5
0.5
stretch
nominal stress
[kPa]
(a)
stretch
nominal stress
[kPa]
(b)
1.21.00.8
1.5
1.0
-0.5
0.6
-1.0
-1.5
0.5
0
Figure A.22: As in Fig. A.1, but results on a [ 12mm/ 6.5mm initial height/edge] prismaticspecimen of gray matter are reported, harvested from thalamus in frontal direction. Duringthis test, whose the first cycle is shown in (a), sample has been subject to 8 cycles (b).
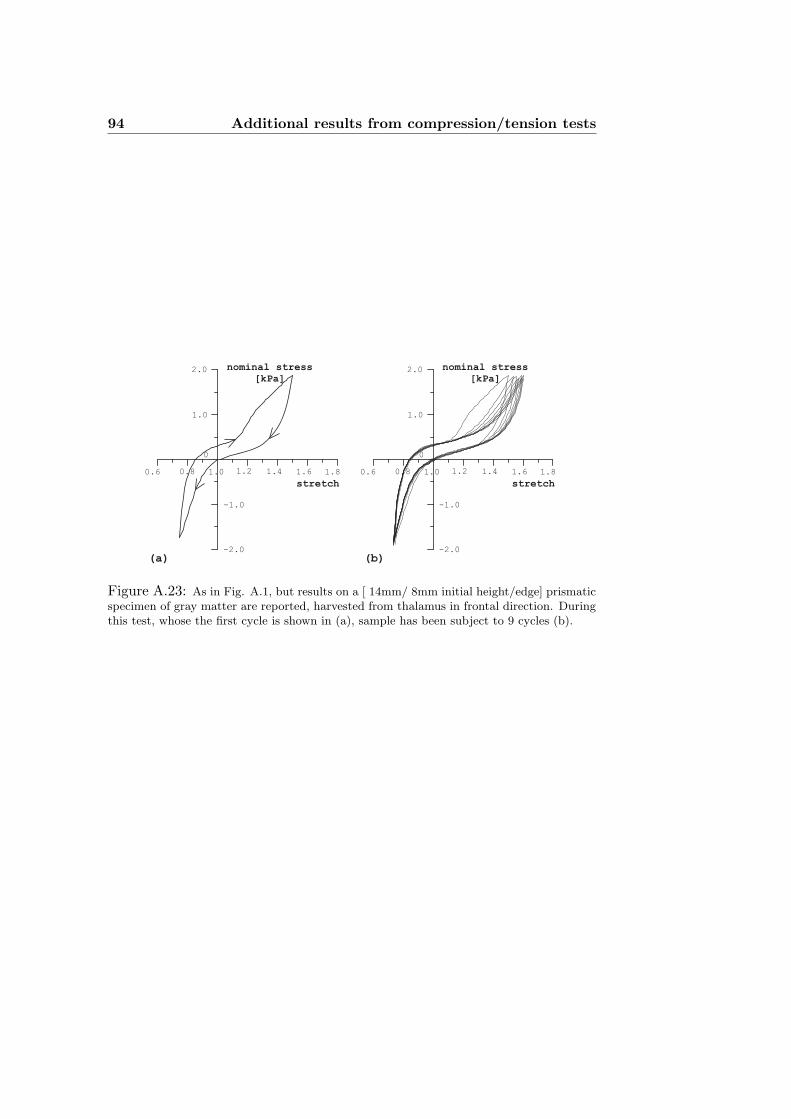
94 Additional results from compression/tension tests
2.0
1.0
-1.0
-2.0
0
1.21.00.80.6 1.4 1.6 1.8
stretch
nominal stress
[kPa]
(b)
2.0
1.0
-1.0
-2.0
0
1.21.00.80.6 1.4 1.6 1.8
stretch
nominal stress
[kPa]
(a)
Figure A.23: As in Fig. A.1, but results on a [ 14mm/ 8mm initial height/edge] prismaticspecimen of gray matter are reported, harvested from thalamus in frontal direction. Duringthis test, whose the first cycle is shown in (a), sample has been subject to 9 cycles (b).
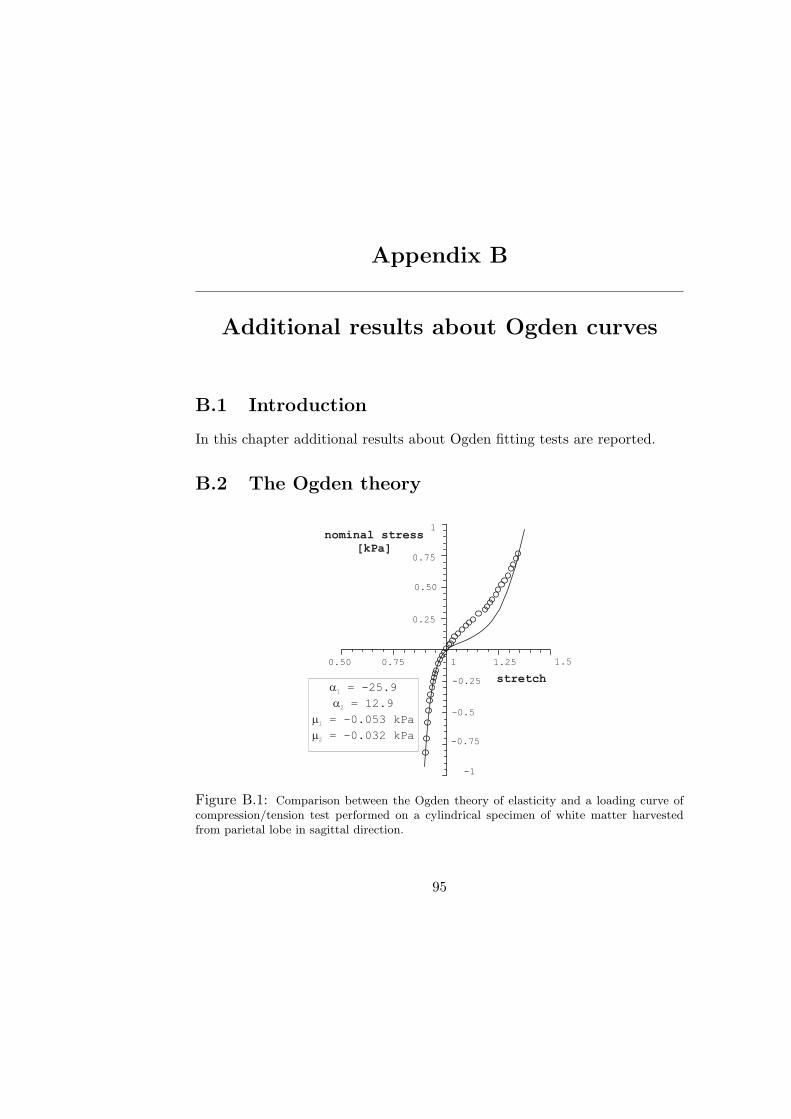
Appendix B
Additional results about Ogden curves
B.1 Introduction
In this chapter additional results about Ogden fitting tests are reported.
B.2 The Ogden theory
stretch
0.50 0.75 1.25 1.51
1
0.50
0.75
0.25
-0.25
-0.5
-0.75
-1
a
a
m
m
1
2
1
2
= -25.9
= 12.9
= -0.053 kPa
= -0.032 kPa
nominal stress
[kPa]
Figure B.1: Comparison between the Ogden theory of elasticity and a loading curve ofcompression/tension test performed on a cylindrical specimen of white matter harvestedfrom parietal lobe in sagittal direction.
95
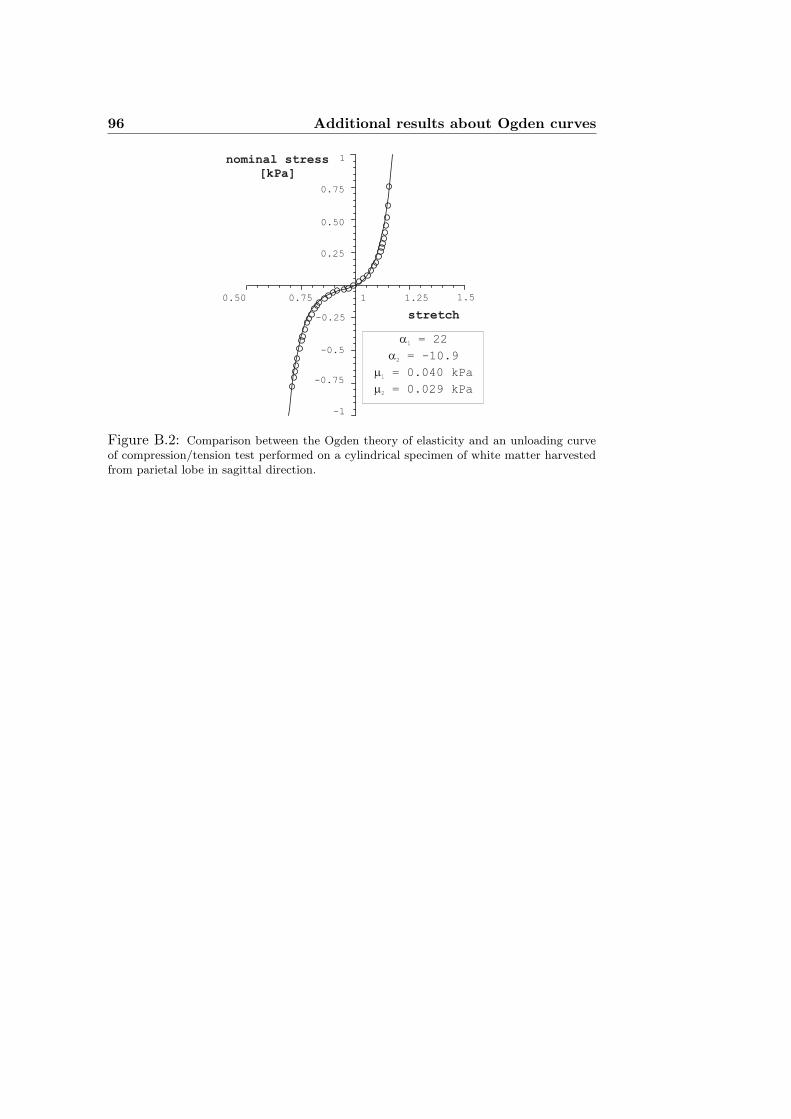
96 Additional results about Ogden curves
stretch
0.50 0.75 1.25 1.51
1
0.50
0.75
0.25
-0.25
-0.5
-0.75
-1
a
a
m
m
1
2
1
2
= 22
= -10.9
= 0.040 kPa
= 0.029 kPa
nominal stress
[kPa]
Figure B.2: Comparison between the Ogden theory of elasticity and an unloading curveof compression/tension test performed on a cylindrical specimen of white matter harvestedfrom parietal lobe in sagittal direction.
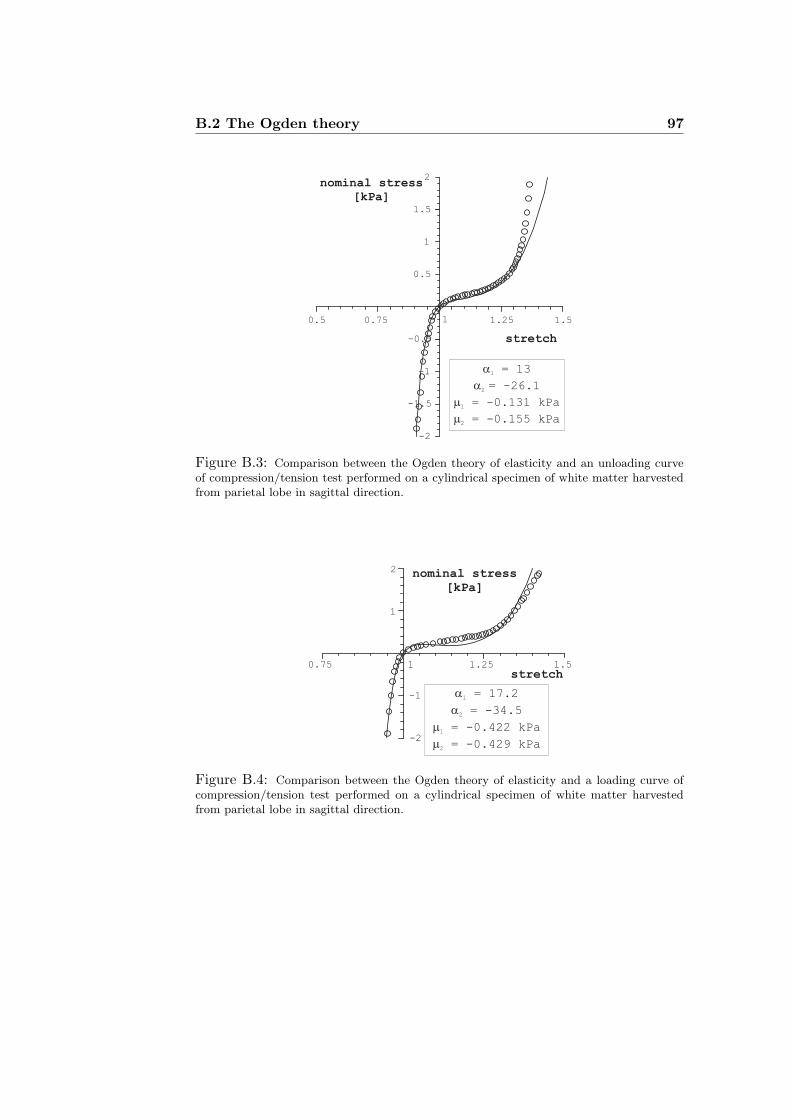
B.2 The Ogden theory 97
0.5 0.75 1.25 1.5
-2
-1.5
-1
-0.5
0.5
1
1.5
2
stretch
a
a
m
m
1
2
1
2
= 13
= -26.1
= -0.131 kPa
= -0.155 kPa
1
nominal stress
[kPa]
Figure B.3: Comparison between the Ogden theory of elasticity and an unloading curveof compression/tension test performed on a cylindrical specimen of white matter harvestedfrom parietal lobe in sagittal direction.
0.75 1.25 1.5
-2
-1
1
2
stretch
a
a
m
m
1
2
1
2
= 17.2
= -34.5
= -0.422 kPa
= -0.429 kPa
1
nominal stress
[kPa]
Figure B.4: Comparison between the Ogden theory of elasticity and a loading curve ofcompression/tension test performed on a cylindrical specimen of white matter harvestedfrom parietal lobe in sagittal direction.
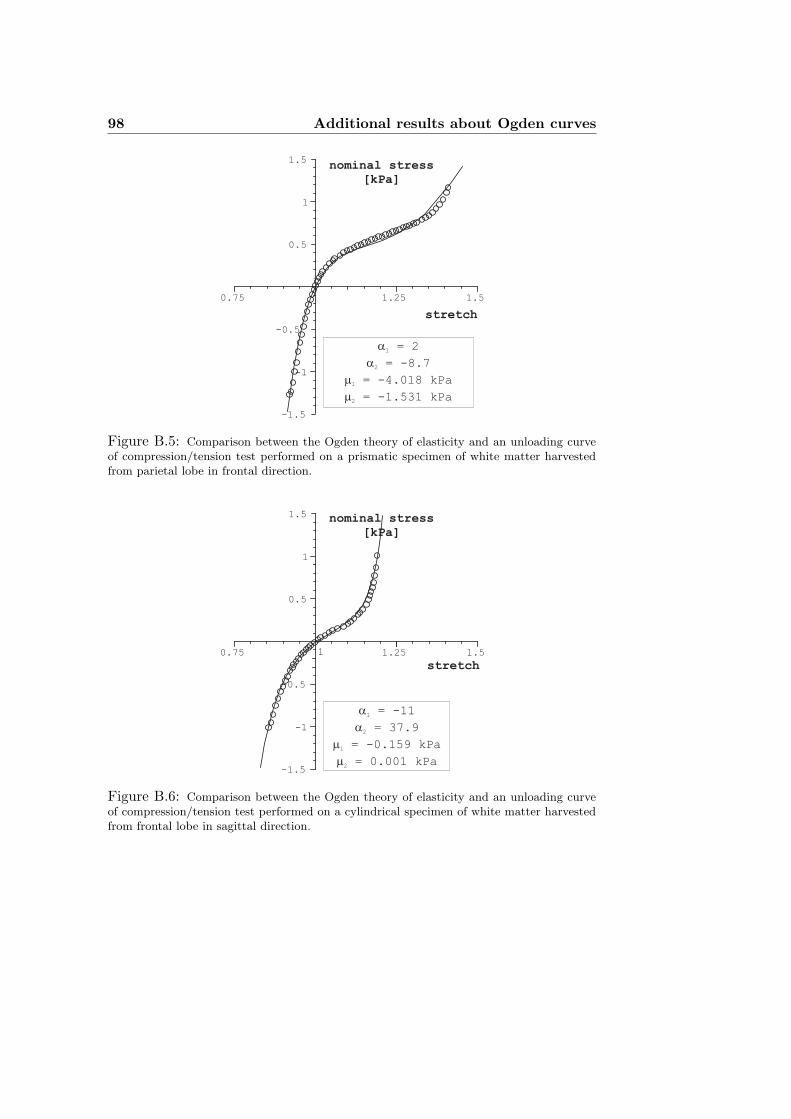
98 Additional results about Ogden curves
0.75 1.25 1.5
-1.5
-1
-0.5
0.5
1
1.5
stretch
a
a
m
m
1
2
1
2
= 2
= -8.7
= -4.018 kPa
= -1.531 kPa
nominal stress
[kPa]
Figure B.5: Comparison between the Ogden theory of elasticity and an unloading curveof compression/tension test performed on a prismatic specimen of white matter harvestedfrom parietal lobe in frontal direction.
0.75 1.25 1.5
-1.5
-1
-0.5
0.5
1
1.5
stretch
nominal stress
[kPa]
a
a
m
m
1
2
1
2
= -11
= 37.9
= -0.159 kPa
= 0.001 kPa
1
Figure B.6: Comparison between the Ogden theory of elasticity and an unloading curveof compression/tension test performed on a cylindrical specimen of white matter harvestedfrom frontal lobe in sagittal direction.
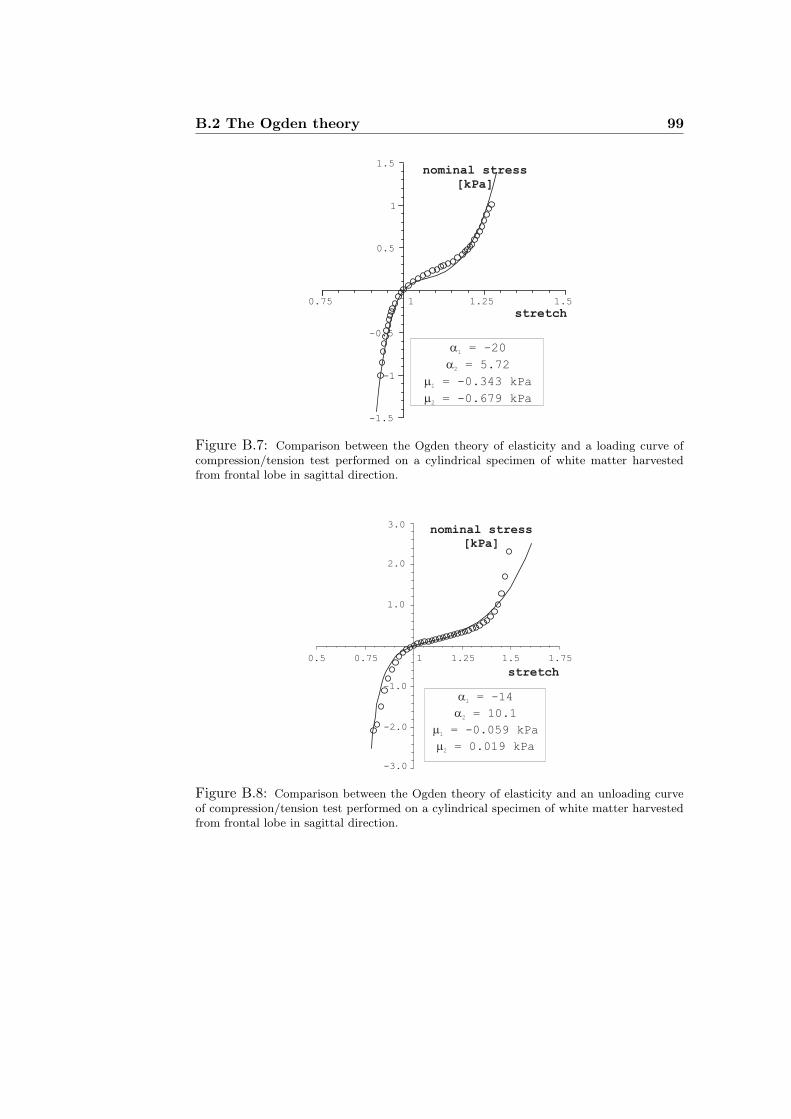
B.2 The Ogden theory 99
0.75 1.25 1.5
-1.5
-1
-0.5
0.5
1
1.5
stretch
a
a
m
m
1
2
1
2
= -20
= 5.72
= -0.343 kPa
= -0.679 kPa
1
nominal stress
[kPa]
Figure B.7: Comparison between the Ogden theory of elasticity and a loading curve ofcompression/tension test performed on a cylindrical specimen of white matter harvestedfrom frontal lobe in sagittal direction.
0.5 0.75 1.25 1.5 1.75
-2.0
-1.0
1.0
2.0
stretch
nominal stress
[kPa]
a
a
m
m
1
2
1
2
= -14
= 10.1
= -0.059 kPa
= 0.019 kPa
3.0
-3.0
1
Figure B.8: Comparison between the Ogden theory of elasticity and an unloading curveof compression/tension test performed on a cylindrical specimen of white matter harvestedfrom frontal lobe in sagittal direction.
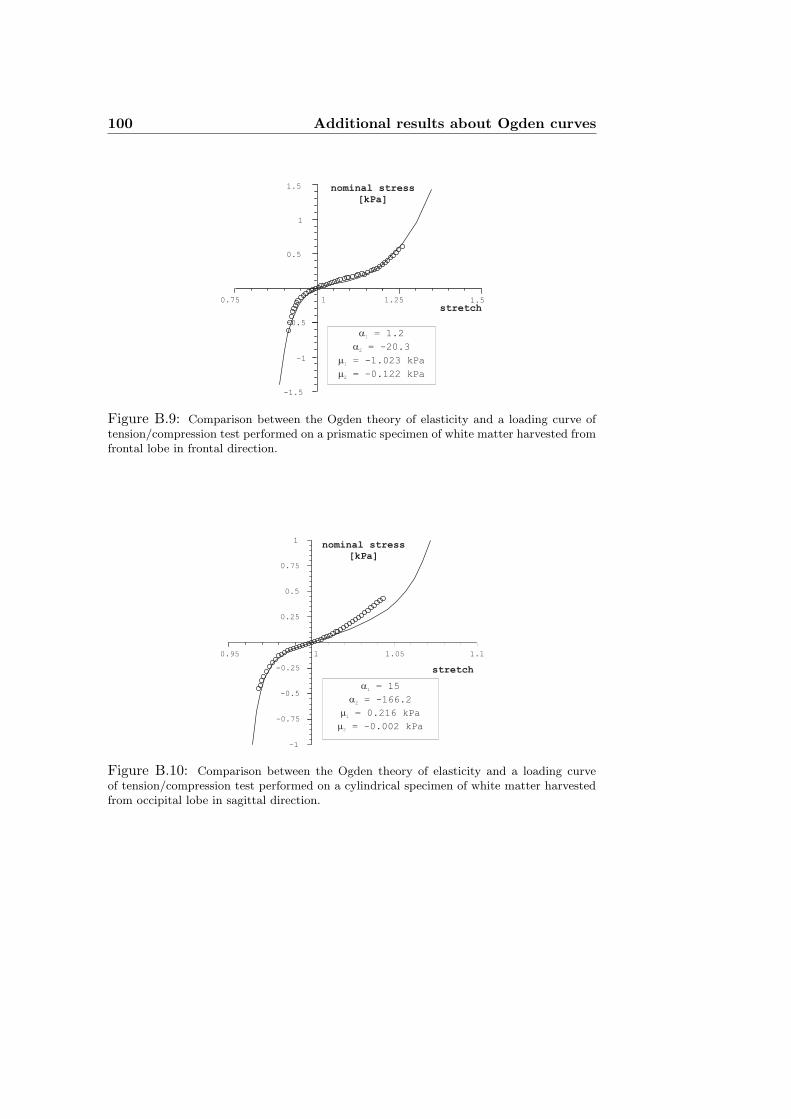
100 Additional results about Ogden curves
0.75 1.25
-1
1
0.5
1.5
-1.5
-0.5
1.5
stretch
a
a
m
m
1
2
1
2
= 1.2
= -20.3
= -1.023 kPa
= -0.122 kPa
1
nominal stress
[kPa]
Figure B.9: Comparison between the Ogden theory of elasticity and a loading curve oftension/compression test performed on a prismatic specimen of white matter harvested fromfrontal lobe in frontal direction.
0.95 1.05 1.1
-1
-0.75
-0.5
-0.25
0.25
0.5
0.75
1
1
stretch
a
a
m
m
1
2
1
2
= 15
= -166.2
= 0.216 kPa
= -0.002 kPa
nominal stress
[kPa]
Figure B.10: Comparison between the Ogden theory of elasticity and a loading curveof tension/compression test performed on a cylindrical specimen of white matter harvestedfrom occipital lobe in sagittal direction.
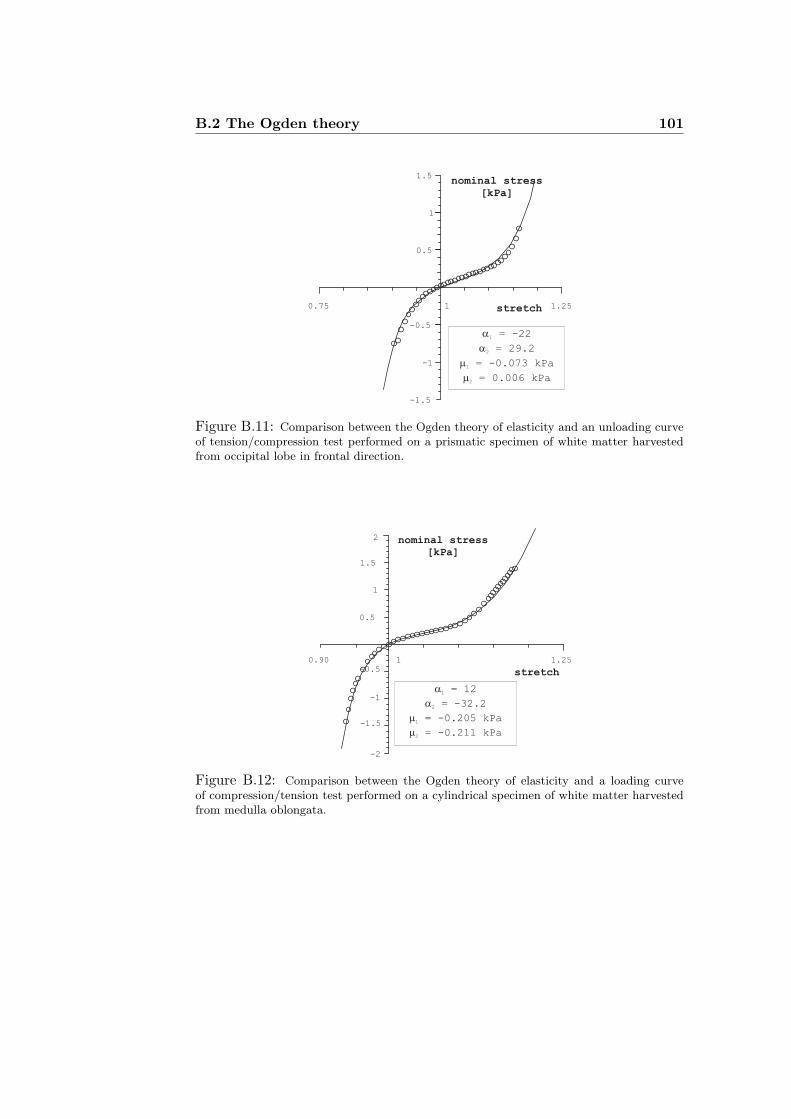
B.2 The Ogden theory 101
-1.5
-1
-0.5
0.5
1
1.5
1 1.250.75 stretch
a
a
m
m
1
2
1
2
= -22
= 29.2
= -0.073 kPa
= 0.006 kPa
nominal stress
[kPa]
Figure B.11: Comparison between the Ogden theory of elasticity and an unloading curveof tension/compression test performed on a prismatic specimen of white matter harvestedfrom occipital lobe in frontal direction.
a
a
m
m
1
2
1
2
= 12
= -32.2
= -0.205 kPa
= -0.211 kPa
stretch
2
-1.5
1
0.5
-2
1.5
-1
-0.5
1.251
nominal stress
[kPa]
0.90
Figure B.12: Comparison between the Ogden theory of elasticity and a loading curveof compression/tension test performed on a cylindrical specimen of white matter harvestedfrom medulla oblongata.
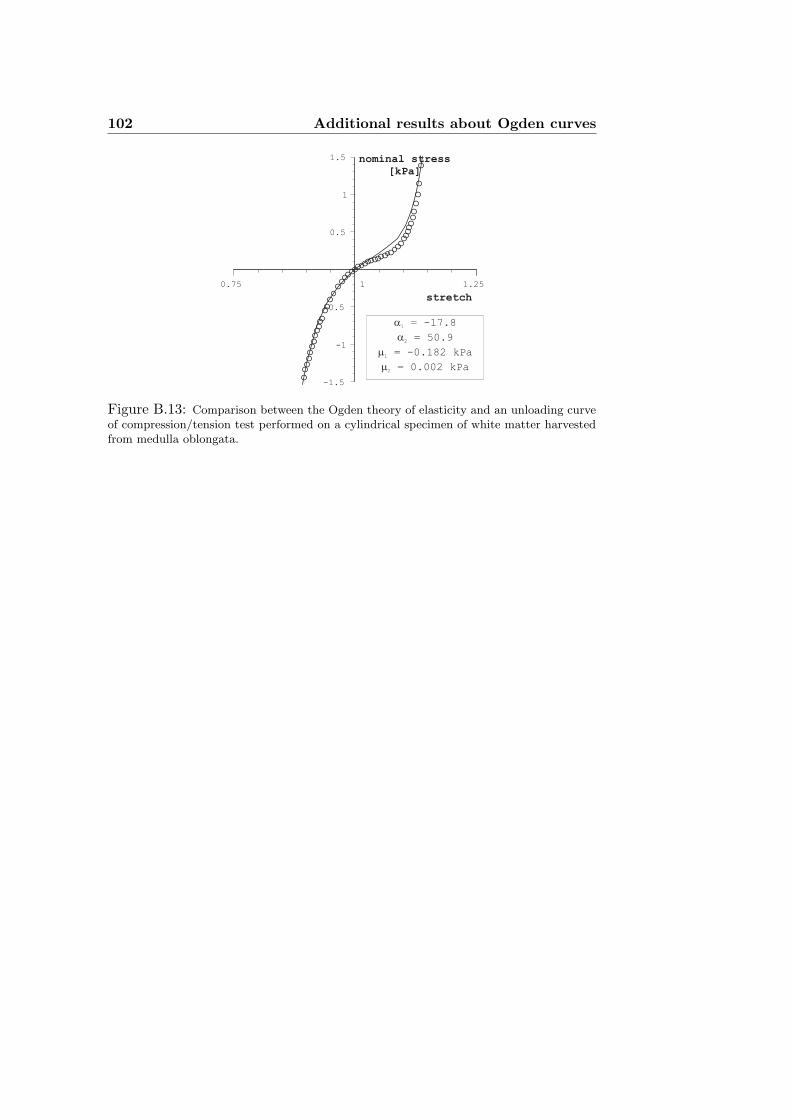
102 Additional results about Ogden curves
0.75 1.25
-1.5
-1
-0.5
0.5
1
1.5
stretch
nominal stress
[kPa]
a
a
m
m
1
2
1
2
= -17.8
= 50.9
= -0.182 kPa
= 0.002 kPa
1
Figure B.13: Comparison between the Ogden theory of elasticity and an unloading curveof compression/tension test performed on a cylindrical specimen of white matter harvestedfrom medulla oblongata.
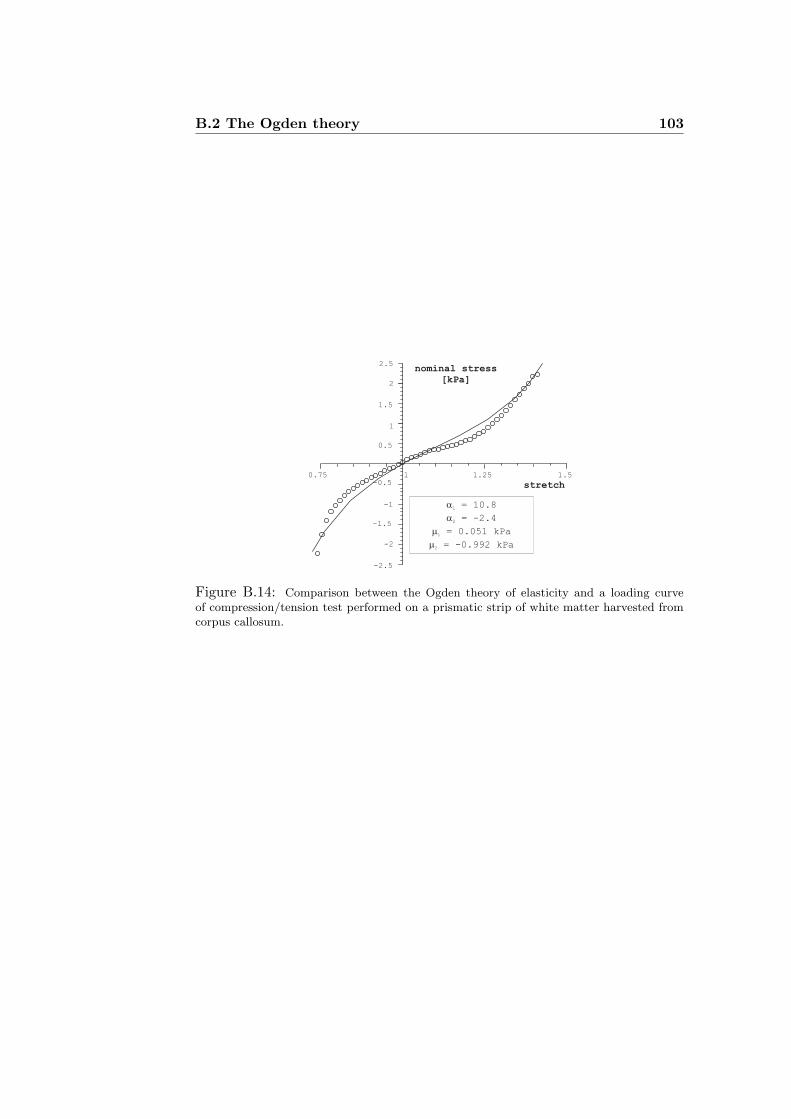
B.2 The Ogden theory 103
2.5
2
1.5
1
0.5
-2.5
-2
-1.5
-1
-0.5
0.75 1 1.25 1.5
stretch
a
a
m
m
1
2
1
2
= 10.8
= -2.4
= 0.051 kPa
= -0.992 kPa
nominal stress
[kPa]
Figure B.14: Comparison between the Ogden theory of elasticity and a loading curveof compression/tension test performed on a prismatic strip of white matter harvested fromcorpus callosum.
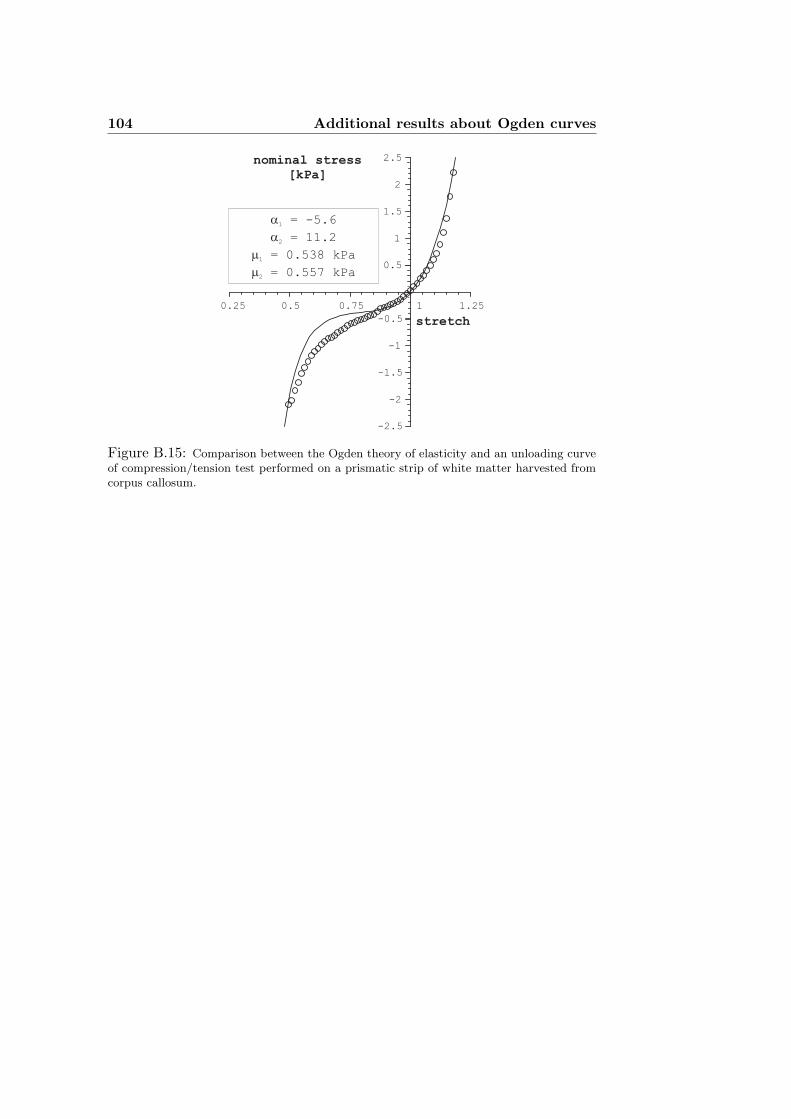
104 Additional results about Ogden curves
stretch
a
a
m
m
1
2
1
2
= -5.6
= 11.2
= 0.538 kPa
= 0.557 kPa
0.5 0.75 1 1.25
-2.5
-2
-1.5
-1
-0.5
0.5
1
1.5
2
2.5
0.25
nominal stress
[kPa]
Figure B.15: Comparison between the Ogden theory of elasticity and an unloading curveof compression/tension test performed on a prismatic strip of white matter harvested fromcorpus callosum.
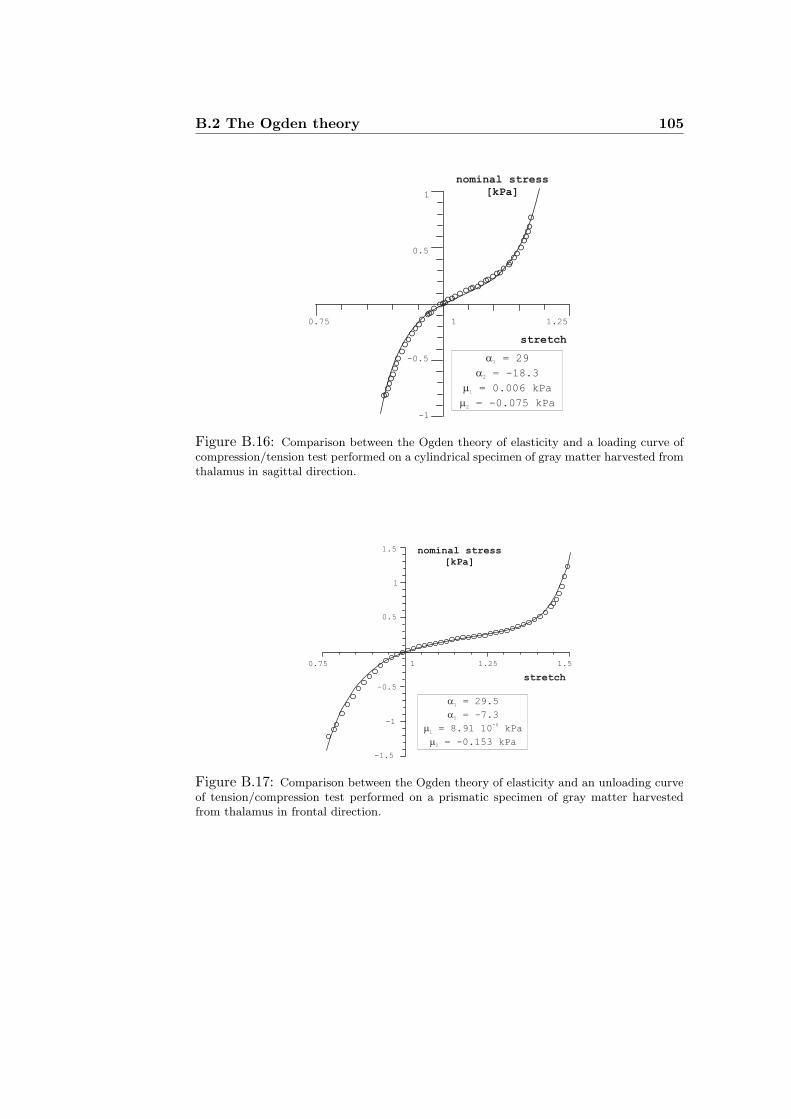
B.2 The Ogden theory 105
0.75 1 1.25
-1
-0.5
0.5
1
stretch
a
a
m
m
1
2
1
2
= 29
= -18.3
= 0.006 kPa
= -0.075 kPa
nominal stress
[kPa]
Figure B.16: Comparison between the Ogden theory of elasticity and a loading curve ofcompression/tension test performed on a cylindrical specimen of gray matter harvested fromthalamus in sagittal direction.
1.5
1
0.5
-0.5
-1
-1.5
0.75 1 1.25 1.5
stretch
a
a
m
m
1
2
1
2
= 29.5
= -7.3
= 8.91 10 kPa
= -0.153 kPa
-6
nominal stress
[kPa]
Figure B.17: Comparison between the Ogden theory of elasticity and an unloading curveof tension/compression test performed on a prismatic specimen of gray matter harvestedfrom thalamus in frontal direction.
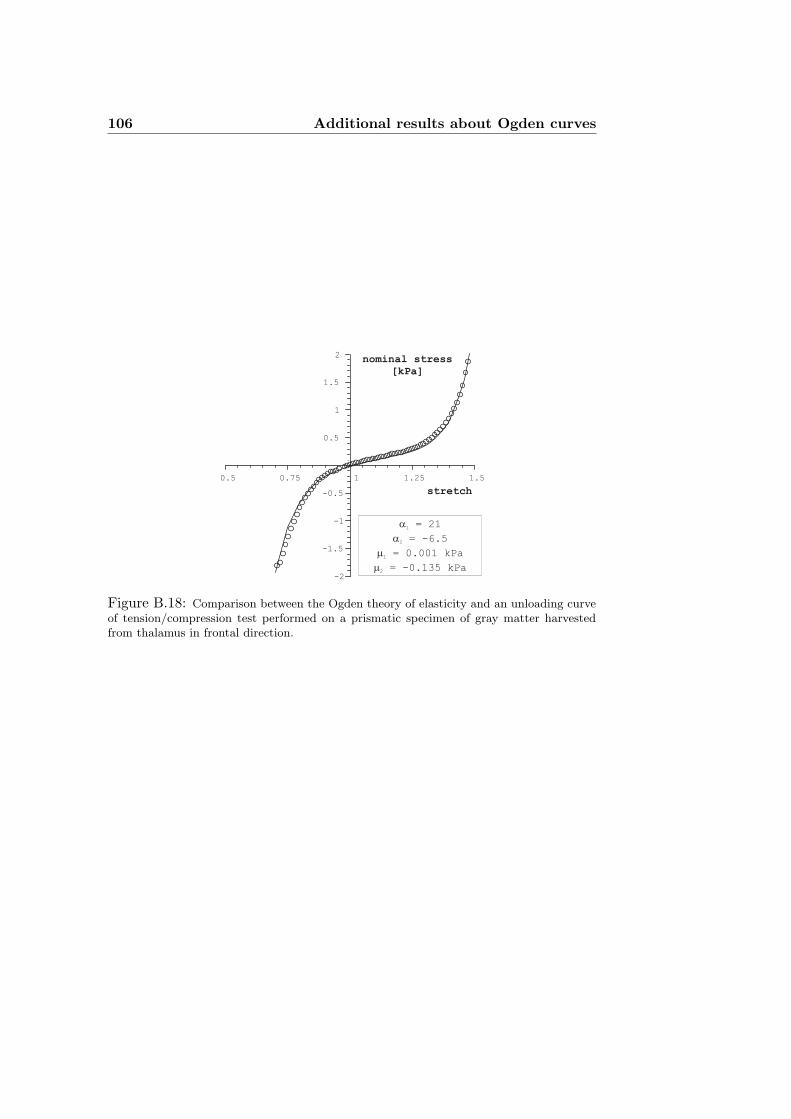
106 Additional results about Ogden curves
stretch
a
a
m
m
1
2
1
2
= 21
= -6.5
= 0.001 kPa
= -0.135 kPa
0.5 0.75 1 1.25 1.5
-2
-1.5
-1
-0.5
0.5
1
1.5
2nominal stress
[kPa]
Figure B.18: Comparison between the Ogden theory of elasticity and an unloading curveof tension/compression test performed on a prismatic specimen of gray matter harvestedfrom thalamus in frontal direction.
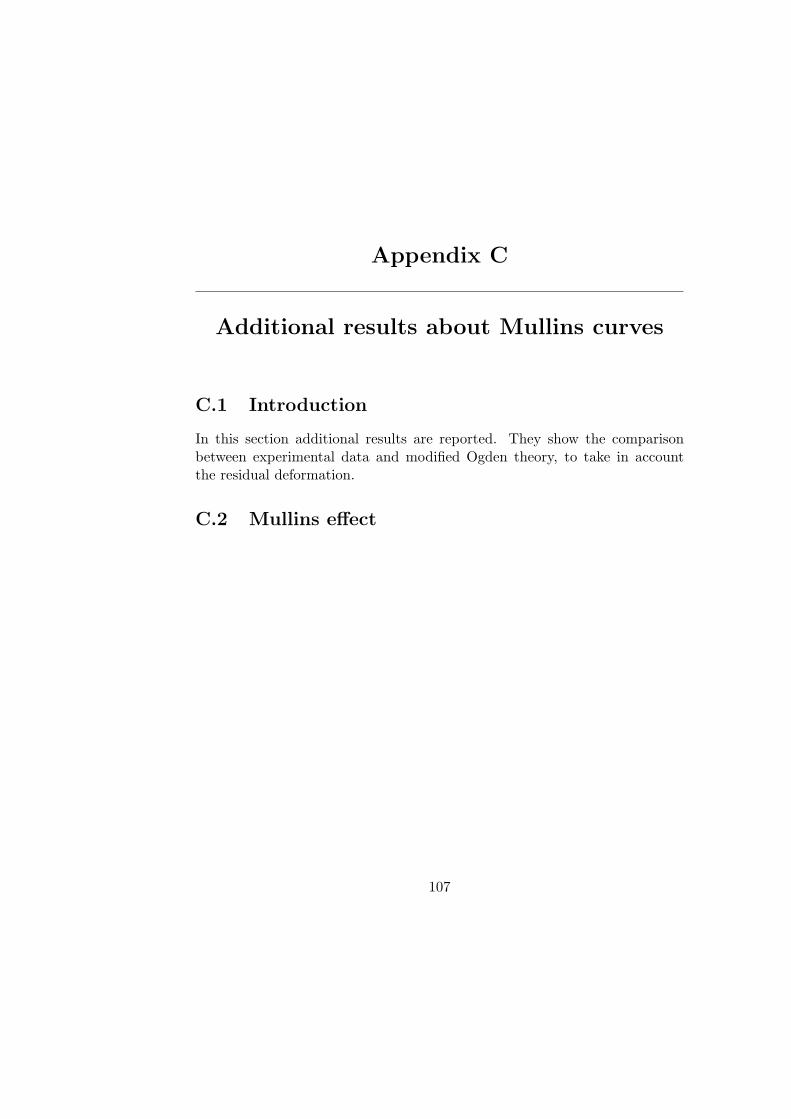
Appendix C
Additional results about Mullins curves
C.1 Introduction
In this section additional results are reported. They show the comparisonbetween experimental data and modified Ogden theory, to take in accountthe residual deformation.
C.2 Mullins effect
107
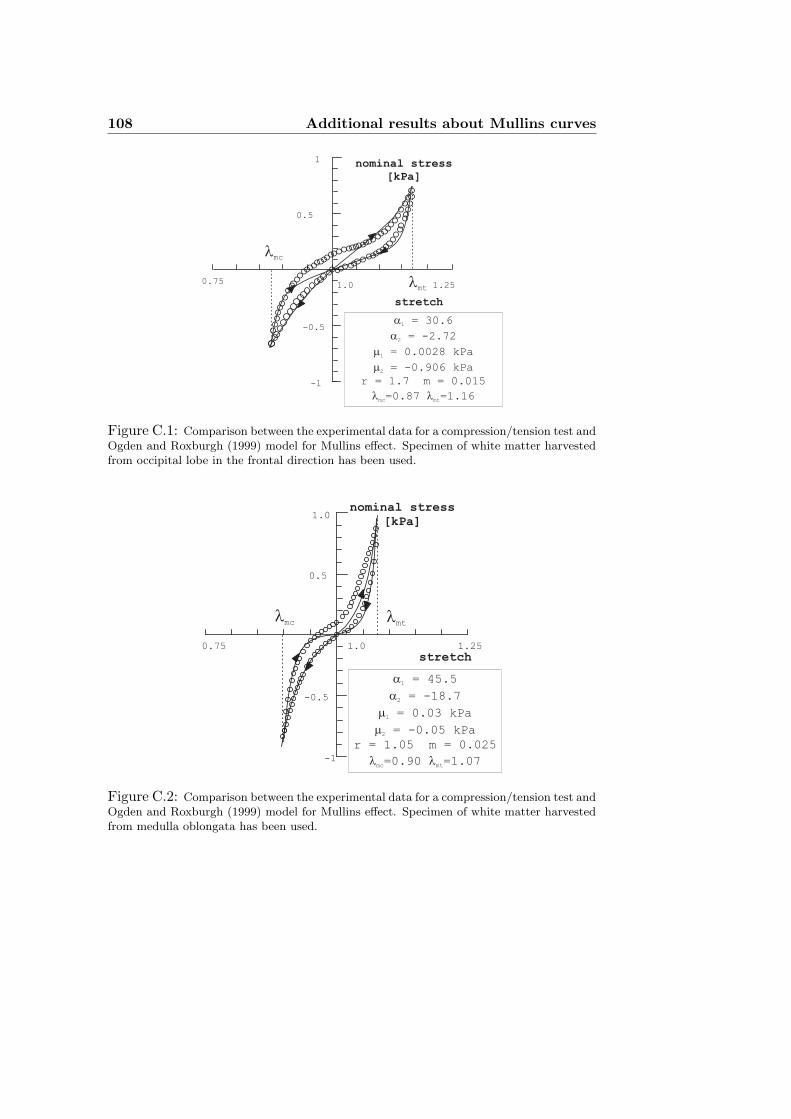
108 Additional results about Mullins curves
0.751.0 1.25
-1
-0.5
0.5
1
lmc
lmt
stretch
nominal stress
[kPa]
a
a
m
m
l
1
2
1
2
mc
= 30.6
= -2.72
= 0.0028 kPa
= -0.906 kPa
r = 1.7 m = 0.015
=0.87 lmt=1.16
Figure C.1: Comparison between the experimental data for a compression/tension test andOgden and Roxburgh (1999) model for Mullins effect. Specimen of white matter harvestedfrom occipital lobe in the frontal direction has been used.
lmc
lmt
0.75 1.0 1.25
-1
-0.5
0.5
1.0
stretch
nominal stress
[kPa]
a
a
m
m
l l
1
2
1
2
mc mt
= 45.5
= -18.7
= 0.03 kPa
= -0.05 kPa
r = 1.05 m = 0.025
=0.90 =1.07
Figure C.2: Comparison between the experimental data for a compression/tension test andOgden and Roxburgh (1999) model for Mullins effect. Specimen of white matter harvestedfrom medulla oblongata has been used.
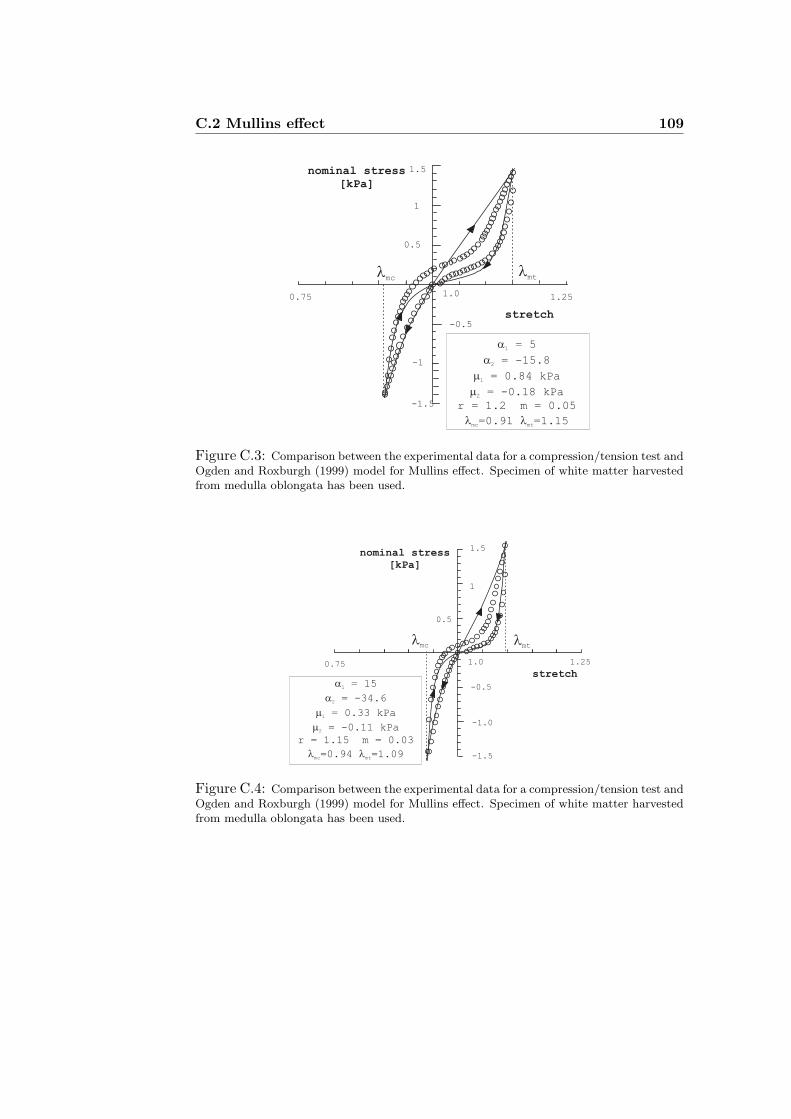
C.2 Mullins effect 109
stretch
nominal stress
[kPa]
0.751.0
1.25
-1.5
-1
-0.5
0.5
1
1.5
lmc
lmt
a
a
m
m
l l
1
2
1
2
mc mt
= 5
= -15.8
= 0.84 kPa
= -0.18 kPa
r = 1.2 m = 0.05
=0.91 =1.15
Figure C.3: Comparison between the experimental data for a compression/tension test andOgden and Roxburgh (1999) model for Mullins effect. Specimen of white matter harvestedfrom medulla oblongata has been used.
0.75 1.0 1.25
-1.5
-1.0
-0.5
0.5
1
1.5
stretch
nominal stress
[kPa]
a
a
m
m
l l
1
2
1
2
mc mt
= 15
= -34.6
= 0.33 kPa
= -0.11 kPa
r = 1.15 m = 0.03
=0.94 =1.09
lmc
lmt
Figure C.4: Comparison between the experimental data for a compression/tension test andOgden and Roxburgh (1999) model for Mullins effect. Specimen of white matter harvestedfrom medulla oblongata has been used.

110 Additional results about Mullins curves
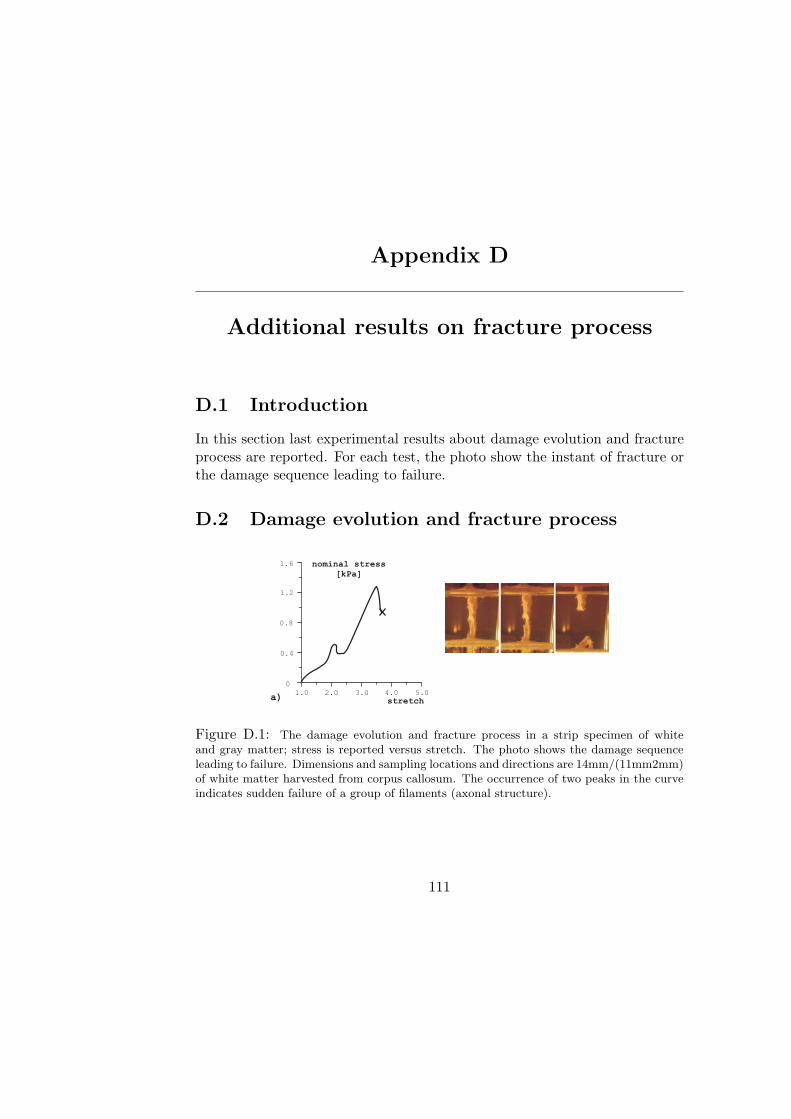
Appendix D
Additional results on fracture process
D.1 Introduction
In this section last experimental results about damage evolution and fractureprocess are reported. For each test, the photo show the instant of fracture orthe damage sequence leading to failure.
D.2 Damage evolution and fracture process
a)
1.6
0
1.2
0.8
0.4
1.0 2.0 3.0 4.0 5.0
stretch
nominal stress
[kPa]
Figure D.1: The damage evolution and fracture process in a strip specimen of whiteand gray matter; stress is reported versus stretch. The photo shows the damage sequenceleading to failure. Dimensions and sampling locations and directions are 14mm/(11mm2mm)of white matter harvested from corpus callosum. The occurrence of two peaks in the curveindicates sudden failure of a group of filaments (axonal structure).
111
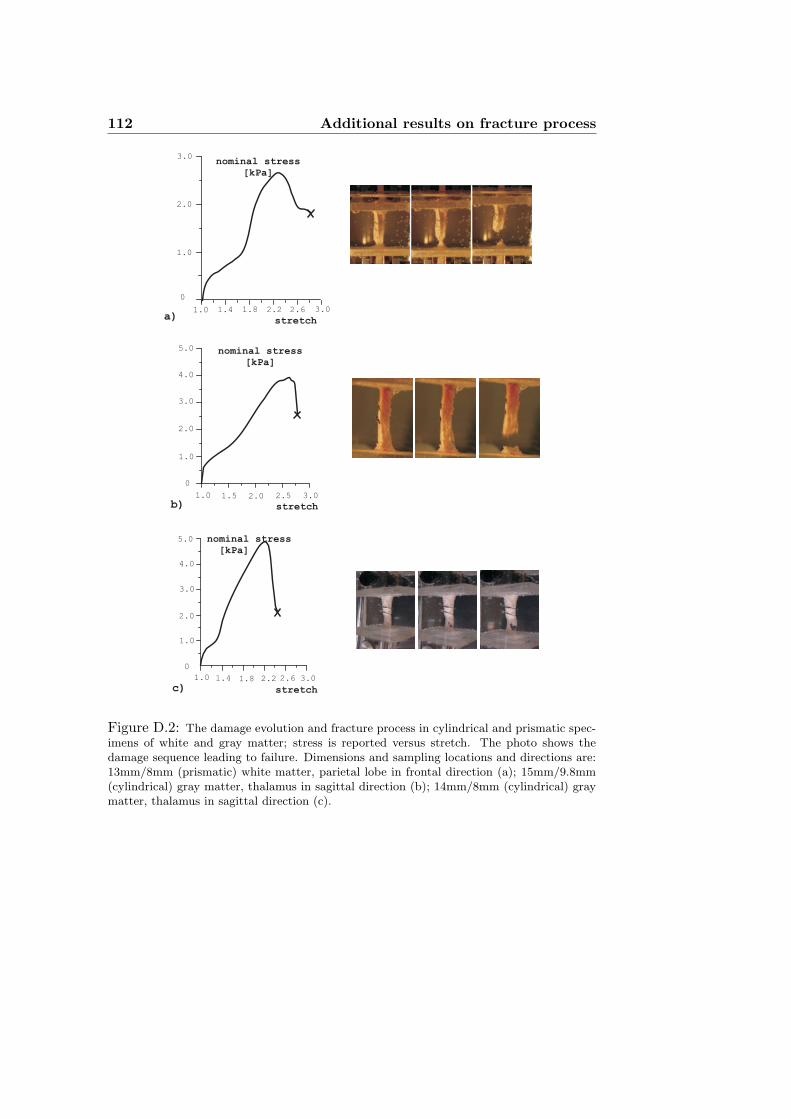
112 Additional results on fracture process
5.0
4.0
3.0
2.0
1.0
0
1.0 1.5 2.0 2.5 3.0
b)
c)
5.0
4.0
3.0
2.0
1.0
1.0 1.4 1.8 2.2 2.6 3.0
0
a)
3.0
0
2.0
1.0
1.0 1.4 1.8 2.2 2.6
stretch
3.0
stretch
stretch
nominal stress
[kPa]
nominal stress
[kPa]
nominal stress
[kPa]
Figure D.2: The damage evolution and fracture process in cylindrical and prismatic spec-imens of white and gray matter; stress is reported versus stretch. The photo shows thedamage sequence leading to failure. Dimensions and sampling locations and directions are:13mm/8mm (prismatic) white matter, parietal lobe in frontal direction (a); 15mm/9.8mm(cylindrical) gray matter, thalamus in sagittal direction (b); 14mm/8mm (cylindrical) graymatter, thalamus in sagittal direction (c).
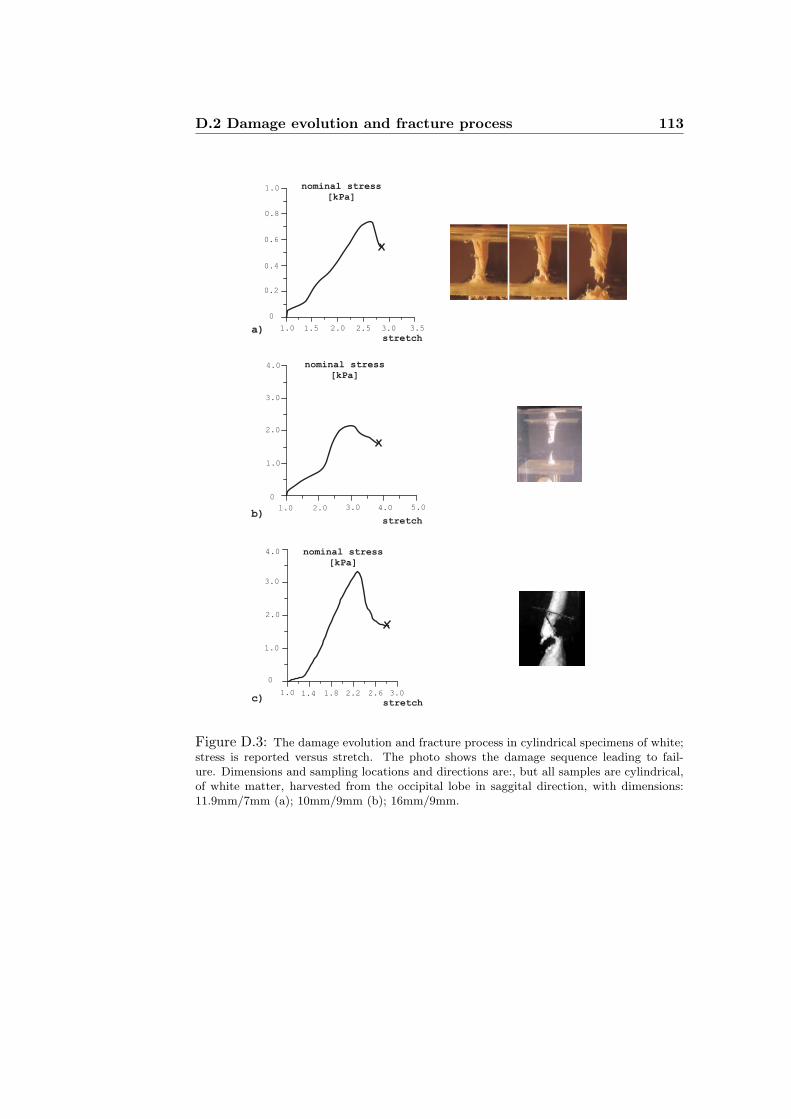
D.2 Damage evolution and fracture process 113
c)
b)
4.0
0
3.0
2.0
1.0
1.0 2.0 3.0 4.0 5.0
stretch
nominal stress
[kPa]
4.0
0
3.0
1.0
1.0 2.2
nominal stress
[kPa]
2.0
1.4 1.8 2.6 3.0
stretch
a)
nominal stress
[kPa]1.0
0
0.8
0.6
0.4
0.2
1.0 1.5 2.5 3.0 3.52.0
stretch
Figure D.3: The damage evolution and fracture process in cylindrical specimens of white;stress is reported versus stretch. The photo shows the damage sequence leading to fail-ure. Dimensions and sampling locations and directions are:, but all samples are cylindrical,of white matter, harvested from the occipital lobe in saggital direction, with dimensions:11.9mm/7mm (a); 10mm/9mm (b); 16mm/9mm.

114 Additional results on fracture process
Bibliography
[1] Abbott, A. Brain implants show promise against obsessive disorder.Nature, 419 658, 2002.
[2] Aida, T. Study of human head impact: brain tissue constitutive mod-els. PhD thesis, Department of Mechanical and Aerospace Engineering,Morgantown, West Virginia, 2000.
[3] Annesini, M.C., Lenaro, L., Maira, G., Mangiola, A., and Turchetti, L.Mass transport in brain tissue during interstitial drug infusion. ICheaP-6, Pisa-Italy, 8-11 June 2003, 2003.
[4] Arbogast, K.B. and Margulies, S.S. Material characterization of thebrainstem from oscillatory shear tests. J. Biomechanics, 31 801–807,1998.
[5] Arbogast, K.B. and Margulies, S.S. A fiber-reinforced composite modelof the viscoelastic behavior of the brainstem in shear. J. Biomechanics,32 865–870, 1999.
[6] Arbogast, K.B., et al. A high-frequency shear device for testing softbiological tissues. J. Biomechanics, 30 757–759, 1997.
[7] Barden, L. Consolidation of clay with non-linear viscosity. Geotecnique,15 345–362, 1965.
115
116 Bibliography
[8] Basser, P.J. Interstitial pressure, volume, and flow during infusion intobrain tissue. Microvascular Res., 44 143–165, 1992.
[9] Bayly, P.V., et al. Measurement of strain by mri tagging in physicalmodels of brain injury. In Summer Bioengng. confer., Florida, USA,June 25-29 2003.
[10] Bell, B.A., Smith, M.A., Kean, D.M., McGhee, C.N., MacDonald, H.L.,Miller, J.D., Barnett, G.H., Tocher, J.L., Douglas, R.H., and Best,J.J. Brain water measured by magnetic resonance imaging. correlationwith direct estimation and changes after mannitol and dexamethasone.Lancet, 1 66–69, 1987.
[11] Bilston, L.E. The effect of perfusion on soft tissue mechanical proper-ties:a computational model. Comput. Meth. Biomech. Biomed. Engrg.,5 238–290, 2002.
[12] Bilston, L.E., Liu Z., and Phan-Thien, N. Large strain behaviour ofbrain tissue in shear: some experimental data and differential constitu-tive model. Biorheology, 38 335–345, 2001.
[13] Bilston, L.E., Liu, Z.Z., and Nhan, P.T. Linear viscoelastic propertiesof bovine brain tissue in shear. Biorheology, 34 377–385, 1997.
[14] Biot, M.A. General theory of three-dimensional consolidation. J. Appl.Phys., 12 155–164, 1941.
[15] Brands, D.W.A. Predicting brain mechanics during closed head impact- numerical and constitutive aspects. PhD thesis, Tecknik University ofEindhoven, The Netherlands, 2002.
[16] Brands, D.W.A., Peters, G.W.M., and Bovendeerd, P.H.M. Design andnumerical implementation of a 3-d non-linear viscoelastic constitutivemodel for brain tissue during impact. J. Biomechanics, 37 127–134,2004.
[17] Burland, J.B. and Jamiolkowshi, M.and Viggiani, C. The stabilisationof the leaning tower of pisa. Soils & Foundations, 43 63–80, 2003.
[18] Christie, I.F. A re-appraisal of merchant’s contribution to the theory ofconsolidation. Geotecnique, 14 309–320, 1964.
Bibliography 117
[19] Chu, Y.H. and Bottlang, M. Finite element analysis of traumatic braininjury. In 10th Annual Symposium on Computer Methods in OrthopaedicBiomechanics., Dallas, Texas, USA, 2002.
[20] Cluzel, P., Lebrun, A., Heller, C., Lavery, R., Viovy, J.L., Chatenay,D., and Caron, F. Dna: an extensible molecule. Science, 271 792–794,1996.
[21] Cotter, C.S., Smolarkiewicz, P.K., and Szczyrba, I.N. On mechanismsof diffuse axonal injuries. BED - Bioengin. Conference - ASME, 50315–316, 2001.
[22] Cotter, C.S., Smolarkiewicz, P.K., and Szczyrba, I.N. A viscoelasticfluid model for brain injuries. Int. J. Numer. Meth. Fl., 40 303–311,2002.
[23] Darvish, K.K. and Crandall, J.R. Nonlinear viscoleastic effects in os-cillatory shear deformation of brain tissue. Med. Engrg & Physics, 23633–645, 2001.
[24] Darvish, K.K. and Crandall, J.R. Strain conditioning in the dynamicviscoelastic response of brain tissue. In BED - Bioengin. Conference -ASME, 50, 893–894, 2001.
[25] Davson, H. and Welch, K. The relations of blood, brain and cere-brospinal fluid.
[26] de Boer, R. Theory of Porous Media. Heidelberg, New York, 1999.
[27] Denny-Brown, D. and Russel, W.R. Experimental cerebral concussion.Brain, 64 93–164, 1941.
[28] Di Bona, S., Lutzemberger, L., and Salvetti, O. A simulation modelfor analysing brain structure deformations. Physics in medicine andbiology, 48 4001–4022, 2003.
[29] Dingwall, E.J. Artificial Cranial Deformation. John Bale, Sons &Danielsson, Ltd., London, 1931.
[30] Djerad, S.E., Duburck, F., Naili, S., and Oddou C. Analysis of the un-steady rheological behaviour of a sample from cardiac muscle. ComptesRendus de L Academie des Science serie II, 315 1615–1621, 1992.
118 Bibliography
[31] Donnelly, B.R. and Medige, J. Shear properties of human brain tissue.J. Biomech. Engrg, 119 423–432.
[32] Dorfmann, A. and Ogden, R.W. A pseudo-elastic model for loading,partial unloading and reloading of particle-reinforced rubber. Int. J.Solids Struct., 40 2699–2714, 2003.
[33] Dorfmann, A. and Ogden, R.W. A constitutive model for the mullinseffect with permanent set in particle-reinforced rubber. Int. J. SolidsStruct., 41 1855–1878, 2004.
[34] Egnor, R.S. Radiological assessment of hydrocephalus: new theoriesand implications for therapy. Neurosurg. Rev., 27 166, 2004.
[35] Enderle, J., Blanchard, S., and Bronzino, J. Introduction to biomedicalengineering. Academic Press Series in Biomedical Engineering, 2005.
[36] Engin, A.E. and Wang, H.C. A mathematical model to determine vis-coelastic behavior of in vivo primate brain. J. Biomechanics, 3 283–296,1970.
[37] Estes, M.S. and McElhaney, J.H. Response of brain tissue of compressiveloading. ASME, 70-BHF-13 1–4, 1970.
[38] Fallenstein, G.T., Hulce, V.D., and Melvin, J.W. Dynamic mechanicalproperties of human brain tissue. J. Biomechanics, 2 217–226, 1969.
[39] Ferrant, M., Nabavi, A., Macq, B., Jolesz, F.A., Kikinis, R., andWarfield, S.K. Registration of 3-d intraoperative mr images of the brainusing a finite-element biomechanical model. IEEE Trans. Medic. Imag.,20(12) 1384–1397, 2001.
[40] Finkel, L.H. Neuroengineering models of brain disease. Annu. Rev.Biomed. Eng., 2 577–606, 2000.
[41] Foltz, L.E. and Ward, A.A. Communicating hydrocephalus from sub-arachnoid bleeding. In Meeting of the Harvey Cushing Society, 546–566,Honolulu, Hawaii, April 16 1956.
[42] Fountoulakis, M., Hardmeier, R., Hoger, H., and Lubec, G. Postmortemchanges in the level of brain proteins. Experimental Neurology, 167 86–94, 2001.
Bibliography 119
[43] Franceschini, G., Bigoni, D., Regitnig, P., and Holzapfel, G.A. Braintissue deforms similarly to filled elastomers and follows consolidationtheory. Submitted, 2006.
[44] Fung, Y.C. Biomechanics. Mechanical properties of living tissues.Springer Verlag, New York, 1993.
[45] Galford, J.E. and McElhaney, J.H. Some viscoelastic properties of scalp,brain and dura. Am. Soc. Mech. Eng. , 69-BHF-7 1–8.
[46] Galford, J.F. and McFlhaney. A viscoelastic study of scalp, brain anddura. J. Biomechanics, 3 211–221, 1970.
[47] Geddes, D.M. and Cargill, R.S. An in vitro model of neural trauma:device characterization and calcium response to mechanical stretch. J.Biomech. Engrg, 123 247–255, 2001.
[48] Gefen, A., Gefen, N., Raghupathi, R., and Margulies, S.S. Infant ratbrain tissue is significantly stiffer than adult. In Summer Bioengng.confer., Florida, USA, June 25-29 2003.
[49] Gefen, A., Gefen, N., Zhu, Q.L., Raghupathi, R., and Margulies, S.S.Age-dependent changes in material properties of the brain and braincaseof the rat. J. of Neurotrauma, 20 1163–1177, 2003.
[50] Gefen, A. and Margulies, S.S. Are in vivo and in situ brain tissuesmechanically similar? J. Biomechanics, 37 1339–1352, 2004.
[51] Gei, M. Bifurcation and Wave Propagation in Coated Structures underFinite Strain. PhD thesis, Universita degli Studi di Trento, 2001.
[52] Gibson, R.E. and Lo, K.Y. A theory of consolidation for soils ehibitingsecondary compression. Acta Polytech. Scandinavica , 296 1–15, 1961.
[53] Goldsmith, W. The state of head injury biomechanics:past, present, andfuture: part 1. Crit. Rev. Biomed. Eng., 29 441–600, 2001.
[54] Gray, H.F. The Complete Gray’s Anatomy. Senate, Stuttgart - NewYork, 2003.
[55] Green, H.A.L., Pena, A., Price, C.J., Warburton, E.A., Pickard, J.D.,Carpenter, T.A., and Gillard, J.H. Increased anisotropy in acute stroke- a possible explanation. Stroke, 33 1517–1521, 2002.
120 Bibliography
[56] Greitz, D. Radiological assessment of hydrocephalus: new theories andimplications for therapy. Neurosurg. Rev., 27 146–165, 2004.
[57] Gross, A.G. A new theory on the dynamics of brain concussion andbrain injury. J. Neurosurgery, 15 548–561, 1958.
[58] Guillaume, A., Osmont, D., Gaffie, D., Sarron, J.C., and Quandieu, P.Effects of perfusion on the mechanical behavior of the brain exposed tohypergravity. J. Biomechanics, 30(4) 383–389, 1997.
[59] Haar, P.J. Brain tissue structure and micromechanics. PhD thesis,University of, 2002.
[60] Haar, P.J., Stewart, J.E., Gillies, G.T., Prabhu, S.S., and Broaddus,W.S. Quantitative three-dimensional analysis and diffusion modeling ofoligonucleotide concentrations after direct intraparenchymal brain infu-sion. IEEE Trans. Biomed. Engrg, 48(5) 560–569, 2001.
[61] Hakim, C.A., Hakim, R., and Hakim, S. Normal-pressure hydro-cephalus. Neurosurg. Clin. North Amer., 36 761–773, 2001.
[62] Hakim, S. Biomechanics of hydrocephalus. Acta Neurol. Latinoamer.,17 169–194, 1971.
[63] Hakim, S. Biomechanics of hydrocephalus. In Harbert, C., editor, Cis-ternography and Hydrocephalus., 25–55. C.C. Thomas, Springfield, 1972.
[64] Hakim, S. and Adams, R.D. The special clinical problem of symptomatichydrocephalus with normal cerebrospinal fluid pressure. observation oncerebrospinal fluid hydrodynamics. J. Neurol. Sci., 2 307–327.
[65] Hakim, S. and Burton, J.D. The engineering of hydraulic valves for thetreatment of hydrocephalus. Engrg. in Medicine, 3 3–7, 1974.
[66] Hakim, S. and Hakim, C. A biomechanical model of hydrocephalus andits relationship to treatment. In K. Shapiro, A. Marmarou, and Portnoy,H., editors, Hydrocephalus, 143–160. Raven Press, New York, 1984.
[67] Hakim, S., Venegas J.G., and Burton, J.D. The physics of the cranialcavity, hydrocephalus and normal pressure. hydrocephalus: Mechanicalinterpretation and mathematical model. Surg. Neurol., 5 187–210, 1976.
Bibliography 121
[68] Halldin, P., von Holst, H., and Erikkson, I. An experimental headrestraint concept for primary prevention of head and neck injuries infrontal collisions. Accid. Anal. and Prev., 30 535–543, 1998.
[69] Hardy, W.N., Khalil, T.B., and King, A.I. Literature-review of head-injury biomechanics. Int. J. Impact Eng., 15 561–586, 1994.
[70] Hartkens, T., Hill, D. L. G., Castellano-Smith, A.D., Hawkes, D.J.,Maurer Jr., C.R., Martin, A.J., Hall, W.A., Liu, H., and Truwit, C.L.Measurement and analysis of brain deformation during neurosurgery.IEEE Trans. Medic. Imag., 22 82–92, 2003.
[71] Hill, D.L.G., Maurer, C.R., Maciunas, R.J., Barwise, J.A., Fitzpatrick,J.M., and Wang, M.Y. Measurement of intraoperative brain surfacedeformation under a craniotomy. Neurosurgery, 43(3) 514–526, 1998.
[72] Holbourn, A.H.S. The mechanics of head injuries. Brit. Med. Bull., 3147–149, 1945.
[73] Holtz, R.D. and Kovacs, W.D. An Introduction to Geotechnical Engi-neering. Prentice Hall, Inc., N.J., 1981.
[74] Holzapfel, G.A. Nonlinear Solid Mechanics. Wiley, Chichester, 2000.
[75] Holzapfel, G.A., Sommer, G., and Regitnig, P. Anisotropic mechanicalproperties of tissue components in human atherosclerotic plaques. J.Biomech. Engrg, 126 657–665, 2004.
[76] Holzapfel, G.A., Stadler, M., and Ogden, R.W. Aspects of stress soften-ing in filled rubbers incorporating residual strains. In Dorfmann, A. andMuhr, A., editors, Constitutive Models for Rubber, 189–193. Balkema,Rotterdam, 1999.
[77] Hourwink, R. Elasticity, Plasticity and Structure of Matter. DoverPublication Inc., 1958.
[78] Hutchison, B.L., Hutchison, L.A.D., Thompson, J.M.D., and Mitchell,E.A. Plagiocephaly and brachycephaly in the first two years of life: Aprospective cohort study. Pediatrics, 114 970–980, 2004.
[79] Ishikawa, T., Kajii, S., Matsunaga, K., Hogami, T., Kohtoku, Y., andNagasawa, T. A tough, thermally conductive silicon carbide compositewith high strength up to 1600c in air. Science, 282 1295–1297, 1998.
122 Bibliography
[80] Ivarsson, J., Viano, D.C., Lovsund, P., and Aldman, B. Strain relieffrom the cerebral ventricles during head impact: experimental studieson natural protection of the brain. J. Biomechanics, 33 181–189, 2000.
[81] Jain, R.K. and Baxter, L.T. Mechanisms of heterogeneous distributionof monoclonal antibodies and other macromolecules in tumors: signifi-cance of elevated interstitial pressure. Cancer Res., 48 7022–7032, 1988.
[82] Johnson, M.A. and Beatty M.F. A constitutive equation for the mullinseffect in stress controlled uniaxial exstension experiments. ContinuumMechanics and Termod., 5 301–318, 1993.
[83] Johnson, M.A. and Beatty M.F. The mullins effect in uniaxial exten-sion and its influence on the transverse vibration of a rubber string.Continuum Mechanics and Termod., 5 83–115, 1993.
[84] Kaczmarek, M., Subramaniam, R.P., and Neff, S.R. The hydromechan-ics of hydrocefalus: steady-state solutions for cylindrical geometry. Bull.Math. Biol., 59 295–323, 1997.
[85] Kahle, W. and Frotscher, M. Nervous System and Sensory Organs,Color Atlas of Human Anatomy, Vol. 3. Thieme, Stuttgart - New York,2003.
[86] Kingsbury, M.A., Rehen, S.K., Contos, J.J.A., Higgins, C.M., and Chun,J. Non-proliferative effects of lysophosphatidic acid enhance corticalgrowth and folding. Nature Neuroscience, 6 1292–1299, 2003.
[87] Kleiven, S. Finite element modeling of the human head. PhD thesis,Royal Institute of Technology, Stockholm, Sweden.
[88] Kyriacou, S.K. and Davatzikos, C. A biomechanical model of soft tissuedeformation, with applications to non-rigid registration of brian imageswith tumor pathology. In Lectures notes in computer science, 1496,531–538. MICCAI, 1998.
[89] Kyriacou, S.K., Mohamed, A., Miller, K., and Neff, S. Brain mechanicsfor neurosurgery: modelling issues. Biomech. Modeling in Mechanobiol-ogy, 1 151–164, 2002.
[90] LaPlaca, M.C., Cullen, D.K., McLoughlin, J.J., and Cargill, R.S. Highrate shear of three-dimensional neural cell cultures:a new in vitro trau-matic brain injury model. J. Biomechanics, in press, 2005.
Bibliography 123
[91] Lewin, R. Is your brain really necessary? Science, 210 1232–1234, 1980.
[92] Lion, A. On the large deformation behaviour of reinforced rubber atdifferent temperatures. J. Mech. Phys. Solids, 45 1805–1834, 1997.
[93] Lippert, S.A. and Grimm, M.J. Estimating the material properties ofbrain tissue at impact frequencies: a curve-fitting solution. In SummerBioengng. confer., Florida, USA, June 25-29 2003.
[94] Margulies, S.S. and Thibault K.L. Infant skull and suture properties:measurements and implications for mechanisms of pediatric brain injury.J. Biomech. Engrg, 122 364–371, 2000.
[95] Margulies, S.S., Thibault, L.E., and Gennarelli, T.A. Physical modelsimulations of brain injury in the primate. J. Biomechanics, 23 823–836,1990.
[96] Markin, V.S., Tanelian, D.L., Jersild, R.A., and Ochs, S. Biomechanicsof stretch-induced beading. Biophysical J., 76 2852–2860, 2003.
[97] Masserman, J.H. Cerebrospinal hydrodynamics: Iv. clinical experimentsstudies. Arch. Neurol. and Psychiat., 32 523–553, 1934.
[98] Meaney, D.F. Relationship between structural modeling and hypere-lastic material behavior: application to cns white matter. Biomech.Modeling in Mechanobiology, 1 279–293, 2003.
[99] Melvin, J.W., Lighthall, J.W., and Ueno, K. Brain injury biomechanics.
[100] Mendis, K.K., Stalkaner, R.L., and Advani, S.H. A constitutive rela-tionship for large deformation finite element modeling of brain tissue.J. Biomech. Engrg, 117 279–285, 1995.
[101] Metz, H., McElhaney, J., and Ommaya, A.K. A comparison of theelasticity of live, dead, and fixed brain tissue. J. Biomechanics, 3 453–458, 1970.
[102] Miga, M.I., Paulsen, K., Kennedy, F., Hoopes, J., Hartov, A., andRoberts, D. Initial in-vivo analysis of 3d heterogeneous brain compu-tations for model-updated image-guided neurosurgery. In MICCAI’98,LNCS 1496, 743–752, 1998.
124 Bibliography
[103] Miga, M.I., Paulsen, K.D., Hoopes, P.J., Kennedy, F.E., Hartov, A.,and Roberts, D.W. In vivo modeling of interstitial pressure in the brainunder surgical load using finite elements. J. Biomech. Engrg, 122 354–363, 2000.
[104] Miga, M.I., Paulsen, K.D., Hoopes, P.J., Kennedy, F.E., Hartov, A.,and Roberts, D.W. In vivo quantification of a homogeneous brain de-formation model for updating preoperative images during surgery. IEEETrans. Biomed. Engrg, 47(2) 266–273, 2000.
[105] K. Miller. Modelling soft tissue using biphasic theory – a word of caution.Comput. Meth. Biomech. Biomed. Engrg., 1 261–263, 1998.
[106] Miller, K. Finite deformation, linear and non-linear viscoelastic modelsof brain tissue mechanical properties. In ASME Summer BioengineeringConference, 297–298, Montana, USA, 1999.
[107] Miller, K. How to test very soft biological tissues in extension? J.Biomechanics, 34 651–657, 2001.
[108] Miller, K. Biomechanics of brain for computer integrated surgery. Pub-lishing House of the Warsaw University of Technology., Warsaw, 2002.
[109] Miller, K. Method of testing very soft biological tissues in compression.J. Biomechanics, 38 153–158, 2005.
[110] Miller, K. and Chinzei K. Constitutive modelling of brain tissue: ex-periment and theory. J. Biomechanics, 30 1115–1121, 1997.
[111] Miller K. and Chinzei K. Simple validation of biomechanical models ofbrain tissue. In 11th Conference of the ESB, Toulouse, France, July 8-111998.
[112] Miller, K. and Chinzei, K. Mechanical properties of brain tissue intension. J. Biomechanics, 35 483–490, 2002.
[113] Miller, K., Chinzei, K., Orssengo, G., and Bednarz P. Mechanical prop-erties of brain tissue in-vivo: experiment and computer simulation. J.Biomechanics, 33 1369–1376, 2000.
[114] Momjian, S., Owler, B.K., Czosnyka Z., Czosnyka M., Pena, A., andPickard, J.D. Pattern of white matter regional cerebral blood flow andautoregulation in normal pressure hydrocephalus. Brain, 127 965–972,2004.
Bibliography 125
[115] Monson, K.L., Goldsmith, W., Barbaro, N.M., and Manley, G.T. Axialmechanical properties of fresh human cerebral blood vessels. J. Biomech.Engrg, 125 288–294, 2003.
[116] Mota, A., Klug, W.S., Ortiz, M., and Pandolfi, A. Finite-element simu-lation of fireman injury to the human cranium. Comput. Mechanics, 31115–121, 2003.
[117] Mullins, L. Effect of stretching on the properties of rubber. J. RubberRes., 16 275–289, 1947.
[118] Nagashima, T., Tamaki, N., Matsumoto, S., Horwitz, B., and Seguchi,Y. Biomechanics of hydrocephalus: a new theoretical model. The Neu-roscientist, 21 898–904, 1987.
[119] Nicholson, C. Diffusion from an injected volume of a substance in braintissue with arbitrary volume fraction and tortuosity. Brain, 333 325–329, 1985.
[120] Oehmichen, M., et al. Axonal injury - a diagnostic tool in forensicneuropathology? Forensic Science Int., 95 67–83, 1998.
[121] Ogden, R.W. Large deformation isotropic elasticity - on the correlationof theory and experiment for compressible rubberlike solids. Proc. R.Soc. Lond. A, 328 567–583, 1972.
[122] Ogden, R.W. Large deformation isotropic elasticity - on the correlationof theory and experiments for incompressible rubberlike solids. Proc. R.Soc. Lond. A, 326 565–584, 1972.
[123] Ogden, R.W. Nearly isochoric elastic deformations: application to rub-berlike solids. J. Mech. Phys. Solids, 26 37–57, 1978.
[124] Ogden, R.W. Non-linear elastic deformations. Ellis Horwood, Chich-ester, 1984.
[125] Ogden, R.W. Recent advances in the phenomenological theory of rubberelasticity. Rubber Chem. Tech., 59 361–383, 1986.
[126] Ogden, R.W. and Roxburgh, D.G. A pseudo-elastic model for themullins effect in filled rubber. Proc. R. Soc. Lond. A, 455 2861–2877,1999.
126 Bibliography
[127] O’Loughlin, V.D. Effect of different kinds of cranial deformation on theincidence of wormian bones. Am. J. Phys. Anthropology, 123 146–155,2004.
[128] Oloyede, A. and Broom, N.D. Is classical consolidation theory applicableto articular cartilage deformation? Clinical Biomech., 6 206–212, 1991.
[129] Oloyede, A. and Broom, N.D. Complex nature of stress inside loadedarticular cartilage. Clinical Biomech., 9 149–156, 1994.
[130] Ommaya, A.K. Mechanical properties of tissues of the nervous system.J. Biomechanics, 1 127–138, 1968.
[131] Pamidi, M.R. and Advani, S.H. Nonlinear constitutive relations forhuman brain tissues. J. Biomech. Engrg, 100 44–48, 1978.
[132] Park, H.K., Fernandez, I., Dujovny, M., and Diaz, F.G. Experimentalanimal models of traumatic brain injury:mediacal and biomechanicalmechanism. Crit. Rev. Neurosurg., 9 44–52, 1999.
[133] Penn, R.D. and Clasen, R.A. Traumatic brain swelling and edema.
[134] Pfister, B. and Bao, G. Displacement-controlled stretch injury of neuralcells. In Summer Bioengng. confer., Florida, USA, June 25-29 2003.
[135] Prange, M.T. and Margulies S.S. Regional, directional, and age-dependent properties of the brain undergoing large deformation. J.Biomech. Engrg, 124 244–252, 2002.
[136] Puthuparampil, D.J. and Crisp, J.D.C. On the evaluation of mechanicalstresses in the human brain while in motion. Brain Research, 26 15–35,1971.
[137] Rang, E.M. and Grimm, M.J. Ultrasonic assessment of white matteras a function of predominant axon orientation. In Summer Bioengng.confer., Florida, USA, June 25-29 2003.
[138] Rang, E.M., Lippert, S.A., and Grimm, M.J. The degregation of thematerial properties of brain tissue as a function of time postmortem.BED - Bioengin. Conference - ASME, 50 887–888.
[139] Richman, D.P., Steward, R.M., Hutchinson, J.W., and Caviness, V.S.Jr.Mechanical model of brain convolution development. Science, 189 18–21, 1975.
Bibliography 127
[140] Roeder, B.A., Kokini, K., Sturgis, J.E., Robinson J.P., and Voytik-Harbin, S.L. Tensile mechanical properties of three-dimensional type icollagen extracellular matrices with varied microstructure. J. Biomech.Engrg, 124 214–222, 2002.
[141] Sahay, K.B. and Kothiyal, K.P. A nonlinear hyper-ealstic model ofpressure-volume function of cranial component. Int. J. Neuroscience,23 301–309, 1984.
[142] Sahay, K.B., Mehrotra, R., Sachdeva, U., and Banerji, A.K. Elastome-chanical characterization of brain tissues. J. Biomechanics, 25 319–326,1992.
[143] Sarron, J.C., Blondeau, C., Guillaume, A., and Osmont, D. Identifi-cation of linear viscoelastic constitutive models. J. Biomechanics, 33685–693, 2000.
[144] Scannell, J.W. Determining cortical landscapes. Nature, 386 452, 1997.
[145] Schettini, A. and Walsh, E.K. Brain tissue elastic behavior and experi-mental brain compression. Am. J. Physiol., 255 R799–R805, 1976.
[146] Schettini, A. and Walsh, E.K. Contribution of brain distortion anddisplacement to csf dynamics in experimental brain compression. Am.J. Physiol., 260(1) R172–R178, 1976.
[147] Schijman, E. Artificial cranial deformations in newborns in the pre-columbian andes. Child’s Nerv. Syst., page in press, 2005.
[148] Schrot, R.J. and Muizelaar, J.P. Mannitol in acute traumatic braininjury. Lancet, 359 1633–1634, 1970.
[149] Shuck, L.Z. and Advani S.H. Rheological response of human brain tissuein shear. J. Basic Engrg, 94 905–911, 1972.
[150] Sklar, F.H. and Elashvili, I. The pressure-volume function of brainelasticity physiological considerations and clinical applications. J. Neu-rosurgery, 47 670–679, 1977.
[151] Smith, D.H. and Meaney, D.F. Axonal damage in traumatic brain injury.The Neuroscientist, 6(6) 483–495, 2000.
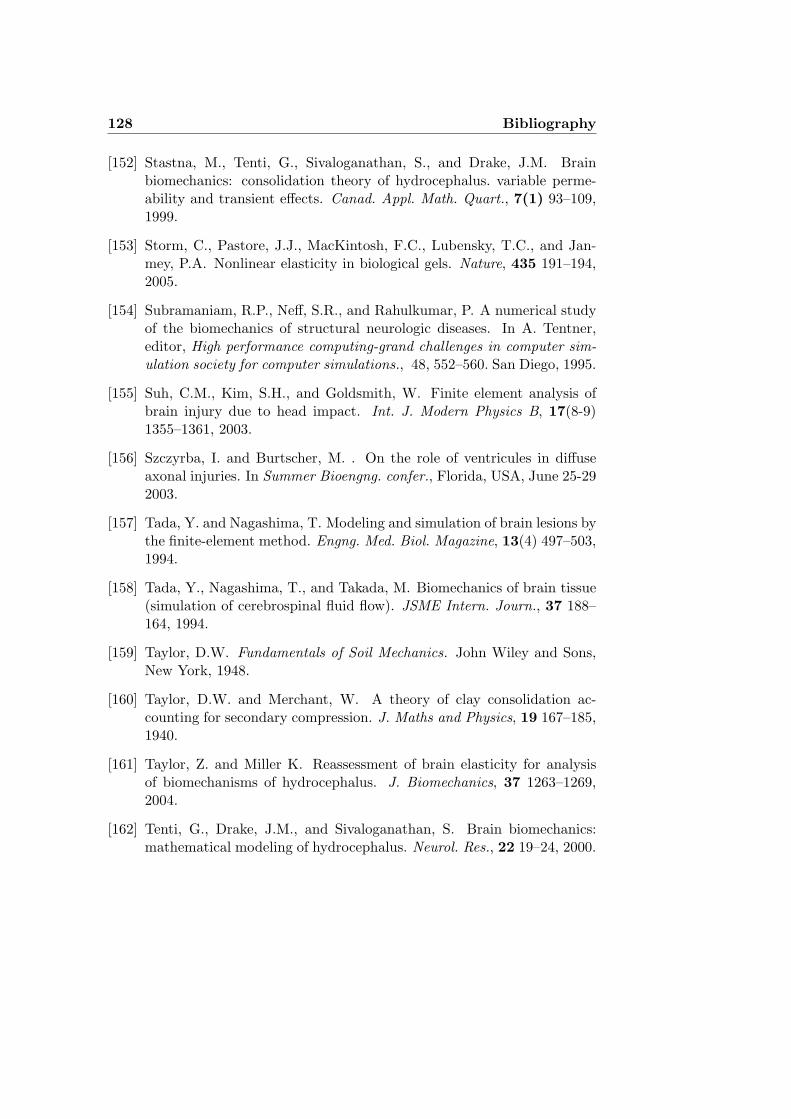
128 Bibliography
[152] Stastna, M., Tenti, G., Sivaloganathan, S., and Drake, J.M. Brainbiomechanics: consolidation theory of hydrocephalus. variable perme-ability and transient effects. Canad. Appl. Math. Quart., 7(1) 93–109,1999.
[153] Storm, C., Pastore, J.J., MacKintosh, F.C., Lubensky, T.C., and Jan-mey, P.A. Nonlinear elasticity in biological gels. Nature, 435 191–194,2005.
[154] Subramaniam, R.P., Neff, S.R., and Rahulkumar, P. A numerical studyof the biomechanics of structural neurologic diseases. In A. Tentner,editor, High performance computing-grand challenges in computer sim-ulation society for computer simulations., 48, 552–560. San Diego, 1995.
[155] Suh, C.M., Kim, S.H., and Goldsmith, W. Finite element analysis ofbrain injury due to head impact. Int. J. Modern Physics B, 17(8-9)1355–1361, 2003.
[156] Szczyrba, I. and Burtscher, M. . On the role of ventricules in diffuseaxonal injuries. In Summer Bioengng. confer., Florida, USA, June 25-292003.
[157] Tada, Y. and Nagashima, T. Modeling and simulation of brain lesions bythe finite-element method. Engng. Med. Biol. Magazine, 13(4) 497–503,1994.
[158] Tada, Y., Nagashima, T., and Takada, M. Biomechanics of brain tissue(simulation of cerebrospinal fluid flow). JSME Intern. Journ., 37 188–164, 1994.
[159] Taylor, D.W. Fundamentals of Soil Mechanics. John Wiley and Sons,New York, 1948.
[160] Taylor, D.W. and Merchant, W. A theory of clay consolidation ac-counting for secondary compression. J. Maths and Physics, 19 167–185,1940.
[161] Taylor, Z. and Miller K. Reassessment of brain elasticity for analysisof biomechanisms of hydrocephalus. J. Biomechanics, 37 1263–1269,2004.
[162] Tenti, G., Drake, J.M., and Sivaloganathan, S. Brain biomechanics:mathematical modeling of hydrocephalus. Neurol. Res., 22 19–24, 2000.
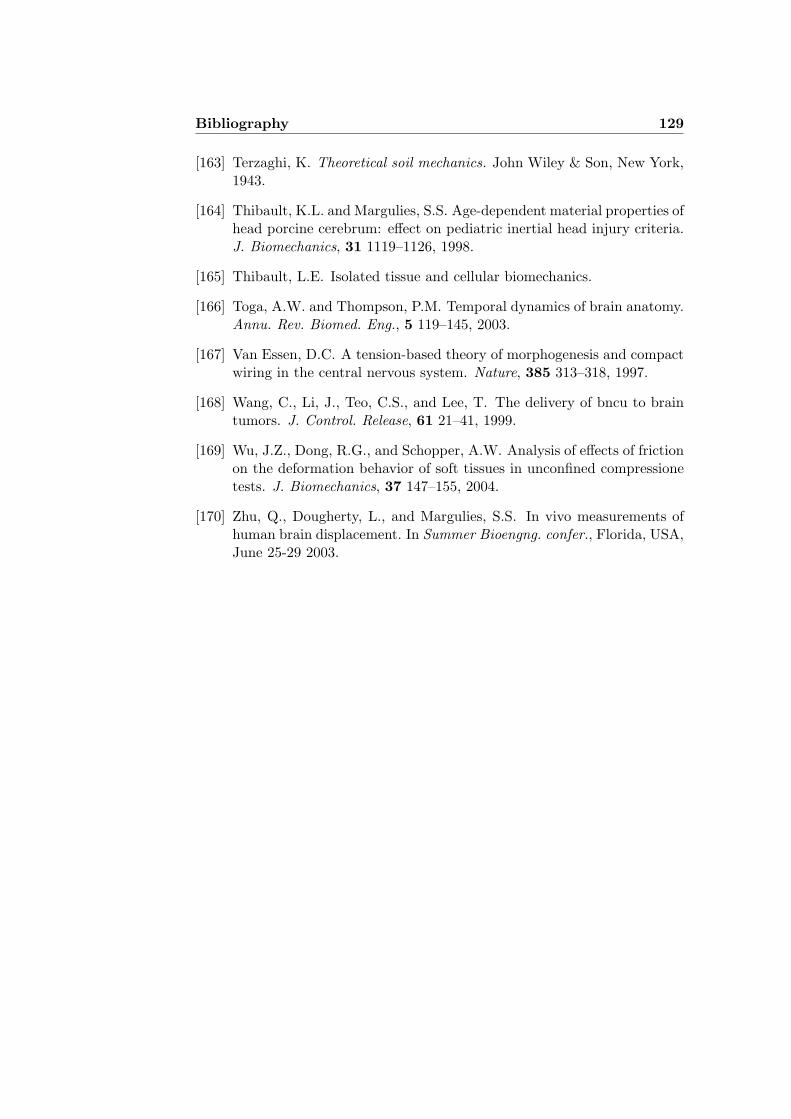
Bibliography 129
[163] Terzaghi, K. Theoretical soil mechanics. John Wiley & Son, New York,1943.
[164] Thibault, K.L. and Margulies, S.S. Age-dependent material properties ofhead porcine cerebrum: effect on pediatric inertial head injury criteria.J. Biomechanics, 31 1119–1126, 1998.
[165] Thibault, L.E. Isolated tissue and cellular biomechanics.
[166] Toga, A.W. and Thompson, P.M. Temporal dynamics of brain anatomy.Annu. Rev. Biomed. Eng., 5 119–145, 2003.
[167] Van Essen, D.C. A tension-based theory of morphogenesis and compactwiring in the central nervous system. Nature, 385 313–318, 1997.
[168] Wang, C., Li, J., Teo, C.S., and Lee, T. The delivery of bncu to braintumors. J. Control. Release, 61 21–41, 1999.
[169] Wu, J.Z., Dong, R.G., and Schopper, A.W. Analysis of effects of frictionon the deformation behavior of soft tissues in unconfined compressionetests. J. Biomechanics, 37 147–155, 2004.
[170] Zhu, Q., Dougherty, L., and Margulies, S.S. In vivo measurements ofhuman brain displacement. In Summer Bioengng. confer., Florida, USA,June 25-29 2003.

130 Bibliography