Embed Size (px)
Citation preview
The media and advertising: a tale oftwo-sided markets
Simon P. Anderson∗and Jean J. Gabszewicz†
This version August 2005.COMMENTS WELCOME
Prepared for: Handbook of Cultural Economics; eds. Victor Ginsburgh andDavid Throsby, Elsevier Science, forthcoming
Abstract
Media industries are important drivers of popular culture. A largefraction of leisure time is devoted to radio, magazines, newspapers, theInternet, and television (the illustrative example henceforth). Mostadvertising expenditures are incurred for these media. They are alsomainly supported by advertising revenue. Early work stressed possi-ble market failures in program duplication and catering to the LowestCommon Denominator, indicating lack of cultural diversity and qual-ity. The business model for most media industries is underscored byadvertisers’ demand to reach prospective customers. This businessmodel has important implications for performance in the market sinceviewer sovereignty is indirect. Viewers are attracted by programming,though they dislike the ads it carries, and advertisers want viewers aspotential consumers. The two sides are coordinated by broadcasters(or ”platforms”) that choose ad levels and program types, and adver-tising finances the programming. Competition for viewers of the demo-graphics most desired by advertisers implies that programming choiceswill be biased towards the tastes of those with such demographics. The
∗Department of Economics, University of Virginia, PO Box 400182, Charlottesville VA22904-4128, USA. [email protected]
†CORE, 34 Voie du Roman Pays, B-1348 Louvain-la-Neuve, [email protected]
1
ability to use subscription pricing may help improve performance bycatering to the tastes of those otherwise under-represented, thoughhigher full prices tend to favor broadcasters at the expense of viewersand advertisers. If advertising demand is weak, program equilibriumprogram selection may be too extreme as broadcasters strive to avoidruinous subscription price competition, but strong advertising demandmay lead to strong competition for viewers and hence minumum dif-ferentiation (”la pensee unique”). Markets (such as newspapers) witha high proportion of ad-lovers may be served only by monopoly dueto a circulation spiral: advertisers want to place ads in the paper withmost readers, but readers want to buy the paper with more ads.Keywords: advertising finance, two-sided markets, platform com-
petition, pensee unique, circulation spiralJEL Numbers: D43, L13, L82, M37, Z11
1 Introduction
Sociologists, political scientists, lawyers, historians, and philosophers all havetheir views about the media. The wide scientific interest in media reflects thegrowing importance of entertainment and communication in today’s informa-tion society. Citizens in developed countries devote the lion’s share of theirleisure time to consuming mass media such as television and newspapers. Itmay not be too large a stretch of the imagination to say that leisure timeuse (job satisfaction aside and ignoring eating pleasure in those cultures withfine cuisine) determines much of the quality of life: by extension, the qualityof life for many people is thus underpinned by the quality of the media!1 Inthis respect the media industries, and the broadcasting industry in particu-lar, take on an overall importance to the national well-being far beyond thedollar or euro magnitude of the sector in the national accounts.2
Much of today’s popular culture derives from television programming.Children at school copy the actions and characters of their heroes seen on TVthe evening before, adults retell jokes and rehash story lines, and the hairstyleof the leading lady in Friends becomes a topic of national debate. Media arealso the source of news of current affairs and political actions. The way thenews are presented can also shape public opinion and, by influencing citizens’voting behavior, can even establish or depose governments and presidents.Surprisingly enough, the media were long ignored by economists, despite
the fact that media content cannot exist without some physical medium(TV sets, newspapers, magazines) that is produced and exchanged in a mar-ket. Yet the media are not traditional products like butter, gasoline, orsugar. First, media firms (in most cases) produce and distribute a publicgood: one person’s consumption of a media product does not diminish theability of another to consume it (non-rivalrousness).3 Second, media prod-
1The average American watches over four hours of TV per day. In Japan, the figure isthree hours and thirty minutes, and in Europe only slightly more. Subtracting hours ofsleep, hours worked, hours commuting, and hours eating from the daily total of 24 hourswe conclude that leisure time is mostly devoted to watching TV.
2The intrusion of American cultural values and icons into European homes through thetelevision screen is one reason why many countries (such as France with the “exceptionculturelle”) restrict non-local content of programming.
3Some media products also share the other property common to public goods, non-excludability, like free newspapers or television broadcasting. Other media products, likecable broadcasting or magazines, are excludable, see Samuelson (1964) for further discus-sion.
1
ucts in many countries are viewed as merit goods, a category of goods wherethe state makes a paternalistic judgment that consumption is “good.” Suchconsumption is often encouraged by public spending (whereas “merit bads”are discouraged by taxes or regulations and restrictions). With merit goods,“public” evaluation is seen as different from the private one, so rejecting apurely individualistic view of consumer benefits. This stance derives from thefact that media constitute a powerful instrument of education whose natureand diversity considerably shape the collective values of society. Finally, mostmedia companies finance their activities (at least partially) by advertising.Media firms need advertisers to make the production of media content worth-while, while advertisers need media firms to make their products known topotential consumers.4 Consequently, the media industry sells a joint productto two different categories of buyers: the medium itself to advertisers, andthe medium content to media consumers (readers, TV-watchers, web-surfers,etc.).Media firms thereby operate in two different industries and get their prof-
its from both. From this two-sided interest, the cultural content offered tomedia consumers is shaped by the desire to offer advertisers a vehicle thatreaches as many prospective consumers as possible: “when news sell ‘eye-balls’ to advertisers, the question becomes what content can attract readersor viewers rather than what value will consumers place on content” (Hamil-ton, 2004). This potential bias in the type of programming or reading contentoffered may bias popular culture as well. The ads themselves are the subjectof cult followings, and characters in ads may lead fashions and fads. Thedollar amount spent on ads is the tip of a larger economic iceberg: insofaras new product introduction needs or is facilitated by advertising, productturnover and product generation is determined by ads. Some might say tastestoo are influenced by ads. Ads can certainly create hype and fashions. Adver-tising also forms and reflects popular culture. It is important economicallynot only because of the fraction of GDP that it represents directly (around2%) but also because it may facilitate the introduction of new products tomarket and so underscore a larger fraction of GDP.Competition for advertising revenues therefore governs market perfor-
mance; commercial television needs advertising revenue to survive (subscrip-
4The degree of advertising in media financing varies across media and countries. Publicbroadcasting services financed only by public subscription exist in England or Japan,while other media are fully financed by ads, like free newspapers and commercial TVbroadcasting.
2
tion pricing aside). Competition for advertising revenues therefore governsmarket performance. The willingness to pay of advertisers to contact view-ers of particular demographics thus determines the type and range of pro-grammes offered in a free market system. This is very different from a tradi-tional market structure where the principle of consumer sovereignty governsthe type and range of products offered on the market. In conventional eco-nomic markets, consumers “vote” with their dollar purchasing power for theproducts they want, and firms, seeking profits, have the incentive to pro-vide what consumers want. In the commercial television context, viewersovereignty is filtered and muted. Viewers “vote” with their eyeballs for theprograms they want to watch, and broadcasters need to deliver eyeballs toadvertisers. However, different eyeballs get different vote weights in the sensethat advertisers care about the type of viewers who are delivered - those mostinclined to change their purchase behavior and buy copious quantities of theproduct on display are those of most interest to the advertiser. In additionto this type of distortion (whose consequences we elaborate upon below),media market performance can be sub-optimal for more subtle reasons evenwhen all viewers are equally weighted by advertisers. The reason stems fromthe particular market interaction inherent in the commercial television mar-ket, which forms a leading example of a “two-sided market” with networkexternalities.5 In a two-sided market, two groups interact through an inter-mediary, or platform, that accounts for the externalities between the groups.In the media context, the platform is the broadcast company (or companies)and the two interacting groups are advertisers and viewers. Advertisers likemore viewers to receive their messages. Viewers though find advertising anuisance insofar as it detracts from time available to watch a program. Themore advertisements are carried, the more the viewers are disappointed, sothe former impart a negative externality on the latter. However, the viewersdo not pay a direct price for the entertainment that they receive.A similar structure governs commercial radio. Many Internet sites are
also financed solely by advertising revenues from click-throughs and pop-upads, which are also frequently a nuisance to surfers (at least, those who do notclick through!) Magazines and newspapers are founded on a similar businessmodel, and derive much of their revenue from the advertisements they carry.
5Although most two-sided markets studied in the literature involve bilateral positiveexternalities, broadcasting instead typically involves negative externalities to viewers fromadvertisers and positive externalities on advertisers from the number of viewers.
3
However, they also typically charge a direct price to their readers. This is truenow for pay-per-view television, and for premium television shows too. Cabletelevision, which involves a local service provider bundling together selectionsof channels, is an intermediary type of structure insofar as it typically carriesto the household many programs that do carry ads themselves. The abilityto price programming alters the market outcome by drawing in some directcompetition for viewers.The business model for newspapers and magazines has similar elements,
although arguably advertisements are not as much of a nuisance as they arewith television, radio, or web-pages.6 Readers can skip past the ads withouthaving to pay much attention to them, while they interrupt and postpone atelevision program. Readers may even find a positive net benefit from ads.This is especially true for classified ads in newspapers, and for products dis-played in specialist magazines (motorcycles, golf, sailing, etc.). If readers doget positive net benefits, then the market interaction may be fundamentallydifferent. If a medium attracts more readers or viewers, the more are adver-tisers willing to pay to get their messages across (this is true regardless ofwhether the readers or viewers are attracted to the messages per se). Whenreaders want to get ad exposure (“ad-loving” behavior), then the market mayloosely be described in terms of a “positive spiral”.7 That is, the more readersthere are, the more advertisers want to advertise in the paper or magazine,but then the more readers want to subscribe to it. This reinforcing effectmay mean that only a monopoly can survive in the market. This conclusionthough ought to be tempered if there is product differentiation (so that sev-eral different types of magazine can survive, offering different specialities, ornewspapers may provide different political viewpoints). Another caveat hereconcerns whether advertisers can reach readers through different media, andwhether advertisers tout their wares in several papers or magazines. Theseissues are discussed further below.In what follows we shall refer to the television context, and speak for the
most part of viewers who watch broadcasts on channels. Differences for othermedia are pointed out where pertinent.
6The existence of “Informercials” on television indicates that advertising is not a nui-sance to all viewers, too.
7Modeling this can be quite intricate. Caillaud and Jullien (2001) note that they“attempt to capture a fundamentally dynamic process by way of a static model, hencesome imperfection.”
4
2 Background
We first present some conceptual background, and then some statistical back-ground. This is followed by a description of the basic two-sided market par-adigm, as applied to media markets.
2.1 Conceptual background
Perhaps the earliest model of television program choice is due to Steiner(1952). Steiner assumed simply that viewers will watch the (single) programtype they prefer, and that different viewers have different preferences.8 Totake an example, suppose that 67% of the population will only watch gameshows, and the rest only will watch sports. Then if there are two channelsoperated by competing firms, they will both offer game shows and so dividethe larger pool of viewers. This is the Principle of Duplication, and is ar-guably prevalent on afternoon and prime-time network television. It impliesthat the market system does not cater to the minority taste. A monopolythough, with two channels, would not cannibalize its own game audience byproviding a second game show, but would instead provide a sports show andthen cater to the whole market. Implicit in the above description is thattelevision broadcasters wish to maximize viewers. This makes sense whenviewers do not mind ads, ads are sold at a fixed price per ad per viewer, andthere is a binding cap on ad levels (as in the E.U. currently). Otherwise, andas we develop in the models below, broadcasters need to worry about viewersswitching over or off, and extracting advertising revenues optimally.A similar idea to Steiner’s Duplication Principle is arrived at with a dif-
ferent variant of the model. Suppose (following Hotelling, 1929) that viewers’ideal tastes are distributed along a unit interval. Each viewer watches thechannel closest to her ideal taste point. There are two broadcasters whochoose “locations” in the unit interval, with the objective purely of maximiz-ing own viewership. Then the equilibrium is what Boulding (1955) christenedthe Principle of Minimum Differentiation. Both broadcasters choose exactly
8See Cabizza (2004) for a model with a similar preference structure. Her paper ad-dresses the extent that programs cater to minority tastes under private or public broad-casting, and in a mixed system. She also notes that, in addition to Steiner (1952), Rothen-berg (1962) and Wiles (1963) indicate the tendency for duplication of program types thatattract large audiences.
5
the same program type and split the market, just as in Steiner’s analysis.9
An alternative specification of the program scheduling problem is formu-lated by Cancian, Bills, and Bergstrom (1995).10 These authors consider twoTV channels that must decide (non-cooperatively) when to broadcast theirevening television news. Viewers prefer to watch the news as soon as theyget home from work. The times when viewers get home are distributed onan interval of time. Broadcasters strive to maximize audience size, and eachis to choose a broadcast time. This game has no pure strategy Nash equilib-rium. Indeed, whenever its opponent chooses a broadcasting time past themedian of the distribution, each network’s best response is to broadcast itsshow just before its competitor’s to get over half the viewers. Its best replywhen its competitor’s expected broadcasting time is before the median is tochoose the latest possible time and so again get over half the viewers.11
A second early concept that still resonates today is that of the LowestCommon Denominator (LCD), proposed in this context by Beebe (1977).Beebe took issue with Steiner’s assumption that viewers will not watch ifthey are not offered their most preferred program type - and hence tookissue with Steiner’s conclusion that monopoly outperforms competition interms of catering to diverse tastes. Suppose for illustration that viewers havediverse first preferences, but all would watch a game show if nothing elsewere available. Then a monopoly would have no reason to offer more thanone program, and it would air a game show. This is, by construction, theLCD program type. Competing broadcasters though would offer differentprogram types in order to attract viewers from rivals.12
These basic analyses are important as far as they go, but they miss thecrucial tension in the market. In these models, viewers are not deterred byads, and advertisers have the same willingness to pay for communicating withviewers. The important insight from the economics of platform competition
9See Eaton and Lipsey (1975) for an extension to many firms, a consideration of non-uniform consumer densities, and other extensions.10See also Nilssen and Sørgard (1998).11Gabszewicz, Laussel, and Sonnac (2004) analyze an extension of the basic Hotelling
game with single-homing advertisers and competition for viewers who dislike ads. Surpris-ingly, this extension also leads to non-existence of a pure strategy equilibrium, albeit in amore complex (two-stage) game where firms choose broadcast times and then ad levels.12Beebe (1977) presents several numerical examples of group sizes and preference
structures to determine equilibrium offerings under competition and under multi-channelmonopoly. He does so for both a fixed number of channels, and for an endogenous numberof channels determined by fixed costs of airing a channel.
6
is that the platform (broadcaster) needs to get both sides of the market onboard - viewers must be delivered to advertisers, and advertisers are thedirect revenue. How much they are willing to pay depends on the number ofviewers delivered on the other side of the market.
2.2 Statistical background
This sub-section substantiates the view that media consumption takes up alot of available leisure time, by providing some data about the time spentby consumers (readers or viewers) with various media. It also indicates theeconomic importance of advertising in the US as a fraction of total GDP andas a function of medium type, and shows that performance concerns due tolarge amounts of advertising might be quite well-founded. A break-down ofwhat advertising time on various media is worth to advertisers is given laterin the text.Table 1 shows how much time is spent by households in the US watch-
ing television. The Table documents the rise in the importance of televisionwatching over the last 50 years. The current household (not individual!) av-erage hours watched is an astounding eight per day. Arguably this rise (fromfour and a half in the 1950’s) is due to habit changes and technology changes(such as cheaper television sets ). The 1970’s and 1980’s saw householdsowning multiple sets, as well as the advent of color televisions. In the 1990’s,the set of program options (including many 24 hour programming options)increased immensely with the increased popularity of cable, satellite, etc.
INSERT TABLE 1 Time spent viewing television by households. US,1950 - 2003.
Individual watching rates are quite a lot lower than the household rates,but still around 4 hours a day in the US (a detailed break-down by mediumtype is given below.) While the US rate is the highest in the world, some othercountries come close. Corneo (2001) presents evidence that people spendroughly the same amount of time working as they do watching television sothere is a positive correlation across countries.13 Surprisingly, Norway has
13To explain this, Corneo (2001) develops a simple model in which adults choose between3 activities, work, TV watching, and “socially enjoyed leisure” (activities enjoyed withothers). To explain the positive correlation, Corneo invokes multiplicity of (Pareto-ranked)equilibria. Given that others are working long hours, it does not pay an individual to
7
the lowest number of hours watching (60% of the US figure).14 On average,people spend only 30% more time working than they do watching TV.
INSERT TABLE 2. Work and TV viewing hours across countries.
Corneo estimates an OLS regression of the correlation between hoursworked per adult (W) and hours watching television (TV). The estimatedequation is TV = -614 + 1.05 W. Both the constant and the coefficient arestatistically significant, and the R2 value is .51.Table 3 provides a breakdown across media (television, newspapers, radio,
magazines, and the Internet) of time spent. The importance of demographicsto advertisers is implicit in this Table, given the break-out of occupations,income, and education levels.15 Poorer people tend to watch more televi-sion, as do the retired. Magazine and Internet use is highest among richerindividuals.
INSERT TABLE 3. Adult time (minutes/adult) spent with major media.
To get the data in Table 3 (which pertain to January 2003), adults wereasked about their prior day’s usage (“yesterday”). The philosophy behindthis methodology is that people remember well what they did on the previousday. Interviews were evenly conducted over a 2-week period, so that the dataaggregates week-end and week-day figures (see www.tvb.org for more detailson the methodology).The cost of accessing attention differs quite substantially across media.
More detailed data are given later. For instance, the current rate for a30 second commercial on prime-time translates into a rate of 2 cents perhousehold reached. For spot television commercials, the rate is somewhathigher, at 2.7 cents per home reached. For comparison, the newspaper ratefor the year 2000 works out at nearly seven cents per home for a half-pageadvert. We turn now to the share of advertising expenditures in the economy,
invest greatly in social ties. In a related vein, Rogerson (2005) explains the big differencein continental European (France, Germany and Italy) hours worked as due to different taxrates: the Europeans consequently indulged in more “home production.”14Surprising at least, because one might imagine that long winter nights would be spent
watching television.15Wildman, McCulloch, and Kieshnick (2004) show empirically that implicit prices for
access to different individual types in a program’s viewership have different prices. Seealso Goettler (1999) and Wilbur (2004b).
8
and howmuch of this is on TV. The share of advertising in GDP has remainedroughly 2% over the last forty years.
INSERT TABLE 4 Gross Domestic Product, Total Ad Volume, and Tele-vision Ad Volume 1963-2003
A break-down in terms of advertising volume across media (also fromwww.tvb.org) is given below. The last year (2003) is broken out into sharesand the percentage change over the previous year. Television (summingbroadcast and cable) accounts for about a quarter of the total spending,and, using the data from the previous table, therefore accounts for abouthalf a percent of GDP on its own.
INSERT TABLE 5 Advertising expenditures by medium, US
Finally, the amount of advertising is also a performance concern. Inbroadcast media, especially, ads are hard to avoid Shields (2004) reports astudy by MindShare for 2003 “ad clutter” meaning non-program (commer-cials, promos, PSAs, etc.) minutes. The data are recorded in Table 9. ABC,NBC, and Fox all passed 15 mins. /hr.; and CBS has increased its clutter,but is still below the 15-minute mark at 14:18 minutes.16 All are trendingupward, as are Cable networks, though they generally carry less clutter. Atone extreme, MTV carries 15:25 minutes every hour, while ESPN carries“only” 11:48 minutes of non-programming. By contrast, the EU has adver-tising caps that restrict the level of advertising to 9 minutes per hour. Thislevel is very similar to the 9.5 non-programming minutes per hour that werestandard in the US twenty years ago. This amount was a limit on commer-cials that was agreed upon by the National Association of Broadcasters andmaintained by a voluntary code.17 There is evidence the actual programmingis being subverted with messaging too.16Some popular programs are among those with the highest clutter (for the fourth
quarter of 2003). These include “The Bachelor” (18:08 minutes), “My Wife and Kids”(17:40), “Everybody Loves Raymond” (16:15), “Survivor: Pearl Islands” (16:05), and“Friends” (16:06) (source: Shields, 2004). However, daytime television carries even moreclutter than prime- time. In November 2001, NBC’s “Days of our lives” carried 23:23minutes per hour, ABC’s “All of our children” carried 22:59 minutes, and ABC’s “Generalhospital” had 22:31 minutes. These figures, and much further interesting data on clutter,can be found in the American Association of Advertising Agencies and the Association ofNational Advertisers, Inc. joint 2001 Television Commercial Monitoring Report.17Unfortunately (and interestingly), Nielsen does not publish data on advertisement
ratings (number of people watching the ads) even though it has the technology to do so.
9
INSERT TABLE 6 Advertising minutes per hour, US prime time.
Shields suggests that total viewer demand for TV is pretty inelastic:“overall TV viewing is not that different [over the last decade] suggestingthat clutter isn’t driving viewers from the set, but may be causing them toflip [channels]” and notes that network ratings have dropped for prime timeprogramming as fragmentation spreads viewership over hundreds of channels.
2.3 Platform competition
The key to the basic market model is that advertisers want to reach viewers,but viewers dislike ads,18 and the size of each of these two segments mattersboth for the equilibrium arrangement and the optimum. The platform, orintermediary, is the broadcast company (or companies) that renders the adspalatable by bundling them with programs that are the viewers’ ultimateobjective. That is, entertainment is provided free of a direct price, andthis sugar-coats the consumption of ads the prospective consumer wouldotherwise not choose to watch. However, the platform recognizes the trade-off between higher ad levels that lead to more revenue per viewer, and theloss in viewer base from ramping up ad levels too high. Thus the platformhas to coordinate the two sides of the market to get them both on board inthe numbers that maximize revenue, and recognizing how both sides benefitor suffer from the interaction. When the market structure has more than oneplatform, competition from other platforms must also be factored into eachplatform’s calculus.The economics of two-sided markets was developed after researchers into
credit cardmarkets recognized that this is a market not immediately amenableto traditional analysis.19 Instead, credit cards and other prominent examplesare two-sided in the sense that the benefits one receives on one side of themarket depend not directly on the number of other agents on one’s own side,
18In the ad-loving variant, they do like ads.19Indeed, even though it was sometimes suggested that credit cards constitute a market
with network externalities, the prevailing model of network externalities at the time wasone in which these externalities were “one-sided.” That is, a consumer’s benefit fromcarrying a card depends on the number of other card holders. Some reflection suggeststhat this is true to the extent that more shops are likely to take a card if more prospectiveconsumers carry it. However, this mechanism ought to be modeled directly. The one-sided prototype might fit well such networks as fax machines or computer software (seeEconomides, 1996, for a review).
10
but rather on the number of agents on the other side. Thus the benefitsto a shopper from holding a card depend on the number of stores that takeit, and the benefits to a store from taking a card depend on the number ofconsumers who carry it. The credit card example has two-sided positive ex-ternalities. Here the card-issuing company is the platform, the intermediarythat coordinates the two sides of the market.The economics of two-sided markets were pioneered by Caillaud and Jul-
lien (2001, 2003) and Rochet and Tirole (2002), and further synthesized andextended by Armstrong (2003) and Rochet and Tirole (2004). The latter au-thors address the tricky task of defining two-sided markets.20 Wright (2003)provides a useful service in indicating several examples of fallacious reason-ing that would be ill-inspired from thinking about traditional markets in acontext that was actually two sided. For example, one might think pricingbelow marginal cost would be indicative of predatory intent. However, in atwo sided market, such pricing is quite natural, and stems from the need toget one side on board in order to extract surplus from the other side. In theTV context, viewers watch for “free” but advertisers pay for access. Indeed,Armstrong suggests that creates more benefits for the other side is the onethat will enjoy low prices (for joining the platform). Wright though warnsagainst thinking of this as a cross-subsidy from one side to the other, pointingout that with traditional subsidies, the side “paying” would prefer that theother were eliminated, along with the implicit tax. In the television context,the advertisers definitely would NOT like to see the viewers barred from themarket! Rather, it is the low (or zero) price that attracts the viewers andtherefore provides the surplus to the advertisers.21
20The typical firm must get both worker and consumer sides “on board” in the sense ofcoordinating different agent groups, but this should not be considered a two-sided marketproblem. As Armstrong (2004) notes, “agents from one group generally do not care howwell the firm performs in the market for the other group, but only about their own termsfor dealing with the platform.” Two-sided markets also involve cross-group network effectsabsent in the simple firm context.21In a similar vein, the earlier papers by Caillaud and Jullien (2001, 2003) situate the
problem as competing “cybermediaries” (internet matchmakers) that coordinate groupsof agents that wish to transact. The “Chicken and Egg” problem to which they referalludes to getting both sides on board. In the simplest variants of the models, thereare just entrance fees to the parties who may then interact. In a more complex version,agents transact if they find a match (which they do with an exogenous probability), andthe platform can charge a price on that transaction too. This would be analogous to aroyalty on sales following an ad on TV, which is an arrangement not seen in practice in
11
Caillaud and Jullien (2003) also allow for “multi-homing”22, meaning thatsometimes agents from one side of the market may use more than one plat-form - men (or indeed women) could use two different dating services, say. Inthe television context below, Anderson and Coate (2005) have multi-homingby advertisers, meaning that advertisers can place ads on several channels,while Gabszewicz et al. (2003) have single-homing.23
3 The model ingredients
Going beyond the powerful, but rather rudimentary analyses of Steiner (1952)and Beebe (1977) means getting more explicit about the tastes and objectivesof the three principal groups of agents who interact in the market. Forconcreteness, consider the case of television. The agents are the viewers,the advertisers, and the broadcast companies who have the central role ofcoordinating the two sides of the market. We describe these in turn.
3.1 Viewers and readers
The model is built up from the basic ingredients that form its micro un-derpinnings. This means describing the tastes of diverse individuals to thengenerate their choices. We then aggregate up over individuals to find theviewership of each program type offered.24
Viewers make a discrete choice of which station to watch. At any mo-ment, a viewer can reasonably only watch one station. Although a viewermight switch channels over a given hour (and we describe below how to allowsuch behavior), our starting point is to have viewers watch a single channel.We must also modify the model in the case of newspapers for which it is
ad markets.22The term comes from usage on the Internet, meaning to have more than one Internet
Service Provider.23Gabszewicz and Wauthy (2004) contribute further to the debate.24Of course, this is not the only way to proceed. There is a long-standing tradition
in Industrial Organization (and more recently on Macroeconomics) to use representativeconsumer models to portray the aggregate taste. These have also been used in MediaEconomics: see Barros, Kind, Nilssen, and Sørgard (2005) for an application to the Internetand vertical integration. Cunningham and Alexander (2004) study an equilibrium modeland find that greater concentration (the inverse of the number of firms broadcasting) maydecrease the total amount of programming broadcast, and a decrease in consumer welfare.
12
conceivable that a reader may buy and read several alternative papers: afortiori for magazines (multi-homing by readers).25 Table 3 above showeda break-down across media of time spent by individuals. In parallel, Ta-ble 7 shows the fraction of adults that each medium reaches (i.e., it gives abreak-down by category of how many individuals are accessing the medium.)
INSERT TABLE 7. Adults using major media (percentage of adultsreached).
A simple way to model tastes is to suppose that each viewer has a con-ditional utility function for each option i, and this utility depends on thematch value, which is the intrinsic benefit of entertainment, and may differacross viewers. From this we subtract the full price paid for the option. Thefull price consists of the monetary (or subscription) price, si, from watchingchannel i = 1, ..., n, plus any nuisance from advertising. Supposing the ad-vertising level is ai, the simplest way to capture the nuisance cost is to assumeit is linear in the advertising level, at a rate γ per ad. This nuisance ratemay be constant across the population, or may differ across different view-ers. We also deduct from the full price any expected surplus the consumermay expect from trades inspired from the ads seen. Loosely, such surplusserves to reduce the effective γ, and may even render it negative. Such mightbe the case with classified ads for which the consumer actively searches outinformation and so advertising provides a positive net benefit. In the sequelwe shall assume that nuisance costs are the same for all viewers, and thatviewers expect no surplus from the goods they see advertised. We denote thefull price of option i as fi and it is thus given by
fi = si + γai (1)
The match utility is inspired from the standard stable of discrete choicemodels of product differentiation. From models of vertical (or quality) dif-25Models in which viewers are assumed to mix between channels include Gal-Or and
Dukes (2003) and Peitz and Valletti (2005). Anderson and Neven (1989) analyze thewelfare properties of such a set-up in the context of product differentiation. Indeed, whilewithout mixing the socially optimal locations are the quartiles of a linear location space,with mixing the optimal locations are the extreme ones. The positive analysis is the sameif there is a linear likelihood of buying a product after seeing an ad; when it comes to thepricing analysis, the analogy is to a model of pay-per-view rather than flat subscriptionpricing. Another interesting issue that arises is that mixing viewers may be reached ontwo different channels, thus eroding the monopoly bottleneck that channels have overdelivering viewers.
13
ferentiation (Mussa and Rosen, 1978, Gabszewicz and Thisse, 1979, Shakedand Sutton, 1982) we draw a taste for a measure of quality, θqi, with θ anindividual specific marginal willingness to pay for quality, and qi the qualityof option i. From models of spatial competition we draw the distance disu-tility τ (.) that measures how disappointed is the consumer from not gettingher ideal horizontal product specification. This depends on the “distance”between the viewer (at x) and the program offering (at xi). From modelsof probabilistic discrete choice, we draw an alternative way to conceptualizehorizontal differentiation, via match values µεi. These are typically assumedindependently and identically distributed across consumers, and so (if theother potential sources of differentiation are not present), products are sym-metric substitutes and competition is “global” in the sense that each productcompetes symmetrically with each other one. This is to be compared to the“local” competition inherent in the spatial model: each product competesdirectly with only its two neighbors.In sum, the utility of consumer with preference draws {θ, x, ε} (i.e., lo-
cated at x and buying from a firm “located” at xi with quality qi and settingprice si with ad level ai) then becomes:
ui = y − [si + γai] + θqi − τ(|x− xi|) + µεi, i = 1, ..., n, (2)
where the term in square brackets is the full price (i.e., fi: recall (1)) andy is consumer income (which we suppose is the same across all consumerssince it anyway plays no role in the choice model). In the sequel, we shalltypically only deal with one type of differentiation in (2) at a time, and theothers will be suppressed.
3.2 Advertisers
The Economics of Advertising are quite controversial when it comes to thenormative analysis. This is because successful advertising shifts demand,and therefore (presumably) consumer surplus. A comprehensive survey ofthe Economics of Advertising is provided in Bagwell (2003), and some salientpoints are discussed following the presentation of the model used here.The simplest formulation for advertiser demand is that it is perfectly
elastic. This means that there is no producer surplus to worry about. Thisassumption was used by Spence and Owen (1977). These authors assumethat ad demand is flat and also that broadcast firms run into regulatory
14
caps, so effectively there is neither an ad level decision to make, nor is thereany ad surplus to worry about. Many papers treat this (simple) case ofperfectly elastic demand, including Gabszewicz et al. (2003) and Hansenand Kyhl (2001). Other authors treat a downward sloping ad demand butdo not treat ad surplus in the welfare analysis. This makes sense if all ads areviewed as pure social waste, and just serve to reshuffle demand. Nonetheless,such analyses do impart a socially important role for advertising spending- that of financing the media. On the other hand, if ads do generate someexpected surplus to consumers, this surplus ought to be added to the utilityfunction when deciding which channel to watch.26 In order to disentangle themarket performance in the media market per se from that in the ad market,we shall analyze a benchmark case in which the private and social demandfor advertising coincide.One consistent story that generates such an ad demand is as follows.
Suppose all advertisers are independent producers of new goods. Ads com-municate the existence of these products to prospective consumers who couldnot otherwise find out about these goods and so can only buy them if theysee an ad. Such ads are not persuasive but informative, and so are readilyamenable to welfare analysis. The independence assumption implies thatthere can be no business stealing. We further suppose that each good is soldat a price that extracts all consumer surplus. This therefore closes downthe other possible channel for deviation of social and private advertising.27
Moreover, it obviates having to deal with the consumer surplus from goods
26This rather complicates matters. Anderson and Coate (2005) refer to analysis of thisissue.27The broad Industrial Organization principle that governs the optimality of various
economic magnitudes (following Spence, 1976) is that the bias depends on where thebalance tilts between two opposing forces. First, firms do not take into account incrementalconsumer surplus that they cannot capture when they decide the level of an activity. Thisis termed Consumer Surplus Non-Appropriability. Second, firms do not account for the factthat they reduce other firms’ profits. This effect is commonly termed Business Stealing.These principles are usually applied to entry decisions (Spence, 1976) but apply equallywell to advertising levels. In general then we should not expect the ad level to be optimalfor these reasons. Dukes (2004) highlights business stealing by using the framework ofGrossman and Shapiro (1984).A neutral benchmark case naturally arises when we close down both of these channels
of discrepancy of equilibrium from optimal levels. This has the advantage that we canthen concentrate directly on the distortions inherent in finance by ad support, without yetworrying about the ad benefit per se. Put another way, the backdrop is one in which theprivate demand for ads coincides perfectly with the social demand.
15
in the viewer choice model. A simple formulation that ensures there is noconsumer surplus arises when viewers, if interested, buy one unit of the goodup to a reservation price that is common to all consumers.28
The aggregate demand for ads is then determined as follows. FollowingAnderson and Coate (2005), assume that advertisers differ in the probabilitythat consumers are interested in their products, but advertisers are otherwiseidentical. More generally, it suffices to rank advertisers by a scale of highto low profit from contacting a viewer. All viewers are the same except fortheir tastes for programs, so there can be no targeting of ads correlated toprograms.29 Then the demand for advertising is simply the mass of adver-tisers who find that the expected benefit from communicating with viewersexceeds the price stipulated by the channel. We also assume that viewers“single-home” (watch one channel), and that there is a single period only. Aviewer only needs to see an ad once in order to be informed of the product.30
Taken together, the above assumptions imply that all that matters to an ad-vertiser is the price for contacting a viewer. If the advertiser’s demand priceexceeds the price quoted, the advertiser will advertise on the channel andreap a surplus equal to demand price minus advertising price per viewer, allmultiplied by the number of consumers reached. This also means that activeadvertisers will typically advertise on all channels available, in order to reachthe consumers who are delivered only through those channels. Equivalently,the advertisers engage in “multi-homing.”31
Let then the inverse advertising demand be given by p (a) per viewerwhen a channel carries a ads. The corresponding revenue per viewer is thenR (a) = p (a) a. We assume below that this revenue function is log-concave.This means that the revenue function is quite “well-behaved” (the assumptionincludes a concave revenue as a special case).At this juncture, we briefly review alternative views of advertising pro-
posed in the literature on the economics of advertising. This literature tra-
28Alternatively, we could envisage a perfectly discriminating monopoly using two-parttariffs.29Allowing targeted ads is a potentially important extension given the importance of
demographic variables in ad demand.30Shields (2004) reports that less clutter i.e., non-program material) may result in a
greater impact for advertisers. Ford sponsored the season-premiere of “24” on FOX,which was otherwise commercial-free. Ford’s brand recall score was over twice the averagefor the time period, according to IAG’s Reward TV data.
31We address single-homing advertisers in Section 6 below.
16
ditionally distinguishes persuasive from informative advertising. Persuasiveadvertising is viewed as shifting consumer tastes (see for example the some-what controversial paper by Dixit and Norman, 1978, and the commentsthereon in later issues of the Bell Journal). Dixit and Norman (1978) takean agnostic view of how advertising works, but they take as a primitivethat it shifts demand. The problem then for the practitioner of welfare eco-nomics is which demand curve to take as the true one. Dixit and Normanargue that over-advertising is the norm in both cases, whether one takes thepre-advertising demand or the post-advertising demand as the “true” one.However, explaining why demand shifted frequently leads us back to thecomplementary goods story or the informative advertising one described inmore detail below.Informative advertising works by telling consumers something about the
product that then makes them more likely to buy, or to buy at a higher price.Informative advertising can be further split into that which indirectly informsconsumers, and that which directly communicates product characteristics,quality, or price. Indirect information is communicated in signalling models(such as Milgrom and Roberts, 1986) in which advertising allows consumersto infer high quality in an adverse selection context.32
Directly informative advertising has been the topic of many studies. Amajor result in this context is due to Butters (1977), who finds that themarket provides the socially optimal amount of advertising. His model wasextended by Stegeman (1991), who suggests that the market tends to errtowards under-advertising. An important contribution by Grossman andShapiro (1984) introduces product differentiation via a circle model (as inVickrey, 1964, and Salop, 1979). This formulation was used by Dukes (2004)in the broadcasting context.Another view is associated with the Chicago School (see for example
32The view of advertising as a signal of product quality goes back to Nelson and to Kleinand Leffler. A more formal treatment was undertaken by Milgrom and Roberts (1986),and several subsequent papers have extended this line of enquiry. The basic view is thatadvertising communicates quality by the firm “putting its money where its mouth is.”A low quality producer would not conspicuously spend large sums of money in promot-ing a product that no consumer would ever buy again. Thus reassured, consumers buythe product knowing that it is of high quality and they will repeat their purchases. Thefirm recoups its advertising expenses on the profits from the repeat purchases, and theadvertising, which equivalently is public “money-burning,” serves an indirectly informa-tive role, though no direct information about the product is actually transmitted in theadvertisement.
17
Stigler and Becker, 1977, and Becker and Murphy, 1993), and holds thatadvertising can provide a complementary good to the physical product. Ad-vertising can be seen as enhancing the perceived product quality, for exampleby fostering a brand image that consumers appreciate being associated with.Stigler and Becker (1977) argue first that “persuasive” advertising can beaddressed within economic models, and, further that the level of advertisingis socially optimal.Depending on which view one takes, the conclusions below as regards the
optimality of industry performance need to be tempered. For example, ifthere is over-advertising on broadcasts in the benchmark model, and it isbelieved that advertising levels are themselves excessive (so that the privatebenefit overstates the social benefit), then a fortiori advertising is excessive.Matters become more delicate when the conclusions from the separate partsrun in opposite directions.
3.3 Platforms
The platforms are the TV stations that intermediate between the advertisersand the viewers. They are, of course, crucial to the two-sided market becausethey coordinate and balance the two sides on the platform. By bundlingentertainment with the ads, they sweeten the delivery of the message inorder to get it across.The platforms that are covered by the current analysis are broadcast-
ers (television and radio), publishers (newspapers and magazines), and webportals. Each follows the basic business model of delivering prospective cus-tomers to advertisers by attracting the viewership/listenership, readership, orweb-surfer with news or entertainment content that carries a set of messages,superfluous (and possibly annoying) to the person enjoying the content. Therelative size of the costs and benefits to agents who participate on the plat-form differs across applications. With television and radio, the advertise-ments break into the content and supplant it. In newspapers and magazines,the reader can easily bypass the ads so that the nuisance cost per se is likelynegligible. While the overall modeling framework applies to various differentmarkets, parameter values will differ across market applications.The next Table gives a time series of rates for prime-time network TV.
INSERT TABLE 8 Costs of reaching viewers by network television. US
18
These rates are somewhat lower than the spot television rates, which aregiven in the next Table.
INSERT TABLE 9 Costs of reaching viewers by spot television. US
For comparison, magazine rates and newspaper rates are given below inSection 7.In what follows we look at several variants of the model. We first consider
a short run analysis in which the number of platforms is fixed. In the long-run, the number of platforms is determined by a free entry condition. Weshall also first take the product locations as fixed, then look at them as beingendogenously determined.
4 Equilibrium
We now find the equilibrium for the model, starting with a short-run analy-sis (a fixed number of firms) and then moving to a zero-profit (free entryand exit) equilibrium. In the next sub-section, we consider the case whenadvertising is the only revenue source. We then look at subscription pricingalone, and finally at pricing and advertising together. The model below en-compasses many of those used in the literature as special cases, and we derivethe equilibrium values for these special cases for comparison purposes. Theparticular models include the duopoly at the ends of a Hotelling line withlinear transport costs (Anderson and Coate, 2004); the quadratic transportcost version (Gabszewicz, Laussel, and Sonnac, 2002); and the Vickrey-Salopcircle model with linear transport costs (Choi, 2003; Crampes, Haritchabalet,and Jullien, 2004).
4.1 Short-run Equilibrium with Advertising
Suppose that there are n platforms and letK be the fixed cost in setting up aplatform. Given the revenue per consumer, R (ai), the profit to broadcasteri is
πi = R (ai)Ni (fi, f−i)−K (3)
where we recall that fi = si + γai denotes the full price of broadcaster i;f−i denotes the vector of full prices of all broadcasters other than i, andthe viewership functions Ni (.) are determined from the particular viewer
19
model assumed (i.e., the specification of (2)). We go into more detail onthis below (and give derivations in the Appendix), but for the moment writethe own viewership derivative with respect to full price as N 0
i < 0 (i.e.,∂Ni (fi, f−i) /∂fi). Then, suppressing arguments, we have, for an interiorsolution:
R0 (ai)Ni +R (ai) γN0i = 0, (4)
or, in elasticity form:R0 (ai)R (ai)
ai +γN 0
i
Niai = 0.
As long as R is log-concave, R0/R is a decreasing function. Likewise, aslong as the viewership demand function is well behaved in the sense that Ni
is log-concave, then N 0i/Ni is a decreasing function. These conditions suffice
to ensure a unique solution for ad levels. In the case of a symmetric demandmodel, the equilibrium is symmetric. Supposing that there is a unit mass ofconsumers, the equilibrium viewership is Ni = 1/n. Denoting the commonvalue of the viewership derivative (with respect to full price) by N 0 (i.e.,∂Ni (f, f) /∂fi), the equilibrium ad level, a∗, is defined implicitly from (4) as
R0 (a∗)R (a∗)
+ γnN 0 = 0. (5)
In the Appendix we derive some common solutions for the viewer demandswitch-over rate, N 0.It is useful to point out the case of γ = 0, meaning that viewers and
readers are neutral about ads. In that case, due to product differentiation,each media firm will have its own market share, and is the exclusive channelfor reaching the corresponding prospective consumers. Each channel willthen price ads at the point where the marginal revenue from ads is zero(which is the marginal cost to the firm of airing an ad, and corresponds tothe point of unit elasticity of the ad demand function.)If γ > 0, then viewers or readers find ads to be a nuisance. Advertising
levels are then lower than if ads are not a nuisance. The reason is thatcompetition is in nuisance levels, and firms strive to reduce the nuisance(all the while recognizing that the “nuisance” is the source of their income).It therefore makes sense that more competition (higher n) results in lowerequilibrium nuisance, just as more competition typically leads to lower prices(also a nuisance!) in standard models of product differentiation. Theseconclusions are borne out in the Appendix for some standard formulations
20
of viewer choice. This interpretation in terms of competition for nuisanceis important because one might usually expect the total “output” (ad level,by analogy) to be higher when there are more firms.33 Along with a lowerlevel of ads the more firms there are, the approach concurrently predicts thatthe price per ad per viewer should be higher (with fewer firms advertising,the demand price is higher). Empirical evidence presented in Brown andAlexander (2004) gives the opposite relation, and so disagrees with the set-up above, but is consistent with the representative consumer model presentedin Cunningham and Alexander (2004). More work is needed here to evaluatethe hypotheses of the alternative approaches.If γ < 0, then viewers or readers actually appreciate ads. While this does
not seem relevant for the case of television or radio for the majority of people(since ads then necessarily displace entertainment content that presumablydrew the individual in the first place to watch or listen), with magazines ornewspapers there is no such presumption. The value of γ then representsthe expected (net) surplus per ad seen by the reader. If this is negative,there is a desire for ads (ad-lovers), and the intermediary (television or radiobroadcaster, newspaper or magazine publisher, web-master) must take thisinto account when determining how many ads to run. Now, more ads willactually attract more readers or viewers, but running more ads will alsobring the broadcaster or publisher into the region where marginal revenueis negative. It follows from this logic, and from the equations presentedpreviously, that now ad levels rise with the number of firms. This at leastmight sound more intuitive - “output” is larger with more firms and eachhas less market power to keep down the advertising level and so keep up theadvertising price. Then the competition among firms is not in nuisance butrather in the attractivity that is afforded by carrying many (desirable) ads.Dukes (2004) emphasizes strategic interaction among advertisers. He
models the product market with a circle framework using the oligopoly infor-mative advertising model of Grossman and Shapiro (1984), and so allows foran explicit business stealing effect (at the cost of assuming that one industrysupports the medium). The media are modeled with the circle framework, asabove. He shows that less product differentiation or more media differentia-tion lead to a higher market level of advertising.34 His result that there are
33Indeed, though, the ad level per firm is lower. These properties vis-a-vis the workhorseCournot model were first brought out by Masson, Mudambi, and Reynolds (1990).34Anderson and Coate (2005) get the latter result, but cannot treat the former in their
ad specification. Dukes (2001) assumes instead that advertising is not informative but is
21
more ads per station when products are closer substitutes contrasts with thestandard Grossman and Shapiro (1984) finding, and underscores the impor-tance of jointly considering the advertising and product markets. In the otherdirection, Dukes and Gal-Or (2003), Gal-Or and Dukes (2003) and Gal-Orand Dukes (2006) show that several features of the media industry may beexplained by the joint incentive of both media and advertisers to limit theextent of advertising in order to limit competitive product information fromconsumers.3536
4.2 Short-run Equilibrium with Pricing
At this point it is worthwhile deriving several results that are quite standardto the economics of product differentiation regarding the pricing of differ-entiated commodities. These results are useful both in their own right fordescribing the properties of equilibrium when there is no advertising, and asan ingredient for the analysis of the next sub-section, which treats subscrip-tion prices along with advertising.So consider now a broadcaster’s (or a newspaper’s, or a magazine’s) profit
if it uses only subscription prices. Assuming zero marginal cost for reachingviewers or readers,37 its profit is
used to differentiate a product from competing products. As usual, lower levels of mediamarket competition lead to more advertising. However, here more advertising leads tohigher surpluses in product markets since more advertising leads to more product marketdifferentiation.35These results stem from the fact that informative advertising is a competitive ex-
ternality for competing producers (see Grossman and Shapiro, 1984). Then competingproducers supply too much advertising relative to the joint profit maximization. Compet-itive conditions in the commercial media industry determine the extent of this externality.36Dukes and Gal-Or (2003) modify the Dukes (2004) model to investigate the incentives
for broadcasters to sign exclusive contracts with advertisers, whereby competing adver-tisers are excluded from advertising. While such exclusion unambiguously benefits anadvertiser, certain conditions must be satisfied before a broadcaster will offer such a con-tract. Exclusive contracts are offered when media have sufficient power in the market foradvertising vis-à-vis advertisers since they are able to capture rents from consumers whoare excluded from informative advertising. Exclusive contracts are more likely to occurwhen media markets are less differentiated or when consumers are unlikely to be informedabout products in the absence of advertising.37Positive marginal costs are addressed below, and are given a separate development
because of their importance in the analysis of pricing and ad level choice which follows.
22
πi = siNi −K,
and so the price equation (the pricing first-order condition) is
Ni + siN0i = 0,
which has a similar form to the advertising equation (4) above.38
Now, under demand symmetry, Ni = 1/n, and this pricing equation re-duces to a simple form
s =−1nN 0
where again the notation N 0 denotes that the viewer share derivative is takenat a symmetric solution (recall that this is negative, and so the subscriptionprice is positive!) The values of N 0 for the commonly used models of productdifferentiation are given in the Appendix, and hence the solutions for thesymmetric subscription price are readily derived.It is useful for the analysis of the next sub-section to now present an
intermediate result, dealing with the case when the subscription revenuereceived by the broadcaster or publisher is augmented by a fixed sum perviewer (or listener, as the case may be) of R̄. This could arise if there is astep demand for ads per viewer, but we shall see below that it belies a moregeneral principle.The broadcaster’s (publisher’s) profit then is
πi =¡R̄+ si
¢Ni −K,
and, following the same steps as above, the price equation under demandsymmetry reduces to a simple form
R̄+ s =−1nN 0 .
We can now re-introduce this into the profit function to give the equilibriumvalue of profits as
π∗ =−1n2N 0 −K.
The key property here is that this profit level is independent of R̄. This isbecause whatever extra rents may be attached to the consumer are competed38Equivalently, the elasticity of the own viewer demand is −1.
23
away at the equilibrium pricing decision. We term this result the revenue-neutrality property.39 The revenue-neutrality result arises because marketsare fully covered (all consumers watch/buy a magazine) and because eachreader/viewer buys one magazine or TV channel each. Note from the formof the profit function that R̄ enters just like a (negative) average cost perunit would. In this light, it is unsurprising that average cost levels in suchmodels do not affect equilibrium profit levels. The pricing equation simplydetermines mark-ups, which are the revenues earned per reader or viewerdelivered. We return below to the wider impact of the revenue-neutralityproperty.
4.3 Short-run Equilibrium with Pricing and Advertis-ing
We now allow the platforms to price along with their ad levels. When bothprice and advertising are positive, the value of advertising, ap, solves40
R0 (ap) = γ.
It is noteworthy that this result is independent of market structure. Theintuition behind the result is that it parlays nuisance costs into ad revenues.Indeed, suppose that γ were above R0 (a). Then a could be reduced by asmall amount, da, while s could be raised by a small amount γda so that thefull price to consumers is constant. Ad revenues would go down by R0 (a) da,but by supposition this is less than the rise in subscription revenues (γda).Given that ap is determined by ap = R0−1 (γ), we can substitute this
relation into the profit function and write it as
πi = (R (ap) + si)Ni −K,
39This result that has been noted previously by several authors, including Armstrong(2004) and Anderson and Coate (2005). Wright (2003a) gets it in the context of mobilephone telephony.40The idea behind this result can be seen by thinking of the broadcaster as maximizing
revenues per viewer for a given level of full cost per viewer. That is, recalling the full costis s+ γa, a broadcaster that maximizes the revenue per viewer, R (a) + s, subject to thisconstraint, will optimally choose to set R0 (a) = γ. If negative pricing is not permissible orfeasible, then the price is zero (there is no subscription fee even if one is feasible), and thead level is determined by the market interaction over ad levels alone, as per the analysisof the preceding sections.
24
and think of the broadcasters choosing just the subscription levels (or indeed,the full prices), since R (ap) is tied down by the above relations.41 Thisthough means that the revenue R (ap) plays just the same role as the fixedrevenue R̄ in the analysis of the previous sub-section. The implication is thenfrom the revenue-neutrality property that short-run profits are independentof the strength of advertising demand as long as s > 0 (so that R0 (ap) = γ).They are also independent of γ. Note lastly that ad levels are independentof the number of firms.We have now to determine when subscription pricing will be used in
equilibrium. As we argued above, a broadcaster will monetize the nuisance ifR0 (a) < γ. Conversely then, we can say that a broadcaster will not monetizeany nuisance if R0 (a) > γ. Most importantly, if the equilibrium withoutsubscription pricing involves a∗ = R0−1 (γ) < ap, then introducing the abilityto price will not have any effect and the equilibrium will be as in the firstsub-section above. That is, pricing will not be used, and the equilibrium willremain a free-to-air commercial television, free newspapers or web-sites, etc.,if a∗ < ap. If though a∗ > ap, the equilibrium when pricing is feasible willhave positive subscription prices and the equilibrium level of advertising ap.Pricing has important distributional effects. First, profits rise. This can beseen from comparing profit levels with and without it. With pricing, profitsare π∗p =
−1n2N 0 − K. Without pricing, they are π∗a =
R(a∗)n− K, with a∗
determined from R0(a∗)R(a∗) = −nγN 0. Hence π∗p > π∗a as
−1nN 0 > R (a∗). Since
R0 (a∗) < γ in order for pricing to be used, then profits are higher whenpricing is chosen in equilibrium.42 Advertisers lose out because the ad levelis lower, and so they lose some surplus. Viewers lose out because the fullprice (the sum of the advertising nuisance plus subscription price) rises.The strong conclusion above is that the properties of the market equi-
librium are just the same as the subscription-price-only model when pricesare positive. They therefore depend only on the product differentiation spec-ification used to describe the consumer preferences in the market.43 It is
41See Anderson and Coate (2005) for more details on equilibria with ads and pricing.42It is obvious that the ability to price raises profits for a monopoly, but it is not a priori
clear that this is so for oligopoly since competition might be expected to be more severeonce firms compete in more dimensions.43Peitz and Valletti (2005) consider a two-stage duopoly game in which location along
the unit Hotelling line is chosen first, then broadcasters compete for viewers. Otherwise theset-up is the same as in Anderson and Coate (2005), so that one contribution can be seenas endogenizing locations. Peitz and Valletti (2005) consider two symmetric games; one
25
important to reiterate that these properties stem from full market cover-age, unit demand per consumer, and also that parameter values ensure theequilibrium is in the regime with positive subscription prices along with ad-vertising.44 The influence of the latter condition may be rather subtle. Aswe shall see below, the equilibrium product selection may change drasticallyas parameters change, and the reason revolves around this condition.
4.4 Long-run equilibrium (free entry)
The long-run equilibrium we consider involves zero profits for all firms.45
The corresponding numbers of firms are determined from setting the profit
without subscription pricing, and the other one with subscription pricing. Their objectiveis to analyze the welfare properties of these two formulations. With subscription pricing,the location game involves extreme differentiation. Under free-to-air broadcasting, thereis always some provision of ads (unless platforms are located at the very same point,which does not happen at equilibrium). As expected, ads decrease with nuisance, andincrease with transportation costs (at a given location). Candidate location equilibria gomonotonically from minimal differentiation (when nuisance is zero or transportation cost isinfinity) to maximal (when nuisance is high enough or transportation cost is low enough).For given locations, welfare is only affected by ads. As expected from the Anderson-Coate (2005) analysis, pay-tv is better than free-to-air when nuisance is high (since free-to-air overprovides), or when locations are sufficiently close (under such duplication, bothsystems underprovide, but more so with free-to-air since competition escalates in providingfew ads that cannot be compensated by pricing). Finally, for endogenous content provision,Pay-tv is better with high nuisance costs: both systems provide extremely differentiatedcontent, but pay-tv offers efficient ad levels, while free-to-air overprovides. When thenuisance parameter is very small: free-to-air almost minimally differentiates content, andpay-tv maximally differentiates (but these have same welfare losses), so free-to-air is worsebecause it severely underprovides ads given locations are almost at the centre. Similareffects arise with respect to transportation costs.44It is possible that advertising is chosen to be zero, which will happen if R0 (0) ≤ γ,
meaning that the marginal revenue from the advertising sector starts out no higher thanthe nuisance cost. Then advertising is so annoying that broadcasters would price it out ofthe market. Note then that the optimal level of ads is also zero in this case.45Spectrum constraints limit the number of broadcasters in many markets. Even if
there are no such constraints (as with newspapers and magazines) the number of firmsshould be an integer, so the equilibrium number is the largest number making non-negativeprofits (implicitly assuming profits per firm decline with firm numbers), while the optimumnumber is not so constrained with a floor. The integer problem is ignored below, althoughexplicitly considered in Anderson and Coate (2005), albeit for at most two firms. We alsodo not consider here the possibility of equilibria with entry deterrence: see Eaton andWooders (1985) and Anderson and Engers (2001) for a description of such possibilities.
26
expressions in the sub-sections above equal to zero. This is straightforwardfor the most part, but the effects of allowing pricing (as compared to theadvertising-only equilibrium) does bear comment.As noted above, when pricing is actually used along with advertising,
short-run profits are independent of the strength of advertising and the nui-sance to consumers. This turn means that the long-run (zero-profit) con-figuration of firms is independent of these variables, and indeed is just thesame as when there is no advertising or only subscription prices are cho-sen. As compared to the equilibrium with advertising only, if then pricingis rendered feasible, the long-run equilibrium number of broadcasters will begreater because of the higher profits associated with the ability to price.
5 Welfare analysis
Suppose that parameters ensure that all markets are served.46 Then theoptimum advertising level, ao, has the marginal social cost, γ ≥ 0, equal tothe marginal social benefit, which is the advertising demand price. Thus itsolves
p (ao) = γ
It is therefore immediately clear that the advertising level with pricingis below what is optimal. The marginal revenue curve that determines theequilibrium level is below the demand curve that determines the optimallevel.Without pricing though, either relation is possible, as the following dis-
cussion makes clear. For low γ, virtually all the advertisers ought to becommunicating with the viewers. The equilibrium has the ad level providedby each broadcaster bounded above by the level R0−1 (0), where marginalrevenue is zero. This is effectively the “competitive bottleneck” property(see Armstrong, 2004) that each broadcaster has a monopoly in deliveringits viewers and so prices access to those viewers monopolistically.47 This is
46Unserved markets are addressed in Anderson and Coate (2005).47This monopoly position is due to the assumption in the models described that viewers
are single-homing (choosing just one channel to watch). While it is true that at any giventime a viewer may only watch one program, there still may be competition in deliveringviewers in a multi-period context when viewers switch channels. Anderson and Coate(2005) provide a preliminary analysis of two-period competition with broadcasters, whileArmstrong (2004) analyzes (simultaneous) readership of multiple magazines along the lines
27
a feature of two-sided markets when one side single-homes. At the otherextreme, if γ ≥ p (0), the optimum has no advertising because the nuisancecost exceeds the demand price (social benefit) of all ads. The equilibriumthough always has advertising, because ads are the only source of revenuefor broadcasters.We now look at the entry dimension of performance. We continue to
suppose that subscription pricing is infeasible (or indeed that it is not usedin equilibrium). It is insightful to suppose that γ = 0 and retain the assump-tions of fully covered markets and unit demands by consumers. Then there isa total disconnect between the equilibrium and the optimum. The optimumhas the number of firms as described in the previous section, which dependson the product differentiation parameters. It also has a level of advertisingdetermined by p (a) = 0: given that viewers and readers are not disturbedat all, the social optimum should have all advertisers with positive demandprice communicate with the prospective buyers of their products. On theother hand, if γ = 0, there is no conduit for competition between firms.Each will choose the level of ads such that R0 (a) = 0, and so maximizes therevenue per reader or viewer delivered. Advertisers (leastwise, those withdemand prices for ads above p (R0−1 (0))) choose to advertise on all channelsso the number of prospective buyers reached is independent of the number ofbroadcasters in the market. What this means is then that the total revenue,R (a∗), is a “prize” that is fully dissipated by the n broadcasters entering themarket. The equilibrium number of broadcasters is then R (a∗) /K. Hence,for example, doubling the number of advertisers (at each level of willingnessto pay), will double the number of firms in the market at equilibrium. Butthe optimal number will remain unchanged.In summary, the advertising level when γ = 0 is too small at the equi-
librium and advertising revenue is a pure rent split by the number of firms.Hence there are too few ads and the number of firms may bear no relationto the optimal number. A weak ad demand will mean the market cannotbe served; a strong one will be massively over-served. Anderson and Coate(2005) already note that if there is little ad demand, then the free marketcannot provide much programming. This is clear in a system that needs adrevenues to survive. On the other hand, the market may over-provide too.For example, Anderson and Coate (2005) show the market may be served bytwo firms when it is optimal to only have one. This possibility of over-entry
of Caillaud and Jullien (2003).
28
clearly extends to circle model with free entry, as is borne out by resultsin Choi (2003). It is also apparent for the explicit advertising model withbusiness stealing as used by Dukes (2004). Indeed, parallel to the findingin Anderson and Coate (2005), Dukes finds that advertising is above theoptimal level when media differentiation (measured by τ) is high enough.Consider briefly the case when ad demand is perfectly elastic with demand
price β per advertiser per viewer reached. Then ads are formally like standardprices in product differentiation models. At the optimum, though, we shouldhave no ads shown if γ > β. Conversely, if γ < β, all advertisers shouldbe allowed to advertise. The equilibrium number of ads varies continuouslywith γ though.Finally, we return to the case when pricing is feasible along with adver-
tising. Then, as shown in the short-run analysis, ad levels are independent offirm numbers. Ad levels are insufficient, because the optimum under coveredmarkets sets p (a) = γ.48 The number of firms in the market is the same asin the model when only prices can be used, and we know that the numberof firms is typically too large in models of product differentiation, and theseconclusions transfer directly. These conclusions differ quite drastically fromthose of the equilibrium without pricing (i.e., advertising only). It is worthrecalling though our earlier caveat that we have assumed that each viewerwatches one program, and that parameters ensure the equilibrium is in theregion with fully served markets.
6 Product selection: choosing program type
We now address the issue of “breadth” provided by the market, by which wemean the horizontal differentiation between products selected. To ease read-ability, we develop the model from the beginning to make this section free-standing. Given the motivating example is newspapers, we refer throughoutto papers and readers.Suppose then that there are two newspapers. Each produces at unit cost
c ≥ 0, and each sells advertising space to advertisers. The newspapers aresold at prices si, i = 1, 2, to readers. Each reader buys only one paper(“single-homing”). Readers’ political opinions range from the extreme leftto the extreme right. This taste diversity is represented by the unit inter-val [0, 1]. In standard fashion, the further the newspaper’s stance from the
48Anderson and Coate (2005) deal with uncovered markets.
29
reader’s ideal point, the higher the disutility of the reader. Following Gab-szewicz et al. (2002), we suppose that this disutility is t (x− xi)
2 + si for areader of type x buying a newspaper offering opinion xi (see (2)).Let x1 and x2 denote the locations of the papers. The demand functions
N1 and N2 for the newspapers are then easily derived asN1(s1, s2) =
x1+x22
+ s2−s12t(x2−x1)
andN2(s1, s2) =
2−x1−x22
+ s1−s22t(x2−x1) .
The corresponding editorial revenues are then πi = (si − c)Ni(s1, s2), i =1, 2.This model of the press industry is the standard Hotelling location model
with quadratic transportation costs, and for this problem we know that firmsalways locate at the two extremes of the unit interval at the unique sub-gameperfect equilibrium of the game in which firms select price and location (seed’Aspremont and al. (1979)). Thus, in the absence of advertising revenues,the media’s ideological messages reflect maximal political diversity at equi-librium.We now introduce the second source for financing daily press, revenue
accruing from advertising. Of course, if advertising rates and volumes areassumed to be fixed and independent of the number of readers, the aboveconclusion still holds and advertising revenues simply add to revenues. How-ever, the larger the readership, the more attractive should be the newspaperto advertisers, and the more they are willing to pay for exposure to a largerblock of readers. For simplicity, we suppose that the demand for advertis-ing per reader reached is perfectly elastic, and let the demand price (peradvertiser per viewer) be β.Then profits accruing to paper i from newspapers’ sales to the readership
and advertising space to the advertisers now amount to
πi = (si − c)Ni(s1, s2) + βNi(s1, s2) i = 1, 2.
Substituting from the reader demand functions above, we get
π1(s1, s2) = (s1 + β − c)
µx1 + x22
+s2 − s1
2t (x2 − x1)
¶and
π2(s1, s2) = (s2 + β − c)
µ2− x1 − x2
2+
s1 − s22t (x2 − x1)
¶.
30
These revenue expressions are just the same as those obtained by the firmsin a spatial competition model with quadratic transportation costs, when aconstant unit subsidy equal to β− c is added to the newspaper’s price. Thissubsidy is equal to the difference between the unit receipt originating fromadvertising sales and the unit production cost of each copy of the newspaper.We may now identify the sub-game perfect equilibrium of the sequentialgame in which editors select, in the first stage, their political images x1 andx2 (opinion game) and in the second stage, their newspapers’ prices s1 ands2 (price game). In the price game, payoffs are given by the equations above.However, prices are constrained to be non-negative. When the price gamehas an interior solution with positive prices49, these are given by
s∗1 = c− β + t (x2 − x1)
µ2 + x1 + x2
3
¶and
s∗2 = c− β + t (x2 − x1)
µ4− x1 − x2
3
¶.
Substituting these sub-game equilibrium values of the price game backinto the profit functions enables us to now solve for the equilibrium to thepapers’ location game. This yields the conclusion that the equilibrium out-come depends crucially on the size of t and β (see Gabszewicz et al., 2002,for full details). Indeed, when political preferences are strong (t “large”)and/or when advertising receipts are weak (β “small”), the opinion gamehas a unique equilibrium with maximal political diversity. This is much asthe game in pure subscriptions, which might be expected with weak adver-tising demand.However, with weak political preferences and/or significant advertising
receipts, the opinion game has a unique equilibrium with minimal politicaldiversity.50 Thus, when papers seek advertising revenue, there are consid-erable consequences on the equilibrium of the opinion game: the tendency
49This assumption simplifies the presentation of the results here. It is not true thoughthat the price game always has an interior solution. The values for prices given in thetext can become negative, for instance when β is large compared with c, in which case thesubscription price must be equal to zero. See Gabszewicz et al. (2002) for more details.50There is also an overlap region where both are equilibria. Gal-Or and Dukes (2003a)
offer an additional explanation for duplication. By offering similar programming (i.e.duplicating) media induce stiffer competition for viewers, thus coordinating on lower levelsof advertising and thereby raising advertisers’ surpluses in product markets.
31
to offer readers maximal political diversity is fully reversed when politicalpreferences are weak and/or advertising receipts are sufficiently important51.This conclusion reveals that the dependence of advertising rates on the read-ership’s size may well induce editors to influence the political content theydisplay to their readership so as to develop higher advertising resources.The welfare economics of the above model are quite straightforward. The
social optimum locations are at the quartiles.52 The equilibrium though in-volves either minimum differentiation, or maximum differentiation.53 Theselocations are equally bad from the social perspective. Recall that if the sub-scription prices are allowed to be negative, the only equilibrium is maximaldifferentiation. Negative prices could be reflected in giveaways like free gifts,although in that case one might expect readers could pick up several copiesof free papers along with free gifts, so rendering such negative prices infea-sible.54 In practice, even though there do exist newspapers that are givenaway free, one might expect the non-negativity constraint to be reflected ina small nominal price to obviate outright wastage.The equilibrium determined above was derived from two specific assump-
tions on nuisance costs (they are zero) and advertising revenues (they areconstant per viewer). We might though expect somewhat similar resultswith positive nuisance costs and a revenue function that exhibits decreasingaverage returns per ad per viewer. Indeed, as long as the subscription price ispositive, newspapers carry the ad level that satisfies R0 (a) = γ, and so profitsare independent of the ad revenue and competition is effectively competitionin subscription prices alone, as we have seen above. Such competition leadsto maximal differentiation. However, when locations are “too close,” the
51The price floor (non-negative price) is crucial to this result. Without it, equilibriumprices can take on negative values, dissipating advertising revenues to the benefit of readersand maximum differentiation would continue to prevail. With a price floor, the editorscan, beyond some point, choose a political position closer to their competitor’s, withoutfurther exacerbating competition.52These locations minimize the average distance travelled. Each location is at the mid-
point of the market it serves, and market sizes are equal.53The maximum differentiation result is rather an artefact of the assumption that firms
must locate in the unit interval. If locations are unrestricted, they choose to locate at¡−14 , 54
¢, which locations are outside the unit interval, although not as far apart as they
could possibly go. These locations are more extreme than the tastes of any reader, andare socially less desirable than minimum differentiation.54The “free gift” could be interpreted as the comics pages, so individuals only want one
copy.
32
subscription price is capped at zero. Then the equilibrium is in ads alone.This consideration leads us to briefly consider the case of competition in adsalone.Suppose then that R (a) = βa, so that the ad demand is the same as
above, yet nowwith γ > 0. Then the result is maximal differentiation becausethe ad competition model is formally equivalent to the pure subscription priceone.55 This means that there is a discontinuity in behavior between the casesof γ = 0 (minimum differentiation) and γ > 0 (maximal differentiation).Suppose now that R0 (a) is strictly concave. Note first that if γ = 0,
both papers carry the ad level such that R0 (a) = 0, and papers just striveto maximize the number of readers. Then they minimally differentiate. Theanalysis is quite complex if γ > 0. Preliminary results suggest that theequilibrium locations may get arbitrarily close to minimal differentiation.However, verifying that the second order conditions hold for the first stage(location) game remains elusive.An overall evaluation of the state of the art on location competition as
applied to the economics of media industries is as follows. The standardspecification of quadratic disutility costs and price-only competition leads tomaximal differentiation. This result constrains welfare analysis because itpredicts that locations are always excessively far apart, contradicting casualempiricism and flexibility of the solution. Allowing for advertising compe-tition offers the tantalizing proposition that locations could vary betweenmaximal and minimal differentiation (according to parameters), and so thesolution is not a priori constrained by excessive diversity. However, actuallyproving that the candidate equilibrium is the solution to the problem is adifficult mathematical problem.
7 Press concentration and advertising
Specialists in media economics have often viewed the advertising market asresponsible for concentration in the press industry. This is backed up withempirical work that relates advertising rates to the circulation of newspa-pers56. Earlier theoretical contributions that ascribe the growth of concen-55To see this, note that the ad competition profit function is πi = βaiNi(.) and the
profit function under price competition is πi = siNi(.). The argument of the readershipfunction in both cases is the full price, so the two problems give the same solutions.56See Dertouzos and Trautman (1990), Reimer (1992) and Kaitatzi-Whitlock (1996).
33
tration within the press industry to the interaction between advertising andnewspapers’ markets are due to Furhoff (1973), Gustafsson (1978), and En-gwall (1981). We now understand these interactions as those of a two-sidedmarket. The market for printed media is a particularly significant exam-ple of this phenomenon. Newspapers sell some space to advertisers and thelarger the demand for advertising, the higher the share of advertising rev-enues in their total profits. On the other side of the market, readers’ attitudestoward printed media advertising are quite ambiguous. Although it seemsgenerally accepted that TV-viewers dislike advertising (see, Brown and Roth-schild, 1993, and Danaher, 1995), it seems that readers of printed media havemixed views, and some have a positive perception of press advertising whileothers are negative57. If we take this at face value, then the utility of thereaders is related to the size of advertising demand, positively for some andnegatively for others. This means there are different types of network effectsat play between the printed media and the advertising markets for the read-ership too. Indeed, some think that advertising could foster the circulationof newspapers (see Blair and Romano, 1993, Gustafsson, 1978, and Rosse,1980). Others believe that it slows it down (see Musnick, 1999, and Sonnac,2000).Some statistics on advertising costs through reaching readers by magazine
ads and by newspapers are given in the next Table.
INSERT TABLE 10 Costs of reaching viewers by magazine and by news-paper, US.
We now analyze the interaction between the newsprint media and ad-vertising industries when there are readers of both stripes. Let there betwo editors producing differentiated newspapers or magazines (for instance,news-magazines proposing different political opinions) that take the extremepositions on a unit segment. Readers’ tastes are distributed uniformly on[0, 1] . Newspaper 1 is located on this spectrum at point 0, while newspaper2 is located at point 1. Editors also sell some proportion of their newspa-per’s surface to advertisers who buy it to promote the sales of their prod-ucts. At each point x of the unit interval [0, 1], a fraction λ of readersare advertising-avoiders and a proportion 1− λ are advertising-lovers. Theadvertising-avoiders lose utility when there are more ads in the paper, while
57In a recent opinion poll, 37 % of French readers claimed to be ad-averse (Le Monde,November, 9, 2002).
34
the advertising-lovers gain. More precisely, suppose editor i quotes a pricesi for the newspaper and sells a proportion ai of it to advertisers. For anadvertising-avoiding reader located at x, the total loss in utility when buyingnewspaper 1 (at 0) is
x2 + γa1 + s1, γ > 0,
while the total loss in utility when buying newspaper 2 (at 1) is (1− x)2 +γa2 + s2. Similarly, for one of the 1− λ advertising-loving readers at x, thetotal loss in utility when buying newspaper 0 is
x2 − γa1 + s1, γ > 0
and the total loss in utility when buying newspaper 2 is (1− x)2 − γa2 + s2.Note that, for simplicity, it is assumed that the ad-loving propensity on oneside is exactly equal to the ad-avoiding cost on the other side.Define k̃ = γ(2λ− 1) (so that the case of all ad avoiders corresponds to
k̃ = γ). The reader demand function for newspaper i , i = 1, 2, is then
Di(s1, s2, a1, a2) = 0 for si ≥ 1 + sj + k̃(aj − ai);
Di(s1, s2, a1, a2) = 1 for sj + k̃(aj − ai)− 1 ≥ si ≥ 0;Di(s1, s2, a1, a2) =
1
2
³1 + (sj − si) + k̃(aj − ai)
´otherwise.
The difference (ai − aj) between the advertising volumes in the papersplays a crucial role in the demands for the newspapers. At equal prices, thepaper with the more advertising benefits from a larger readership if and onlyif there is an ad-loving majority in the reader population (λ < 1
2).
Total revenues also include advertising revenues from sales of advertisingspace. We now develop a model of the advertising market to derive thedemand for advertising space as a function of the advertising rates chargedby the editors in this market. Let qi denote the unit price of an ad chargedto advertisers by paper i, i = 1, 2. Advertisers are ranked in the unit interval[0, 1] by increasing willingness to pay for an ad. Assume that each advertiserθ, θ ∈ [0, 1] , buys an ad in only one of the two newspapers, at the exclusionof the other (thus we assume single-homing for advertisers). Assume thatadvertiser θ’s benefit from inserting an ad in newspaper i at a rate qi is Diθ−qi, where Di is the readership of paper i as given above. Since θ ∈ [0, 1], theadvertising market is never covered.58 This representation of the advertising
58The case of a covered market is treated in Gabszewicz et al. (2004).
35
market sets it up as a vertically differentiated industry (Gabszewicz andThisse, 1979); here, the “high quality” product firm is the newspaper withthe larger readership.Consequently, if ai advertisers buy their ads in newspaper i, paper i’s
total profit πi is
πi(s1, s2, q1, q2) = siDi(s1, s2, a1, a2) + qiai., i = 1, 2. (6)
We consider a two-stage game played between the papers. At the firststage, they select newsstand prices s1(aa1, a
a2) and s2(a
a1, a
a2) conditional on
the expected volumes aa1 and aa2 of advertising which will be determined inthe second stage. Payoffs in the first stage depend on the expectations ofboth editors and readers about the difference aai −aaj between the advertisingvolumes sold by the editors in the second period. These payoffs are given by(6) with ai − aj = aai − aaj .The second stage strategies are the advertising prices q1 and q2. Entering
in this stage, prices s1 and s2 have been already selected determining reader-ships, Di(s1, s2) = Di. Based on the above model of the advertising market,payoffs in the second stage game are derived as a function of advertisingrates q1 and q2. Denoting by s∗i (a
a1, a
a2), i = 1, 2, the equilibrium values in the
first-stage game, conditional on expectations aa1 and aa2 , and by (q∗1, q
∗2) the
equilibrium of the second-stage game, we further require ai(q∗1, q∗2) = aai : the
value of the demand function of each editor in the advertising market at thesecond-stage equilibrium is consistent with first-stage expectations on thesevalues.59
The equilibria of the game are as follows (and broadly substantiate par-allel results by Caillaud and Jullien, 2003). First, whatever the value ofλ ∈ [0, 1] , there always exists an equilibrium corresponding to symmetric ex-pectations (aa1 = aa2), with prices and market shares equal in both markets.This is an equilibrium with symmetric expectations about the advertisingmarket shares. This equilibrium leads to Bertrand competition in the ad-vertising market and, consequently, to equal prices and market shares in thenewspaper market. In the case of ad-repulsion (λ > 1
2), no other equilibrium
exists than the symmetric one.Second, consider the case of a majority of ad-lovers (λ < 1
2). Then,
if ad-attraction is strong (−6 ≥ k̃ = γ(2λ − 1)), there are two asymmet-ric equilibria. At each, one editor eliminates the rival completely, and the
59For a detailed equilibrium analysis, see Ferrando et al. (2004).
36
eliminating editor is the one who is expected to sell more advertising. If ad-attraction is weaker (k̃ > −12), there are also two asymmetric equilibria withboth editors enjoying strictly positive market shares in both the readershipmarket and in the advertising markets. The paper which is expected to sellmore advertising has higher prices and larger market shares in both markets.This latter result is akin to the base intuition of Furhoff (1973) revealingwhy ad-attraction can drive concentration growth in the daily newspaperindustry. This intuition was described by Gustafsson (1978, p.1) in the fol-lowing terms: “The larger of two competing newspapers is favoured by aprocess of mutual reinforcement between circulation and advertising, as alarger circulation attracts advertisements, which in turn attracts more ad-vertising and again more readers. In contrast, the smaller of two competingnewspapers is caught in a vicious circle, its circulation has less appeal forthe advertisers, and it loses readers if the newspaper does not contain at-tractive advertising. A decreasing circulation again aggravates the problemsof selling advertising space; so that finally the smaller newspaper will haveto close down.” The equilibria under strong advertising attraction can beviewed as the limit of the market dynamics underlying this description. Thepaper which is expected to sell a larger number of ads makes itself moreattractive than the rival one. The more ads the former inserts, the more thisreinforces the attractiveness. This strengthening finally leads to the evictionof the latter from both the press and advertising markets. There also existother equilibria corresponding to situations of weaker ad-attraction. At theseequilibria, the paper with the larger expected share in the advertising mar-ket does not completely evict its rival. Nevertheless, the initial asymmetryabout expected advertising market shares makes the paper with the largerexpected share the leader in both industries since it sells more in both, andat higher prices.The interaction between the reader and advertising markets is rather
complex when the two-sided network effects between these two industries areexplicitly taken into account. It leads however to an important conclusion:under ad-attraction, concentration in the press industry should be expected asa direct and natural consequence of the advertising market. Since newspapersconstitute a major vehicle for spreading political and social information tocitizens, it is important to recognize the shortcomings in the business modelthat might lead to high concentration.
37
8 Conclusions
Television indubitably drives much of popular culture today and radio, mag-azines, and the Internet are other important drivers. Households in the UScurrently watch some 8 hours of television a day. A common business modeldescribes several media markets, including television and radio, the Internet,and newspapers and magazines. Entertainment and content are the bait toget prospective purchasers of consumer goods to be exposed to advertise-ments. This Chapter has described the economics of this business model.What makes broadcasting different from other goods is that the broadcastdelivers two goods, the program to viewers and the audience to the advertis-ers. This is why it is a two-sided market. Put another way, the advertisingis piggy-backed onto the program that interests the viewers.We have examined several dimensions of performance of the market.
These include the range, quality, and breadth of the offerings (magazines,television programs, web-sites) provided. Since these are classic dimensionsstudied in the economics of product differentiation, we borrowed heavily fromthe economic theory of product differentiation. The dimension of interestmay also be a political measure, such as the difference between the polit-ical stances represented in newspapers. There are other dimensions apartfrom the measures of the diversification of offerings that are important tothe economics of media industries. All of these dimensions are importantdeterminants of the cultural level. However, the economic models must beinterpreted with care. For example, a higher “quality” in the model is onethat more people choose, ceteris paribus. This may not correspond to somepaternalistic view of what people “should” be watching, reading, or listeningto.Media industries exhibit several market imperfections. Broadcasting is
a public good that is nonetheless provided by the market system, and thereason it is provided is advertising finance. But the ads are a nuisance toviewers (negative externality). Broadcast firms often historically formed atight oligopoly. Given this knot of imperfections, one might have a poor ex-pectation of performance in the industry. Indeed, one usually expects publicgoods to be under-provided, market power to also cause underproduction,and negative externalities to cause overproduction. Surprisingly then, me-dia markets are able to deliver optimal performance configurations. Carefulempirical work is needed to determine the values of key parameters in thestructural model and hence to determine how far current practice deviates
38
from optimal, and in what direction. For valuable progress in this direction,see Wilbur (2004b).There is another type of market failure inherent to the market provision
of broadcasting through advertising finance. Television offerings are disci-plined by indirect consumer sovereignty: viewers “vote” with their eyes, andbroadcast companies want to deliver viewers — of the right demographics — toadvertisers. However, there is no incentive under advertising-based financeto cater to the tastes of viewers who would not buy the products advertised.This means there will be bias even without paternalistic views of what people“ought” to be watching. This bias explains the targeting of TV programsto those demographics that deliver most expected revenues to advertisers.Loosely, one would expect these to be the twenty- and thirty-somethingswith high disposable incomes. Those with as-yet unformed tastes and largediscretionary spending are the most lucrative targets for advertisers. Insofaras characters in television programs often reflect their audience (people liketo watch characters similar to themselves), then one can indeed see manyprograms with characters in the 20-50 year old range. The reason is quitestraightforward: the advertising dollars are in this range. This causes quitean important cultural bias. Goettler (1999) finds that shows attracting morehomogenous viewerships (in terms of age and gender) elicit higher adver-tising prices. This makes sense because then ads may be better targeted.The concurrent bias that this effect suggests is that there is a tendency forprogramming to be too narrow. Second, he finds that shows watched by35-49 year olds command higher advertising rate premia, suggesting a biasin catering to this group. Third, he finds that the advertising price increasesin the size of the audience in a convex manner. The associated bias is to-ward programming with mass appeal, and the Lowest Common Denominatorconcern of Beebe (1977) arises from this incentive.Of course, whenever an audience is watching or paying attention to any
event, there is the incentive to try to reach them with a message. This is allthe more true in the age of TiVo and other ad avoidance technologies, andever greater demand from advertisers to get their messages across. Com-mercial placement is being seen increasingly in movies and programs (e.g.,BMW’s in James Bond films in place of the traditional Aston Martin), andit will alter the scripts of the movies themselves, as writers have to write inthe sponsoring products. One might view such placement as a Trojan Horsecarrying in undesired elements. A similar phenomenon has been happen-ing in US schools. Channel One provides programming free to schools and
39
even pays for the hardware (televisions, satellite dishes, etc.). The Trojanhorse is the advertising that comes with the programming. The schools mustguarantee 90% of students watch, and they are not allowed to turn off thesupposedly educational programming. The programming is designed ratherlike MTV programming, and, although purportedly covering current affairs,is really designed as a vehicle for advertisements.60 Advertisers in turn payhigh premia for slots: up to twice the amount spent to reach adults.61
Children’s viewing habits are also the concern underlying the FCC’s re-quirement (since 2001) that each new television be equipped with a V-chip(see http://www.fcc.gov/vchip/). The chip enables parents to block pro-gramming deemed unsuitable, as rated by the “TV Parental Guidelines,”that were established by the National Association of Broadcasters, the Na-tional Cable Television Association and the Motion Picture Association ofAmerica. However, use of this blocking device does not seem to have caughton (in contrast with Internet blocking filters). As Hazlett (2004) puts it:“Perhaps parents adopted Internet filters and spurned the V-chip becausewatching television is generally a more public activity: It’s easier to keep anear on what your kids are watching in the living room than to keep an eyeon every Web site they see.”Several recent papers have empirically investigated models of two-sided
markets in various different contexts. The pioneering paper in the print areais Rosse (1970), who estimated cost curves in the newspaper industry in thecontext of a model that included newspapers’ feedback effects between adver-tising and readership. Rysman (2004) considers welfare properties of variousmarket structures in the yellow-pages market, and finds that oligopoly is pre-ferred to monopoly. Since consumers use yellow pages to find information,his conceptual framework could be applied to a newspaper industry withad-loving readers. Kaiser and Wright (2004) take Armstrong’s (2004) modelof two-sided market competition to data on the German magazine industry,assuming single-homing on the part of both advertisers and readers.There have also been several recent empirical studies of the broadcasting
industry. Berry and Waldfogel (1999, 2001) use data on radio listenershipto look at the effects of entry and concentration in radio. Sweeting (2004)tackles the difficult problem of estimating an equilibrium model of the timing
60“Channel One is more commercial than network TV; its hipper, faster-moving, full ofloud rock music and directly or indirectly, its always selling something.” (Fox, 2004).61“Each 30 second ad costs advertisers nearly $160, 000, more than twice the cost of a
commercial on prime time television news.” (Gange, 2004, in a review of Fox, 2004).
40
of radio stations’ commercial breaks. Wilbur (2004a) uses advertising levelsand ad prices and viewing data to estimate a two-sided model of the televisionadvertising market. He finds ads cause viewing losses: preliminary estimatesindicate that 30 seconds of ads on top of the current level will decreasewatching by 1.1% of viewers (or 0.7% of households) per hour.One direction for future research is to take a deeper look at actual mar-
ket structures. Most systems are mixed, and include a variety of differentfirm types. Anderson (2003) provides a preliminary analysis in this direc-tion by looking at the coexistence of advertising financed and subscriptionfinanced television, while Peitz and Valletti (2005) also compare these twotypes of regime. If we look at actual market structures there are varioustypes operating in the market, with varying degrees of public support, reg-ulation, advertising finance, etc. In the US, public television, supported bythe Federal Government and by private donations, coexists with commercialchannels, pay channels and religious channels. In the UK, the B.B.C. is sup-ported by television license fees and Government grants, and is not allowedto carry ads. There are six major channels in the television market in France.These vary by the level of Government support and the number of ads theyare allowed to screen, as well as by content of programming, and one is a paychannel during prime time and into the night. One thorny problem for futureresearch concerns the appropriate modeling of the behavior and objectives ofa Public Broadcaster.On the empirical side, it is worth investigating more deeply the extent to
which programming is indeed duplicated along the lines suggested by Steiner(1952), and the work on the Pensée Unique, or whether indeed programsare more differentiated. Very useful work in this direction is the study byGoettler and Shachar (2001). These authors suggest that broadcast firmsinstead differentiate their offerings quite substantially.Another issue of cultural concern is the “quality” of programming defined
from the perspective of the local community. The FCC in the US stressesconcerns about “localism” in the decision to grant a license. Similarly, localcontent rules (as in France and Australia, among others) are designed to re-tain and foster national programming. These are related issues because theystress a concept of quality that reflects and bolsters community apprecia-tion of its integrity. If an objective such as protecting community identity isvalued, then it would presumably need special protection (or subsidy) whenfaced with a Lowest Common Denominator type programming of mass ap-peal (“Hollywood” to the protagonists). The appropriate policy stance in
41
this regard remains an open research issue.
Acknowledgement. The first author gratefully acknowledges research fund-ing from the NSF under grant SES-0137001. We thank many conference par-ticipants for their comments, insights, and presentations. We also thank ourco-authors for several of the insights on which we draw, Victor Ginsburghfor editorial help, Juan Carlos Bisso for research assistance, and AnthonyDukes, Serguey Khovansky, Alan Krueger, Nathalie Sonnac, Cat Tyler, andKen Wilbur for comments and suggestions.
Appendix
Several special cases treated in the literature may be derived from a circlemodel with power transport costs. We therefore determine the equilibriumfor that model. Assume the circle has circumference L, and the transportcost function is τ (.). We seek a symmetric equilibrium. Let the indifferentviewer between broadcaster i (at location 0) and its clockwise neighbor (atL/n) be at x̂, so i’s viewership is simply 2x̂, and our task is to determine thevalue of N 0.If the other broadcasters all set a common ad level a, while broadcaster
i sets ai, demand satisfies equality of “full nuisance” or
γai + τ (x̂) = γa+ τ
µL
n− x̂
¶.
Evaluating at a symmetric solution,
dx̂
dai=
−γ2τ 0¡L2n
¢ .For power transport costs, τ (x) = txα, α ≥ 1, this becomes
dx̂
dai=−2α−2γnα−1
αtLα−1
so that ad levels solve (by (5) and recalling that in a symmetric equilibrium,Ni = L/n, and N 0
i =2γdx̂dai)
R0 (a∗)R (a∗)
=2α−1γnα
αtLα
42
Since the L.H.S. is falling in a, the important result here is that theequilibrium ad level is decreasing in the number of competing platforms.This makes sense here because competition is effectively contested over thenuisance value to consumers, and more competition means less nuisance, andso less advertising on each channel.62
There are some important special cases to this. First, suppose that addemand is perfectly elastic. Then R = βa, where β is then the demand pricefor ads. Then R0
R= 1
aand we can solve for a∗ directly as
a∗ =αtLα
2α−1γnα. (7)
Ad levels rise with product differentiation (t) and fall with the number offirms. They fall as viewers get more annoyed by them too.The special case of α = 1 gives the standard Vickrey-Salop (1964, 1979)
62We assume in the main text that the strategic variable is price per ad per viewer.This is equivalent to ad levels being the strategic variables (this equivalence propertyfollows from the feasibility of multi-homing for advertisers and the assumption that thewillingness to pay for an ad is a linear function of the number viewers delivered by achannel). This strategic assumption corresponds to broadcasters that choose the size oftheir advertising breaks and then sell the space to prospective advertisers. An alternativestrategic assumption is that broadcasters take as given the ad prices of rivals. This couldbe considered a Bertrand assumption where the standard one is a Cournot assumption.The implications of the alternative (Bertrand) assumption may be thought of as follows.When a broadcaster changes its price per ad, and a rival’s price is assumed fixed, the rivalmust adjust its ad levels to keep its price per ad constant. More concretely, suppose abroadcaster raises its price per ad. Fewer advertisers want buy ads there, and so moreviewers watch (which dampens the initial effect somewhat). This means that the rivalneeds to cut back its ad level because otherwise the rival is delivering fewer consumers perad. It must make up for that by improving the “quality” of its ads - by delivering moreviewers. This then means that the ad levels move together when broadcasters use ad priceas strategies. This means more collusive behavior. Since more collusion implies MOREads, price strategies lead to more ads, and closer to monopoly levels. It is noteworthy thatBertrand competition in standard differentiated products markets typically leads in steadto more competitive outcomes than Cournot competition. Crampes, Haritchabalet, andJullien (2003) also uncover such an effect. Nilssen and Sørgard (2003) compare price andquantity strategies, using a representative consumer approach to advertising demand.
43
result of63
a =tL
γn.
Noting that the standard duopoly line model is like L = 2 (the firms are oneunit distance apart), then (setting n = L = 2 and α = 1 in (7)) we have forthat case64
a =t
γ.
In a similar fashion, for the standard version of the line model with twoplatforms and quadratic transport costs, set n = L = α = 2 in (7) to giveexactly the same result as for linear transport costs:
a =t
γ.
Rather similar qualitative results hold for the logit model of demand
63Gal-Or and Dukes (2003b) investigate the incentives for non-consolidating media merg-ers for firms on the circle, using the framework of Dukes (2004) described further below.On the one hand, a merging media firm improves its market power vis-à-vis advertiserssince they now have a larger set of viewers. However, reduced competition for viewersinduces higher equilibrium levels of advertising, which, in their model, lowers productmarket surpluses. They show that media mergers are profitable when the media mar-ket is sufficiently competitive so that, post-merger, the market power benefit exceeds thelosses associated with increased advertising levels. Their results contrast with traditionalproduct markets, where mergers are more profitable with less competition (Deneckere andDavidson, 1985). Choi (2003) considers mergers of neighboring firms in the context of themodel of this section. He shows the more familiar result (see also Eaton and Wooders,1985) that such mergers raise the profits of all firms, and these profits are lower for firmsfurther from those that merge.64The monopoly case is rather interesting. Anderson and Coate (2005) show that the
monopoly ad level for the Hotelling specification may be higher or lower than the duopolyone as the market is or is not served respectively under monopoly. This result appearsquite specific to the Hotelling model with unserved markets though, as we argue below.
44
considered by Anderson (2000).65 Here we have simply that
N 0 =1
µ
1
n
µ1
n− 1¶,
and so the equilibrium ad level is given by
R0
R=
γ
µ
µn− 1n
¶.
With perfectly elastic ad demand, as above, this reduces to the closed form:
a =µ
γ
µn
n− 1¶
which increases with product differentiation as measured by µ and also de-creases with the number of firms.66
The logit form may also readily be extended to allow for viewers who donot watch. Then, with the logit above, and an outside option,67 we get animplicit form for the equilibrium ad level of:
R0
R=
γ
µ
⎛⎝1− exp³−γaµ
´n exp
³−γaµ
´+ exp
³Voµ
´⎞⎠
where Vo denotes the relative quality of the outside option.
65The logit model is given by assuming the εi terms in (2) are i.i.d. double exponential.Suppressing the transport cost and quality components, the viewership demand functionis
Ni =exp (−γai/µ)X
j=1,...,n
exp (−γaj/µ).
66These properties hold for a general class of discrete choice models with i.i.d. idiosyn-cratic tastes with a log-concave distribution.67The viewership demand function is then
Ni =exp (−γai/µ)X
j=1,...,n
exp (−γaj/µ) + exp (Vo/µ),
where V0 measures the attractivity of the outside option.
45
Rewriting,
R0
R=
γ
µ
⎛⎝1− 1
n+ exp³Vo+γa
µ
´⎞⎠
Since the RHS is increasing in a, there is a unique solution; since theRHS is increasing in n, higher n always means lower ad levels for all n,including the transition from monopoly to duopoly. The intuition followsnaturally since competition over viewers involves nuisance levels (where onewould normally have direct prices) higher competition implies lower prices.
References
[1] American Association of Advertising Agencies and the Association ofNational Advertisers, Inc [2001] 2001 Television Commercial Monitor-ing Report.
[2] Anderson, Simon P. [2000] “Advertising and the Media.” Mimeo, Uni-versity of Virginia.
[3] Anderson, Simon P. [2003] “Broadcast competition: Commercial andPay TV.” Mimeo, University of Virginia.
[4] Anderson, Simon P. and Stephen Coate [2000] “Market Provision ofPublic Goods: The Case of Broadcasting.” NBERWorking paper 7513.
[5] Anderson, Simon P. and Stephen Coate [2005] “Market Provision ofBroadcasting: AWelfare Analysis.”Review of Economic Studies, forth-coming.
[6] Anderson, Simon P., André de Palma, and Jacques-François Thisse[1992], Discrete Choice Theory of Product Differentiation. MIT Press,Cambridge, Mass.
[7] Anderson, Simon P. and Maxim P. Engers [2001] “Pre-emptive Entryin Differentiated Product Markets.” Economic Theory, 17, 419-445.
[8] Anderson, Simon P. and Damien J. Neven [1989] “Market Equilibriumwith Combinable Products.” European Economic Review, 33, 707-719.
46

[9] Armstrong, Mark [2004] “Competition in Two-Sided Markets.” Mimeo,University College, London.
[10] Bagwell, Kyle [2003] “The Economic Analysis of Advertising.” Mimeo,Columbia University.
[11] Barros, Pedro P., Hans Jarle Kind, Tore Nilssen, and Lars Sørgard[2005] “Media Competition on the Internet.” Topics in EconomicAnalysis and Policy, 4(1), article 32 (18 pp.)
[12] Baxter, William [1983] “Bank Interchange of Transactional Paper: Le-gal Perspectives.” Journal of Law and Economics, 26, 541-588.
[13] Becker, Gary and Kevin Murphy [1993] “A Simple Theory of Advertis-ing as a Good or Bad.” Quarterly Journal of Economics, 107, 942-964.
[14] Beebe, Jack [1977] “Institutional Structure and Program Choices inTelevision Markets.” Quarterly Journal of Economics, 91, 15-37.
[15] Berry, Steven and Joel Waldfogel [1999a] “Public Radio in the U.S.:Does it Correct Market Failure or Cannibalize Commercial Stations,”Journal of Public Economics, 71(2), 189-211.
[16] Berry, Steven and Joel Waldfogel [1999b] “Free Entry and Social In-efficiency in Radio Broadcasting.” RAND Journal of Economics, 30,397-420.
[17] Berry, Steven and Joel Waldfogel [2001] “Do Mergers Increase ProductVariety? Evidence from Radio Broadcasting.” Quarterly Journal ofEconomics, 116(3), 969-1007.
[18] Berry, Steven and Joel Waldfogel [2003] “Product Quality and MarketSize.” NBER Working Paper 9675.
[19] Blair Roger D. and Richard E. Romano [1993] “Pricing Decisions of theNewspaper Monopolist.” Southern Economic Journal, 59(4), 723-732.
[20] Boulding, Kenneth [1955], Economic Analysis. Volume I: Microeco-nomics, 3d Ed. New York: Harper & Row.
47
[21] Brown, Allan and Martin Cave [1992] “The Economics of TelevisionRegulation: A Survey with Application to Australia.” The EconomicRecord, 68, 377-94.
[22] Brown, Keith and Peter J. Alexander [2005] “Market Structure, ViewerWelfare, and Advertising rates in Local Broadcast Television Markets.”Economics Letters, 86(3), 331-337
[23] Brown, Tom J. and Michael L. Rothschild [1993] “Reassessing the Im-pact of Television Advertising Clutter.” Journal of Consumer Research,20, 138-146.
[24] Busse, Meghan and Marc Rysman [2004], “Competition and PriceDiscrimination in Yellow Pages Advertising,” RAND Journal of Eco-nomics, forthcoming.
[25] Butters, Gerard [1977] “Equilibrium Distributions of Sales and Adver-tising Prices,” Review of Economic Studies, 44, 465-491.
[26] Cabizza, Mariella M. [2004] “Minority programming in television mar-kets.” Mimeo, University of York (UK).
[27] Caillaud, Bernard and Bruno Jullien [2001] “Competing cybermedi-aries.” European Economic Review, 45, 797-808.
[28] Caillaud, Bernard and Bruno Jullien [2003] “Chicken & Egg: Com-petition Among Intermediation Service Providers.” RAND Journal ofEconomics, 34(2), 309-328.
[29] Cancian, Maria, Bills, Angela and Theodore Bergstrom [1995]“Hotelling Location Problems with Directional Constraints: An Ap-plication to Television News Scheduling.” Journal of Industrial Eco-nomics, 43, 121-124.
[30] Caplin, Andrew, and Barry Nalebuff [1991] “Aggregation and ImperfectCompetition: On the Existence of Equilibrium,” Econometrica, 59, 25-59.
[31] Chakravorti, Sujit [2003], “Theory of Credit Card Networks: A Surveyof the Literature.” Review of Network Economics, 2(2), 50-68.
48
[32] Choi, Jay Pil [2003] “Broadcast competition and advertising with FreeEntry.” Mimeo, Michigan State University.
[33] Coase, Ronald, [1966], “The Economics of Broadcasting and Govern-ment Policy.” American Economic Review, 56, 440-447.
[34] Corneo, Giacomo, [2001] “Work and Television.” IZA Discussion Paper376.
[35] Cornes, Richard and Todd Sandler [1996] The Theory of Externalities,Public Goods and Club Goods (Second Edition). Cambridge UniversityPress: Cambridge.
[36] Crampes, Claude, Carole Haritchabalet, and Bruno Jullien [2004]“Competing with advertising resources.” Mimeo, IDEI, Université deToulouse.
[37] Crawford, Gregory S. [2000], “The Impact of the 1992 Cable Act onHousehold Demand andWelfare,” RAND Journal of Economics, 31(3):422-449.
[38] Cunningham, Brendan M. and Peter J. Alexander [2004] “A Modelof Broadcast Media and Commercial Advertising.” Journal of PublicEconomic Theory, Blackwell Publishing, 6(4), 557-575
[39] d’Aspremont Claude, Jean J. Gabszewicz and Jacques-François. Thisse[1979] “On Hotelling’s “Stability in Competition.” Econometrica, 47(5), 1145-1150.
[40] Danaher P. J. [1995] “What Happens to Television Ratings DuringCommercial Breaks,” Journal of Advertising Research, (37), 37-47.
[41] Davies, Gavyn et al. [1999] The Future Funding of the B.B.C.: Reportof the Independent Review Panel. Department of Culture, Media andSport.
[42] Deneckere, Raymond and Carl Davidson [1985] “Incentives to FormCoalitions with Bertrand Competition.” RAND Journal of Economics,16(4), 473-486.
49
[43] Dertouzos J. N. and W. B. Trautman [1990] “Economic Effects of Me-dia Concentration: Estimates from a Model of the Newspaper Firm.”Journal of Industrial Economics, 39 (1), 1-14.
[44] Dixit, Avinash and Victor Norman [1978] “Advertising and Welfare,”Bell Journal of Economics, 9, 1-17.
[45] Doyle, Chris [1998] “Programming in a Competitive Broadcasting Mar-ket: Entry, Welfare and Regulation.” Information Economics and Pol-icy, 10, 23-39.
[46] Dukes, Anthony J. [2005] “Media Concentration and Consumer Prod-uct Prices.” Mimeo, Aarhus University.
[47] Dukes, Anthony J. [2004] “The Advertising Market in a ProductOligopoly.” Journal of Industrial Economics, 52, 3, pp. 327-348, Sep-tember 2004
[48] Dukes, Anthony J. and Esther Gal-Or [2003] “Negotiations and Exclu-sivity Contracts for Advertising.” Marketing Science, 22 (2), 222-245.
[49] Eaton, B. Curtis, and Richard G. Lipsey [1975] “The Principle of Min-imum Differentiation Reconsidered: Some New Developments in theTheory of Spatial Competition.” Review of Economic Studies 42, 27-49.
[50] Eaton, B. Curtis, and Myrna Wooders [1985] “Sophisticated Entry in aModel of Spatial Competition,“RAND Journal of Economics, RAND,vol. 16(2), 282-297.
[51] Economides, Nicholas [1996] “The Economics of Networks.” Interna-tional Journal of Industrial Organization, 14, 673-699.
[52] Ekelund, Robert, Ford, George and John Jackson [1999] “Is RadioAdvertising a Distinct Local Market? An Empirical Analysis.” Reviewof Industrial Organization, 14, 239-256.
[53] Engwall L. [1981] “Newspaper Competition: A Case for Theories ofOligopoly.” Scandinavian Economic History Review , 29 (2), 145-154.
[54] Evans, David [2003] “The Antitrust Economics of Multi-Sided PlatformMarkets.” Yale Journal on Regulation, 20(2), 325-382.
50
[55] Ferrando Jorge, Gabszewicz, Jean J., Didier Laussel, and NathalieSonnac [2004] “Two-Sided Network Effects and Competition: an Ap-plication to Media Industries.”Lucarnes bleues 2004/09, CREST/LEI.
[56] Fox, Roy F. [2004] Harvesting Minds: How TV Commercials ControlKids. Praeger.
[57] Furhoff L. [1973] “Some Reflections on Newspaper Concentration.”Scandinavian Economic History Review, 1, 1-27.
[58] Gabszewicz, Jean J., Didier Laussel, and Nathalie Sonnac [1999] “TVBroadcasting Competition and Advertising.” Lucarnes bleues # 9972CREST/LEI, CORE Discussion Paper # 2000(6).
[59] Gabszewicz, Jean J., Didier Laussel, and Nathalie Sonnac [2001] “PressAdvertising and the Ascent of the Pensée Unique?” European EconomicReview, 45, 645-651.
[60] Gabszewicz, Jean J., Didier Laussel, and Nathalie Sonnac [2002] “PressAdvertising and the Political Differentiation of Newspapers.” Journalof Public Economic Theory, 4 (3), 249-259.
[61] Gabszewicz, Jean J., Didier Laussel, and Nathalie Sonnac [2004] “Pro-gramming and Advertising Competition in the Broadcasting Industry.”Journal of Economics and Management Strategy, 13(4), 657-669.
[62] Gabszewicz, Jean J., Didier Laussel, and Nathalie Sonnac [2005] “Com-petition in the Media and Advertising Markets.” Manchester School,forthcoming.
[63] Gabszewicz, Jean J. and Jacques-François Thisse [1979] “Price Compe-tition, Quality and Incomes Disparities.” Journal of Economic Theory,20 (3), 340-359.
[64] Gabszewicz, Jean J. and Xavier Wauthy [2004] “Two-Sided Marketsand Price Competition with Multi-homing.” CORE Discussion Paper2004(30), Louvain-la-Neuve, Belgium
[65] Gal-Or, Esther and Anthony J. Dukes [2003a] “Minimum Differentia-tion in Commercial Media Markets.” Journal of Economics and Man-agement Strategy, 12 (3), 291-325.
51
[66] Gal-Or, Esther and Anthony J. Dukes [2006] “On the Profitability ofMedia Mergers.” Journal of Business, 79(2).
[67] Gange, Mike [2004] “Making a Killing on Our Kids” Review of Har-vesting Minds: How TV Commercials Control Kids by Roy F. Fox.http://medialit.med.sc.edu/fox.htm
[68] George, Lisa, and Joel Waldfogel [2003] “Who Benefits Whom in DailyNewspaper Markets? ” Journal of Political Economy, 111(4), 765-785.
[69] George, Lisa, and Joel Waldfogel [2004] “Does the New York TimesSpread Ignorance and Apathy? ” Mimeo, Michigan State University.
[70] Goettler, Ronald and Ron Shachar [1999] “Advertising Rates, AudienceComposition, and Competition in the Network Television Industry.”Mimeo, Carnegie-Mellon University.
[71] Goettler, Ronald and Ron Shachar [2001] “Spatial Competition in theNetwork Television Industry,” RAND Journal of Economics, 32, 624-656.
[72] Grossman, Gene and Carl Shapiro [1984] “Informative Advertising withDifferentiated Products.” Review of Economic Studies, 51, 63-81.
[73] Gustafsson, K. E. [1978] “The Circulation Spiral and the Principle ofHousehold Coverage.” Scandinavian Economic History Review, 26(1),1-14.
[74] Hackner Jonas and Sten Nyberg [2001] “Advertising and Media MarketConcentration.” Mimeo, Department of Economics, Stockholm Univer-sity.
[75] Hamilton, James T. [2004] All the news that’s fit to sell. PrincetonUniversity Press.
[76] Hansen, Claus and Soren Kyhl [2001] “Pay-per-view Broadcasting ofOutstanding Events: Consequences of a Ban.” International Journalof Industrial Organization, 19, 589-609.
[77] Hazlett, Thomas [2004] “Requiem for the V-Chip: a relic of the lastbattle over indecency on TV.” http://slate.msn.com/id/2095396/ Fri-day, Feb. 13, 2004.
52
[78] Holden, Steinar [1993] “Network or Pay-per-view?” Economics Letters,43, 59-64.
[79] Hotelling, Harold [1929], “Stability in Competition,” Economic Journal39,41-57.
[80] Kaiser, Ulrich and Julian Wright [2004], “Price Structure in Two-SidedMarkets: Evidence from the Magazine Industry,” mimeo, University ofSouthern Denmark.
[81] Kaitatzi-Whitlock S. [1996] “Pluralism and Media Concentration inEurope.” European Journal of Communication, 11(4), 453-483.
[82] Kind, Hans J., Tore Nilssen, and Lars Sørgard [2004] “Advertising onTV: Over- or Underprovision?” Mimeo. Bergen.
[83] Klein, Benjamin and Keith B. Leffler, [1981], “The Role of Mar-ket Forces in Assuring Contractual Performance,” Journal of PoliticalEconomy 89, 615-41.
[84] Masson, Robert, Mudambi, Ram and Robert Reynolds [1990]“Oligopoly in Advertiser-Supported Media.” Quarterly Review of Eco-nomics and Business, 30 (2), 3-16.
[85] Milgrom, Paul and John Roberts [1986] “Prices and Advertising Signalsof Product Quality.” Journal of Political Economy, 94, 796-821.
[86] Minasian, Jora [1964] “Television Pricing and the Theory of PublicGoods.” Journal of Law and Economics, 7, 71-80.
[87] Motta, Massimo and Michele Polo [1997] “Concentration and PublicPolicies in the Broadcasting Industry: The Future of Television.” Eco-nomic Policy, 25, 294-334.
[88] Musnick I. [1999] “Le Cœur de Cible ne Porte pas la Publicité Dansson Coeur,” CB News, 585, 11-17 October, 8-10.
[89] Mussa, Michael and Sherwin Rosen, [1978], “Monopoly and ProductQuality.” Journal of Economic Theory 18, 301-317.
[90] Nelson, Phillip, [1974], “Advertising as Information,” Journal of Polit-ical Economy 82, 729-754.
53
[91] Nilssen, Tore and Lars Sørgard [1998] “Time schedule and programmeprofile: TV news in Norway and Denmark.” Journal of Economics andManagement Strategy, 7(2), 209—235.
[92] Nilssen, Tore and Lars Sørgard [2003] “The TV Industry: Advertisingand Programming” Mimeo, Bergen.
[93] Noam, Eli M. [1987] “A public and private-choice model of broadcast-ing.” Public Choice, 55, 163—187.
[94] Owen, Bruce M. and Wildman, S. S. [1992] Video Economics. HarvardUniversity Press, Cambridge, Massachusetts.
[95] Papandrea, F. [1997] “Modelling television programming choices.” In-formation Economics and Policy, 9, 203—218.
[96] Peitz, Martin, and Tommaso Valletti [2005] “Content and advertis-ing in the media: pay-tv versus free-to-air.” Mimeo, Imperial College,London, CEPR working paper #4771
[97] Picard Robert G. (Ed.) [1988] “Press Concentration and Monopoly:News Perspectives on Newspaper Ownership and Operation.” AlexPublishing Corporation, Norwood, New Jersey.
[98] Reimer E. [1992] “The Effects of Monopolization on Newspaper Ad-vertising Rates.” American Economist, 36(1), 65-649.
[99] Rochet, Jean-Charles and Jean Tirole [2002] “Cooperation amongCompetitors: Some Economics of Payment Card Associations.” RANDJournal of Economics, 33(4), 549-570.
[100] Rochet, Jean-Charles and Jean Tirole [2003a] “Platform Competitionin Two-Sided Markets,” Journal of the European Economics Associa-tion, (forthcoming).
[101] Rochet, Jean-Charles and Jean Tirole [2003b], “An Economic Analysisof the Determination of Interchange Fees in Payment Card Systems,”Review of Network Economics, 2(2), 69-79.
[102] Rochet, Jean-Charles and Jean Tirole [2004]. “Two-sided markets: anoverview.” Mimeo, IDEI, Université de Toulouse.
54
[103] Rogerson, Richard [2005] “Structural transformation and the deteri-oration of European labor market outcomes.” Mimeo, Arizona StateUniversity.
[104] Rosse, James N. [1970], “Daily Newspapers, Monopolistic Competition,and Economies of Scale,” American Economic Review, 57(2), 522-533.
[105] Rosse James N. [1980] “The Decline of Direct Newspaper Competi-tion.” Journal of Competition, 30, 65-71.
[106] Rothenberg, J. [1962] “Consumer sovereignty and the economics oftelevision programming.” Studies in Public Communication, 4, 45—54.
[107] Rysman, Marc [2004] “Competition between Networks: A Study of theMarket for Yellow Pages.”Review of Economic Studies, 71(2), 483-512,.
[108] Salop, Steven [1979] “Monopolistic Competition with Outside Goods.”Bell Journal of Economics, 10, 141-156.
[109] Samuelson, Paul [1958] “Aspects of Public Expenditure Theories.” Re-view of Economics and Statistics, 40, 332-338.
[110] Samuelson, Paul [1964] “Public Goods and Subscription TV: Correc-tion of the Record.” Journal of Law and Economics, 7, 81-83.
[111] Schwartz, Marius and Daniel Vincent [2001] “Same Price, Cash orCredit: Vertical Control in Electronic Payments Networks.” Mimeo,Georgetown University.
[112] Shachar, Ron and Bharat Anand [1998] “The Effectiveness and Target-ing of Television Advertising,” Journal of Economics & ManagementStrategy, 7, 363-396.
[113] Shaked, Avner and John Sutton, [1982], “Relaxing Price Competitionthrough Product Differentiation,” Review of Economic Studies 49, 3-14.
[114] Shapiro, Carl [1980] “Advertising and Welfare: Comment.” Bell Jour-nal of Economics, 11, 749-752.
[115] Shields, Michael [2004] “Ad Clutter Reaches New High, Encroaches OnProgram Content.” MediaPost Daily News. Tuesday, April 13, 2004.
55
[116] Sonnac, Nathalie [2000] “Readers Attitudes Towards Press Advertising:are They Ad-lovers or Ad-averse?” Journal of Media Economics, 13(4),249-259.
[117] Sonnac, Nathalie [2002] “Monopole televisuel et publiphobie.”Recherches Economiques de Louvain, 68(4), 513-526.
[118] Spence, A. Michael [1976] “Product Selection, Fixed Costs and Mo-nopolistic Competition.” Review of Economic Studies, 43, 217-235.
[119] Spence, Michael and Bruce Owen [1977] “Television Programming, Mo-nopolistic Competition and Welfare” Quarterly Journal of Economics,91, 103-126.
[120] Stegeman, Mark [2004] “A Model of Internet Advertising.” Mimeo,Virginia Polytechnic Institute.
[121] Steiner, Peter O. [1952] “Program Patterns and Preferences, andWork-ability of Competition in Radio Broadcasting.” Quarterly Journal ofEconomics, 66, 194—223.
[122] Stigler, G. J., and G. S. Becker, [1977], “De Gustibus Non Est Dis-putandum,” American Economic Review 67, 76-90.
[123] Sweeting, Andrew [2004], “Coordination Games, Multiple Equilibriaand the Timing of Radio Commercials,” mimeo, Massachusetts Insti-tute of Technology.
[124] 1999 Television Commercial Monitoring Report, American Associationof Advertising Agencies.
[125] Tirole, Jean [1988] The theory of Industrial Organization, M.I.T. Press,Cambridge, Mass.
[126] Vaglio, Alessandro [1995] “A Model of the Audience for TV Broadcast-ing: Implications for Advertising Competition and Regulation.”RivistaInternazionale di Scienze Economiche e Commerciali, 42(1), 33-56.
[127] Vickrey, W. S., [1964], Microstatics. Harcourt, Brace and World, NewYork. Selection republished as Vickrey, W. S., Simon P. Anderson andRalph M. Braid, “Spatial Competition, Monopolistic Competition, and
56
Optimum Product Diversity,” International Journal of Industrial Or-ganization 17, 953-963.
[128] Wilbur, Kenneth C. (2004a) “Modeling the Effects of Advertisement-Avoidance Technology on Advertisement-Supported Media: the Caseof Digital Video Recorders,” mimeo, University of Virginia.
[129] Wilbur, Kenneth C. (2004b) “Not all eyeballs are created equal.”Mimeo, University of Virginia.
[130] Wildman, Steven S., McCulloch, Robert, and B.D. Kieshnick [2004] “Anew look at the Economics for Television Ad Time.” mimeo, MichiganState University.
[131] Wildman, Steven S. and Bruce Owen [1985] “Program Competition,Diversity, and Multichannel Bundling in the New Video Industry,” inEli Noam, (Ed.), Video Media Competition: Regulation, Economicsand Technology, Columbia University Press: New York.
[132] Wiles, P. [1963] “Pilkington and the theory of value.” Economic Jour-nal, 73, 183—200.
[133] Wright, Donald [1994] “Television Advertising Regulation and ProgramQuality.” Economic Record, 70, 361-367.
[134] Wright, Julian [2002] “Access Pricing under Competition: An Applica-tion to Cellular Networks,” Journal of Industrial Economics, 50, 289-315.
[135] Wright, Julian [2003] “One-Sided Logic in Two-Sided Markets.” Brook-ings Working Paper 03-10.
57

Table 1. Time spent viewing per household, US Year Time Spent Per Day
1950 4 hrs. 35 mins. 1955 4 hrs. 51 mins. 1960 5 hrs. 06 mins. 1965 5 hrs. 29 mins. 1970 5 hrs. 56 mins. 1975 6 hrs. 07 mins. 1980 6 hrs. 36 mins. 1985 7 hrs. 10 mins. 1990 6 hrs. 53 mins. 1995 7 hrs. 17 mins. 1996 7 hrs. 11 mins. 1997 7 hrs. 12 mins. 1998 7 hrs. 15 mins. 1999 7 hrs. 26 mins. 2000 7 hrs. 35 mins. 2001 7 hrs. 40 mins. 2002 7 hrs. 44 mins. 2003 7 hrs. 58 mins.
Source: www.tvb.org, based on data from Nielsen. Table 2. Average annual hours spent for TV and work, 1994-1997 Country TV-Viewing
hours per adult
Work hours per person in employment
Work hours per adult
Norway 878 1413 850Switzerland 882 1608 1036Sweden 893 1600 981Finland 929 1725 1043Germany 1148 1563 903France 1166 1616 878Japan 1324 1885 1116Spain 1334 1813 903Italy 1340 1637 761UK 1387 1738 1065USA 1462 1954 1264Source: Corneo (2001)
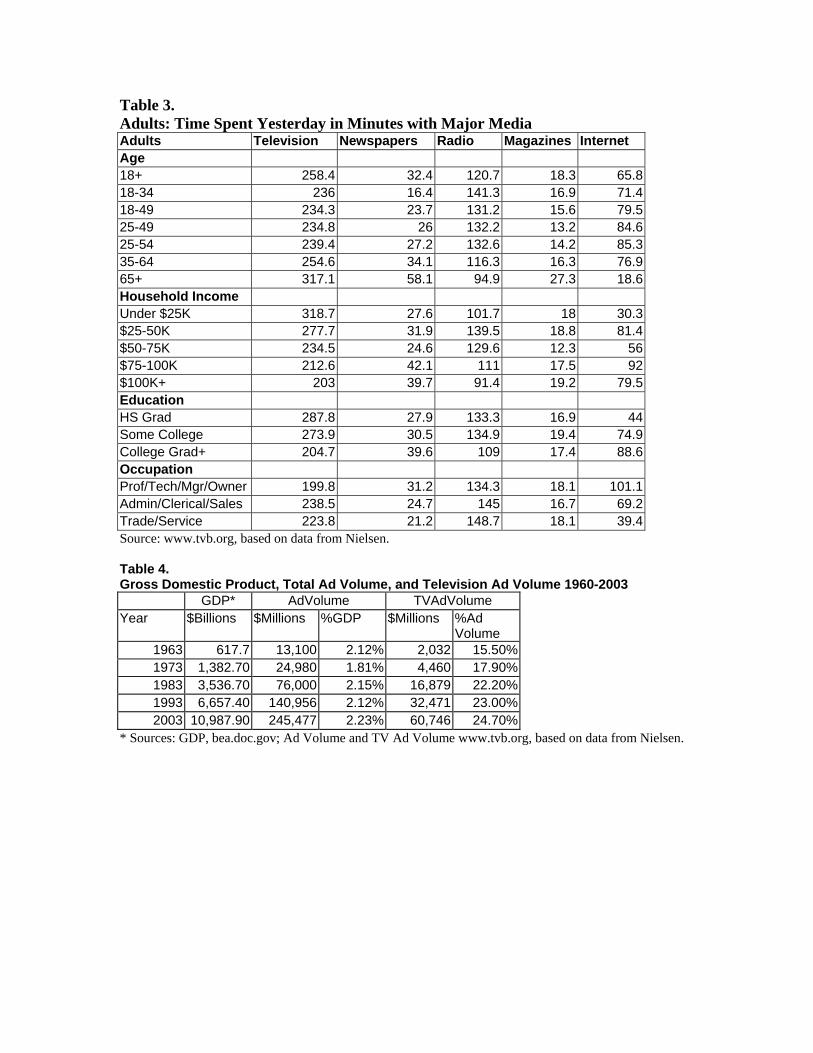
Table 3. Adults: Time Spent Yesterday in Minutes with Major Media Adults Television Newspapers Radio Magazines Internet Age 18+ 258.4 32.4 120.7 18.3 65.8 18-34 236 16.4 141.3 16.9 71.4 18-49 234.3 23.7 131.2 15.6 79.5 25-49 234.8 26 132.2 13.2 84.6 25-54 239.4 27.2 132.6 14.2 85.3 35-64 254.6 34.1 116.3 16.3 76.9 65+ 317.1 58.1 94.9 27.3 18.6 Household Income Under $25K 318.7 27.6 101.7 18 30.3 $25-50K 277.7 31.9 139.5 18.8 81.4 $50-75K 234.5 24.6 129.6 12.3 56 $75-100K 212.6 42.1 111 17.5 92 $100K+ 203 39.7 91.4 19.2 79.5 Education HS Grad 287.8 27.9 133.3 16.9 44 Some College 273.9 30.5 134.9 19.4 74.9 College Grad+ 204.7 39.6 109 17.4 88.6 Occupation Prof/Tech/Mgr/Owner 199.8 31.2 134.3 18.1 101.1 Admin/Clerical/Sales 238.5 24.7 145 16.7 69.2 Trade/Service 223.8 21.2 148.7 18.1 39.4 Source: www.tvb.org, based on data from Nielsen. Table 4. Gross Domestic Product, Total Ad Volume, and Television Ad Volume 1960-2003
GDP* AdVolume TVAdVolume Year $Billions $Millions %GDP $Millions %Ad
Volume 1963 617.7 13,100 2.12% 2,032 15.50%1973 1,382.70 24,980 1.81% 4,460 17.90%1983 3,536.70 76,000 2.15% 16,879 22.20%1993 6,657.40 140,956 2.12% 32,471 23.00%2003 10,987.90 245,477 2.23% 60,746 24.70%
* Sources: GDP, bea.doc.gov; Ad Volume and TV Ad Volume www.tvb.org, based on data from Nielsen.
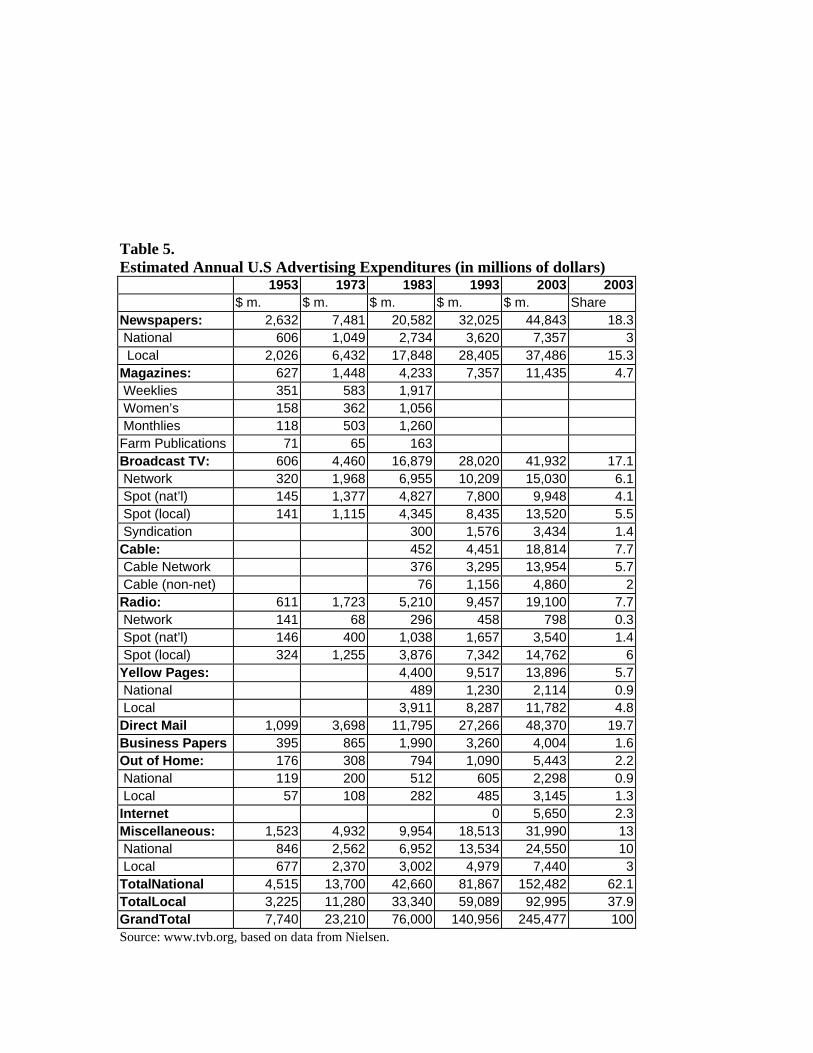
Table 5. Estimated Annual U.S Advertising Expenditures (in millions of dollars)
1953 1973 1983 1993 2003 2003 $ m. $ m. $ m. $ m. $ m. Share
Newspapers: 2,632 7,481 20,582 32,025 44,843 18.3 National 606 1,049 2,734 3,620 7,357 3 Local 2,026 6,432 17,848 28,405 37,486 15.3 Magazines: 627 1,448 4,233 7,357 11,435 4.7 Weeklies 351 583 1,917 Women’s 158 362 1,056 Monthlies 118 503 1,260 Farm Publications 71 65 163 Broadcast TV: 606 4,460 16,879 28,020 41,932 17.1 Network 320 1,968 6,955 10,209 15,030 6.1 Spot (nat’l) 145 1,377 4,827 7,800 9,948 4.1 Spot (local) 141 1,115 4,345 8,435 13,520 5.5 Syndication 300 1,576 3,434 1.4 Cable: 452 4,451 18,814 7.7 Cable Network 376 3,295 13,954 5.7 Cable (non-net) 76 1,156 4,860 2 Radio: 611 1,723 5,210 9,457 19,100 7.7 Network 141 68 296 458 798 0.3 Spot (nat’l) 146 400 1,038 1,657 3,540 1.4 Spot (local) 324 1,255 3,876 7,342 14,762 6 Yellow Pages: 4,400 9,517 13,896 5.7 National 489 1,230 2,114 0.9 Local 3,911 8,287 11,782 4.8 Direct Mail 1,099 3,698 11,795 27,266 48,370 19.7 Business Papers 395 865 1,990 3,260 4,004 1.6 Out of Home: 176 308 794 1,090 5,443 2.2 National 119 200 512 605 2,298 0.9 Local 57 108 282 485 3,145 1.3 Internet 0 5,650 2.3 Miscellaneous: 1,523 4,932 9,954 18,513 31,990 13 National 846 2,562 6,952 13,534 24,550 10 Local 677 2,370 3,002 4,979 7,440 3 TotalNational 4,515 13,700 42,660 81,867 152,482 62.1 TotalLocal 3,225 11,280 33,340 59,089 92,995 37.9 GrandTotal 7,740 23,210 76,000 140,956 245,477 100 Source: www.tvb.org, based on data from Nielsen.
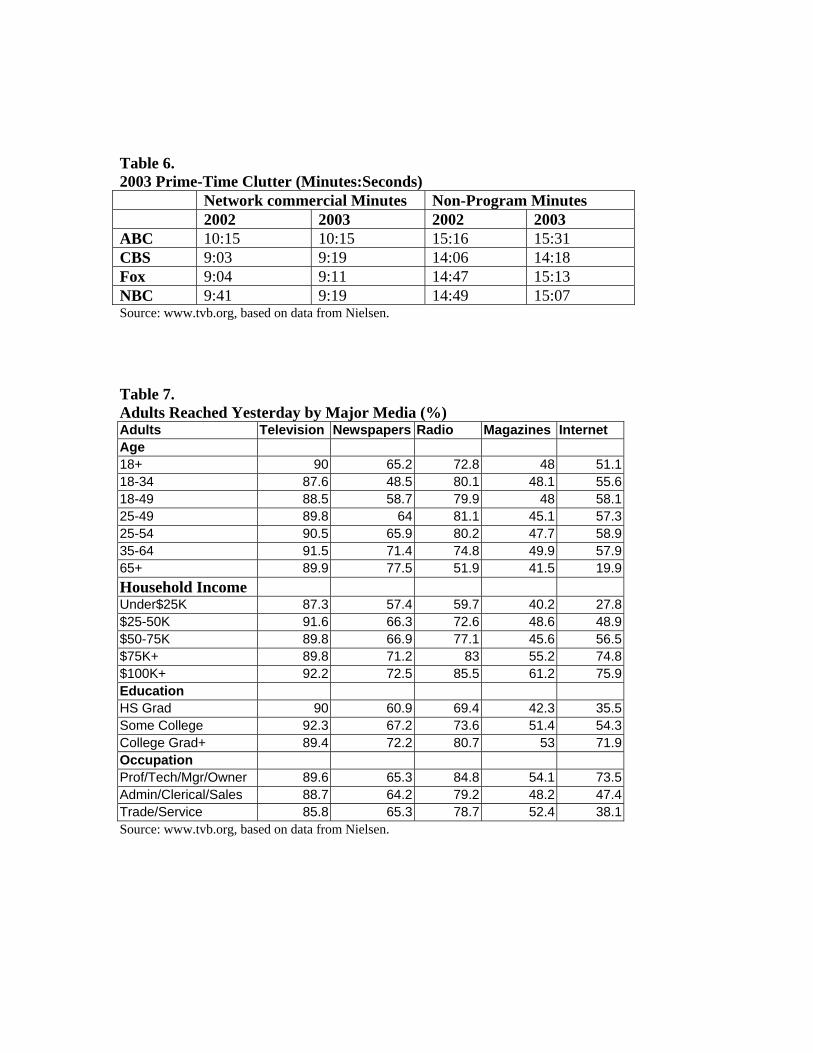
Table 6. 2003 Prime-Time Clutter (Minutes:Seconds) Network commercial Minutes Non-Program Minutes 2002 2003 2002 2003 ABC 10:15 10:15 15:16 15:31 CBS 9:03 9:19 14:06 14:18 Fox 9:04 9:11 14:47 15:13 NBC 9:41 9:19 14:49 15:07 Source: www.tvb.org, based on data from Nielsen. Table 7. Adults Reached Yesterday by Major Media (%) Adults Television Newspapers Radio Magazines Internet Age 18+ 90 65.2 72.8 48 51.1 18-34 87.6 48.5 80.1 48.1 55.6 18-49 88.5 58.7 79.9 48 58.1 25-49 89.8 64 81.1 45.1 57.3 25-54 90.5 65.9 80.2 47.7 58.9 35-64 91.5 71.4 74.8 49.9 57.9 65+ 89.9 77.5 51.9 41.5 19.9 Household Income Under$25K 87.3 57.4 59.7 40.2 27.8 $25-50K 91.6 66.3 72.6 48.6 48.9 $50-75K 89.8 66.9 77.1 45.6 56.5 $75K+ 89.8 71.2 83 55.2 74.8 $100K+ 92.2 72.5 85.5 61.2 75.9 Education HS Grad 90 60.9 69.4 42.3 35.5 Some College 92.3 67.2 73.6 51.4 54.3 College Grad+ 89.4 72.2 80.7 53 71.9 Occupation Prof/Tech/Mgr/Owner 89.6 65.3 84.8 54.1 73.5 Admin/Clerical/Sales 88.7 64.2 79.2 48.2 47.4 Trade/Service 85.8 65.3 78.7 52.4 38.1 Source: www.tvb.org, based on data from Nielsen.
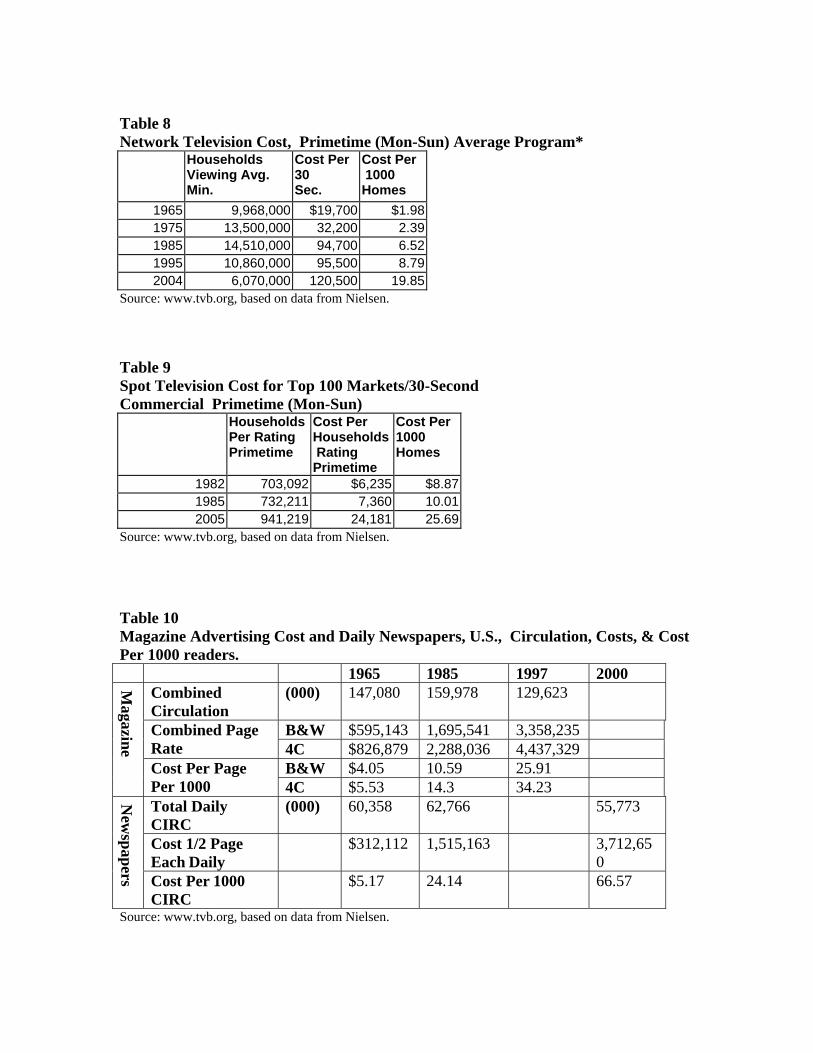
Table 8 Network Television Cost, Primetime (Mon-Sun) Average Program*
Households Viewing Avg. Min.
Cost Per 30 Sec.
Cost Per 1000 Homes
1965 9,968,000 $19,700 $1.98 1975 13,500,000 32,200 2.391985 14,510,000 94,700 6.521995 10,860,000 95,500 8.792004 6,070,000 120,500 19.85
Source: www.tvb.org, based on data from Nielsen. Table 9 Spot Television Cost for Top 100 Markets/30-Second Commercial Primetime (Mon-Sun)
Households Per Rating Primetime
Cost Per Households Rating Primetime
Cost Per 1000 Homes
1982 703,092 $6,235 $8.87 1985 732,211 7,360 10.012005 941,219 24,181 25.69
Source: www.tvb.org, based on data from Nielsen. Table 10 Magazine Advertising Cost and Daily Newspapers, U.S., Circulation, Costs, & Cost Per 1000 readers. 1965 1985 1997 2000
CC
ombined irculation
(000) 147,080 159,978 129,623
B&W $595,143 1,695,541 3,358,235 CR
ombined Page ate 4C $826,879 2,288,036 4,437,329
B&W $4.05 10.59 25.91
Magazine
Cost Per Page Per 1000 4C $5.53 14.3 34.23 TC
otal Daily IRC
(000) 60,358
62,766 55,773
CE
ost 1/2 Page ach Daily
$312,112 1,515,163 3,712,650
New
spapers Cost Per 1000 CIRC
$5.17 24.14 66.57
Source: www.tvb.org, based on data from Nielsen.