Embed Size (px)
Citation preview

American Mineralogist, Volume 76, pages 74-82, 1991
The metamictization of zircon: Radiation dose-dependent structural characteristics
Jlivrns A. Wooonna.oDepartment of Geology, Occidental College, Los Angeles, California 90041, U.S.A'
Gnoncn R. RossvHN, LnoN T. Srr.vnnDivision of Geological and Planetary Sciences, California Institute of Technology, Pasadena, California 91125, U-S.A.
Ansrucr
A suite of gem zircon samples from Sri Lanka has been studied using infrared (IR)
spectroscopy, X-ray diffiaction, and chemical analysis. The degree of metamictization ofthe zircon, as indicated by unit-cell parameters, increases systematically with U-Th contentup to the point of total metamictization. The appearance of IR spectra also varies as afunction of metamictization: band widths increase and intensities decrease with increasingU-Th contents. Persistence of bands related to Si-O bonds and disappearance of bandsrelated to Zr-O bonds indicates that the structure of metamict zircon consists of distortedand disoriented isolated silica tetrahedra with few ifany undisplaced Zr cations. All spec-troscopic indicators of crystalline order show that total metamictization is reached at anaccumulated radiation dosage of -4.5 x l0r5 alpha decay events per mg. Hydrous com-ponents enter the structure only after total metamictization, but the amounts are not
correlated with U-Th content. In all cases OH was the only hydrous species detected.
fNrnooucrroN
Metamictization of natural zircon results from accu-mulated radiation damage to the crystal structure causedby radioactive decay of trace amounts of U and Th sub-stituting for Zr. The damage is generally considered to bethe result of recoiling nuclei produced in the a-emissionprocess (Holland and Gottfried, 1955; Headley et al.,1982), although others have attributed it to spontaneousfission of 238IJ (Yada et al., 1981, 1987). Metamictizationis characterized by marked changes in physical proper-ties, including significant decreases in density, refractiveindex, and birefringence (Holland and Gottfried, 1955).Changes in the susceptibility of the contained U-Th-ra-diogenic Pb isotope system to chemical disturbance, im-portant in geochronology, parallel the increases in radi-ation damage (Silver and Deutsch, 1963; Silver, 1964;Pidgeon et al., 1973).
Details of the transitional and final structures of zirconundergoing metamictization are important to the under-standing of the process. The structure of crystalline zirconconsists of isolated [SiO4]4- tetrahedra with strong inter-nal Si-O bonds. The tetrahedra are joined by weaker M-Obonds involvingZra' cations (and any species substitut-ing for Zr) in eightfold coordination (Robinson et al., 197l;Dawson et al., l97l). The structure of metamict zirconhas been the subject of debate. Hypothesized structuresfor metamict zircon include slightly misoriented zirconcrystallites (Bursill and Mclaren, 1966) and mixtures ofcrystalline SiO, and ZrO, (Pellas, 1965; Wasilewski et al.,1973). These proposals seem unlikely in view ofrecentX-ray spectroscopic studies (Nakai et al., 1987; Sugiyamaand Waseda, 1989; Farges and Calas, 1991). Other pro-
0003-004x/91/0102-0074$02.00 74
posals more consistent with these recent studies includemixed crystalline and amorphous domains (Sommerauer,1976) and ZrSiOo glass (Holland and Gottfried, 1955;Vance, 19751'Yada et al., l98l; Headley et al., 1982).The difference among models for the structure of meta-mict zircon was the initial impetus for the present studybecause appreciable fractions of any crystalline phases inmetamict samples should be evident in their IR spectra.
IR spectra may also reveal the effects of metamictiza-tion at the Si-O andZr-O bond level because the variousIR-absorption bands depend on different segments of thezircon structure. To a first approximation the IR spec-trum of zircon is made up of internal modes involvingbending and stretching of Si-O bonds in discrete tetra-hedral [SiOo]o- anions and external modes involvingtranslation and rotation ofnearly rigid tetrahedra in re-lation to lhe Zr cations. Because these bands are wellseparated, it is possible to follow them independently asmetamictization progresses.
Of particular importance to isotope geochronology isthe stability of U, Th, and their daughter products inmetamict zircon. Zircon is known to be subject to an-nealing with concomitant disturbance of the isotopic sys-tem. HrO is thought to have a strong effect on metamict-ization and annealing of zircon but there is little agreementon the nature ofthat effect. Frondel and Collette (1957)found that HrO lowers the temperature and increases therate of recrystallization of metamict zircon in annealingexperiments. Pavlovic and Krstanovic (1965) found thatHrO hinders the metamictization process. Pidgeon et al.(1966, 1973) found that in hydrothermal experiments,distilled HrO had little effect on the rate of recrystalliza-

WOODHEAD ET AL.: METAMICTIZATION OF ZIRCON 75
tion of metamict zircon whereas dilute NaCl solutionshad a dramatic effect. More recently Caruba et al. (1985)have synthesized hydroxylated zircon, and after compar-ing their synthetic products to natural samples, concludethat OH is essential to the metamictization process. Ainesand Rossman (1985, 1986) hypothesize that OH actuallystabilizes the metamict state of radiation-damaged zir-con.
Not only is the role of HrO in the metamictizationprocess and its effect on the stability of metamict zirconopen to question, but the identity ofthe hydrous species,whether HrO or OH, is not well established. Thorite(ThSiO4) is isostructural with zircon, but there is onlylimited solid solution with it. In thorite that has experi-enced relatively low a-decay event doses and is only par-tially metamict, Lumpkin and Chakoumakos (1988) haveestablished that OH is present in the structure. At higherdoses, suftcient to surpass the saturation dosage for totalmetamictization, they report that several weight percentHrO coexists with the OH. Similar studies relating thehydrous species in zircon to the accumulated a-decayevent dose have not been performed. These problemswere the second impetus for our study and ultimatelybecame its major focus.
ANlr,ylrc,lr. TECHNTeUES
The weighted mean radioactivity of each zircon wasdetermined on crushed fractions in a scintillation counter(Silver and Deutsch, 1963). The a-activity resulting fromdecay of both U and Th is expressed in ppm eU, theequivalent U content (in secular equilibrium) necessaryto produce the measured activity. The scintillation count-er was repeatedly calibrated with homogeneous standardzircon from the Pacoima Canyon Pegmatite (Neuerburg,1954; Silver et al., 1963) that had been analyzed by iso-tope dilution mass spectrometry for U and Th in severallaboratories. The calibration was checked by independentisotope dilution analysis of several hundred zircon frac-tions measured with the counter. Three of the zirconspecimens with low to intermediate radioactivity and onemetamict zircon used in these experiments were analyzedindependently by isotope dilution methods to establishboth U and Th concentrations and to test the uniformityofthe ages ofthe zircon population.
A Perkin-Elmer model 180 double-beam grating infra-red spectrometer and a Nicolet 60SX FTIR were used toobtain IR spectra of the zircons. Transmission spectra inthe range 2100-250 wavenumbers (cm-') were obtainedon I mg fractions of the scintillation counter samples(finely ground, dispersed in pressed and dried 200-mgKBr pellets). Polarized and unpolarized transmissionspectra in the range 4000-1300 cm-r were obtained onpolished, single-crystal zircon plates cut parallel to thec-axis. Plates 500-1000 pm thick were best for study ofthe weak absorption bands above 2000 cm-', includingthe O-H stretching region at around 3500 cm-'. Plates100-400 pm thick were required for the stronger absorp-tion bands below 2000 cm-'. Polarized reflection spectra
in the range 4000-250 cm-r were also obtained on a fewpolished plates.
A MAC-5 electron microprobe was used for chemicalanalyses of the polished, single-crystal zircon plates. Con-centrations of 29 elements were determined, includingmajor elements, U, Th, Pb, Y, and most of the REEs.The majority of standards used for the analyses weremineral samples or synthetic oxides-F and P, fluorapa-tite; Na, albite; Mg, periclase; Al and Ca, anorthite; Si,qvartzi K, microcline; Ti, rutile; Mn, garnet; Fe, fayalite;Zr and Hf, zircon; Nb, synthetic NbO; Ta, syntheticKTaO,; Pb, synthetic PbCOr; Th, synthetic ThO,; and U,synthetic UOr. Standards for Y and the REEs were Ca-Al-silicate glasses, doped with approximately 4o/o of lherare earths, synthesized by Drake and Weill (1972).X-raypeaks for the minor and trace elements were chosen toavoid interference by those of the major elements as wellas mutual overlaps. Backgrounds on each side ofthe mea-sured peaks were chosen away from peaks of the otherelements. Ka lines of F, Na, Mg, and Al were measuredusing a KAP crystal. Ka lines of Si, P, Ca, and Ti; Lalines of Y, Zr, and Nb; Mo lines of Hf and Th; and theM0 line of Pb were measured using a PET crystal. Kalines of Fe and Mn; Za lines of La, Ce, Nd, Sm, Gd, Tb,Er, Yb, Lu, and Ta; L0 lines of Dy and Ho; and, tllre MBline of U were measured using an LiF crystal. Beam sizesof up to 25 pm were used in order to avoid damaging themore metamict samples. Probe data were reduced usingBence-Albee corrections.
X-ray powder diffraction patterns were obtained onzircon samples with an internal standard of spectroscop-ically pure rutile using a Norelco powder diffractometer.Patterns were obtained from l8 to 38 20 using Ni-filteredCuKa radiation at 40 kV and 20 mA. The positions ofdiffraction maxima were measured near the tops of thepeaks rather than at their halflheiehts in order to avoidthe problems caused by skewed peaks in radiation-dam-aged samples.
S.q,tvrpr,e cHARAcrERrzATroN
The suite of zircon samples from Sri Lanka used in thisstudy was chosen for four reasons: the samples have awide range ofU contents (Table l); those analyzed haveexperienced less than 20VoPb loss, as shown by isotopicstudies (Tilton et al., 19571' Pidgeon et al., 1966;' Krtineret al., 1987); they have not been annealed, as shown byX-ray powder diffraction studies (Silver and Woodhead,in prepar4tion); and most are large enough for a varietyofoptical and infrared spectroscopic studies. All ofthesesamples were obtained originally from the U.S. NationalMuseum, and many were used by Holland and Gottfried(1955). All but sample 6500 are from cut gemstones upto about r/z cm in diameter, generally free of fractures andinclusions. Sample 6500 is an uncut pebble about l7z cmin diameter. It appears black in hand specimen, but red-dish-brown when thin. The history of most of our sam-ples prior to the time we acquired them is not known.Thus some of them may have been heated in an open

76 WOODHEAD ET AL.: METAMICTZATION OFZIRCON
TABLE 1. Properties of Sri Lanka gem zircon samples
Unit-cellv(A")
a c(A) (A)(ppm) (ppm)
U-(ppm)
Probe analyses lsotope dilution analyses
Htlzlratio
550 Maa-dosex 1 0 ' 5
eUColor (ppm)
Zit@nsample
2916A291682916CztN-11 06531 A3-23-123-1 13-43-353323-114265001-212-41-301-24
strawvery pale strawdark strawstrawsrrawdark strawyellowstraw yellowpale yellowpale yellowpale yellowgreen-yellowgreenvery dark brownyellow-greengreengreengreen
20 0.0420 0.0420 0.0460 0 .11
155 0.28630 1.1
1020 1 .81580 2.81600 2.91935 3.51940 3.52025 3.74660 8.46500 11.76725 12.1ND (12.s)
7220 13.08290 14.9
2.98(5)"
't37.7(sl
126.4(5)
ND
ND+6.612(1)
NDNDND
6.622(1)6.646(1 )6.667(2)6.655(4)6.700(2)6.722(216.694(e)amorphamorphamorphamorphamorphamorph
BALI 0.015BAL 0.016 17.8(1)"BAL 0.013BAL 0.016BAL 0.009BAL 0.014 581(2)BAL 0.020BAL 0.022
1800 + 860. 0.0352100 + 1000 0.011
ND ND 1751(3)2000 + 490 0.0223000 + 240 0.0357600 + 1700 0.059 5950(10)7900 + 1100 0.0456900 + 330 0.0446400 + 400 0.0376799 + 450 0.063
ND ND5.994(1) 262.05
ND NDND NDND ND
6.034(1) 264.606.061(2) 267.716.09s(s) 270.926.073(2) 268.976.121(1) 274.776.123(3) 276.676.141(10) 275.18amorph amorphamorph amorphamorph amorphamorph amorphamorph amorphamorph amorph
' Electron microprobe analyses annn is the range of analyses of difterent points resulting from zonation.'. lsotope dilution analysis; (n) denotes two standard deviations error of least unit cited.t BAL : below analysis limit-too low for accurate electron microprobe analysis.t ND : not determined.
fire, a common practice among zircon collectors in SriLanka. Sample 6500 did not undergo such heating.
Sri Lanka gem zircon samples are believed to be de-rived from late-stage pegmatites in the polymetamorphicHighland Group of metamorphic rocks (Munasinghe andDissanayake, l98l; Krdner et al., 1987). They are notfound in situ, but rather as rounded pebbles in streamdeposits. However, because they plot on the same chordon a Concordia diagram (Silver and Woodhead, unpub-lished data) and have similarly low Th/U ratios, theyappear to have related, if not identical, sources. We treatthem here as a single suite as did Holland and Gottfried( l 95s) .
RBsur,rs
The Sri Lanka zircon samples we studied have between20 and 8290 ppm eU (Table l). Based on the 550 Maage of the Sri Lanka suite (Gottfried et al., 1956), theircalculated total a-decay event dosage is between 0.05 and14.7 x l0'5 a-decay events per mg. Samples with eUbelow -2000 ppm are yellow or straw colored while thosewith greater eIJ are green or brown.
Some of the zircon samples exhibit oscillatory zoning(Sommerauer, 197 4; Sahama, I 98 I ; Chakoumakos et al.,1987), evident from varying low-order birefringence col-ors on appropriately cut thick sections of high-eU sam-ples (prepared for single-crystal transmission IR). Elec-tron microprobe analyses of zoned samples show thatlower birefringence correlates with higher U contents ineach case. For samples with 1600 ppm eU or more, elec-tron microprobe analyses supported the equivalent Ucontents determined by scintillation counter and indicat-ed that variability of 20o/o or more between zones is com-mon (Table l). Th contents of all samples are <1000
ppm, the effective detection limit of the electron micro-probe measurements, suggesting a Th/U weight ratio of<0.2 for the metamict samples. Hf/Zr atom ratios exhibita wide range from 0.009 to 0.063 and have a positivecorrelation with eU such that Hf/Zr :0.013 + 5 x l0-oeU and r'? : 0.83 (Fig. l). No other substituents werestatistically significant in the electron microprobe analy-ses. Isotope dilution analyses of four samples covering awide range of degree of metamictization yield U and Thcontents in close agreement with measured eU and Th/Uweight ratios in the -0.07-0.23 range.
X-ray powder diffraction patterns of a number of thesamples show a systematic increase in unit-cell parame-ters with U content up to just over 2000 ppm eU (Fig.2). X-ray diffraction maxima shifted to lower 2d values,and became broader and markedly skewed (Holland andGottfried, 1955; Murakami et al., 1986) in the partiallymetamict zircon samples. For those samples with greaterU contents the unit-cell parameters could not be deter-mined because they all do not give X-ray diffraction pat-terns and thus are metamict.
The IR spectmm of zircon is strongly affected by meta-mictization as can be seen in Figures 3 and 4 showing,respectively, powder absorption spectra between 1500 and250 cm-' and polarized single-crystal absorption spectrabetween 2000 and 1400 cm-', of three zircon sampleswith different U contents and different degrees of meta-mictization. Bands resulting from the fundamental vibra-tion modes of zircon (Hubin and Tarte, l97l) occur inthe region between 1000 and 300 cm-' in Figure 3. Thethree strong, sharp bands at 433,384, and 312 cm-' inthe crystalline zircon spectrum, representing external (lat-tice) vibration modes, are weakened by radiation damagein the partially metamict zircon spectrum and missing in

WOODHEAD ET AL.: METAMICTIZATION OF ZIRCON 77
a-DECAY EVENT DOSE/mg for 550 MA RCf (x tO-ls)0 5 1 0 1 5
SRI TANKA ZIRCON .
eU vs Hf/Zr Rotio
. - - { '
2000 4000 6000
EQUIVALENT URANIUM (eU in ppm)Fig. |. HflZr atom ratio for Sri Lanka gem zircon samples,
measured by electron microprobe, as a function of equivalent U(eU) measured by scintillation counter. Calculated total a-decayevent dosage based on a 550 Ma age for Sri Lanka gem zirconsamples is shown across the top. The linear regression best fit tothe data is shown; Hf/Zr :0.013 + 5 x l0-r eU, r, : 0.83.
that of the totally metamict sample. The bands at 973and 892 cm-r representing internal stretching modes ofthe [SiOo]a- anion (Dawson et al., l97l; Adams,1973),and at 611 cm r, an internal bending mode of the [SiO.]"anion, are progressively broadened and weakened withmetamictization (Deliens et aI., 1977).
Plots ofthe behavior of some ofthe fundamental-modebands as functions of eU and calculated total a-decayevent dosage are shown in Figure 5. The intensities ofthe external-mode bands at -384 and -312 cm ' de-crease dramatically with equivalent U up to 2000 ppmeU and are negligible beyond that point (Fig. 5 top). Thedisappearance of the external-mode bands coincides withthe eU content beyond which the samples exhibit no X-raydiffraction patterns and is thus another indicator oftotal
a-DECAY EVENT DOSE/mg for 550 MA AGE (x 1O-ts)
c
ac
oo
0A 1 q L
t 0 1 5
6 . 1 0
A n q
c-ox tso
o 6 SRI LANKA ZIRCONo unit cel l porometers
. ao-oxrs |}
. la
X-roy omorphous somples
WAVELENGTH (irr)10 12 15 20
1 . 0
0 . 8
u . o
o.4
o.2
1 500 1250 1000 750 500
WAVENUMBTR (cm-1)250
Fig. 3. IR powder spectra in the range 1500-250 cm-' ofthree Sri Lanka gem zircon samples given in units ofabsorbanceper mg as a function of wavenumber; cryst : Sri I-anka gemzircon29l6C, nonmetamict, 20 ppm eU. Absorption bands rep-resenting internal [Sioo]o- stretching modes are at 973 and 892cm '. Those for internal [Sioo]n- bending modes are at 6l I and454 cm-l. The band at 433 cm-t represents external rotationalvibration of the essentially rigid [SiOo]o tetrahedron; those at384 and 312 crn-t represent external translational vibrations; int: Sri Lanka gem zircon 3-l l, partially metamict, 1580 ppm eU.Note the general loss of intensity of all IR absorption bandsresulting from radiation damage; met : Sri Lanka zircon 6500,metamict, 6500 ppm eU. Bands representing external modes arenearly absent. Those ofinternal vibration modes have weakenedand broadened.
metamictization. The intensities of the internal-modeband at -892 cm-' are more scattered but decrease witheU up to 2000 ppm (Fig. 5 bottom). Beyond that valuethey remain easily detectable at l0-20o/o of their inten-sities in the least radiation-damaged samples.
According to Dawson et al. (1971), the bands in the2000 to 1400 cm-' region shown in Figure 4 result fromtwo-phonon combination modes involving stretching andbending modes of the [SiO4]4- anion. They become weak-er and broader with metamictization while the relativelytransparent window at 1650-1700 cm-' becomes moreopaque, corroborating the work of Wasilewski et al.(1973), who showed that absorption at 1666 cm-r in-creases with degree of metamictization.
A more striking effect of metamictization is the de-struction of anisotropy. In crystalline zircon, absorption
30o.o7
0.06o< 0.0sE.
> 0.04F< 0.03L
NI
\ 0.02I
0.01
0.00
trt-c)
l!
z-couam
E
v . . w co
o . t v @
o.os Pc
6.60 i5
no pottdrn
EQUIVALENT UMNIUM (eU in ppm)
Fig. 2. Unit-cell parameters measured by powder X-ray dif-fraction as a function of eU and a-decay event dosage. Onlysamples with less than approximately 2500 ppm eU yielded dif-fraction patterns; those with more did not diffract X-radiation.
SRI LANKAZIRCON
973

78 WOODHEAD ET AL.: METAMICTIZATION OF ZRCON
WAVELENGTH (pm)6
200
150
100
02000 1 7 Q O 1 400
WAVENUMBER (cm-1)
Fig. 4. Polarized single-crystal IR absorption spectra ofthreeSri Lanka gem zircon samples cut parallel to the c-axis in therange 2000-1400 cm ' given as absorbance per cm as a functionof wavenumber. The solid line shows the spectrum for whichE // c;tlrle dashed line shows the spectrum for which E l- c;cryst : Sri Lanka gem zircon29l6C, nonmetamict, 20 ppm eU.The strong, sharp bands result from combination modes involv-ing internal stretching and bending modes of the [SiO.]o- tetra-hedron. The IR absorption pattern is markedly anisotropic. Ab-sorption at - 1780 cm I for E I c is very low compared to thatfor the spectrum with E // c at - 1780 cm r. Absorption in the1650-1700 cm-' range is low for both polarization conditions;int : Sri Ianka gem zircon 3-35, partially metamict, 1935 ppmeU. The IR bands are broader and less anisotropic, resulting inan increase in absorption at 1650-1700 cm r; met : Sri Lankazircon 6500, metamict, 6500 ppm eU. The IR absorption pat-tern is essentially isotropic; absorption at 1650-1700 cm-r ishich.
at -1780 cm-r is much weaker when the electric vectoris oriented perpendicular to the c-axis than when parallel
to it. The absorption ratio between the two polarization
directions is a function of eU for partially metamict zir-con samples up to approximately 2500 ppm eu (Fig. 6).It is 1.0 beyond that point, indicating that the metamictsamples are all isotropic with respect to IR radiation.
Figure 7 shows polarized single-crystal absorptionspectra between 4000 and 2000 cm ' for the same threezircon samples as in Figure 4. The weak band at -2740
a-DECAY EVENT DOSE/mg for 550 MA AGE (x 1O-ls)0 5 1 0 1 5
SRI LANKA ZIRCON
Externol Modes
O-384 cm-lo-312 cm-1
8ot
l -892 cm-lln ternol Mode
r a t
/ l AA
AA
A A
4000 6000 8000
EQUIVALENT URANIUM (eU in PPm)
Fig. 5. IR absorption band intensities, given as absorbanceper mg, as functions ofeU and a-decay event dosage. (top) In-tensity of external [SiOo] translation mode bands at -384 and-312 cm '. Band intensity decreases with increasing {J contentup to approximately 2500 ppm eU and is negligible above thatvalue. (bottom) Intensity of internal [SiO"]4- stretching-mode bandat -892 cm '. Band intensity decreases with increasing U con-tent up to approximately 2500 ppm eU but does not decreaseto zero at higher eU levels.
cm ' in the spectrum for which E // c of Ihe crystallinezircon represents a three-phonon combination mode(Dawson et al., l97l). Those at -3095 and -3185 cm '
in the spectrum for which E I c apparently also resultfrom three-phonon combination modes. The strength ofthe band at -2740 cm-r in the orientation for whichE // c decreases with eU for partially metamict zirconand is zero for totally metamict grains as shown in Fig-ure 8.
The broad isotropic band at about 3500 cm-' in themetamict zircon (Fig. 7) indicates the presence of a hy-drous species, either OH or HrO, and results from theO-H stretching mode. Although O-H stretching bands areusually broader for HrO than OH in minerals, often ap-pearing much like the band in the metamict zircon spec-trum, the only certain way to distinguish HrO from OHis by the presence of the H-O-H bending-mode band atabout 1600 cm-' or the combination mode involving HrOat approximately 5200 cm 1. The molar absorption coef-ficients of the IR bands of HrO or OH are not known in
0.7
P o.otrL
o r l qcL -'-
E o.ozf; o.JE
8 o.2m
E- 0.1
olE!(,o_
tllozmEo(nm
E.
EO
oo_
LdOz.couam
t
1 . O
0.8
0.6
o.4
o.2
0.0
SRI LANKA ZIRCON
single crystol spectro
r iv\,/ cryst
- - - - - - - - )

WOODHEAD ET AL.: METAMICTIZATION OF ZIRCON 79
a-DECAY EVENT DOSE/mg for 550 MA AGE (x 1O-1s)0 5 1 0 1 5
o.02000 4000 6000 8000
EQUIVALENT URANIUM (eU in ppm)
Fig. 6. IR absorbance ratio (E I c) /@ // c) at -1780 cm-'as a function ofeU and a-decay event dosage. The ratio tncreaseswith U content up to approximately 2500 ppm eU, beyond whichvalue the samples are no longer anisotropic.
either crystalline or metamict zircon but those of the HrObands are probably within the range of those determinedfor liquid HrO and silicate glasses (Rossman, 1988; New-man et al., 1986). The bending-mode band at -1600cm I can be expected to be approximately 2-4 timesweaker than the stretching-mode band, and the combi-nation mode band at -5200 cm-r can be expected to beapproximately 30-70 times weaker. Thus if the hydrousspecies in the metamict sample 6500 shown in Figure 7were entirely HrO the strength of HrO bands at -1600and -5200 cm-' would be at least 1.5 and 0. I absorbanceunits per cm, respectively.
There is no indication of the fundamental H-O-Hbending-mode band in any of the hydrous samples, in-dicating that the hydrous species present is predomi-nantly OH rather than HrO. As can be seen in Figure 4,however, zircon is rather opaque at 1600 cm-' and its IRspectrum varies strongly with degree of metamictization.Thus it is possible that in metamict zircon HrO mightnot be unambiguously distinguishable from OH at verylow HrO concentrations.
The zircon spectrum is rather flat around 5000 cm-'.In that region the band detection limit is approximately0.02 absorbance units per cm on our spectrometer. AnHrO content that produced a stretching-mode band of 7absorbance units per cm (as in sample 6500 shown inFig. 7) would be easily detectable. There is no indicationof the combination mode band at about 5200 cm-' inany spectrum. The absence in the same spectmm of bothHrO bands indicates that at least 800/o of the hydrouscomponent in the Sri Lanka gem zircon samples is OH.
The calibration relating IR absorption intensity in theOH region to OH content in zircon is not established.The amount of OH can be estimated, however, from pub-lished IR molar absorptivity data for the broad OH-stretching band in glass (Newman et al., 1986) and HrO
aa
a
SRI LANKA ZIRCON-178oL/-178o//
a
WAVELENGTH (prn)
3 4
04000 3500 3000 2500 2000
WAVENUMBTR (cm-1 )
Fig. 7. Polarized single-crystal IR absorption spectra ofthreeSri Lanka gem zircons cut parallel to the c-axis in the range4000-2000 cm ' given in units ofabsorbance per cm as a func-tion of wavenumber. The solid line shows the spectnrm for whichE // c;the dashed line shows the spectrum for which E I c;cryst: Sri Ianka gem zircon29l6C, nonmetamict, 20 ppm eU.The IR absorption pattern is anisotropic. The bands at -2740cm-r. E // c.and at -3095 and -3185 cm-r, E l- c, are three-phonon combination modes of [SiOo]a- internal vibrations. Thesample is free of OH or HrO as indicated by the absence of aband in the O-H stretching region around 3500 cm-'; int : SriLanka gem zircon 3-35, partially metamict, 1935 ppm eU. Theband at -2740 cm ' is too weak to be seen at this scale, but thesample is not isotropic. There is no OH or HrO present; met :Sri Lanka zircon 6500, metamict, 6500 ppm eU. The IR ab-sorption pattem is essentially isotropic. The strong band at -3500cm-r represents the O-H stretching mode and results from thepresence of OH in the sample.
(Thompson, 1965). Using a simple Beer's law calculation,the hydrous component in our zircon with the strongestO-H stretching bands, sample 6500, is on the order of0.02-0.04 wto/o (expressed as HrO).
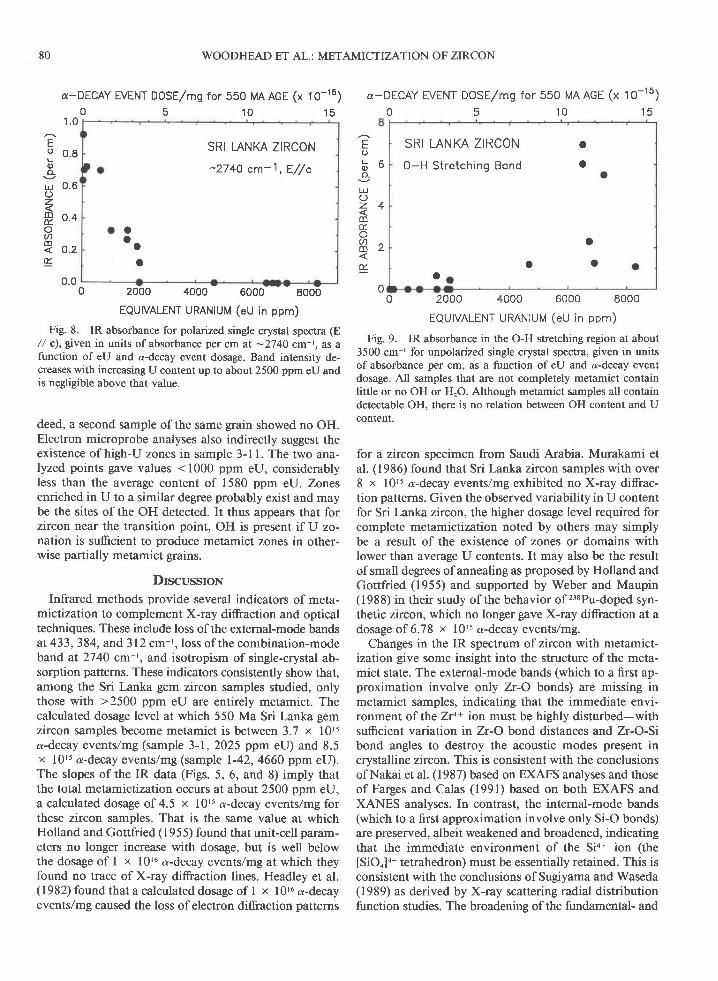
The OH content of the Sri Lanka gem zircon samplesis related to metamictization in an interesting way. Near-ly all the samples with eU below 2500 ppm contain noOH or HrO (Fig. 9), while all those with higher U con-tents contain OH. There is no correlation between OHcontent and U (or Hf) content in the metamict grains,however. The two zircon samples with <2500 ppm eUthat contain detectable OH are both zoned. Electron mi-croprobe analyses of sample 3-1, with an eU content justbelow the amount sufficient to cause total metamictiza-tion, indicate considerable variability in U content andsuggest that the OH detected may be predominantly inmetamict zones or at the boundary between zones. In-
1 . 0
o n n
E
I o.ozmE o'4am
E v ' 2
tro l 3Loo_
LrJ
2rocot(nm
u.
SRI LANKA Z IRCON
O-H region
2740
3185 , r - 3995^ _ , - - t
- \ - - - - _ - - l
80 WOODHEAD ET AL.: METAMICTIZATION OF ZIRCON
a-DECAY EVENT DOSE/mg for 550 MA AGE (x 1O-ls)0 5 1 0 1 5
SRI LANKA ZIRCON-2740 cm-1, E//c
aa o
a
0 2000 4000 6000 6000
EQUIVALENT URANIUM (eU in ppm)
Fig. 8. IR absorbance for polarized single crystal spectra (E// c), gsven in units ofabsorbance per cm at -2740 cm-t, as afunction of eU and a-decay event dosage. Band intensity de-creases with increasing U content up to about 2500 ppm eU andis negligible above that value.
deed, a second sample of the same grain showed no OH.Electron microprobe analyses also indirectly srrggest theexistence of high-U zones in sample 3- I I . The two ana-lyzed points gave values <1000 ppm eIJ, considerablyless than the average content of 1580 ppm eU. Zonesenriched in U to a similar degree probably exist and maybe the sites of the OH detected. It thus appears that forzircon near the transition point, OH is present if U zo-nation is sufficient to produce metamict zones in other-wise partially metamict grains.
DrscussroN
Infrared methods provide several indicators of meta-mictization to complement X-ray diffraction and opticaltechniques. These include loss of the external-mode bandsat433,384, and 3l2cm-t,loss of the combination-modeband at 2740 cm-t, and isotropism of single-crystal ab-sorption patterns. These indicators consistently show that,among the Sri Lanka gem zircon samples studied, onlythose with >2500 ppm eU are entirely metamict. Thecalculated dosage level at which 550 Ma Sri Lanka gemzircon samples become metamict is between 3.7 x l0t5a-decay events/mg (sample 3-1,2025 ppm eU) and 8.5x l0'5 a-decay events/mg (sample l-42, 4660 ppm eU).The slopes of the IR data (Figs. 5, 6, and 8) imply thatthe total metamictization occurs at about 2500 ppm eU,a calculated dosage of 4.5 x l0'5 a-decay events/mg forthese zircon samples. That is the same value at whichHolland and Gottfried (1955) found that unit-cell param-eters no longer increase with dosage, but is well belowthe dosage of I x 10'6 a-decay events/mg at which theyfound no trace of X-ray diffraction lines. Headley et al.(1982) found that a calculated dosage of I x 10'6 a-decayevents/mg caused the loss ofelectron diffraction patterns
a-DECAY EVENT DOSE/mg for 550 MA AGE (x 1O-ls)n q t n 1 E
SRI LANKA ZIRCON
O-H Stretching Bond
a
a
a
aaa a
o 2000 4000 6000 8000
EQUIVALENT URANIUM (eU in ppm)
Fig. 9. IR absorbance in the O-H stretching region at about3500 cm ' for unpolarized single crystal spectra, given in unitsof absorbance per cm, as a function of eU and a-decay eventdosage. All samples that are not completely metamict containlittle or no OH or HrO. Although metamict samples all containdetectable OH, there is no relation between OH content and Ucontent.
for a zircon specimen from Saudi Arabia. Murakami etal. (1986) found that Sri Lanka zircon samples with over8 x l0'' a-decay events/mg exhibited no X-ray diffrac-tion patterns. Given the observed variability in IJ contentfor Sri Lanka zircon, the higher dosage level required forcomplete metamictization noted by others may simplybe a result of the existence of zones or domains withlower than average U contents. It may also be the resultof small degrees of annealing as proposed by Holland andGottfried (1955) and supported by Weber and Maupin(1988) in their study ofthe behavior of238Pu-doped syn-thetic zircon, which no longer gave X-ray difraction at adosage of 6.78 x l0r5 a-decay events/mg.
Changes in the IR spectmm of zircon with metamict-ization give some insight into the structure of the meta-mict state. The external-mode bands (which to a first ap-proximation involve only Zr-O bonds) are missing inmetamict samples, indicating that the immediate envi-ronment of the Zt'+ ion must be highly disturbed-withsufficient variation in Zr-O bond distances and Zr-O-Sibond angles to destroy the acoustic modes present incrystalline zircon. This is consistent with the conclusionsof Nakai et al. (1987) based on EXAFS analyses and thoseof Farges and Calas (1991) based on both EXAFS andXANES analyses. In contrast, the internal-mode bands(which to a first approximation involve only Si-O bonds)are preserved, albeit weakened and broadened, indicatingthat the immediate environment of the Sio* ion (the
[SiO4]4 tetrahedron) must be essentially retained. This isconsistent with the conclusions of Sugiyama and Waseda(1989) as derived by X-ray scattering radial distributionfunction studies. The broadening of the fundamental- and
1 . 0
oL A
trJoz 4mv.
m z
E.
0
Eo 0 .6oo_rr-r 0.6z
P 0.4a
P o.zM
0.0

WOODHEAD ET AL.: METAMICTIZATION OF ZIRCON 8 l
combination-mode bands involving internal [SiOo]o vi-brations indicates that the D' symmetry of the [SiO4]4tetrahedron is lost and that the average local environmentof the silica tetrahedron becomes progressively less or-dered up to the occurrence of total metamictization; thisprobably results from rotation and tilting of the [Sioo]otetrahedron in response to displacements of Zr. This isconsistent with the data of Farges and Calas (1991). Theintensities of the internal-mode bands are approximatelyconstant (Fig. 5 bottom) beyond that point, however, sug-gesting that the local environments do not continue tochange dramatically with higher dosage rates in samplesthat are already metamict.
For the most part, OH is present only in metamict ornearly metamict samples. Within this group of samplesthere is no obvious relationship between OH content andeU, suggesting that Sri Lanka gem zircon samples initiallycrystallized without OH, and OH was incorporated onlyafter radiation damage passed some threshold level-ap-parently the point of total metamictization for most grains.Because the amount of OH incorporated in our zirconsamples does not con:elate with U content, it is likely thatfactors such as .f"ro, temperature, and the period of timesubsequent to metamictization were important factors inincorporation of OH. Zircon with higher eU contents be-comes metamict faster and thus may interact with fluidsfor longer times subsequent to metamictization. For ex-ample, zircon 1-24, with 8290 ppm eU, must have be-come metamict at about 400 Ma; whereas zircon l-42,with 4660 ppm eU, did not become metamict until about250 Ma, thus raising the possibility that their interactionwith HrO in the geological environment has been differ-ent.
Our data show that zircon with no OH spans virtuallythe entire range from crystalline to metamict; OH cannotbe necessary to the metamictization process, as conclud-ed by Caruba et al. (1985). In short, HrO and OH are notimportant participants in the metamictization process butmay be merely fortuitous fellow travelers. They may stillhave an important role in postmetamictization stability,but that role needs to be further evaluated in light ofourresults.
CoNcr-usroNs
IR spectra of zircon depend strongly on the degree ofmetamictization. Radiation damage causes the intensityof both fundamental- and combination-mode bands todecrease drastically. The ultimate result is the loss of thebands representing vibration modes involving Zr-Obonds. Consequently, the structure of metamict zirconmust consist of distorted and disoriented, isolated silicatetrahedra with few if any undisplaced Zr cations.
IR indicators of metamictization (approach to isotropyand the loss of external vibration-mode bands) and X-raydiffraction results both yield a total dosage ofabout 4.5x l0'5 a-decay events/mg as being necessary for com-plete metamictization. Samples with greater accumulated
dosages do not yield X-ray diffraction patterns and areisotropic to both visible and infrared radiation. Variabil-ity in U content or subsequent annealing may yield par-tially metamict domains in otherwise metamict samples.
The only hydrous species detectable in the Sri Lankagem zircon samples studied is OH. The absence of OHin most samples that are less than fully metamict indi-cates that OH is not at all necessary to the metamictiza-tion process. The OH appears to be absorbed by zirconthat initially has no OH only after radiation damage hasaltered its structure sufficiently-apparently somethingthat occurs only when zircon is metamict or nearly so.The effect of hydrous species on the ultimate stability ofthe metamict state is not known.
AcrNowr.nocMENTS
This research was funded in part by National Science Foundation grantsEAR-7919987, 8618200, and 8916064. We thank David Gottfried, Hein-rich Holland, and Frank Senftle flJSGS,, Reston, Virginia) for samplesincluded in this work. We thank Rodney Ewing, Frangois Farges, andJohn Hughes for their helpful comments on the manuscript. This studyis Caltech contribution no. 4606.
RnrnnnNcns crtnnAdams, D.M. (1973) A descriptive introduction to analysis of the vibra-
tional spectra of solids. Coordination Chemistry Reviews, 10, 183-r93.
Aines, R.D., and Rossman, G.R. (1985) The high temperalure behaviorof trace hydrous components in silicate minerals. American Mineral-ogist,70, 1169-1179.
-(1986) Relationships between radiation damage and trace vr'ater inzircon, quartz, and topaz. American Mineralogist, 71, l186-1193.
Bursill, L.A., and Maclaren, A.C. (1966) Transmission electron micro-scope study of natural radiation damage in zircon (ZrSiOo). Physicasratus solidi. 13. 331-343.
Caruba, R., Baumer, A., Ganteaume, M., and Iacconi, P. (19E5) An ex-perimental study ofhydroxyl groups and water in synthetic and naturalzircons: A model of the metamict state. American Mineralogist, 70,1224-1231.
Chakoumakos, 8.C., Murakami, T., Lumpkin, G.R., and Ewing, R.C.(1987) Alpha-decay-induced fracturing in zircon: The transition fromthe crystalline to the metamict state. Science, 236, 1493, 1497, 1556-I ) )v-
Dawson, P., Hargreave, M.M., and Wilkinson, G.R. (1971) The vibra-tional spectrum of zircon (ZrSiO.). Journal of Physics C: Solid StatePhysics, 4, 240-256.
Deliens, M., Delhal, J., and Tarte, P. (1977) Metamictization and U-Pbsystematics-A study by infrared absorption spectrometry ofPrecarn-brian zircons. Earth and Planetary Science Irtters, 33,331-344.
Drake, M.J., and Weill, D.F. (1972') New rare earth element standardsfor electron microprobe analysis. Chemical Geology, 10, 179-181.
Farges, F., and Calas, G. (1991) Structural analysis of radiation damagein zircon and thorite: An X-ray absorption spectroscopic study. Amer-ican Mineralogist, 7 6, 60-7 3.
Frondel, C., and Collette, R.L. (1957) Hydrothermal synthesis ofzircon,thorite and huttonite. American Mineralogist, 42, 7 59 -7 65.
Gottfried, D., Senftle, F.E., and Waring, C.L. (1956) Age determinationofzircon crystals from Ceylon. American Mineralogist, 41,157-161.
Headley, T.J., Ewing, R.C., and Haaker, R.F. (1982) TEM study of themetamict stare. Physics of Minerals and Ore Microscopy, Proceedingsofthe l3th general meeting ofthe International Mineralogical Associ-ation at Varna, lulgaria, Septemb€r 19-25,281-289.
Holland, H.D., and Gottfried, D. (1955) The effect of nuclear radiationon the structure ofzircon. Acta Crystallographica, 8, 291-300.
Hubin, R., and Tarte, P. (1971) Etude infrarouge des orthosilicetes et des

82 WOODHEAD ET AL.: METAMICTIZATION OF ZIRCON
orthogermanates-IV. Structures scheellite et zircon. SpectrochimicaActa, 27 A,683-690.
Krdner, A., Williams, I.S., Compston, W., Baur, N., Vitanage, P.W., andPerrera, L.R.IC (1987) Zircon ion microprobe dating ofhigh-gra.de rocksin Sri Ianka. Joumal ofGeology,95,775-791.
Lumpkin, G.R., and Chakoumakos, B C. (19E8) Chemistry and radiationeffects of thorite-group minerals from the Harding pegmatite, TaosCounty, New Mexico. American Mineralogist, 73, 1405-1419.
Munasinghe, T., and Dissanayake, C.B. (1981) The origin ofgem stonesofSri Ianka. Economic Geology, 76,1216-1225.
Murakami, T., Chakoumakos, B.C., and Ewing, R.C. (1986) X-ray pow-der diffraction analysis of alpha-event radiation damage in zircon(ZrSiO4). In D.E. Clark, W.B. White, and J. Machiels, Eds., Advancesin ceramics, nuclear lvaste management ll, p.745-753. American Ce-ramic Society, Columbus, Ohio.
Nakai, I., Akimoto, J., Imafuku, M., Miyawaki, R., Sugitani, Y., andKoto, K. (1987) Characterization of the amorphous state in metamictsilieates and niobates by EXAFS and XANES analyses. Physics andChemistry of Minerals, 15, ll3-124.
Neuerburg, G.J. (1954) Allanite pegmatite, San Gabriel Mountains, LosAngeles County, Califomia. American Mineralogist, 39, 831-834.
Newman, S., Stolper, E.M., and Epstein, S. (1986) Measurement of waterin rhyolitic glasses: Calibration ofan infrared spectroscopic technique.American Mineralogist, 7 l, 1527 -1541.
Pavlovic, S., and Krstanovic, I. (1965) Sur les possibilites de determina-tion d'age absolu d'aprds les mesures cristallographiques du zircon.Colloque International de G6ochronologie Absolue. Nancy, 3-8 Mai1965. Sciences de la Terre, 10, 285-290.
Pellas, P. (1965) Etude sur la recristallisation thermique des zircons m6-tamictes. M6moires du Museum National d'Histoire Naturelle, S6rieC, Sciences de la Terre, 12,227-253.
Pidgeon, R.T., O'Neill, J., and Silver, L.T. (1966) Uranium and leadisotopic stability in a metamict zircon under experimental hydrother-mal conditions. Science, 154, 1538-1540.
-(1973) Observations on the crystallinity and the U-Pb isotopicsystem ofa metamict Ceylon zircon under experimental hydrothermalconditions. Fortschritte der Mineralogie, 50, I 18.
Robinson, K., Gibbs, G.V., and Ribbe, P.H. (1971) The structure of zir-con: A comparison with garnet. American Mineralogist, 56, 782-790.
Rossman, G.R. (l 988) Vibrational spectroscopy of hydrous components.In Mineralogical Society of America Reviews in Mineralogy, 18, 193-206.
Sahama, T. (1981) Growth structure in Ceylon zircon. Bulletin de Mi-n6ralogie, 104,89-94.
Silver, L.T. (1964) The relation between radioactivity and discordance inzircons. Nuclear Geophysics, National Academy of Sciences-NationalResearch Council Publication 1075, 34-39.
Silver, L.T., and Deutsch, S. (1963) Uranium-lead isotopic variations inzircons: A case study. Joumal of Geology, 7 l, 721-758.
Silver, L.T., McKinney, C.R., D6utsch, S., and Bollinger, J. (1963) Pre-cambrian determinations in the western San Gabriel Mountains, Cal-ifornia. Journal ofGeology, 71, 196-214.
Somrnerauer, J. (197 4) Trace element distribution pattems and the min-eralogical stability of zircon-An application for combined electronmicroprobe techniques. Electron Microscopy Society of Southern Af-rica, Proceedings, 4, 7 l-72.
- (I97 6) Die chemisch-physikalische Stabilitiit natiirlicher Zrkoneund ihr U-(Th)-Pb System. Ph.D. dissertation. Eidgendssischen Techn-ische Hochschule, Ziirich.
Sugiyama, K., and Waseda, Y. (1989) Structural study of the metamictstates by X-ray diffraction: In the case ofnaegite. Mineralogical Jour-nal. 14. 303-309.
Thompson, W.K (1965) Infrared spectroscopic studies ofaqueous sys-tems, I. Transactions ofthe Faraday Society,6l, 1635-1640.
Tilton, G.R., Davis, G.L., Wetherill, G.W., and Aldrich, T.L. (1957) Iso-topic ages frorn granites and pegmatites. American Geophysical UnionTransactions. 38. 360-37 l
Vance, E.R. (1975) Alpha recoil damage in zircon. Radiation Effects, 24,l - o -
Wasilewski, P.J., Senftle, F.E., and Yaz, J.E. (1973) A study of the naturala-recoil damage in zircon by infrared spectra. Radiation Effects, 17,19l- t99.
Weber, W.J., and Maupin, G.D. (1988) Simulation of radiation damagein zircon. Nuclear Instruments and Methods in Physics Research,B32,5 1 2 - 5 r 5 .
Yada, K., Tanji, T., and Sunagawa, I. (1981) Application of lattice im-agery to radiation damage investigation in natural zircon. Physics andChemistry of Minerals, 7,47-52.
- (1987) Radiation induced lattice defects in natural zircon (ZrSiO.)observed at atomic resolution. Phvsics and Chemistrv of Min€rals. 14.r97-204.
MnNuscnrrr RECETvED Mnv 21, 1990MeNuscnrsr AccEprED Nowlrsen 14, 1990